Molecular characterization of cell types in the squid Loligo vulgaris
- Department of Biology, Institute of Zoology, University of Fribourg, Switzerland
- Interfaculty Bioinformatics Unit and Swiss Institute of Bioinformatics, University of Bern, Switzerland
- Institute of Genetics, University of Bern, Switzerland
Figures
Figure 1 with 2 supplements
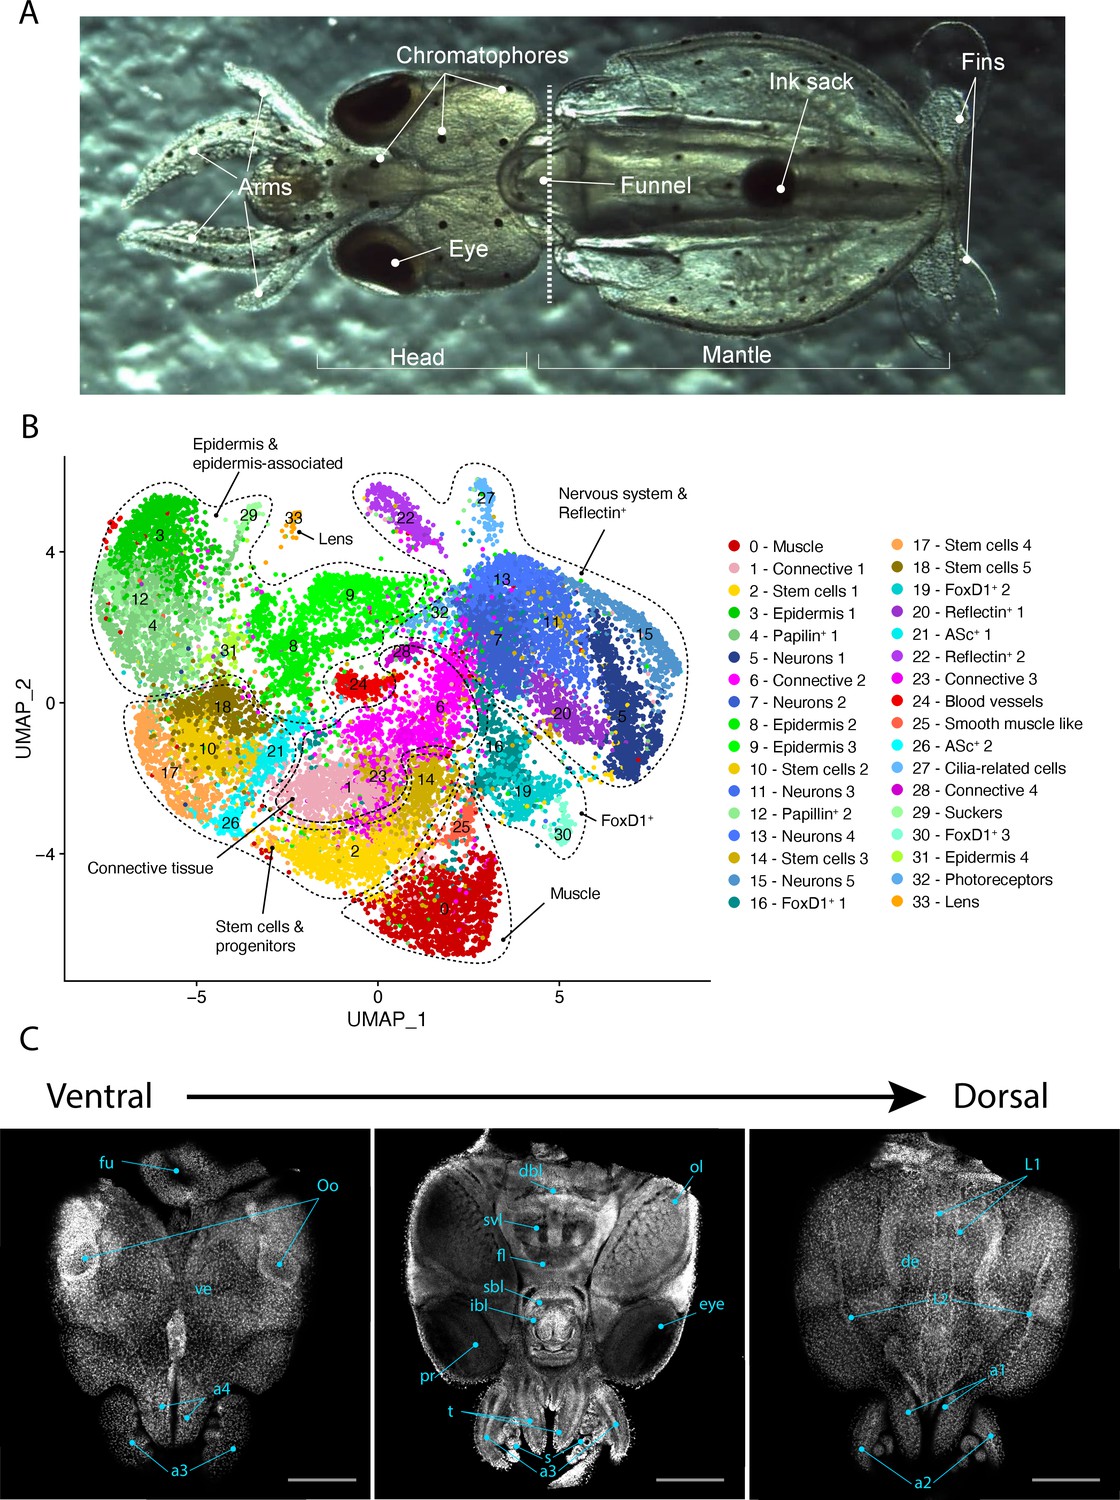
Single-cell transcriptome of the L. vulgaris head.
(A) Ventral view of a recently hatched L. vulgaris with relevant external anatomical structures labeled. The dotted line represents the plane of amputation. The region anterior to this line is what was used in this study and is referred to as the head region. (B) Two-dimensional UMAP representing the 34 cell clusters and their cell type characterization based on marker gene expression. These defined cell type categories include muscle, connective tissue, stem cells, epidermis, papilin+ cells, neurons, foxD1+ cells, reflectin+ cells, ASc+ cells, cilia-related cells, photoreceptors, sucker, and lens. (C) Successive confocal micrographs of the ventral–dorsal view of L. vulgaris hatchling heads stained with DAPI (nuclei). The entire ventral–dorsal surface of the head of L. vulgaris is labeled with relevant anatomical structures: (a) labels a1–4 = arms 1–4, (bl) brachial lobe, (dbl) dorsal basal lobe, (de) dorsal epidermis, (fl) frontal lobe, (fu) funnel, (ibl) inferior buccal lobe, (L1 ,L2) epidermal lines, (Oo) olfactory organ, (ol) optic lobe, (pr) proximal segment of retinas, (s) suckers, (sbl) superior buccal lobe, (svl) subvertical lobe, (t) tentacles, and (ve) ventral epidermis. Scale bars = 500 μM.
Figure 1—figure supplement 1
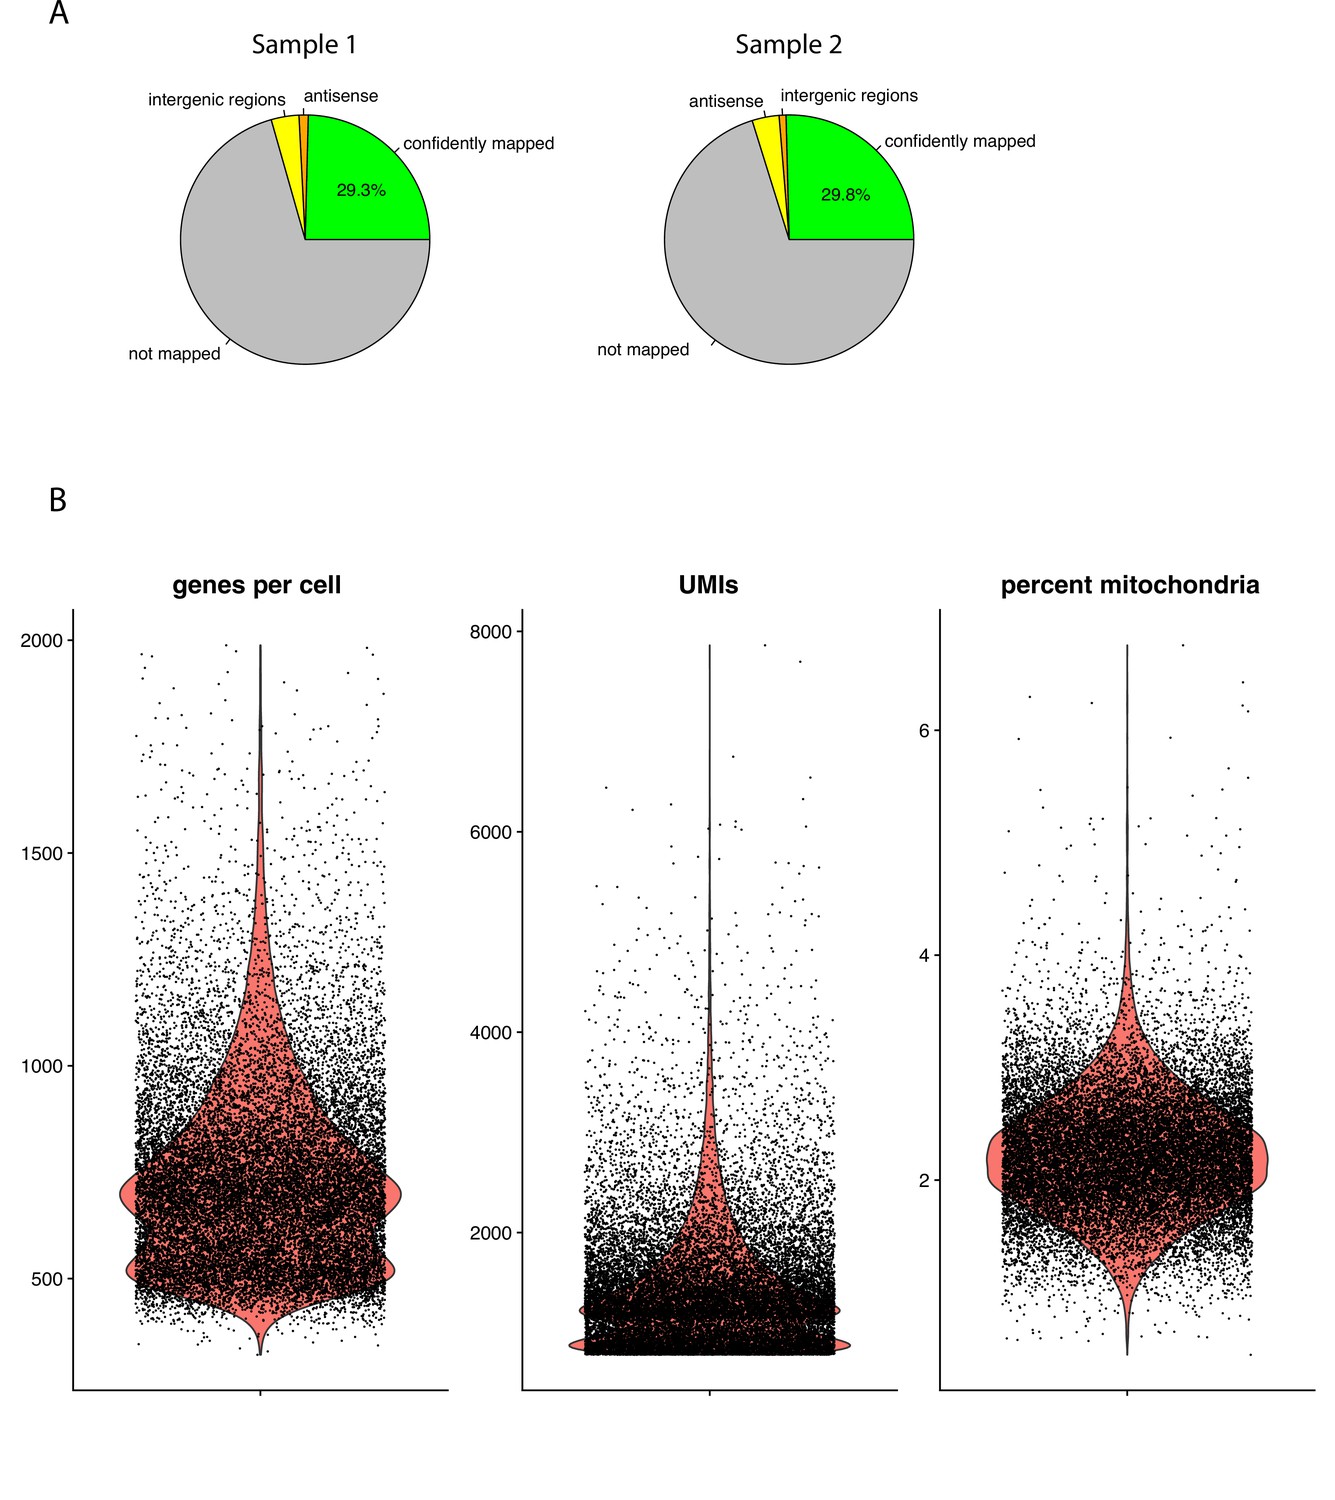
Quality controls.
(A) Pie plots showing the mapping rates of the single-cell reads to the reference transcriptome for each of the two samples. (B) Violin plots showing the distribution of genes-per-cell (left), UMIs (middle), and the percentage of mitochondrial genes per cell (right).
Figure 1—figure supplement 2
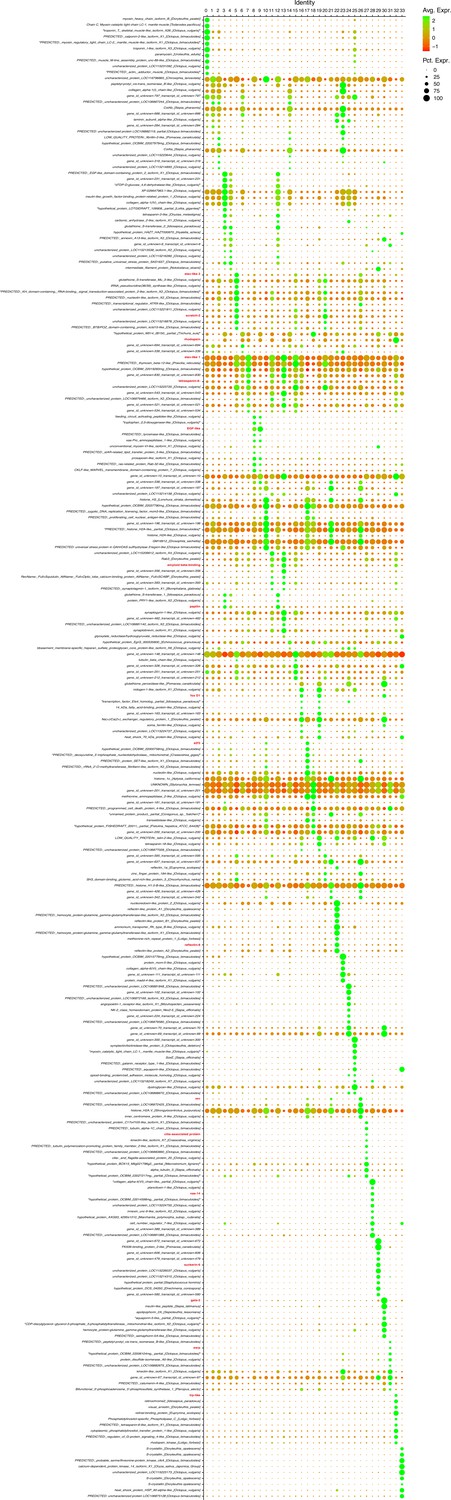
Marker genes.
Dot plot showing the 10 genes that are most differentially expressed in each cluster. The genes later tested with hybridization chain reaction in situ chain reaction (HCR ISH) experiments are written in red. Note that the genes that are markers of more than one cluster are shown only once on the plot.
Figure 2 with 8 supplements
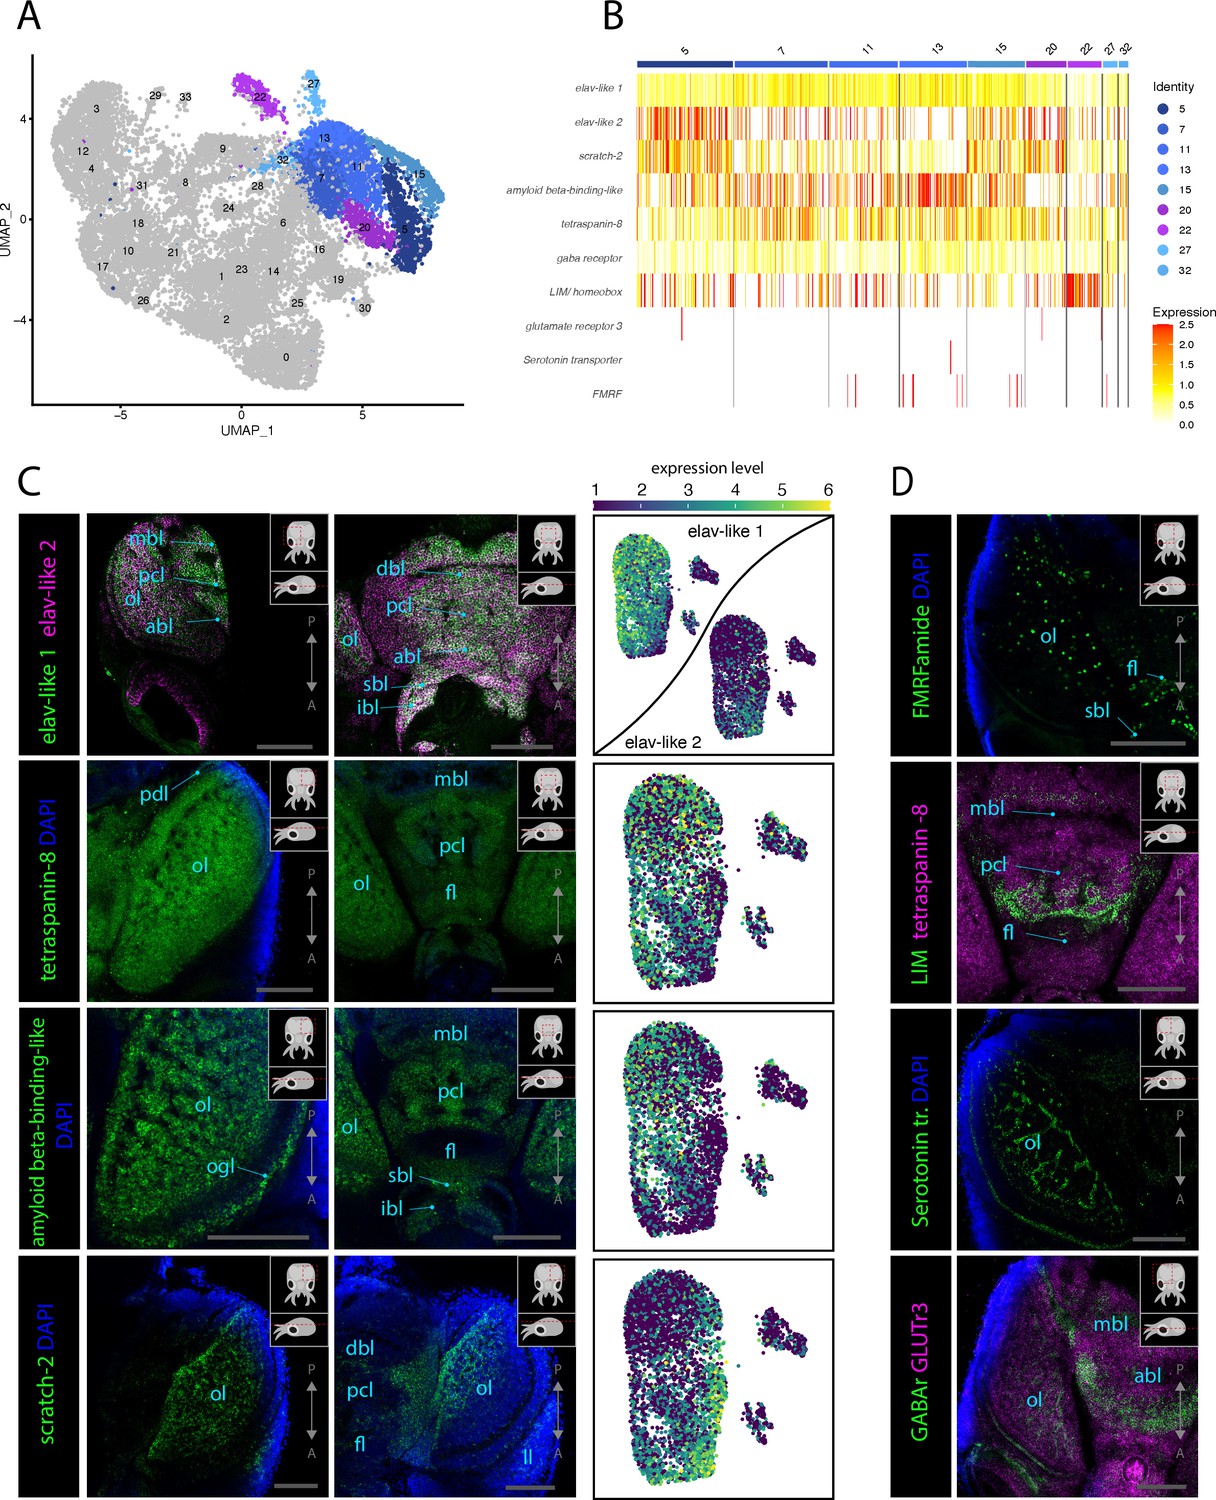
Molecular mapping of the L. vulgaris nervous system.
(A) UMAP with clustered identified as neuronal or neuron-related highlighted. (B) Heatmap showing the expression of neuronal genes across each cell of the dataset. Cells are grouped by clusters. (C) Confocal micrographs showing mRNA expression detected by hybridization chain reaction (HCR) for broad neuronal markers identified in the scRNAseq data. The right-hand pictures are feature plots (UMAP) showing the expression of genes across the subclustered neuronal cells. Cartoons on the top right corner of each micrograph indicate the position of the image on a frontal view (top) and the plane of acquisition on sagittal view (bottom). Scale bars = 250 μM. (D) Confocal micrographs showing mRNA expression detected by HCR for additional neuronal markers; some of these markers were not differentially expressed in specific clusters. Note that DAPI staining in some cases has not penetrated the tissue, therefore explaining its absence from the optic lobes. Cartoons on the top-right corner of each picture indicate the position of the image on a frontal view (top) and the plane of acquisition on sagittal view (bottom). Scale bars = 250μM. (abl) anterior basal lobe, (dbl) dorsal basal lobe, (fl) frontal lobe, (ibl) inferior buccal lobe, (ll) lateral lip, (mbl) medial basal lobe, (ol) optic lobe, (Oo) olfactory organ, (ogl) outer granular layer, (pcl) precommissural lobe, (pdl) peduncle lobe, and (sbl) superior buccal lobe.
Figure 2—figure supplement 1
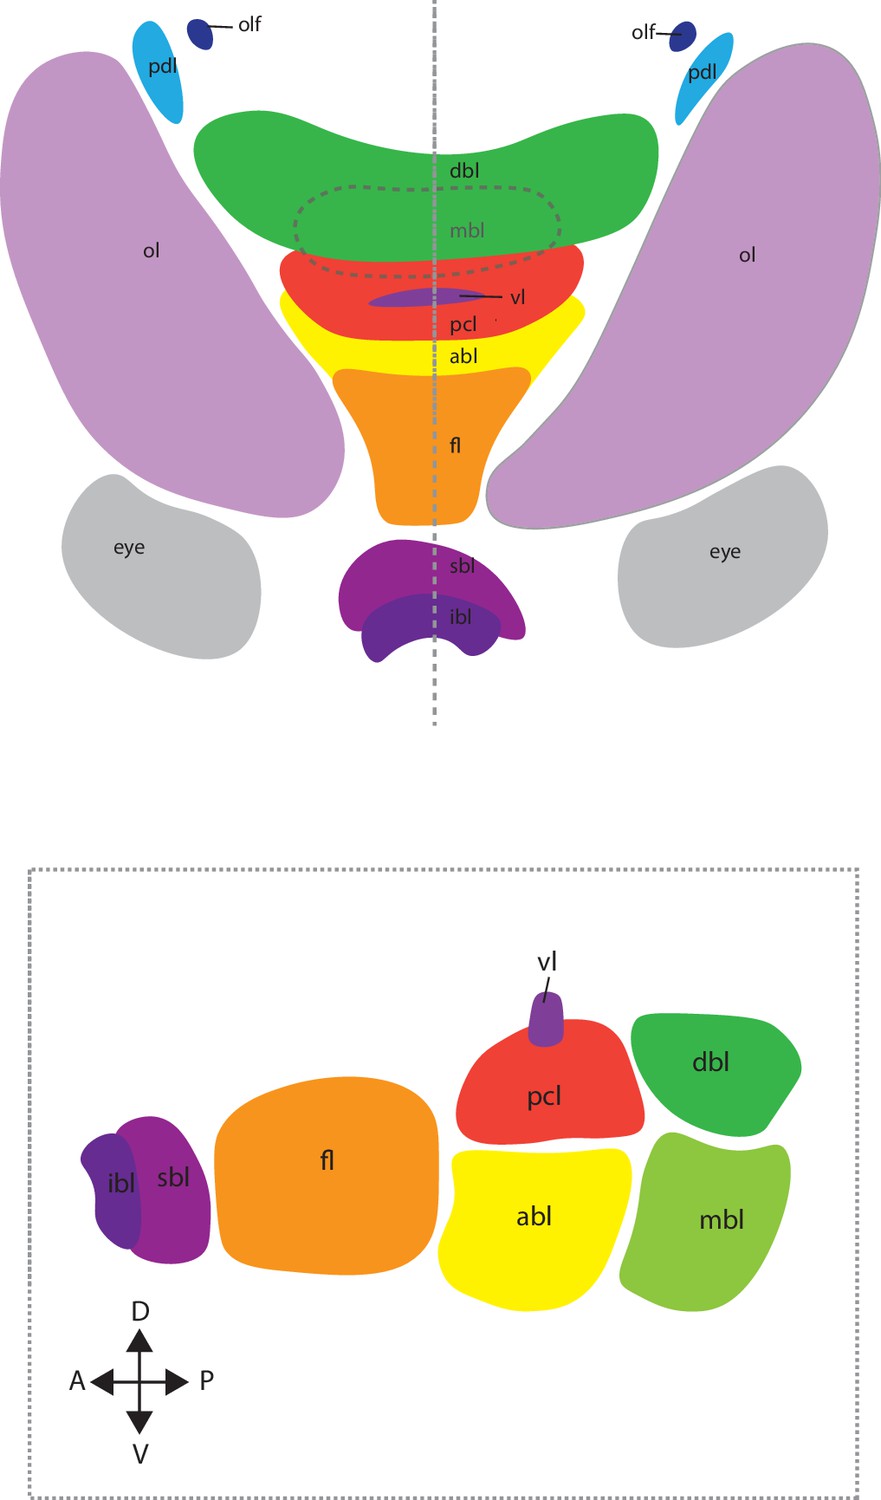
Rough schematic of the brain lobes of Loligo vulgaris.
Figure 2—figure supplement 2
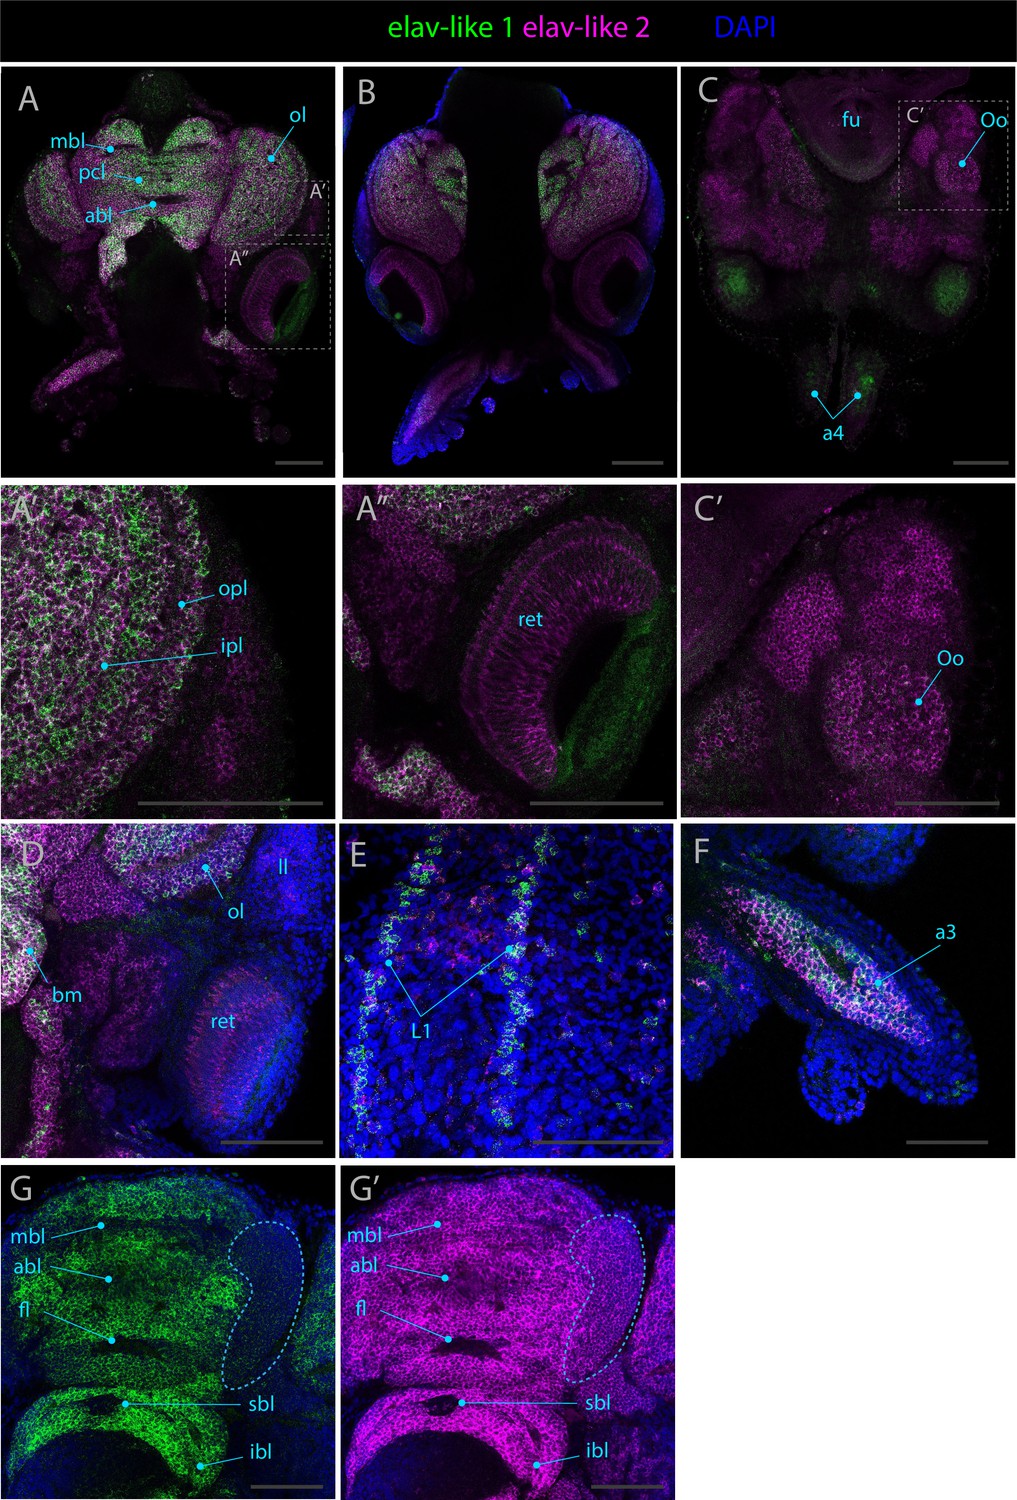
Expression patterns of elav-like 1 and elav-like 2.
Confocal micrographs showing hybridization chain reactions for elav-like 1 (green) and elav-like 2 (magenta). The areas shown are (A/A’/A’’) dorsal overview; (B) medial overview; (C/C’) ventral overview; (D) dorsal view around the eye region; (E) dorsal epidermis (F); arm (G/G’) brain, circled area highlights an area of differential expression between the two genes. Abbreviations: (a3/a4) arm pairs 3 and 4, (abl) anterior basal lobe, (bm) buccal mass, (fl) frontal lobe, (fu) funnel, (ll) lateral lip, (ibl) inferior buccal lobe, (ipl) inner plexiform layer, (L1) epidermal lines 1, (mbl) medial basal lobe, (ol) optic lobe, (Oo) olfactory organ, (opl) outer plexiform layer, (pcl) precommissural lobe, (ret) retina, and (sbl) superior buccal lobe. Scale bars = 250μM.
Figure 2—figure supplement 3
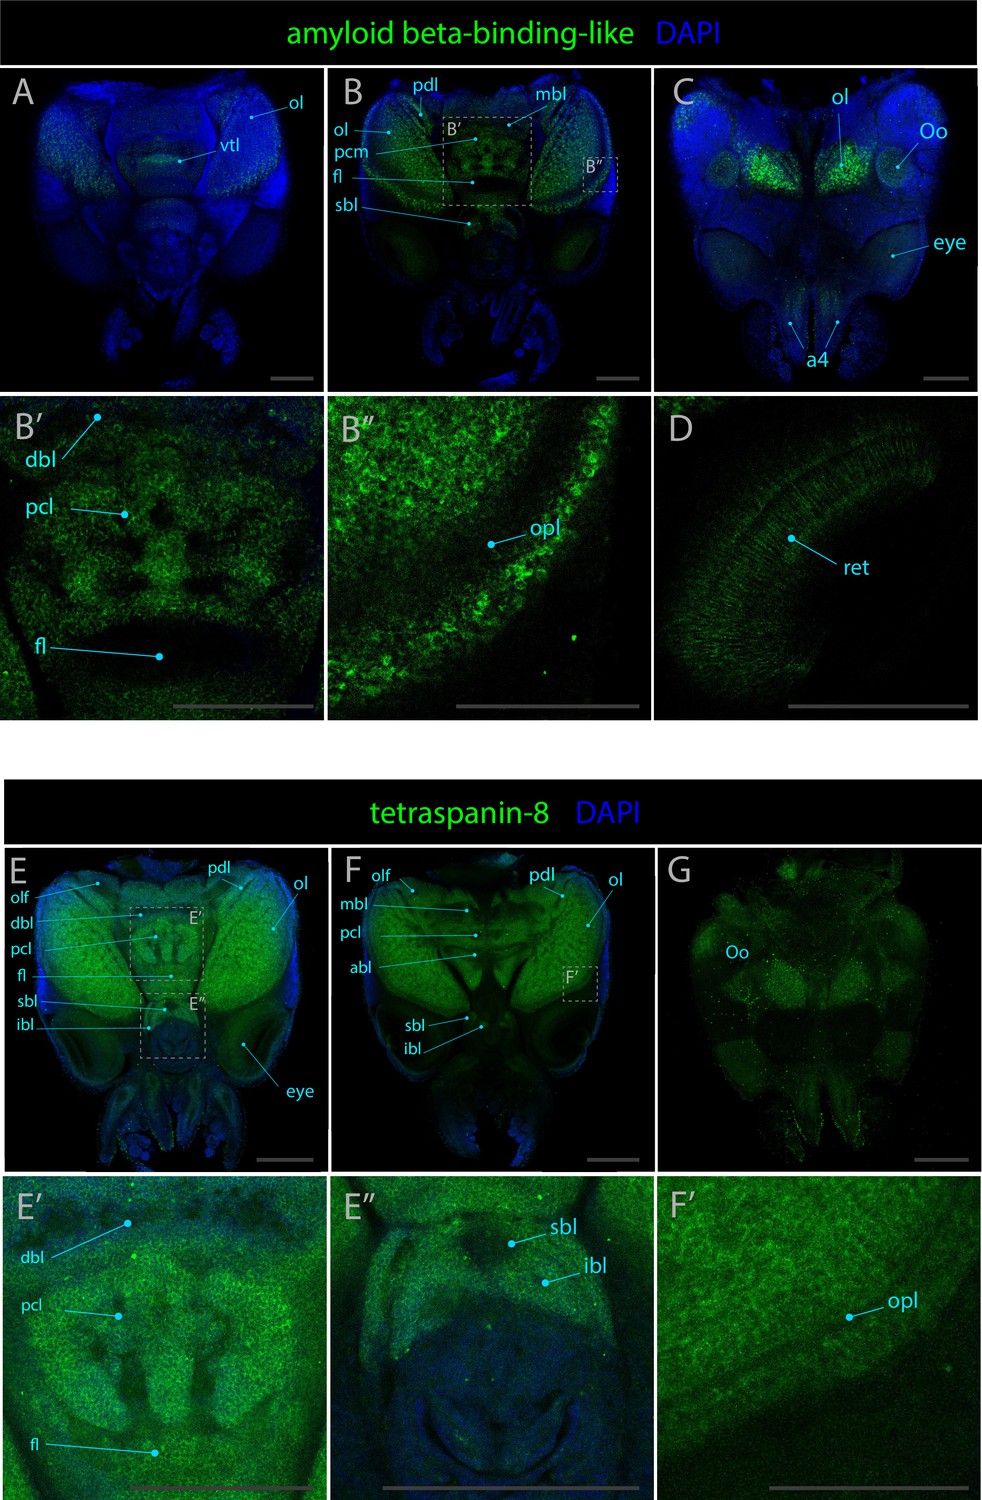
Expression patterns of amyloid beta-binding-like and tetraspanin-8.
Confocal micrographs showing hybridization chain reactions for amyloid beta-binding-like and tetraspanin-8, co-stained with DAPI (blue). The areas shown are (A) dorsal overview; (B/B’/B’’) medial overview; (C) ventral overview; (D) eye; (E/E’/E’’) dorsal overview; (F/F’) medial overview; (G) ventral overview. Abbreviations: (a4) arm pair 4, (abl) anterior basal lobe, (bm) buccal mass, (dbl) dorsal basal lobe, (fl) frontal lobe, (fu) funnel, (ll) lateral lip, (ibl) inferior buccal lobe, (ipl) inner plexiform layer, (L1) epidermal lines 1, (mbl) medial basal lobe, (ol) optic lobe, (olf) olfactory lobe, (Oo) olfactory organ, (opl) outer plexiform layer, (pdl) peduncle lobe, (pcl) precommissural lobe, (ret) retina, (sbl) superior buccal lobe, (vtl) vertical lobe. All scale bars = 250μM exept for B’’ and F’ for which the scale bars = 100μM.
Figure 2—figure supplement 4
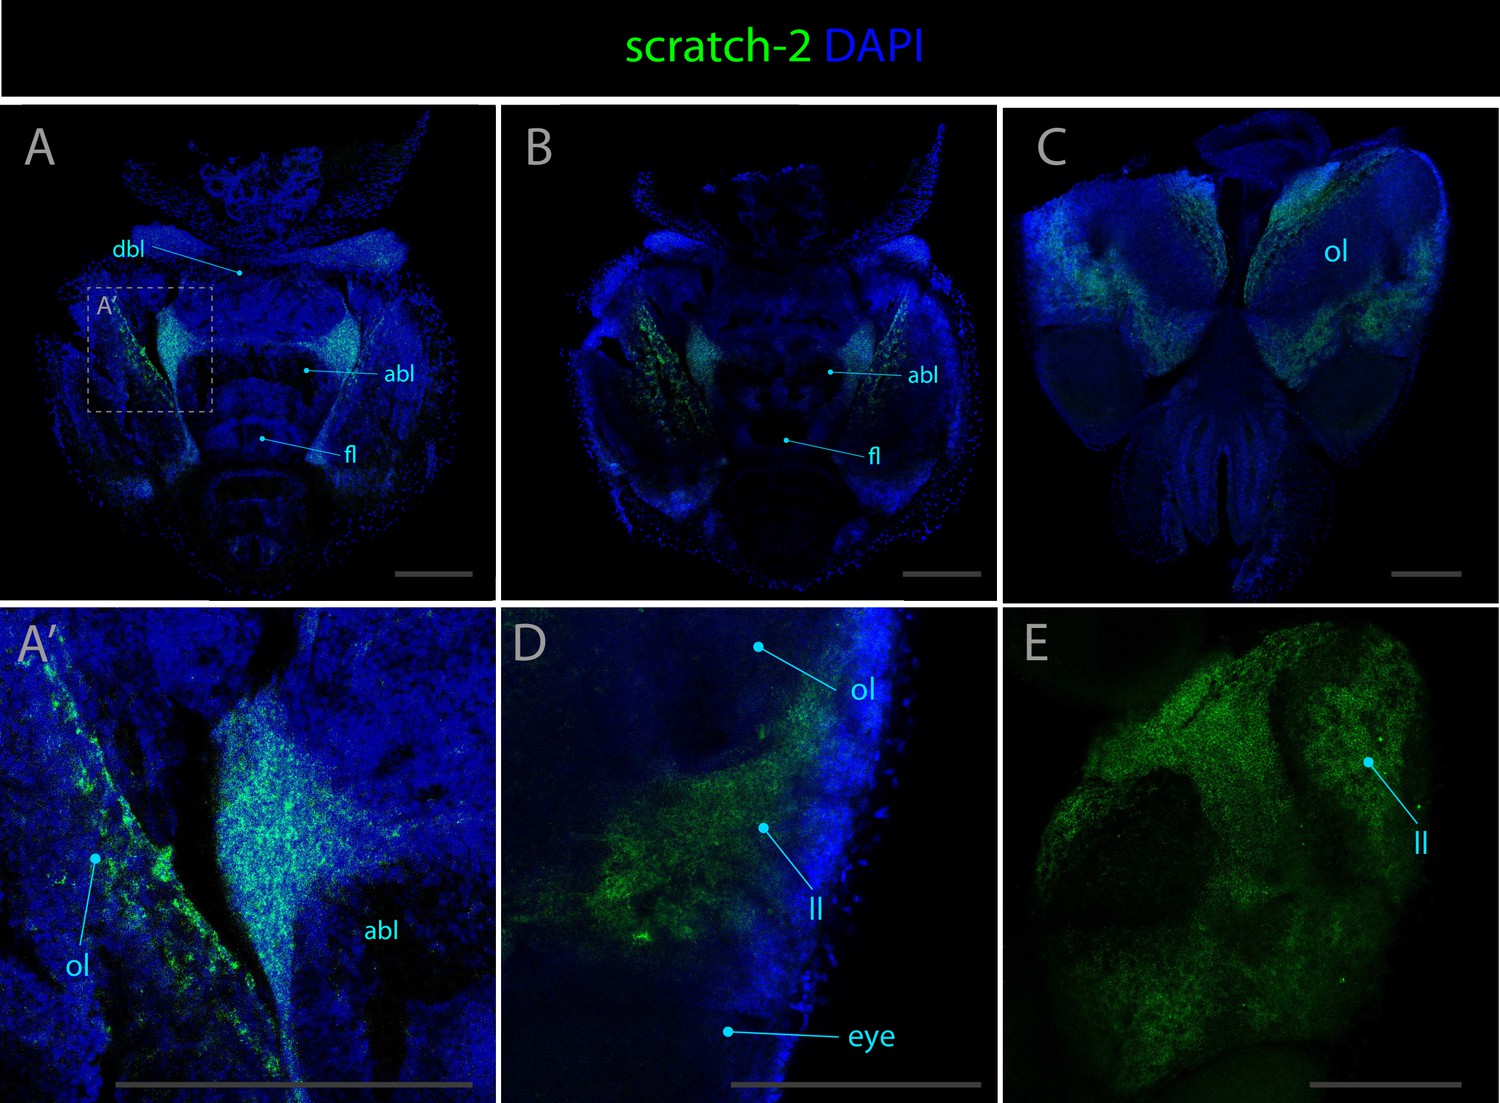
Expression pattern of scratch-2.
Confocal micrographs showing hybridization chain reactions for scratch-2 (green), co-stained with DAPI (blue). The areas shown are (A/A’) dorsal overview; (B) medial overview; (C) ventral overview; (D) dorsal view of the lateral lip above the eye region; (E) ventral view around optic lobe without DAPI. Abbreviations: (abl) anterior basal lobe, (dbl) dorsal basal lobe, (fl) frontal lobe, (ll) lateral lip, (ol) optic lobe, and (olf) olfactory lobe. Scale bars = 250μM.
Figure 2—figure supplement 5
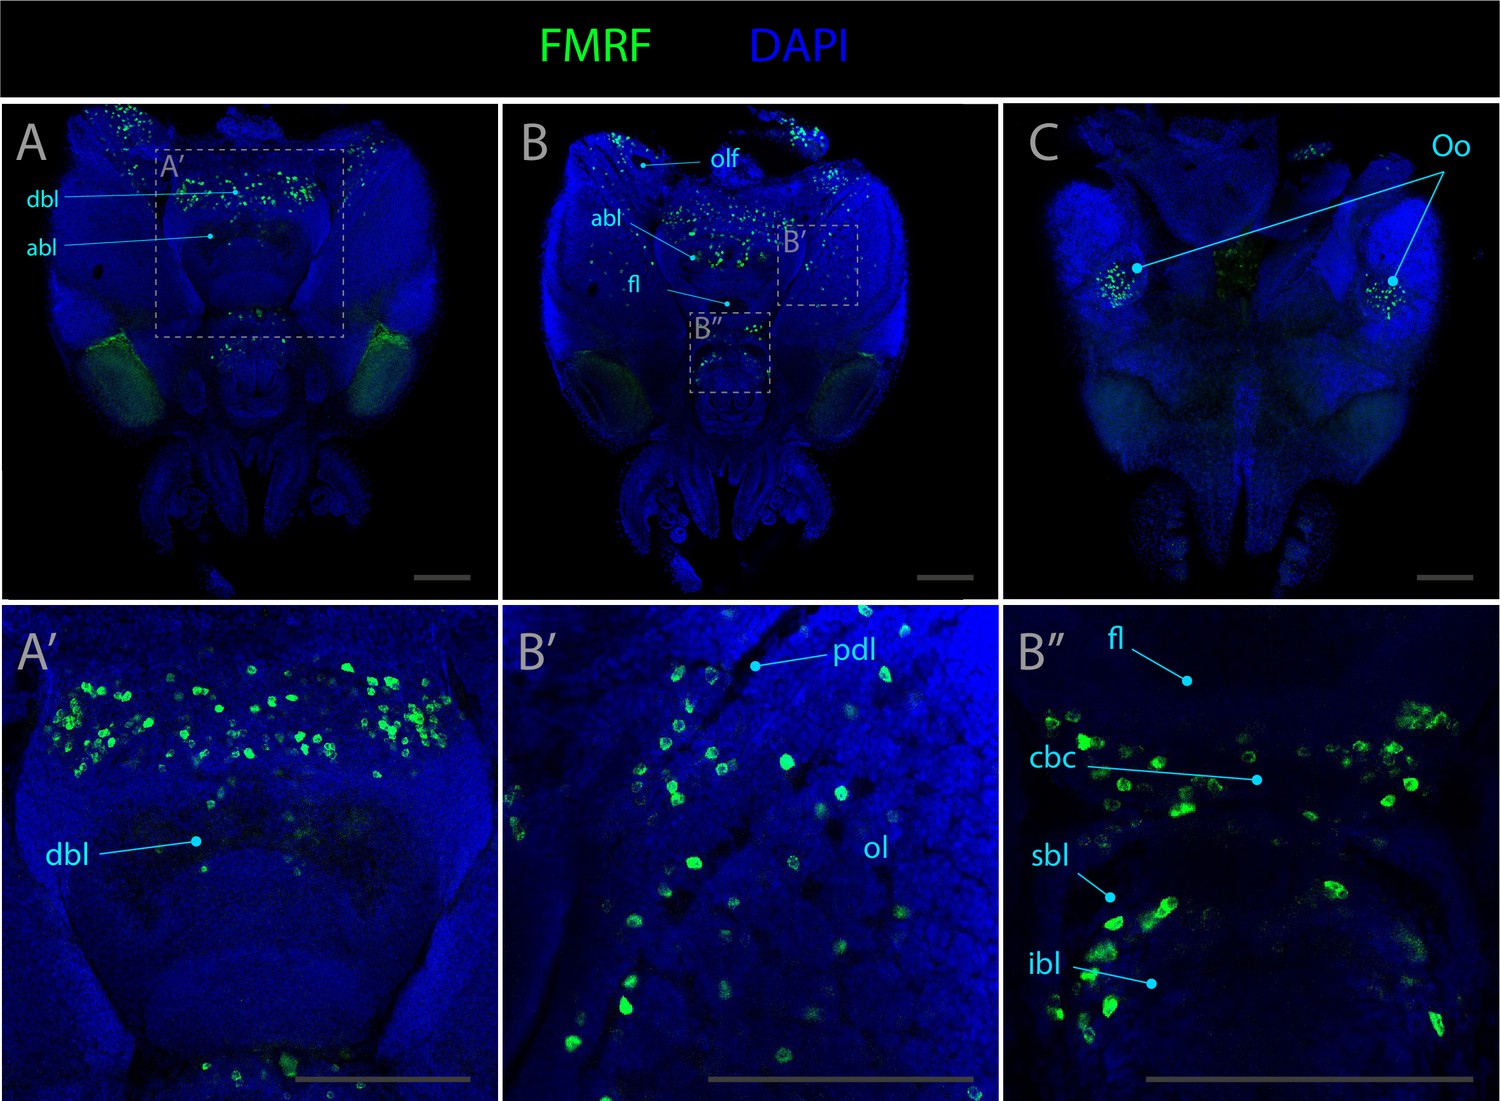
Expression pattern of fmrf.
Confocal micrographs showing hybridization chain reactions for fmrf (green), co-stained with DAPI (blue). The areas shown are (A/A’) dorsal overview; (B/B’/B’’) medial overview; (C) ventral overview. Abbreviations: (abl) anterior basal lobe, (dbl) dorsal basal lobe, (cbc) cerebro-buccal connective, (fl) frontal lobe, (ibl) inferior buccal lobe, (ol) optic lobe, (olf) olfactory lobe, (Oo) olfactory organ, (pdl) peduncle lobe, and (sbl) superior buccal lobe. Scale bars = 250μM.
Figure 2—figure supplement 6
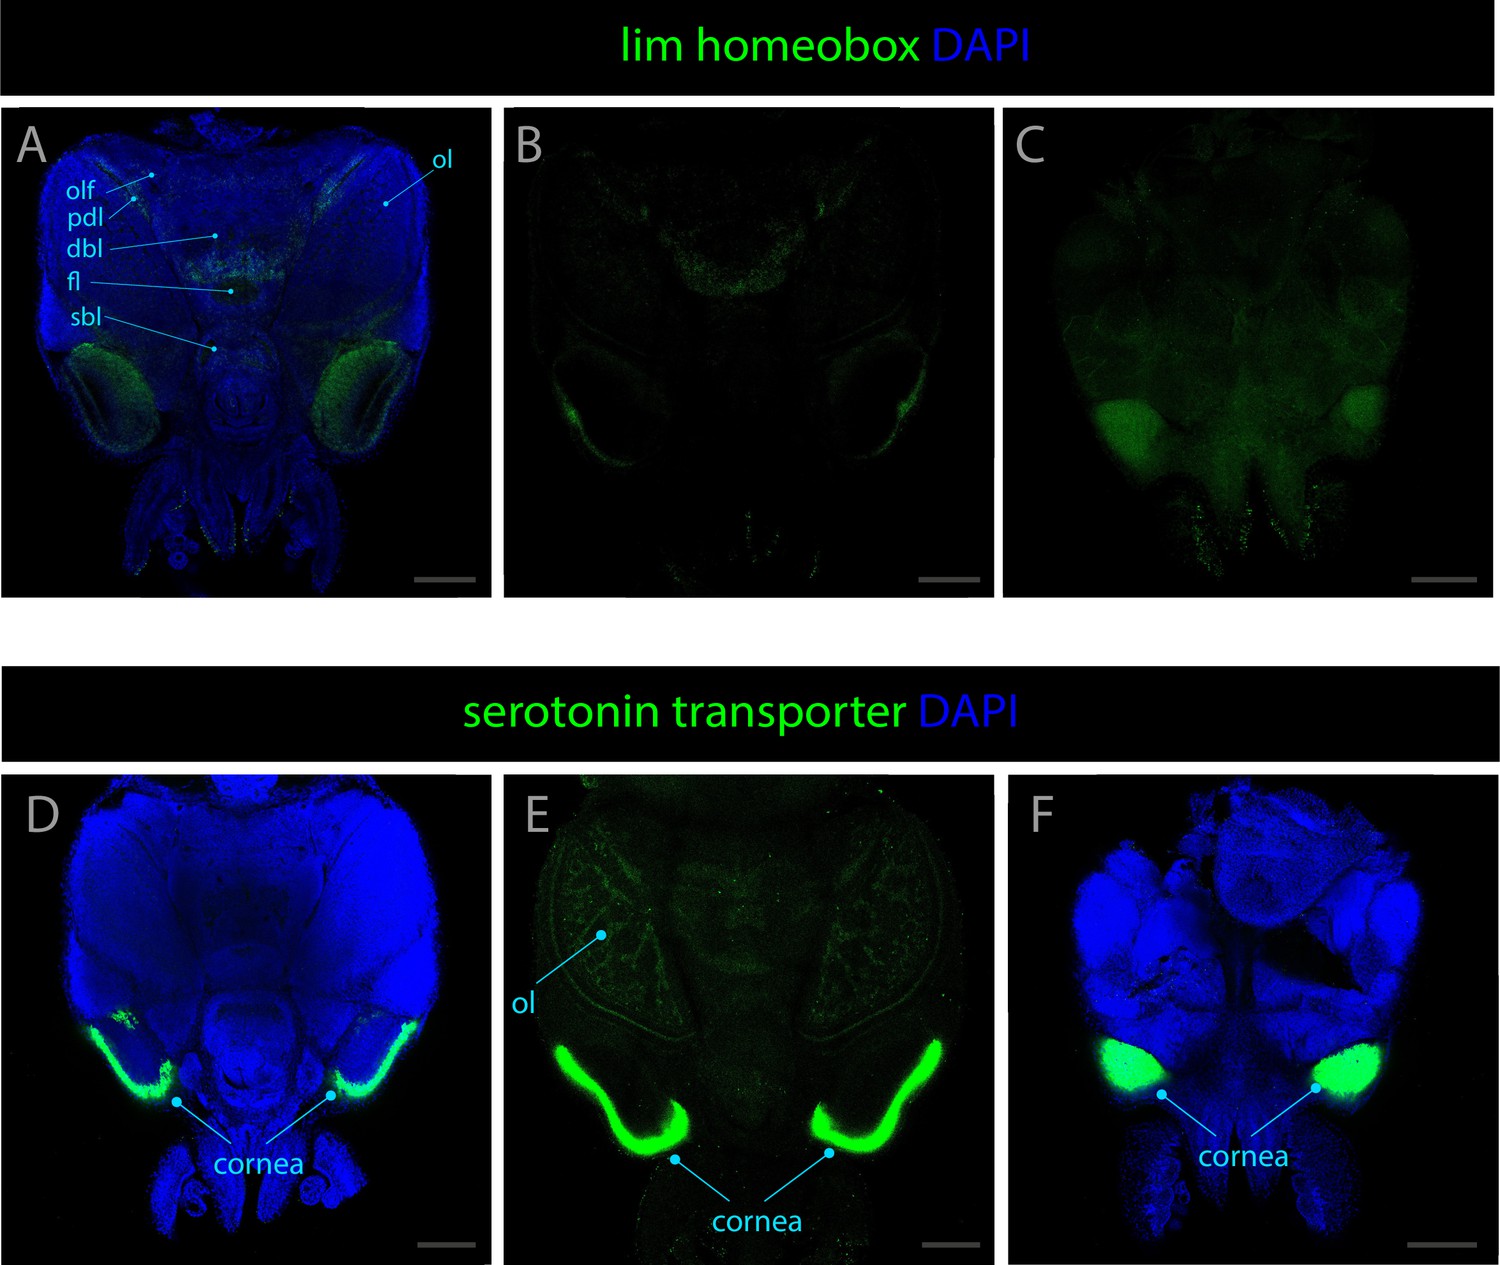
Expression patterns of lim homeobox and serotonin transporter.
Confocal micrographs showing hybridization chain reactions for lim homeobox (green) and serotonin transporter (green), co-stained with DAPI (blue). The areas shown are (A) dorsal overview; (B) medial overview; (C) ventral overview; (D) dorsal overview; (E) medial overview; (F) ventral overview. Abbreviations: (dbl) dorsal basal lobe, (fl) frontal lobe, (ol) optic lobe, (olf) olfactory lobe, (pdl) peduncle lobe, and (sbl) superior buccal lobe. Scale bars = 250μM.
Figure 2—figure supplement 7
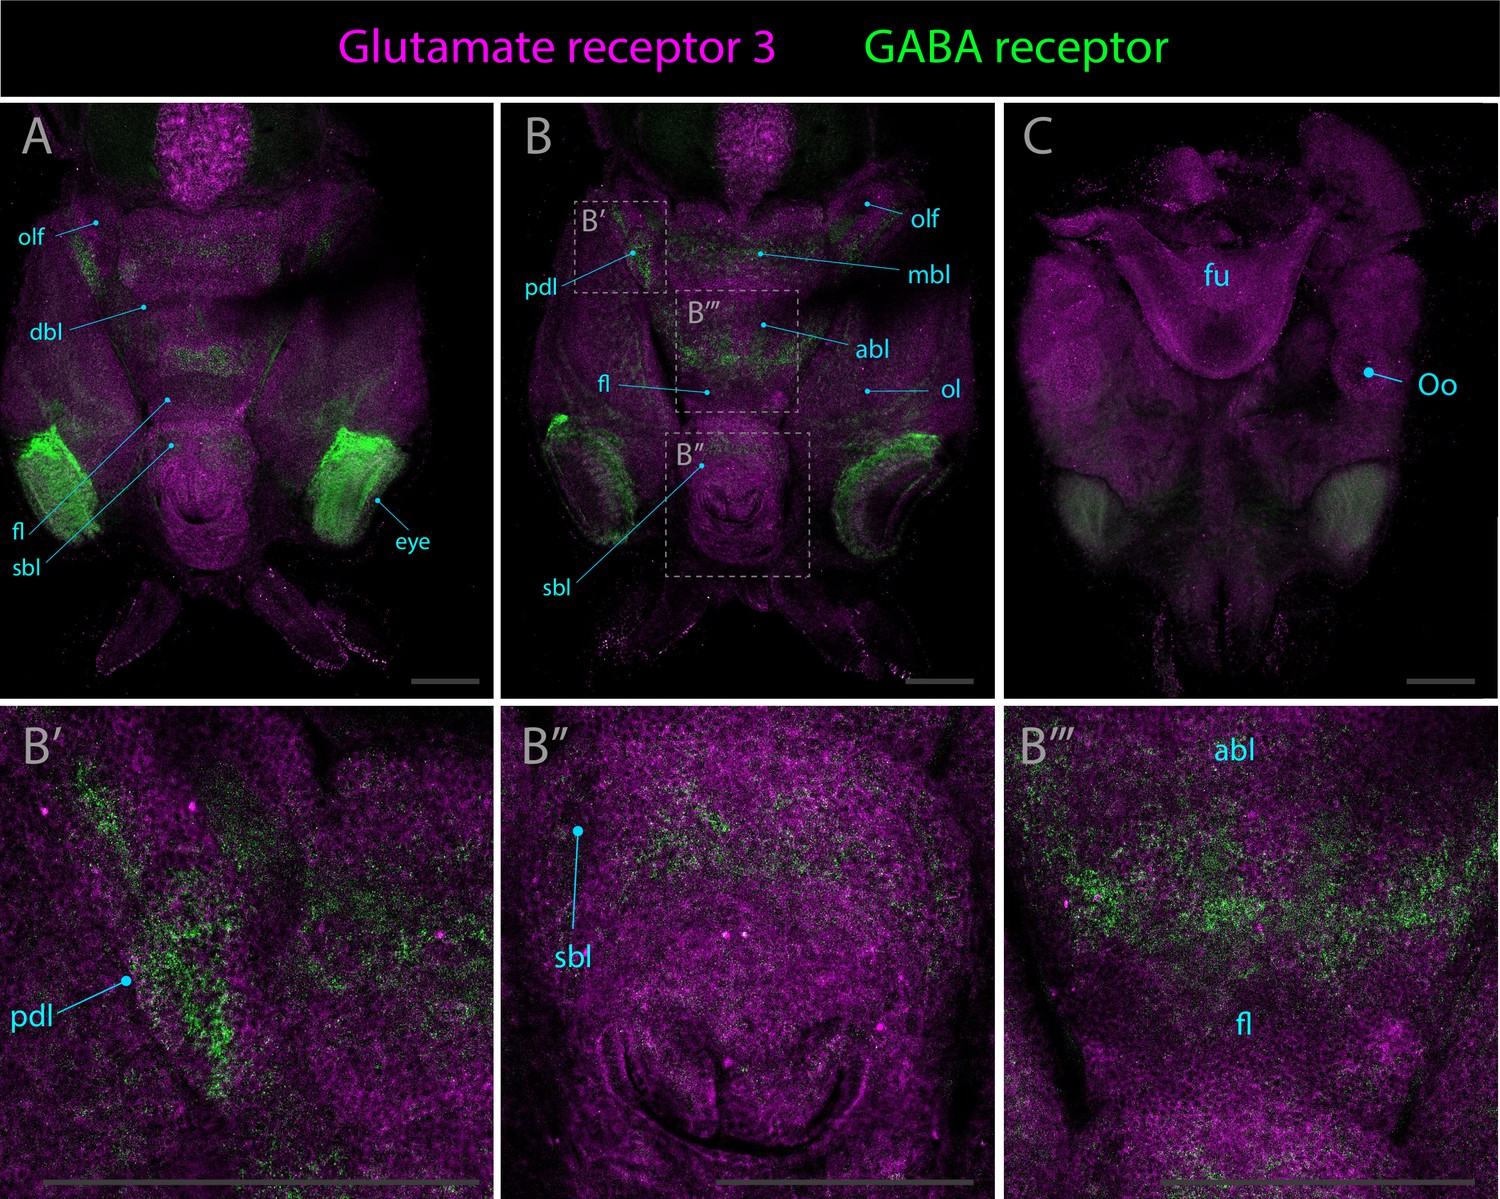
Expression patterns of glutamate receptor 3 and gaba receptor.
Confocal micrographs showing hybridization chain reactions for glutamate receptor 3 (magenta) and gaba receptor (green), co-stained with DAPI (blue). The areas shown are (A) dorsal overview; (B/B’/B’’) medial overview; (C) ventral overview. Abbreviations: (abl) anterior basal lobe, (dbl) dorsal basal lobe, (fl) frontal lobe, (fu) funnel, (ll) lateral lip, (mbl) medial basal lobe, (ol) optic lobe, (olf) olfactory lobe, (Oo) olfactory organ, (pdl) peduncle lobe, and (sbl) superior buccal lobe.
Figure 2—figure supplement 8
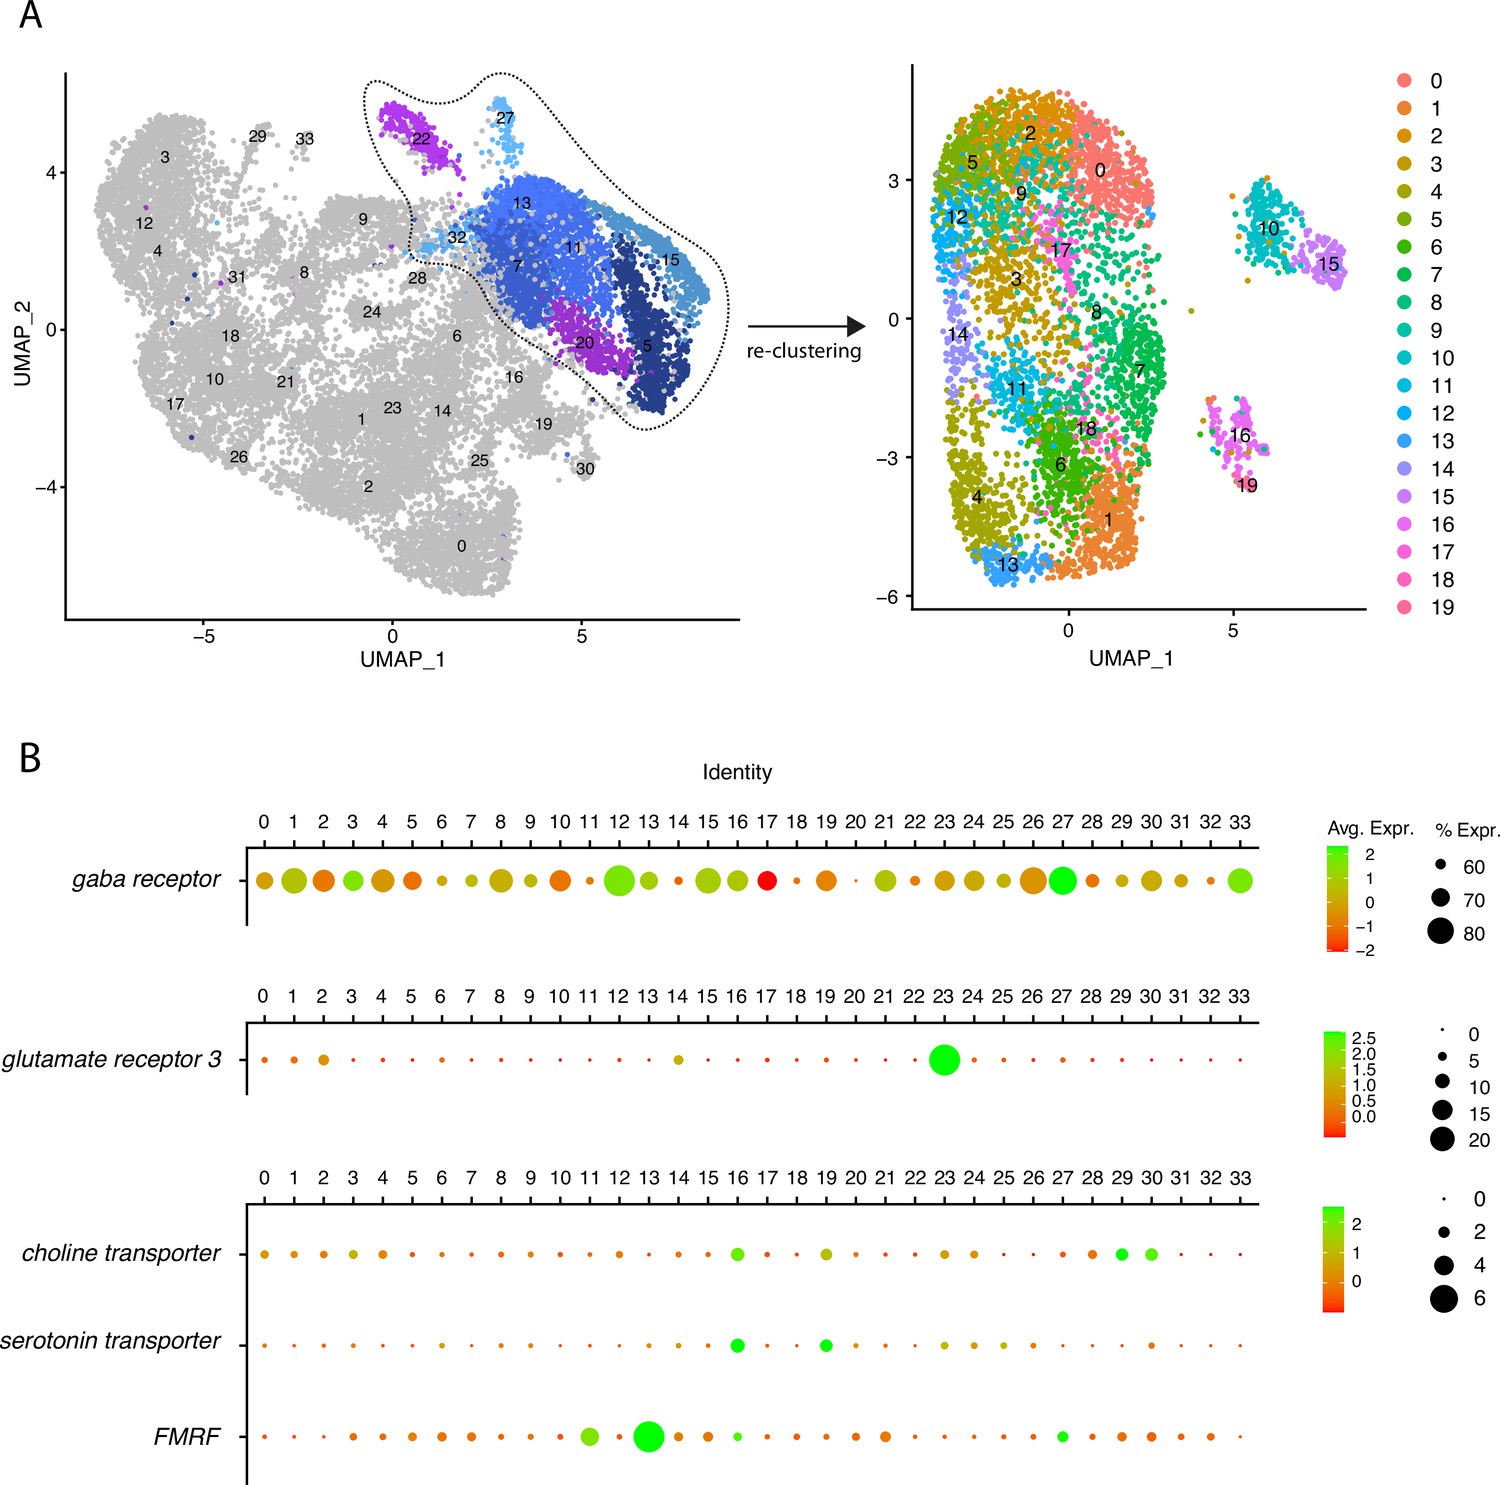
(A) Expression of neurotransmitter and neuropeptide-related genes in the single-cell dataset.(B) Dotplots showing the average expression and percentage of cells expressing given genes in each cluster. Groups of genes were plotted separately to adapt the scale and improve readability of the plots.
Figure 3 with 5 supplements
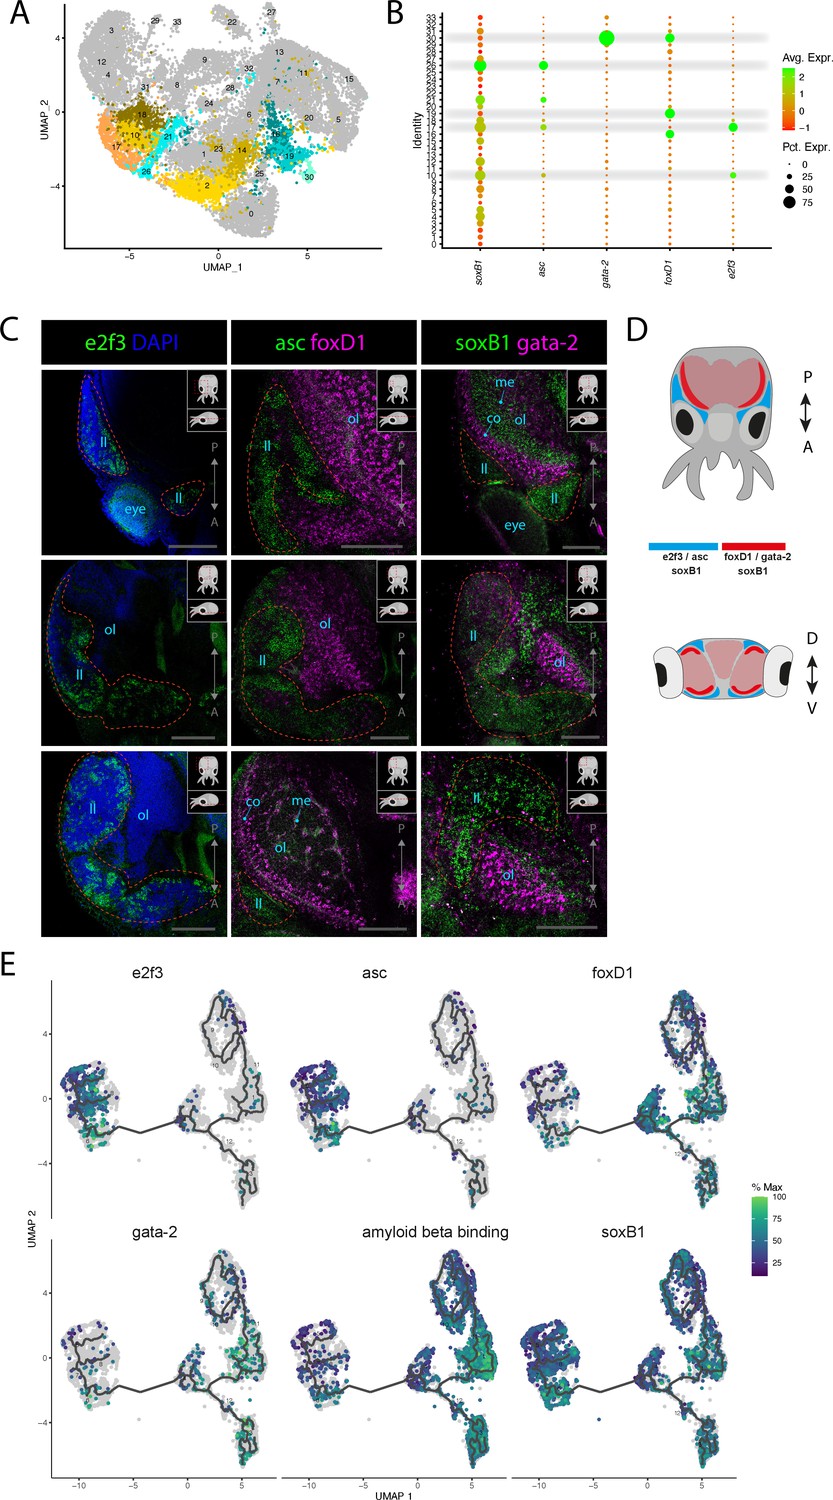
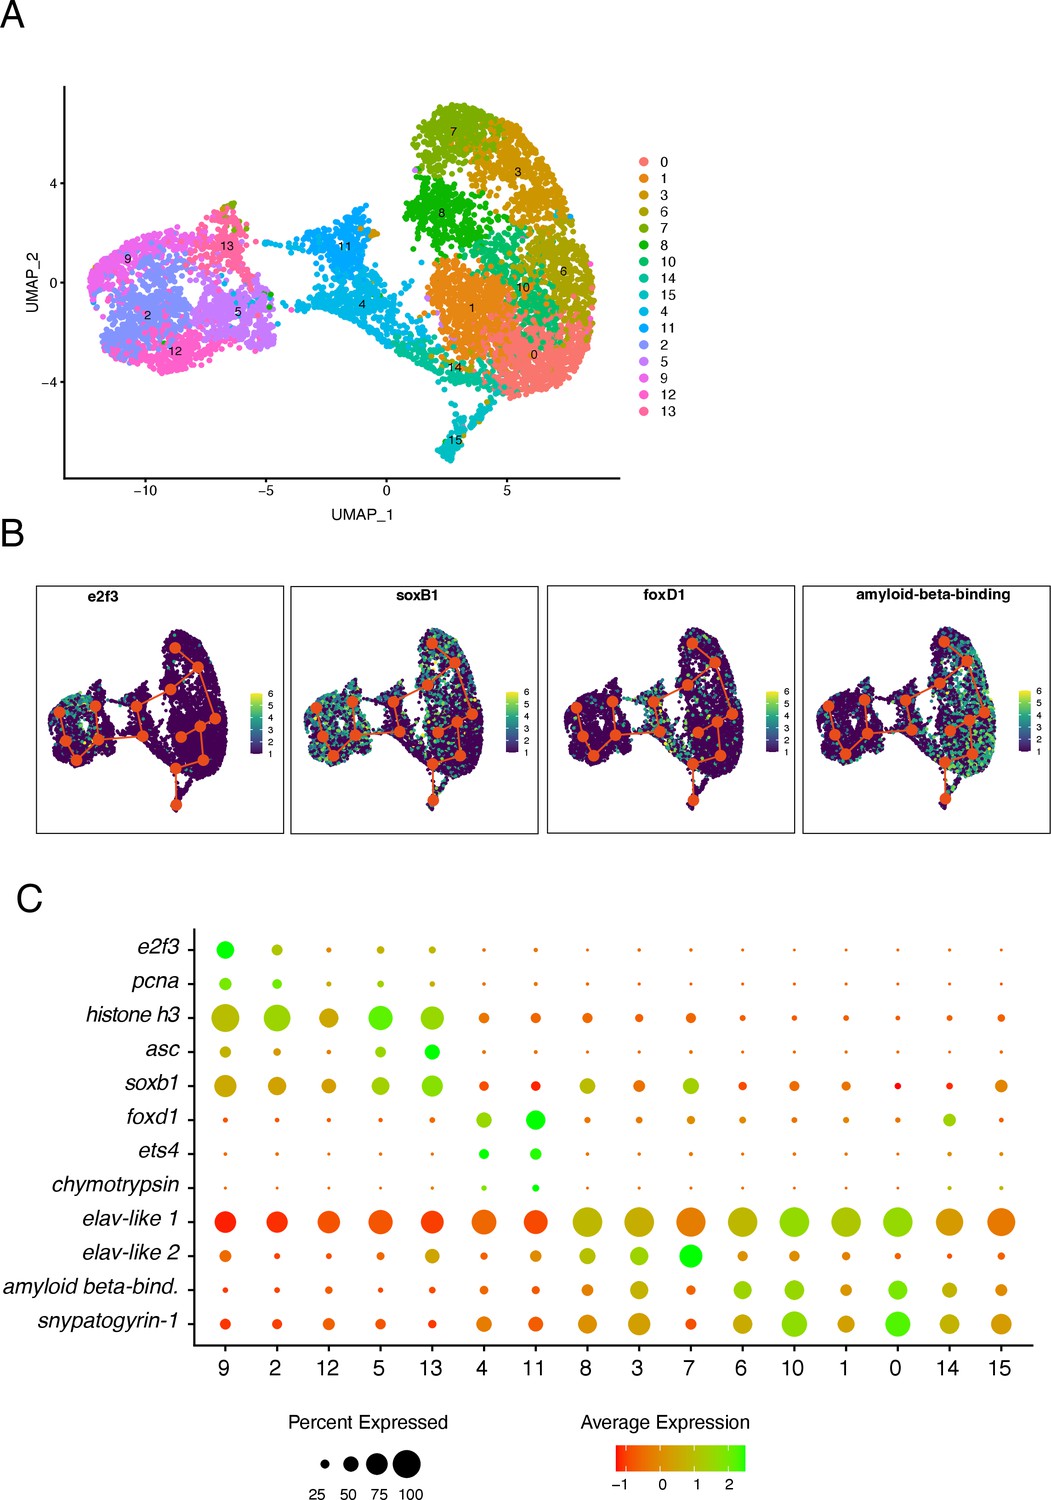
Stem cells and neuronal differentiation.
(A) UMAP with clusters identified as either stem cell, Asc+, or FoxD+ highlighted. (B) Dot plot showing the average expression of marker genes and proportion of cells in each cluster that express these genes. (C) Confocal micrographs showing mRNA expression detected by hybridization chain reaction (HCR) for genes involved in stem cells and neuronal differentiation. Cartoons on the top-right corner of each picture indicate the position of the image on a frontal view (top) and the plane of acquisition on sagittal view (bottom). Red circles highlight the location of the lateral lips. Scale bars = 250μM. (co) cortex of the optic lobe, (eye) eye, (ll) lateral lip, (me) medulla of the optic lobe, and (ol) optic lobe. (D) Graphical representation summarizing the gene expression patterns of the genes assessed by HCR in situ hybridization (ISH) in the head of L. vulgaris with dorsal view (top) and transversal view (bottom). P/A, posterior/anterior; D/V, dorsal/ventral. (E) Plots showing the expression patterns of indicated genes across neurons and stem cells. The clusters and the trajectories are determined using monocle.
Figure 3—figure supplement 1
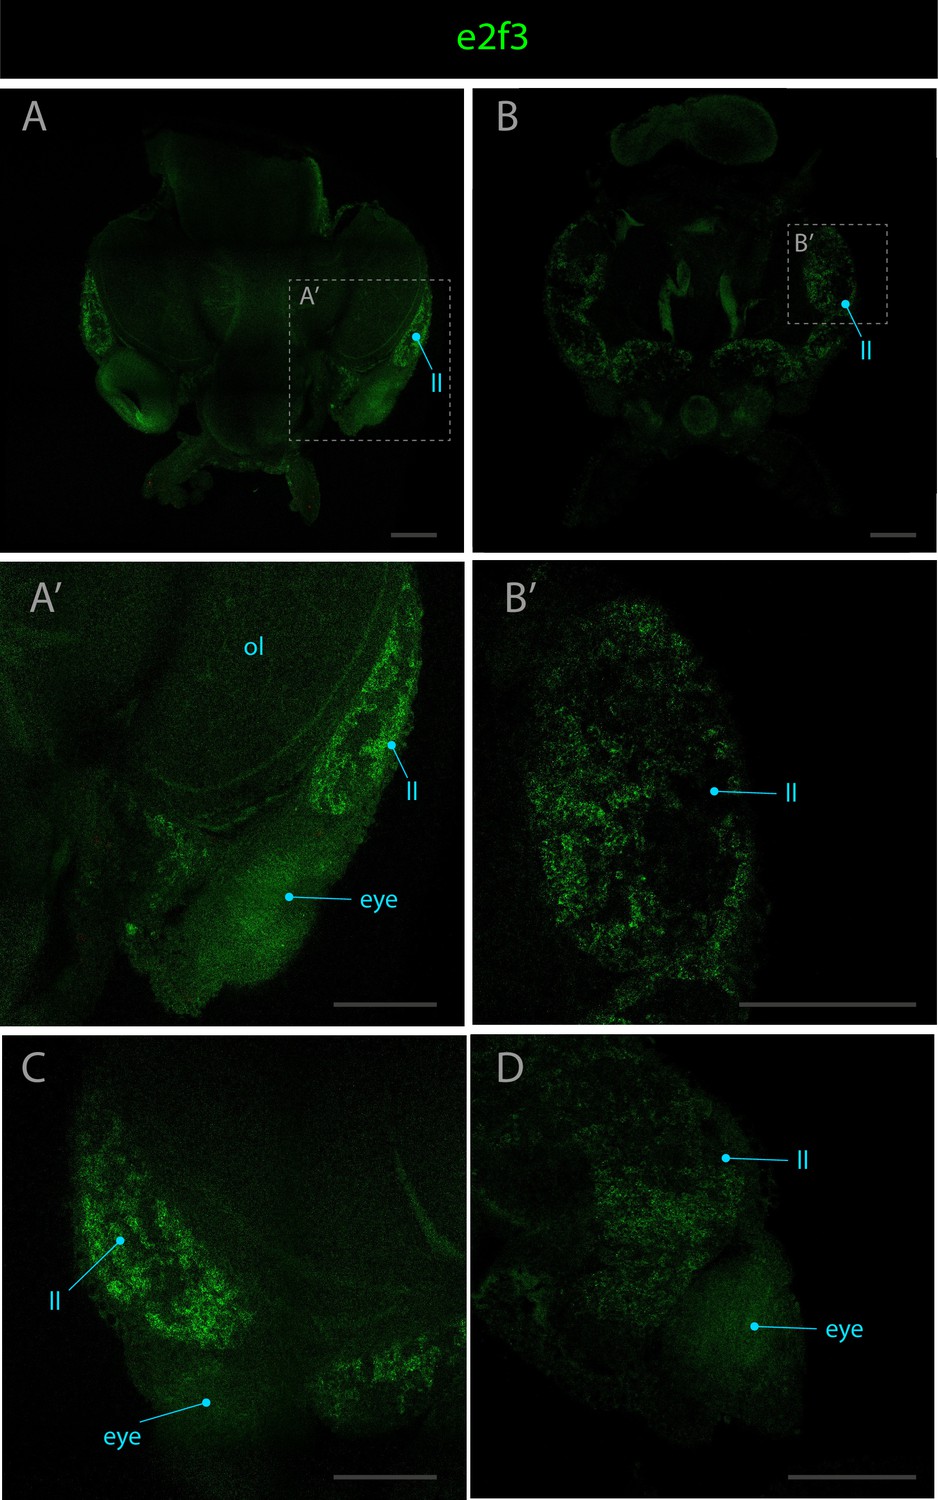
Expression pattern of e2f3.
Confocal micrographs showing hybridization chain reactions for e2f3 (green). The areas shown are (A/A’) dorsal overview; (B/B’) ventral overview; (C) dorsal part of the lateral lip around the eye; (D) ventral part of the lateral lip around the eye. Abbreviations: (ll) lateral lip; (ol) optic lobe. Scale bars = 250μM.
Figure 3—figure supplement 2
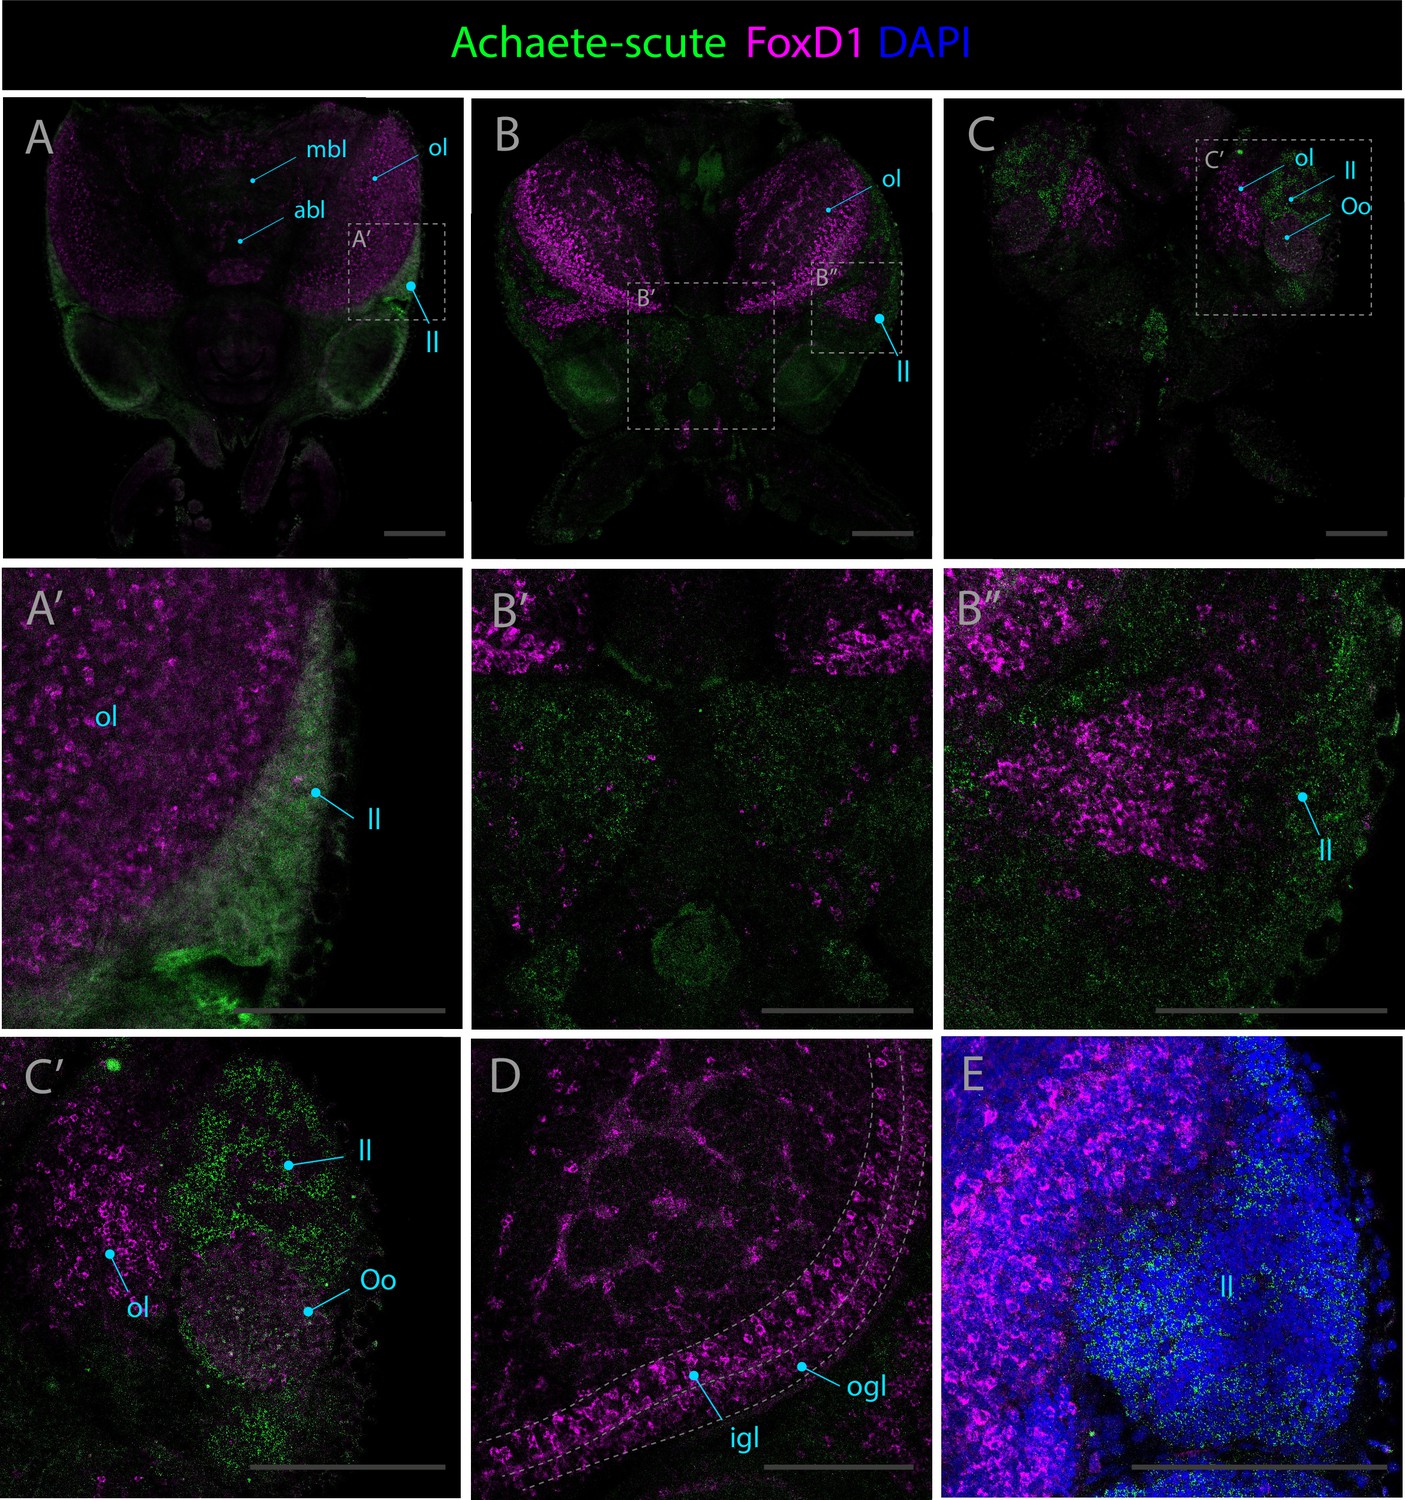
Expression patterns of achaete-scute and foxD1.
Confocal micrographs showing hybridization chain reactions for achaete-scute (green) and foxD1 (magenta), co-stained with DAPI (blue). The areas shown are (A/A’) dorsal overview; (B/B’/B’’) medial overview; (C/C’) ventral overview; (D) optic lobe; (E) ventral view of the lateral lip. Abbreviations: (abl) anterior basal lobe, (igl) inner granular layer, (ll) lateral lip, (mbl) medial basal lobe, (ol) optic lobe, (ogl) outer granular layer, and (Oo) olfactory organ. Scale bars = 250μM.
Figure 3—figure supplement 3
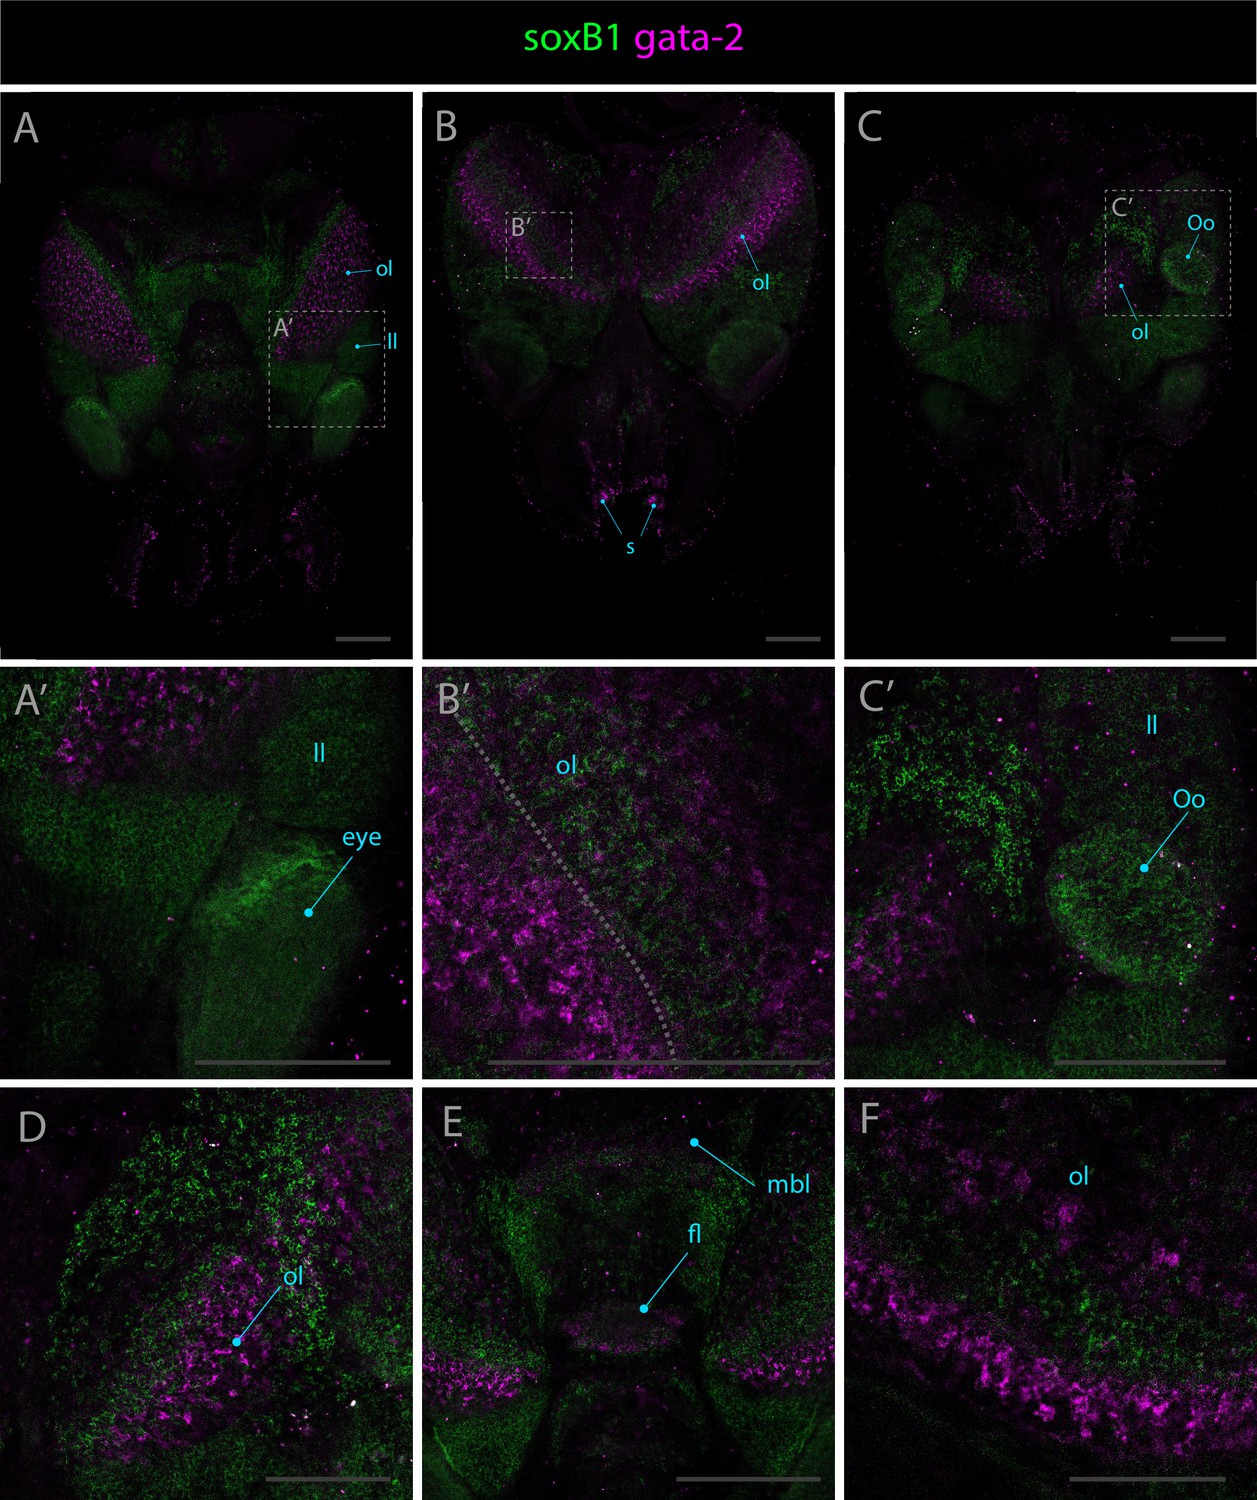
Expression patterns of soxB1 and gata-2.
Confocal micrographs showing hybridization chain reactions for soxB1 (green) and gata-2 (magenta), co-stained with DAPI (blue). The areas shown are (A/A’) dorsal overview; (B/B’) medial overview; (C/C’) ventral overview; (D) ventral extremity of the optic lobe; (E) dorsal view of the brain; (F) anterior part of the optic lobe. Abbreviations: (fl) frontal lobe, (ll) lateral lip, (mbl) medial basal lobe, (ol) optic lobe, (Oo) olfactory organ, and (s) suckers. Scale bars = 250μM.
Figure 3—figure supplement 4
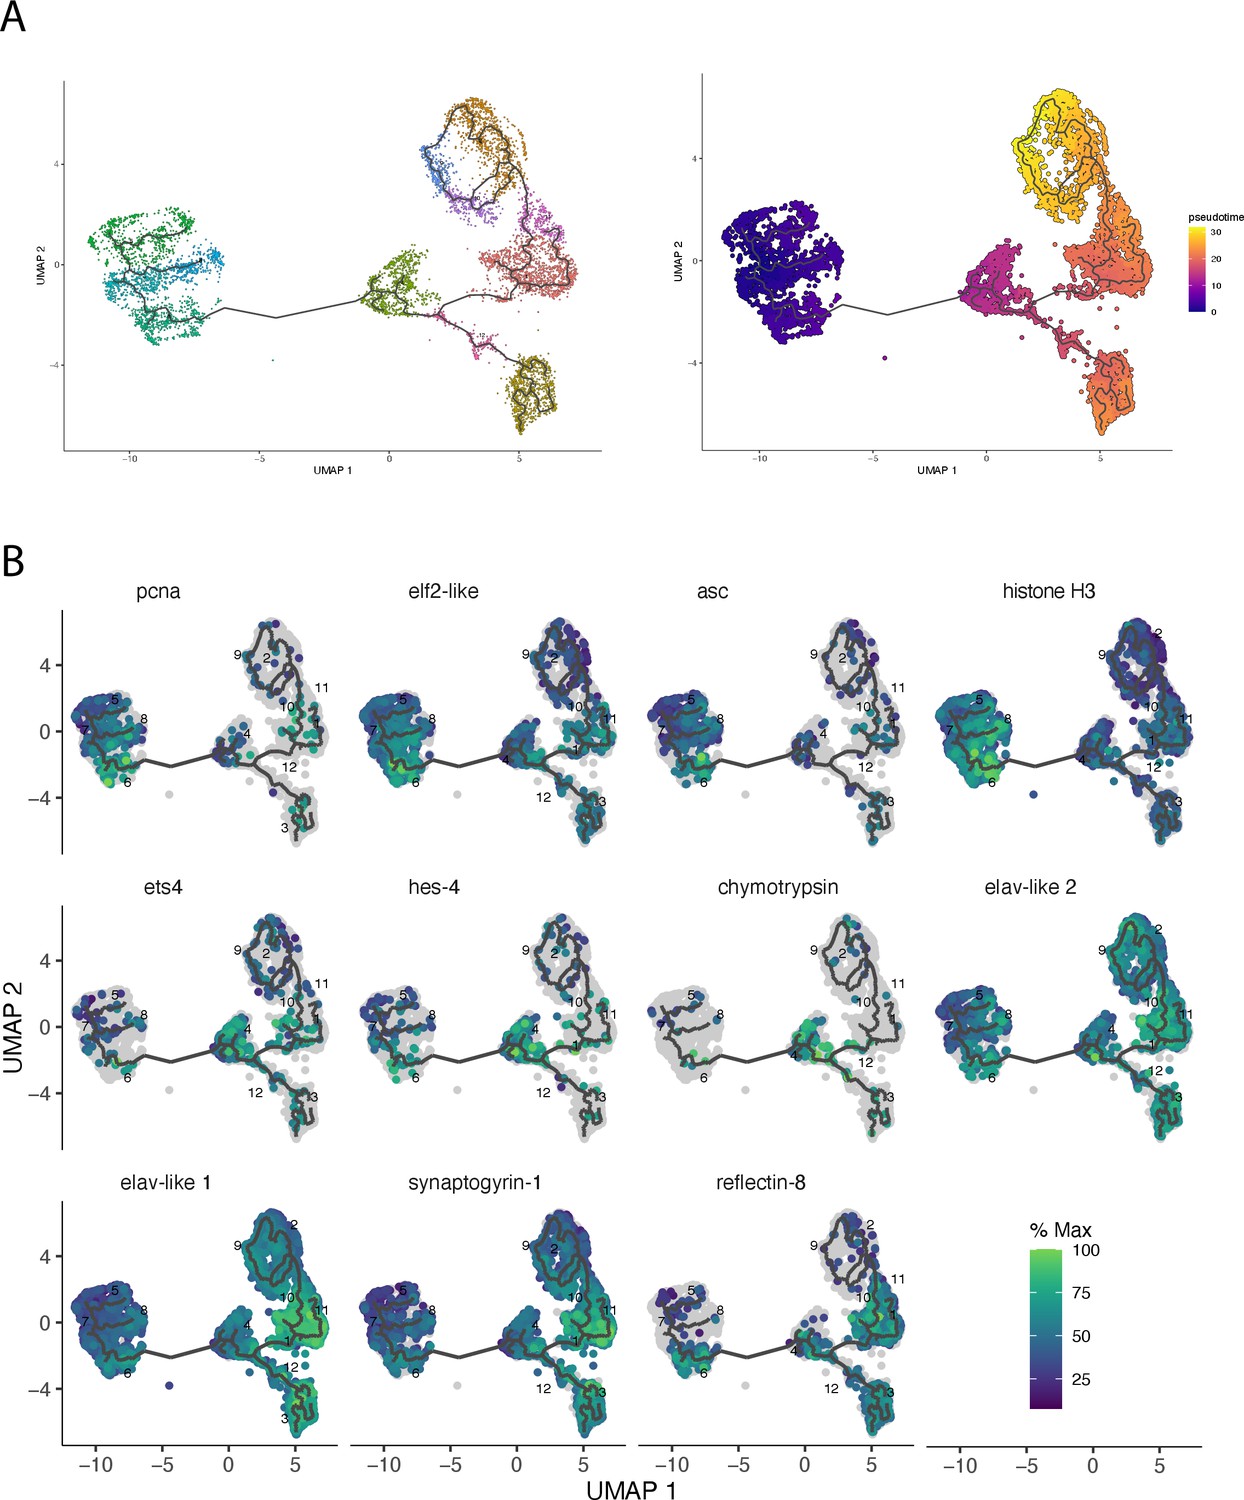
Monocle-based clustering and trajectory analysis.
(A) UMAP showing the clusters obtained with monocle3 and the -trajectories predicting developmental lineages. The corresponding pseudotime (cells of cluster 5 are chosen as a starting point) is shown on the right. (B) UMAP with plotted expression of additional marker genes along the trajectory axis.
Figure 3—figure supplement 5
Trajectory inference using slingshot.
(A) UMAP representation showing the clusters obtained with Seurat after the subclustering of predicted stem cell, neuronal progenitors, and neurons. (B) UMAP with plotted expression of genes of interest with the developmental trajectories predicted by slingshot. (C) Dot plot showing the expression of marker genes along the trajectory axis. Clusters were reordered to match the predicted differentiation stage from least differentiated (left) to most differentiated (right).
Figure 4 with 2 supplements
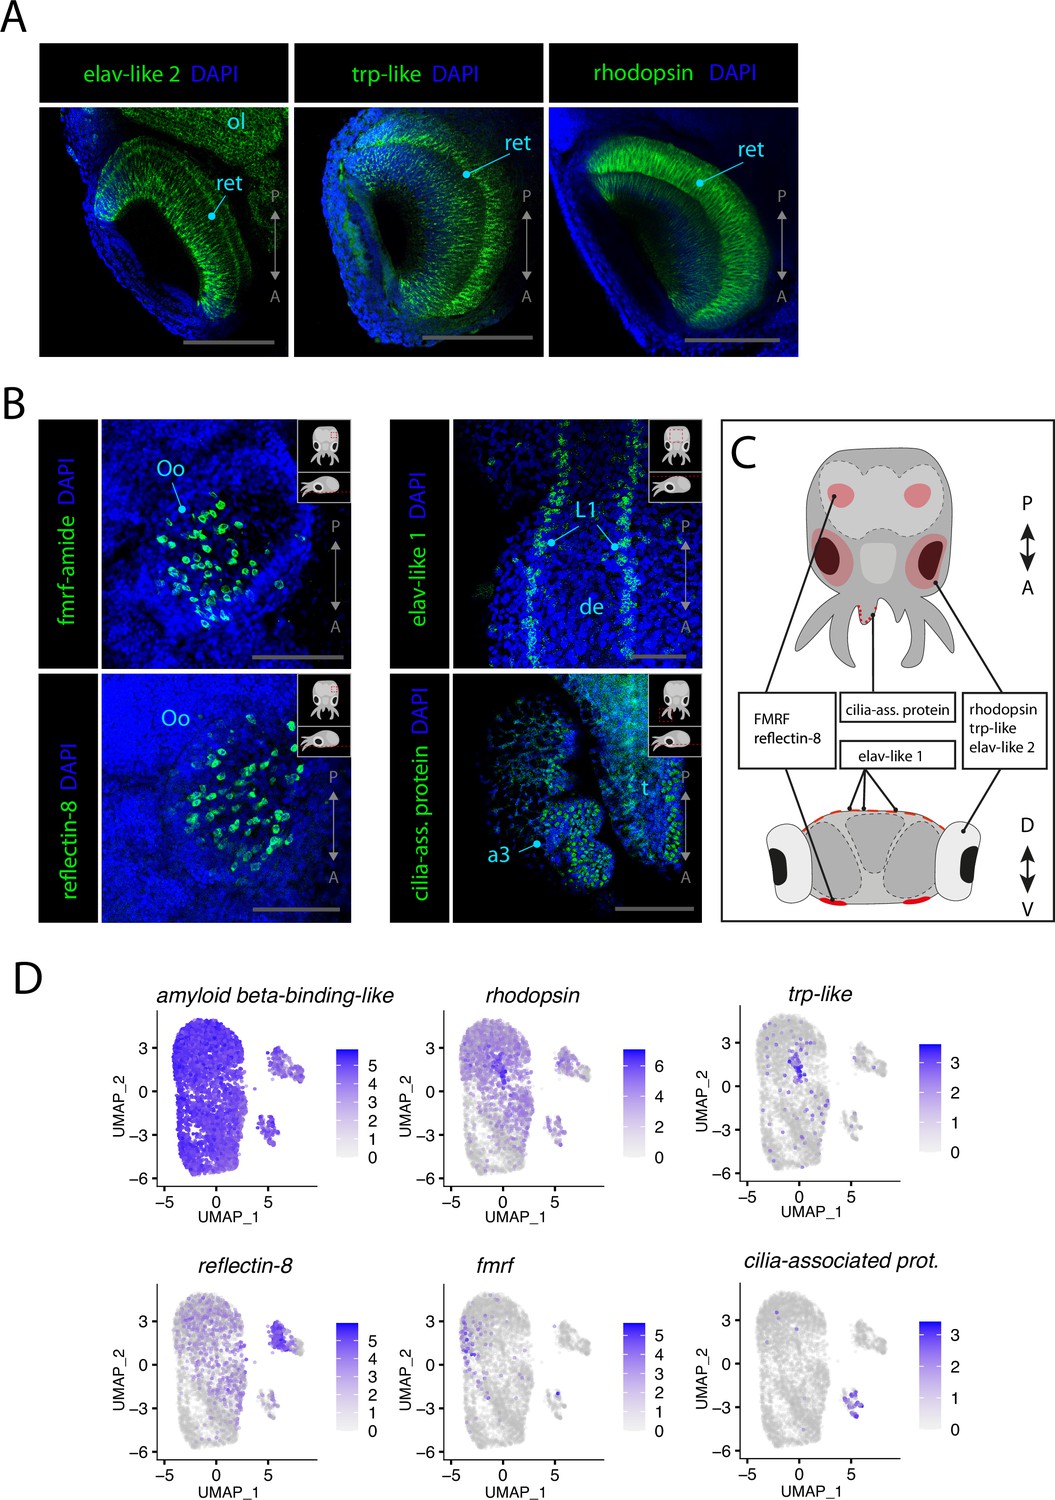
Sensory cells.
(A) Confocal micrographs showing mRNA expression detected by hybridization chain reaction (HCR) for genes expressed in photoreceptors. Scale bars = 250μM. (B) Confocal micrographs showing mRNA expression detected by HCR for genes expressed in chemosensory organs and mechanosensory cells. Cartoons on the top-right corner of each picture indicate the position of the image on a frontal view (top) and the plane of acquisition on sagittal view (bottom). Scale bars = 250 μM. (C) Graphical representation summarizing the expression of identified genes in specific sensory organs and regions. Dorsal view (top) and transversal view (bottom). P/A, posterior/anterior; D/V, dorsal/ventral. (D) UMAP of the subclustered neuronal subset with the plotted expression level of the different identified sensory markers. (a3) arm pair 3, (de) dorsal epidermis, (L1), epidermal lines 1, (ol) optic lobe, (Oo) olfactory organ, (ret) retina.
Figure 4—figure supplement 1
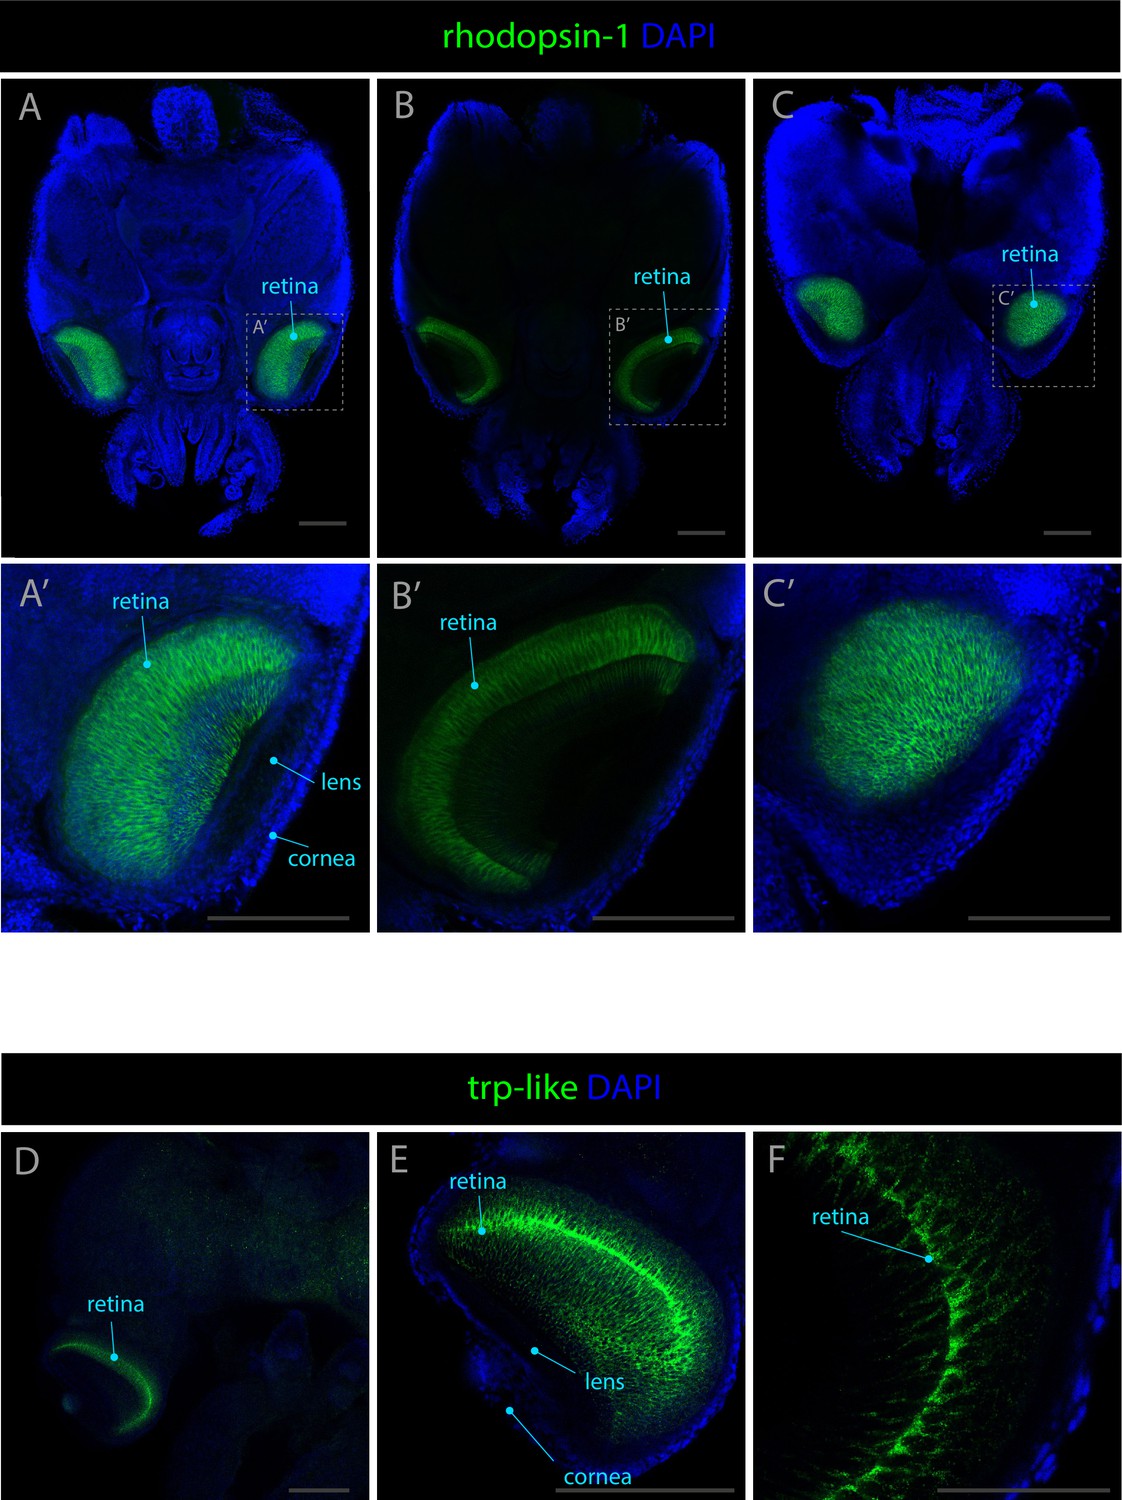
Expression patterns of rhodopsin-1 and trp-like.
Confocal micrographs showing hybridization chain reactions for rhodopsin-1 and trp-like, co-stained with DAPI (blue). The areas shown are (A/A’) dorsal overview; (B/B’) medial overview; (C/C’) ventral overview; (D) dorsal overview; (E) eye; (F) retina. Scale bars A-D = 250μM. Scale bar for F = 100μM.
Figure 4—figure supplement 2
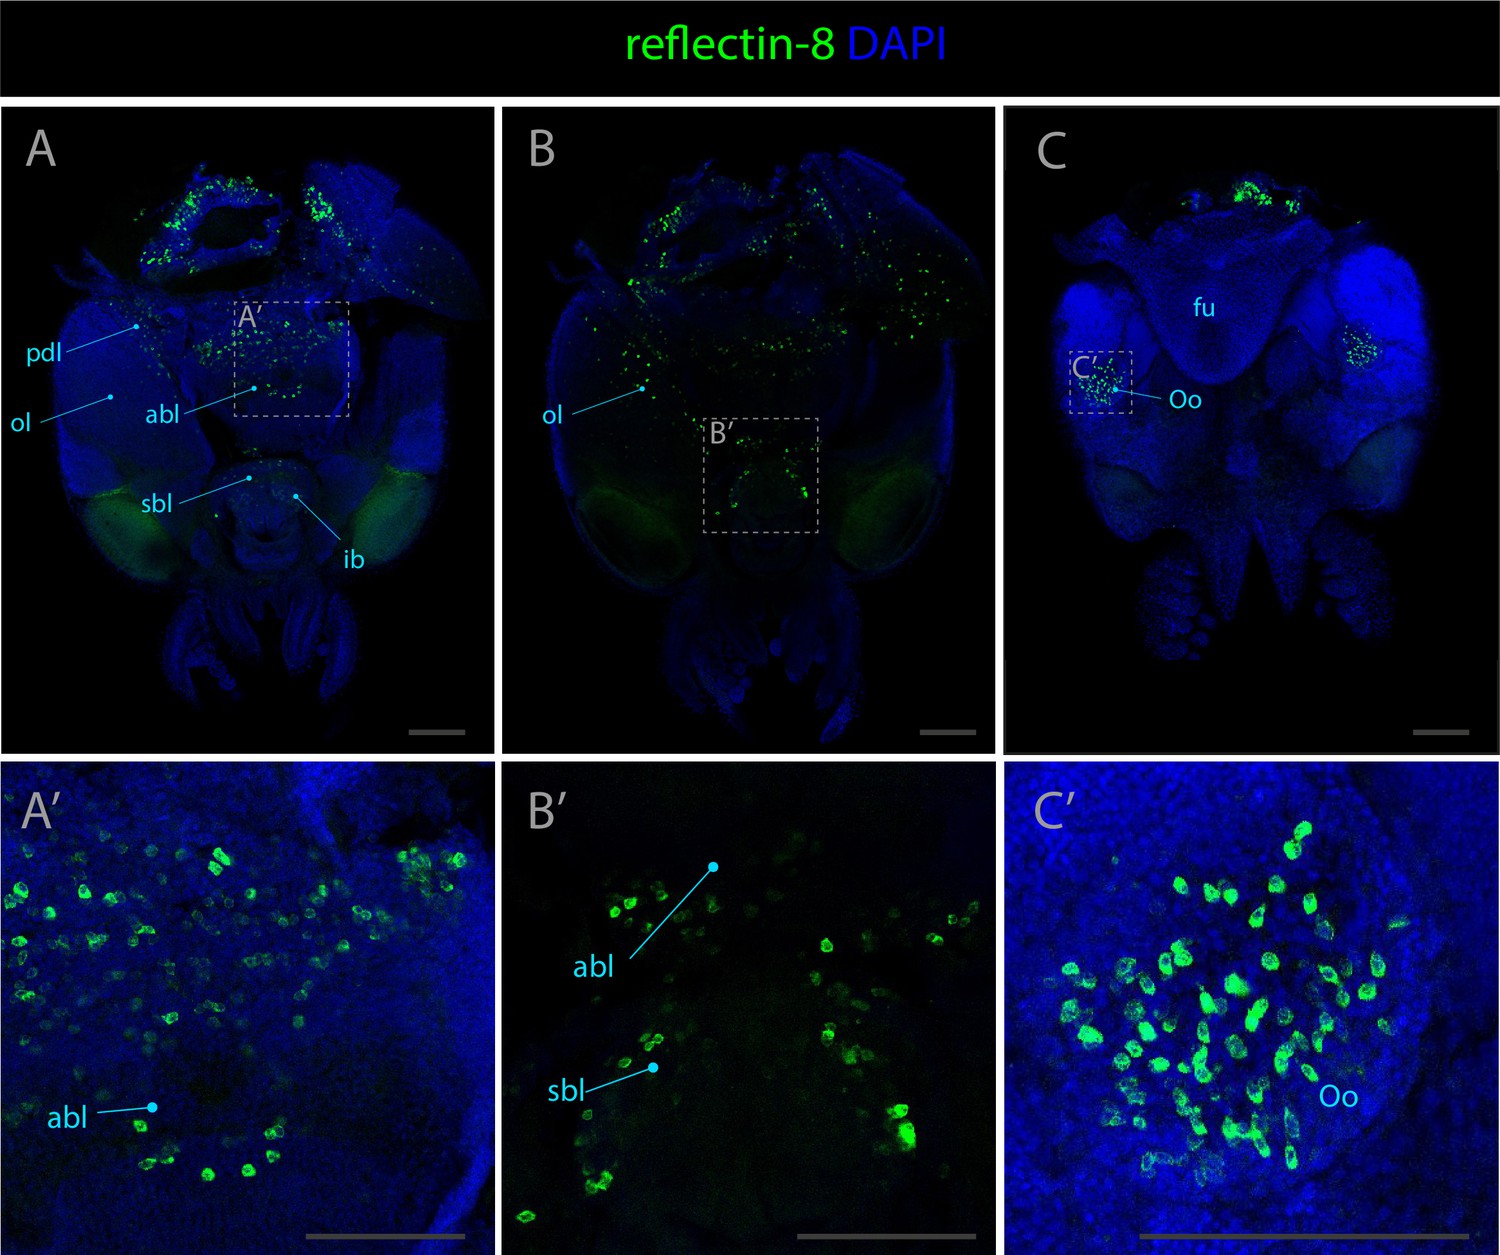
Expression pattern of reflectin-8.
Confocal micrographs showing hybridization chain reactions for reflectin-8 (green), co-stained with DAPI (blue). The areas shown are (A/A’) dorsal overview; (B/B’) medial overview; (C/C’) ventral overview. Abbreviations: (abl) anterior basal lobe, (fu) funnel, (ibl) inferior buccal lobe, (ol) optic lobe, (olf) olfactory lobe, (Oo) olfactory organ, (pdl) peduncle lobe, and (sbl) superior buccal lobe. Scale bars = 250μM.
Figure 5 with 4 supplements

Epidermis, connective tissue, and cephalopod-specific cell types.
(A) Dot plot showing the average expression of marker genes of interest and proportion of cells in each cluster that express these genes. Clusters identified as epidermal, connective tissue, or reflectin+ are labeled in red. (B) Confocal micrographs showing mRNA expression detected by hybridization chain reaction (HCR) for genes involved in epidermis development or function. Cartoons on the top-right corner of each picture indicate the position of the image on a frontal view (top) and the plane of acquisition on sagittal view (bottom). Scale bars = 250μM. (C) Confocal micrographs showing mRNA expression detected by HCR for genes expressed in connective tissue or associated with iridophores and suckers. Cartoons on the top-right corner of each picture indicate the position of the image on a frontal view (top) and the plane of acquisition on sagittal view (bottom). Scale bars = 250 μM. (a3) arm 3, (dbl) dorsal basal lobe, (fl) frontal lobe, (L1) epidermal lines 1, (mbl) medial basal lobe, (ol) optic lobe, (Oo) olfactory organ, (s) suckers, (sbl) superior buccal lobe, (t) tentacles, (ve) ventral epidermis.
Figure 5—figure supplement 1
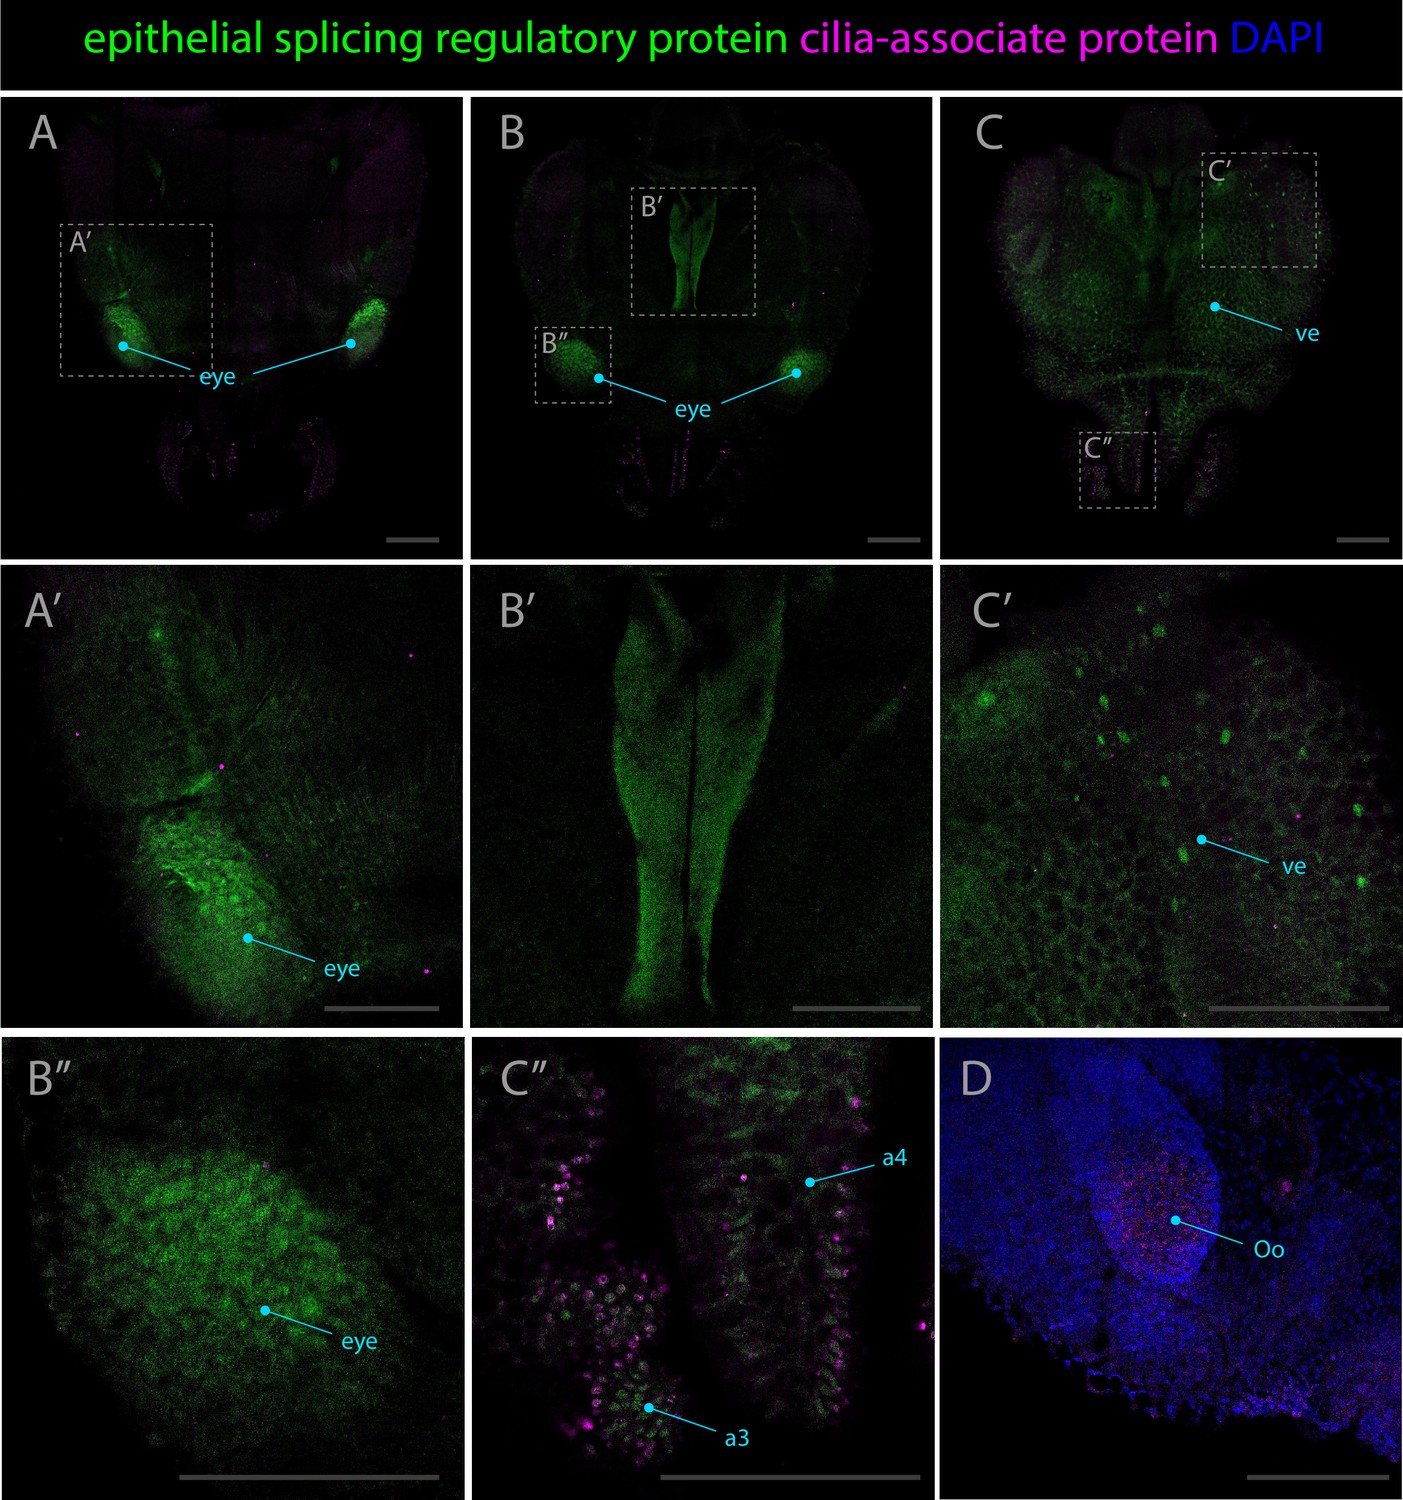
Expression patterns of the epithelial splicing regulatory protein and cilia-associated protein genes.
Confocal micrographs showing hybridization chain reactions for epithelial splicing regulatory protein (green) and cilia-associated protein (magenta). The areas shown are (A/A’) dorsal overview; (B/B’/B’’) medial overview; (C/C’/C’’) ventral overview; (D) ventral surface around the olfactory organ, co-stained with DAPI (blue). Abbreviations: (a3/a4) arm pairs 3 and 4, (Oo) olfactory organ,and (ve) ventral epidermis. Scale bars = 250μM.
Figure 5—figure supplement 2
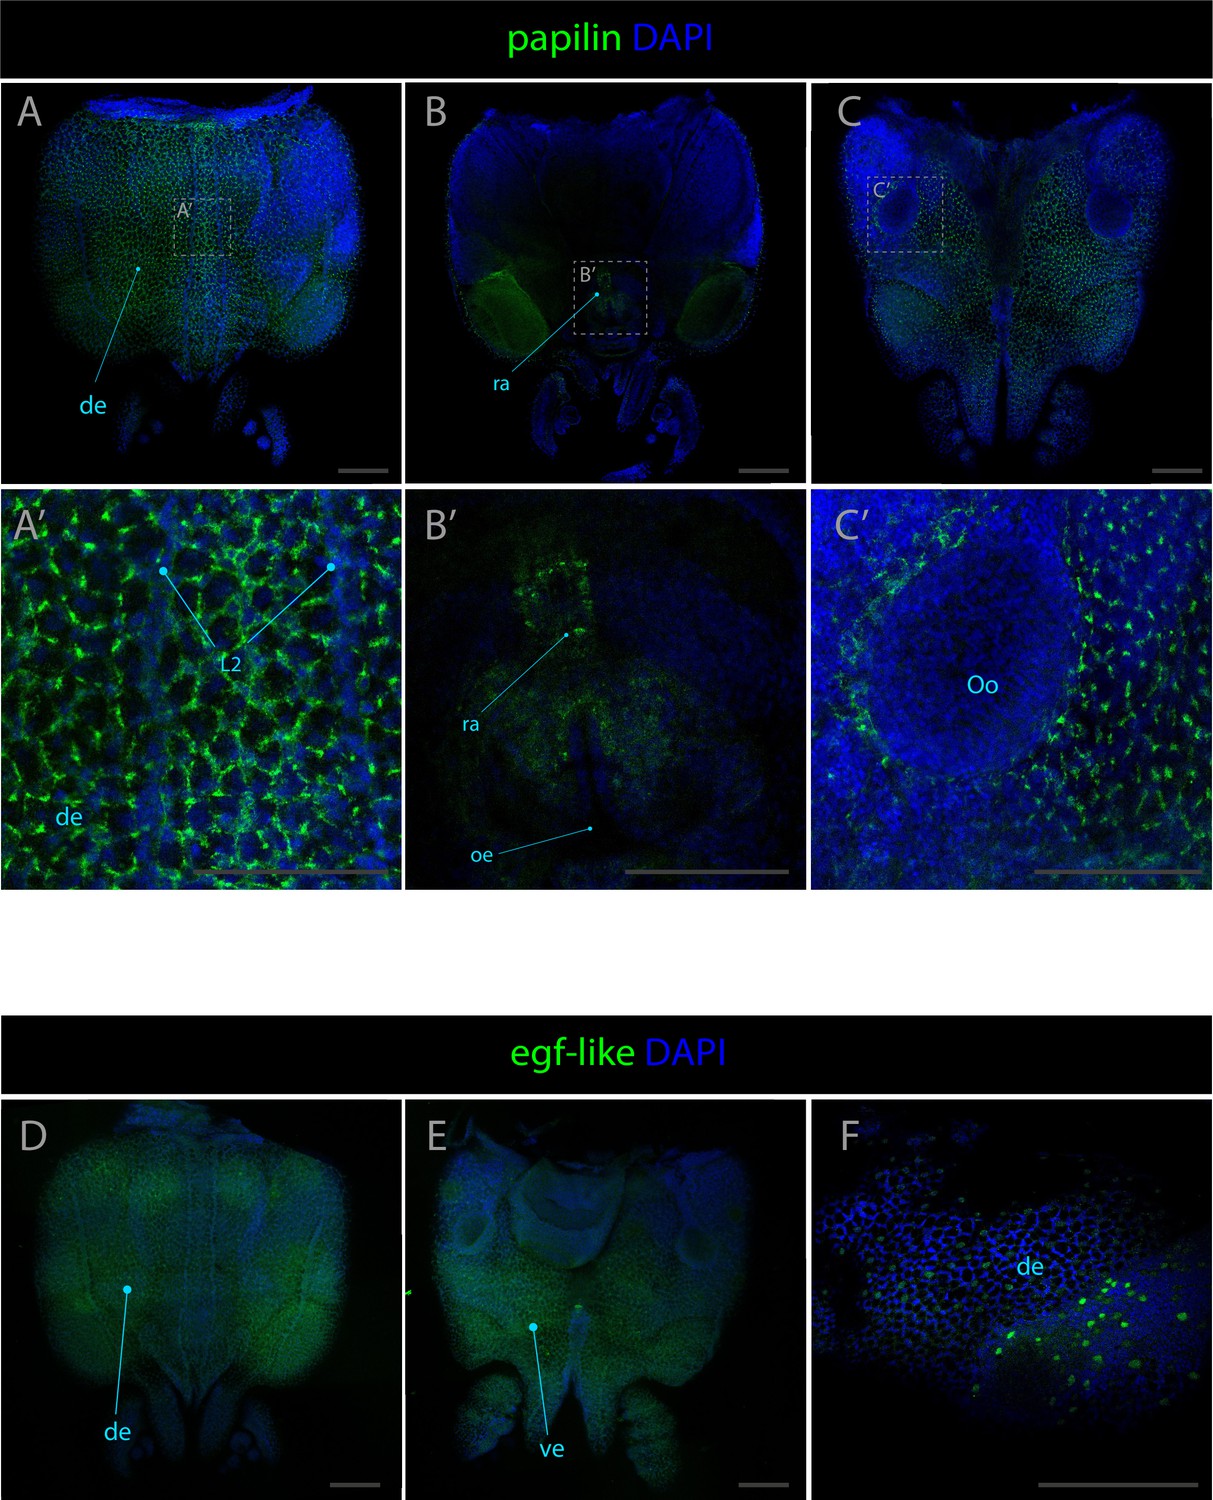
Expression patterns of papilin and egf-like.
Confocal micrographs showing hybridization chain reactions for papilin and egf-like, co-stained with DAPI (blue). The areas shown are (A/A’) dorsal overview; (B/B’) medial overview; (C/C’) ventral overview; (D) dorsal overview; (E) medial overview; (F) ventral overview. Abbreviations: (de) dorsal epidermis, (L2) epidermal lines 2 (oe) oesophagus, (Oo) olfactory organ, (ra) radula, (ve) ventral epidermis. Scale bars = 250μM.
Figure 5—figure supplement 3
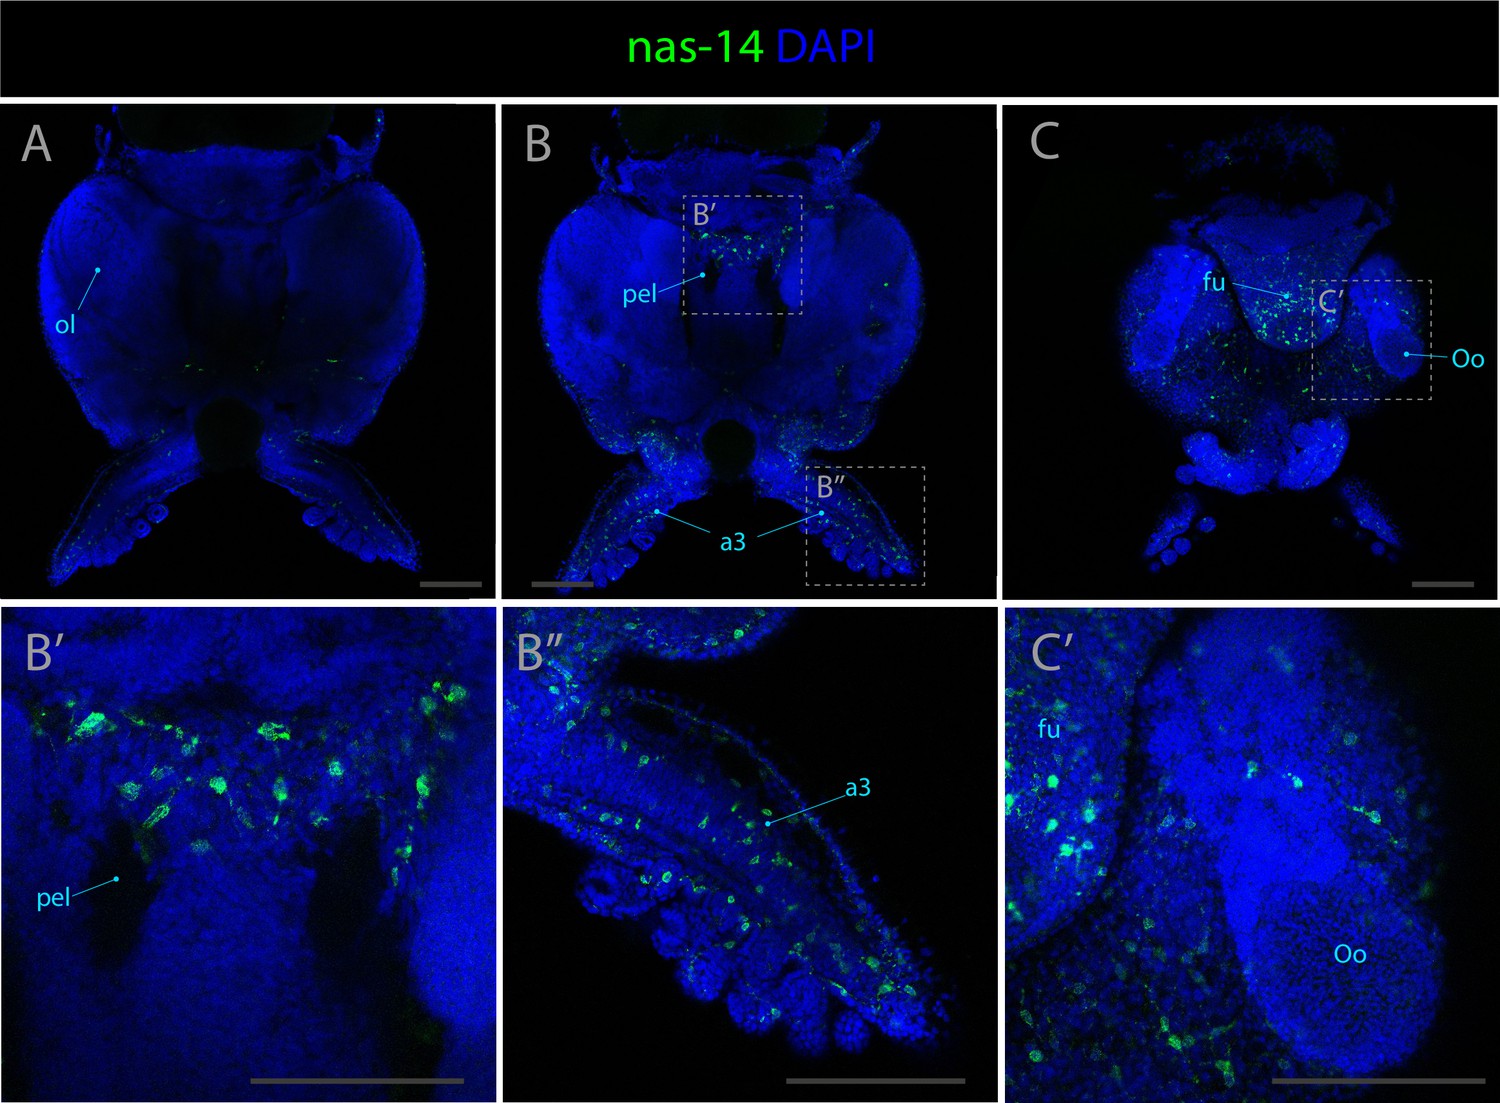
Expression patterns of nas-14.
Confocal micrographs showing hybridization chain reactions for nas-14, co-stained with DAPI (blue). The areas shown are (A) dorsal overview; (B/B’/B’’) medial overview; (C/C’) ventral overview. Abbreviations: (a3) arm pair number 3, (fu) funnel, (oe) oesophagus, (ol) optic lobe, (Oo) olfactory organ, (pel) pedal lobe. Scale bars = 250μM.
Figure 5—figure supplement 4
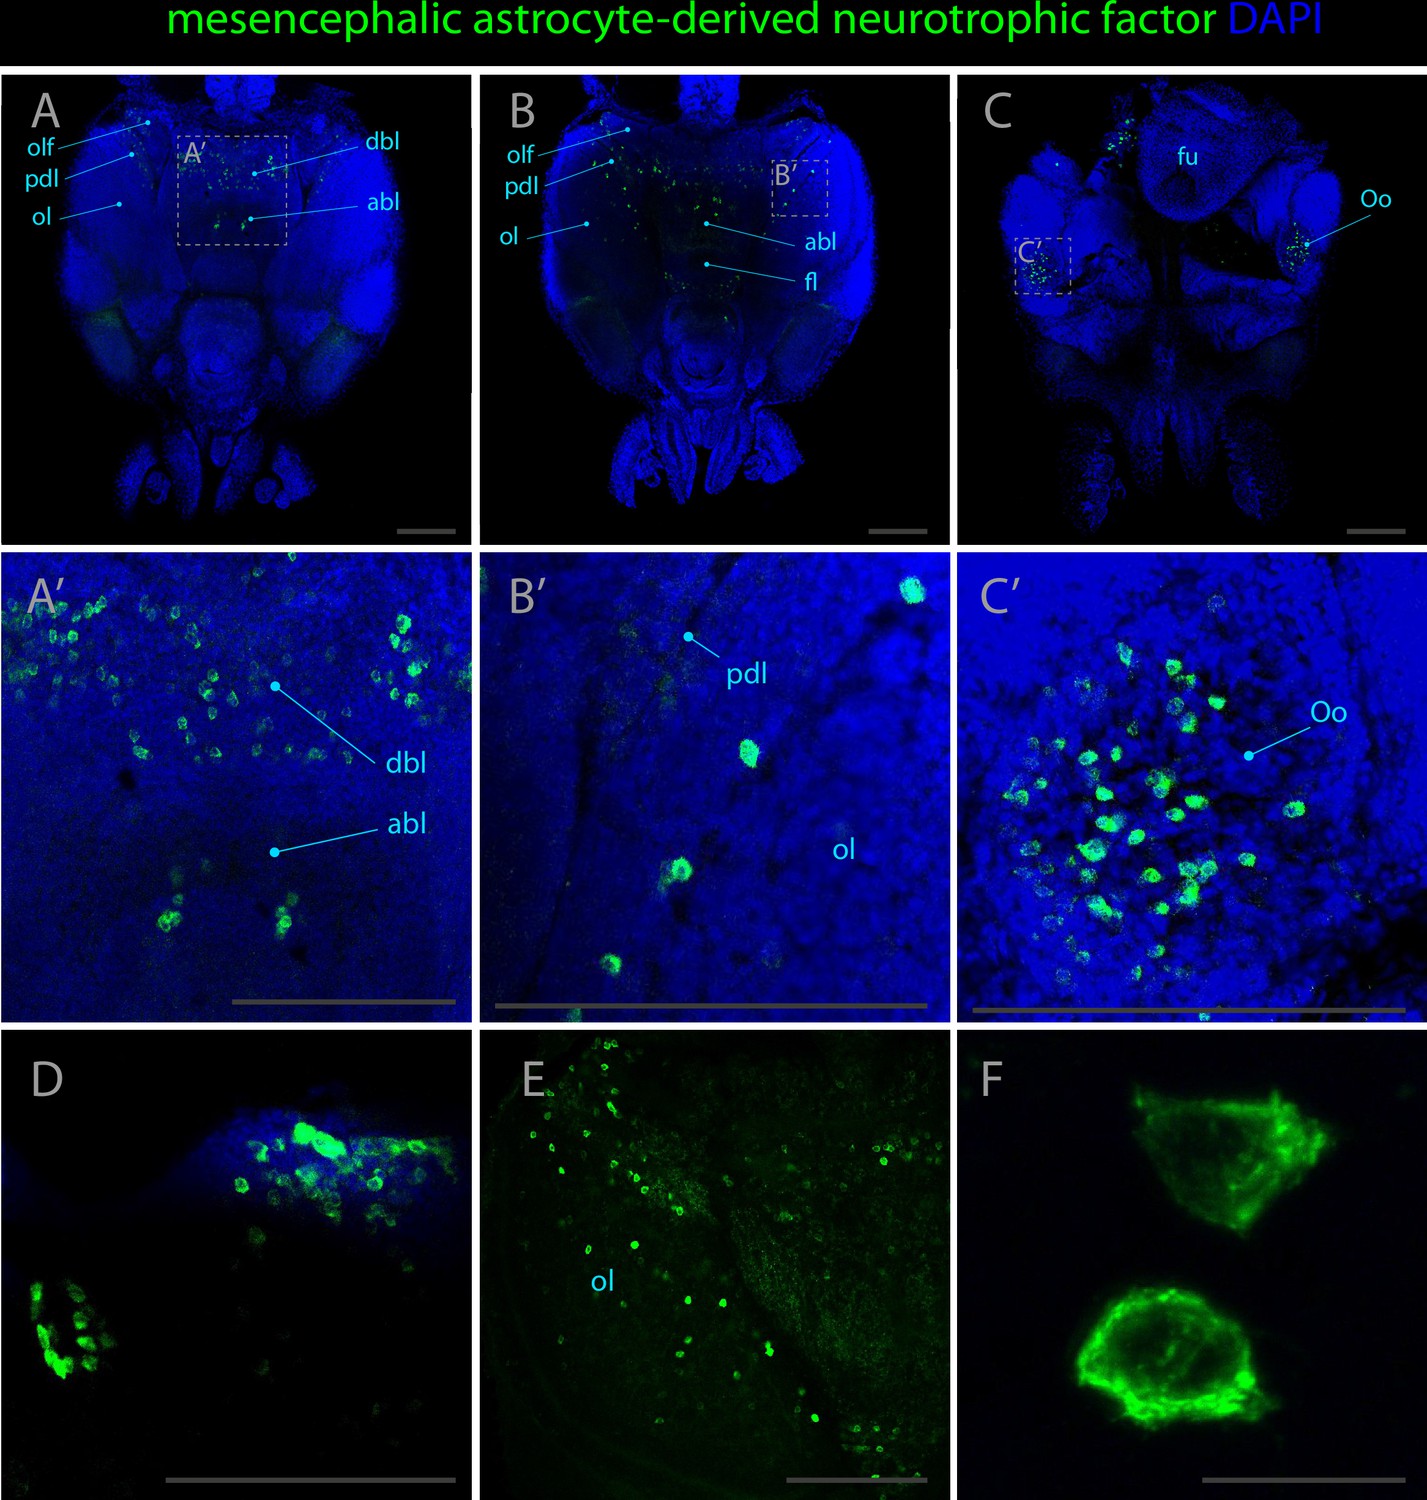
Expression pattern of mesencephalic astrocyte derived neurotrophic factor.
Confocal micrographs showing hybridization chain reactions for mesencephalic astrocyte derived neurotrophic factor (green), co-stained with DAPI (blue). The areas shown are (A/A’) dorsal overview; (B/B’) medial overview; (C/C’) ventral overview; (D) region adjacent to the funnel; (E) optic lobe without DAPI staining; (F) cells at high magnification. Abbreviations: (abl) anterior basal lobe, (dbl) dorsal basal lobe, (fl) frontal lobe, (fu) funnel, (ol) optic lobe, (olf) olfactory lobe, (Oo) olfactory organ, (opl) outer plexiform layer, and (pdl) peduncle lobe. Scale bars A-E = 250μM. Scale bar F = 20μM.
Additional files
-
Supplementary file 1
Table of top 100 marker genes of all clusters.
Top differentially expressed marker genes of all clusters.
- https://cdn.elifesciences.org/articles/80670/elife-80670-supp1-v2.zip
-
Supplementary file 2
Table of top 10 marker genes of neuronal clusters.
Top differentially expressed marker genes of clusters with neuronal identity.
- https://cdn.elifesciences.org/articles/80670/elife-80670-supp2-v2.zip
-
Supplementary file 3
Table of top 100 marker genes of progenitors in Seurat.
The 100 most differentially expressed markers obtained with Seurat in progenitor subclusters.
- https://cdn.elifesciences.org/articles/80670/elife-80670-supp3-v2.zip
-
Supplementary file 4
Table of top 100 marker genes of progenitors in Monocle.
The 100 most differentially expressed markers obtained with Monocle in progenitor subclusters.
- https://cdn.elifesciences.org/articles/80670/elife-80670-supp4-v2.zip
-
MDAR checklist
- https://cdn.elifesciences.org/articles/80670/elife-80670-mdarchecklist1-v2.pdf
Download links
A two-part list of links to download the article, or parts of the article, in various formats.
Downloads (link to download the article as PDF)
Open citations (links to open the citations from this article in various online reference manager services)
Cite this article (links to download the citations from this article in formats compatible with various reference manager tools)
Molecular characterization of cell types in the squid Loligo vulgaris
eLife 12:e80670.
https://doi.org/10.7554/eLife.80670


