Continuous sensing of IFNα by hepatic endothelial cells shapes a vascular antimetastatic barrier
- Division of Immunology, Transplantation and Infectious Diseases, IRCCS San Raffaele Scientific Institute, Italy
- Vita-Salute San Raffaele University, Italy
- Center for Omics Sciences, IRCCS San Raffaele Hospital, Italy
- Experimental Imaging Center, IRCCS San Raffaele Scientific Institute, Italy
- Division of Experimental Oncology, IRCCS San Raffaele Scientific Institute, Italy
Figures
Figure 1 with 1 supplement
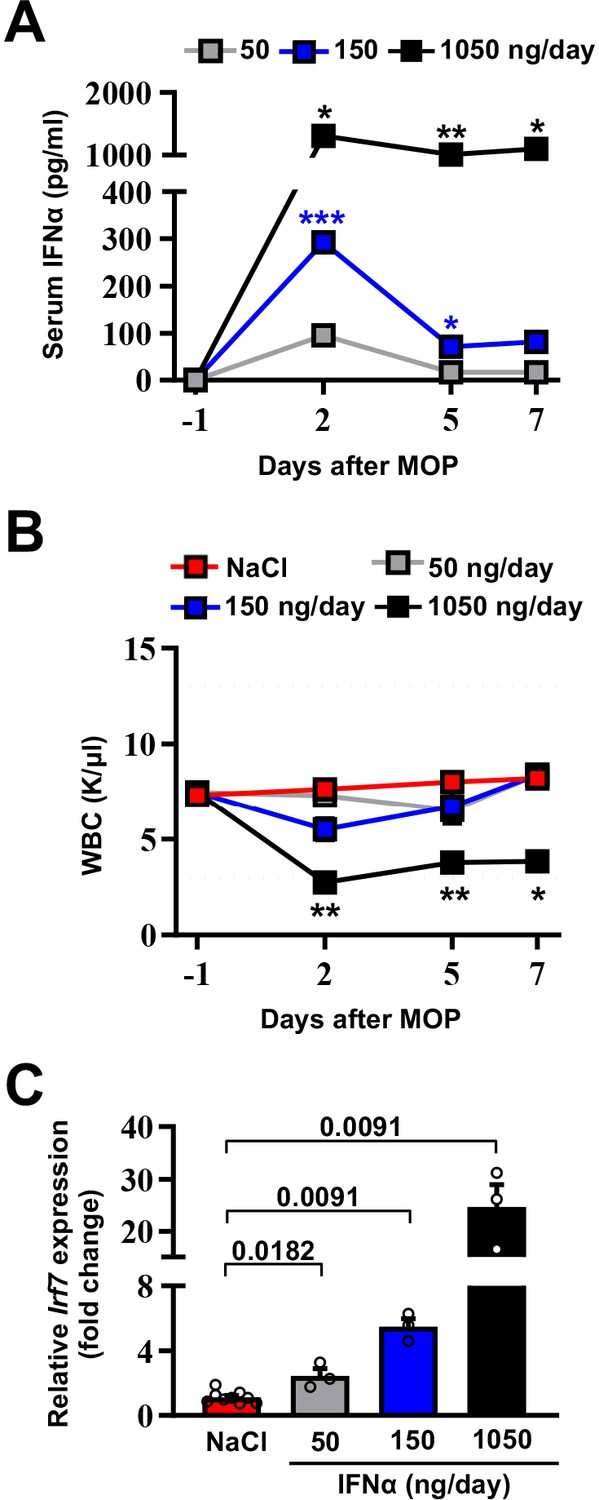
Selection of the optimal IFNα dosing regimen.
(A) Quantification of plasma IFNα concentration from mice continuously treated with different IFNα doses at the indicated time points. Mean values ± SEM are shown; p-values were calculated by one-way ANOVA Tukey’s multiple comparison test. Significant p-values refer to the IFNα 50 ng/day group, since NaCl-treated animals had IFNα plasma levels below the assay detection limit. p≤0.05; **p≤0.01; ***p≤0.001. (B) White blood cell (WBC) counts of mice treated with different IFNα doses at indicated time points. Horizontal dashed lines delimit normal WBC range. Mean value ± SEM are shown; p-values were calculated by one-way ANOVA Tukey’s multiple comparison test. Significant p-values are referred to the NaCl group. *p≤0.05; **p≤0.01. (C) Quantitative real-time PCR analysis of Irf7 mRNA expression from liver tissues of mice treated with different IFNα doses for 7 days. Basal Irf7 mRNA expression level was determined in control mice (NaCl; n=9) and the relative expression of Irf7 upon IFNα treatment is shown (n=3, for each IFNα-treated group). Mean values ± SEM are shown; p-values were calculated by Mann-Whitney test.
-
Figure 1—source data 1
Data for the dose-response curves in the figure.
- https://cdn.elifesciences.org/articles/80690/elife-80690-fig1-data1-v1.zip
Figure 1—figure supplement 1
Selection of the optimal IFNα dosing regimen.
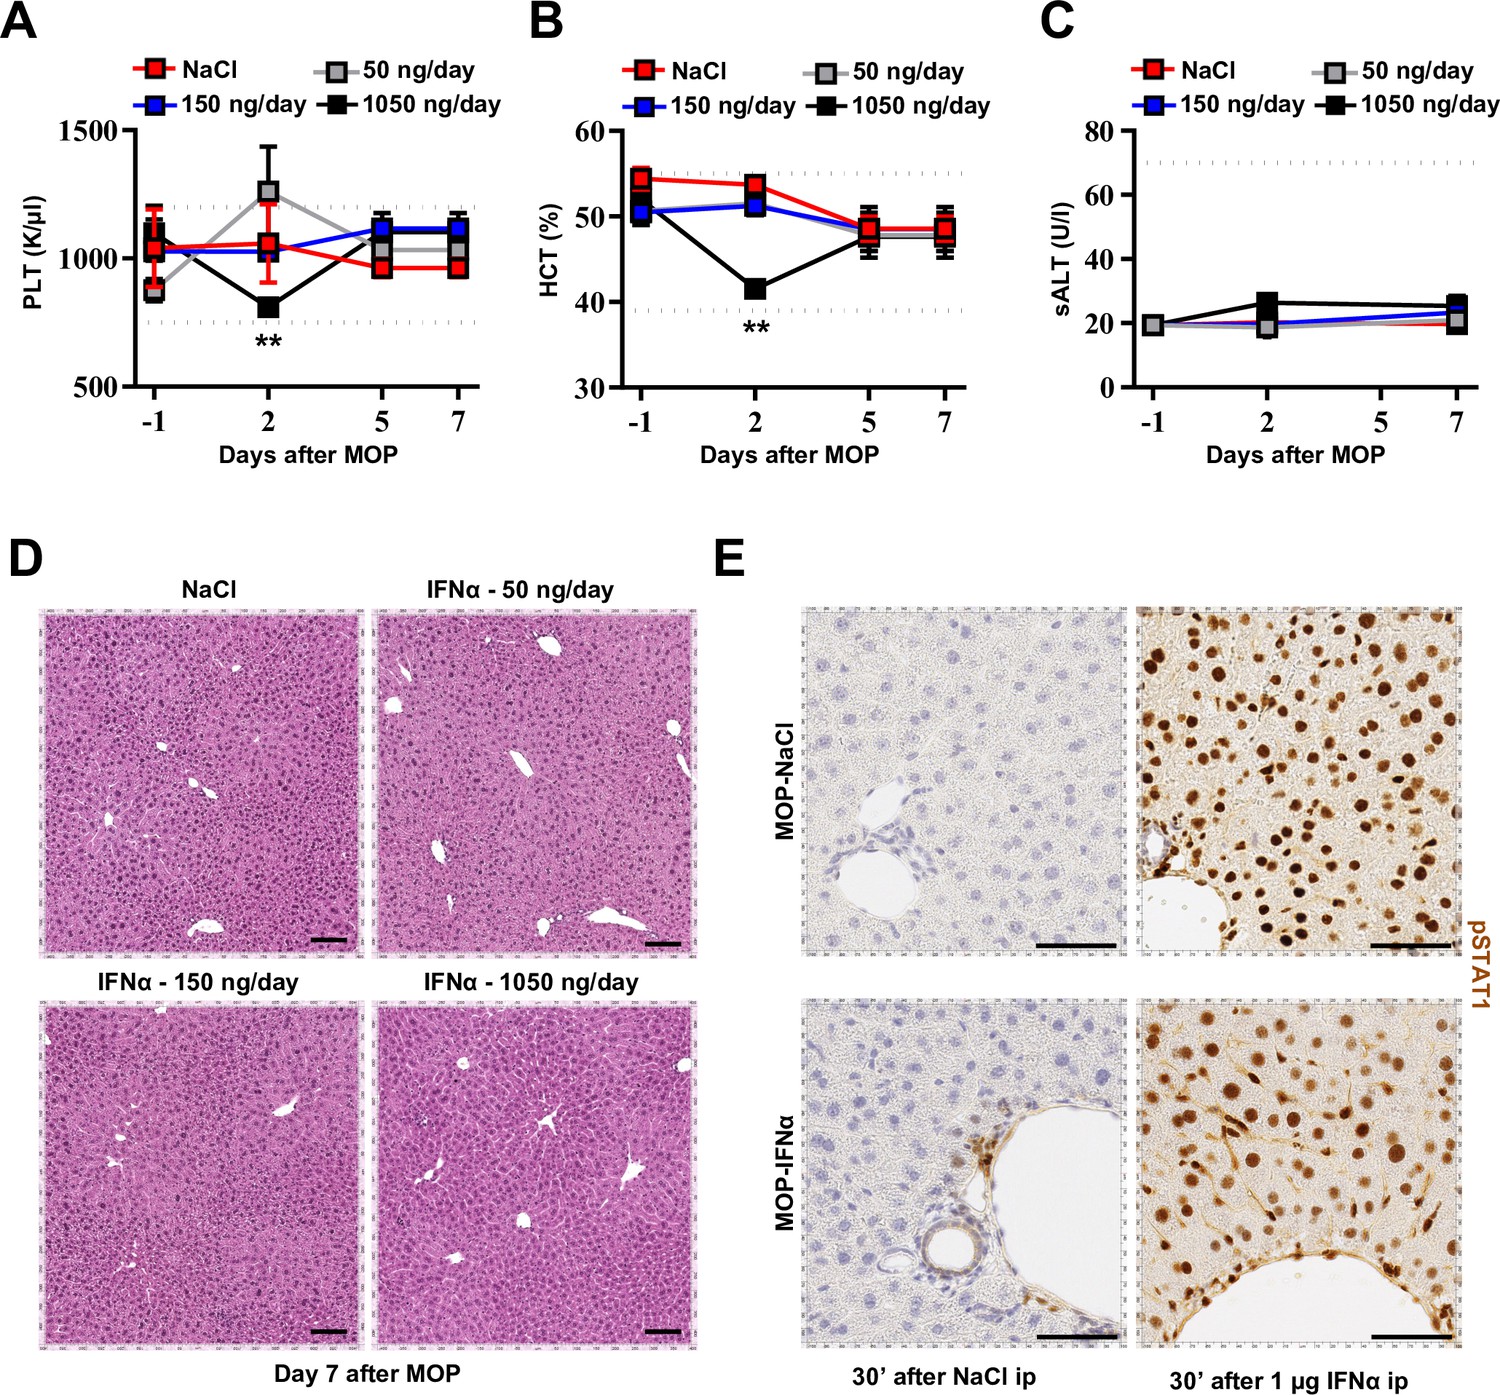
(A) Platelet (PLT) count from mice treated with NaCl (n=9) or different IFNα doses at the indicated time points (n=3 each). Horizontal dashed lines delimit normal PLT range. Mean value ± SEM are shown; p-values were calculated by one-way ANOVA Tukey’s multiple comparison test. Significant p-values are referred to NaCl group. **p≤0.01. (B) Hematocrit (HCT) from mice treated with NaCl or different IFNα doses at indicated time points. Horizontal dashed lines delimit normal HCT range. Mean value ± SEM are shown; p-values were calculated by one-way ANOVA Tukey’s multiple comparison test. Significant p-values are referred to NaCl group. **p≤0.01. (C) Serum Alanine Aminotransferases (sALT) quantification in plasma of mice treated with NaCl or different IFNα doses at indicated time points. Horizontal dashed line delimits normal sALT range. Mean values ± SEM are shown. (D) Representative hepatic H&E micrographs from NaCl and IFNα-treated mice with the indicated IFNα doses 7 days after MOP implantation. Scale bar = 100 µm. (E) Representative microscopic images of phospho-STAT1 (pSTAT1) IHC of the liver of mice treated continuously with NaCl or 150 ng/day IFN for 7 days and euthanized 30 min after ip injection with NaCl or 1 µg IFNα. Scale bar = 50 µm. Note that pSTAT1 is expressed only in small clusters of cells in close proximity to the portal circulation (i.e. HECs, stellate cells, or leukocytes) in mice continuously treated with IFNα at day 7 after treatment initiation. Of note, injection of pSTAT1-synchronising doses of IFNα resulted in complete activation of all hepatic cells in both groups of mice, suggesting that IFNα-dependent counterregulatory mechanisms are not induced by continuous IFNα treatment.
-
Figure 1—figure supplement 1—source data 1
Data for the dose-response curves in the figure.
- https://cdn.elifesciences.org/articles/80690/elife-80690-fig1-figsupp1-data1-v1.zip
Figure 2 with 1 supplement
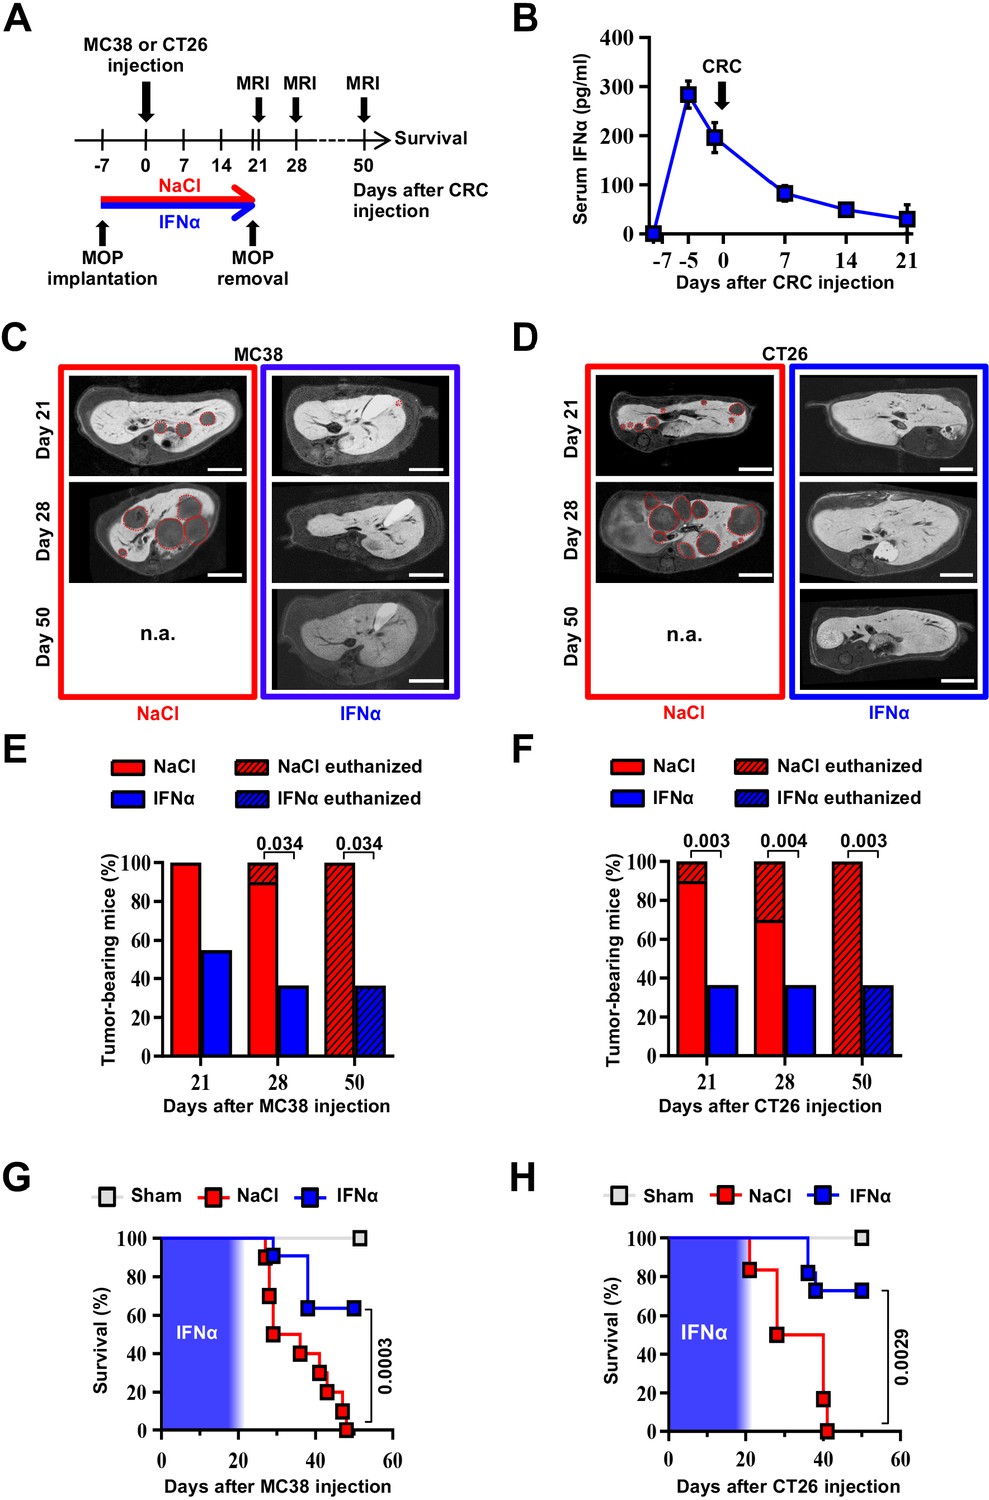
Continuous IFNα administration reduces liver CRC metastatic burden and improves survival.
(A) Schematic representation of the experimental procedure. Intrasplenic injection of 7x10⁴ MC38 or 5x10³ CT26 cells was performed 7 days after continuous NaCl or IFNα therapy. (B) Quantification of plasma IFNα concentration at different time points after continuous IFNα administration (n=6). The time of intrasplenic CRC cell injection has also been depicted. Mean values ± SEM are shown. (C–D) Representative T1 contrast-enhanced magnetic resonance images (MRI) of the liver of mice treated with NaCl (red frame) and IFNα (blue frame) at 21, 28, and 50 days after MC38 (C) or CT26 (D) cells injection. Red dashed lines highlight CRC liver metastases, characterized as hypointense regions in T1-weighted sequences. n.a.=not assessed, is referred to mice euthanized before the specified time point; scale bar = 5 mm. (E–F) Percentage of mice treated with NaCl (MC38 n=3 + 3; CT26 n=5 + 5 for each of two independent experiments) or IFNα (MC38 n=5 + 6; CT26 n=5 + 6 for each of two independent experiments) bearing at least one CRC liver metastasis estimated by MRI analysis at indicated time points after MC38 or CT26 injection. The oblique black line pattern within columns depicts the percentage of mice euthanized before the indicated time point. Mean values are shown; p-values were calculated by Fisher’s exact test. (G–H) Kaplan-Meier survival curves of Sham (n=3), NaCl- (MC38 n=6; CT26 n=10) or IFNα-treated (MC38 n=11; CT26 n=11) mice after MC38 or CT26 cells injection. The blue pattern indicates the time frame of IFNα ip release; p-values were calculated by log-rank/Mantel-Cox test.
-
Figure 2—source data 1
Data for the graphs in the figure.
- https://cdn.elifesciences.org/articles/80690/elife-80690-fig2-data1-v1.zip
Figure 2—figure supplement 1
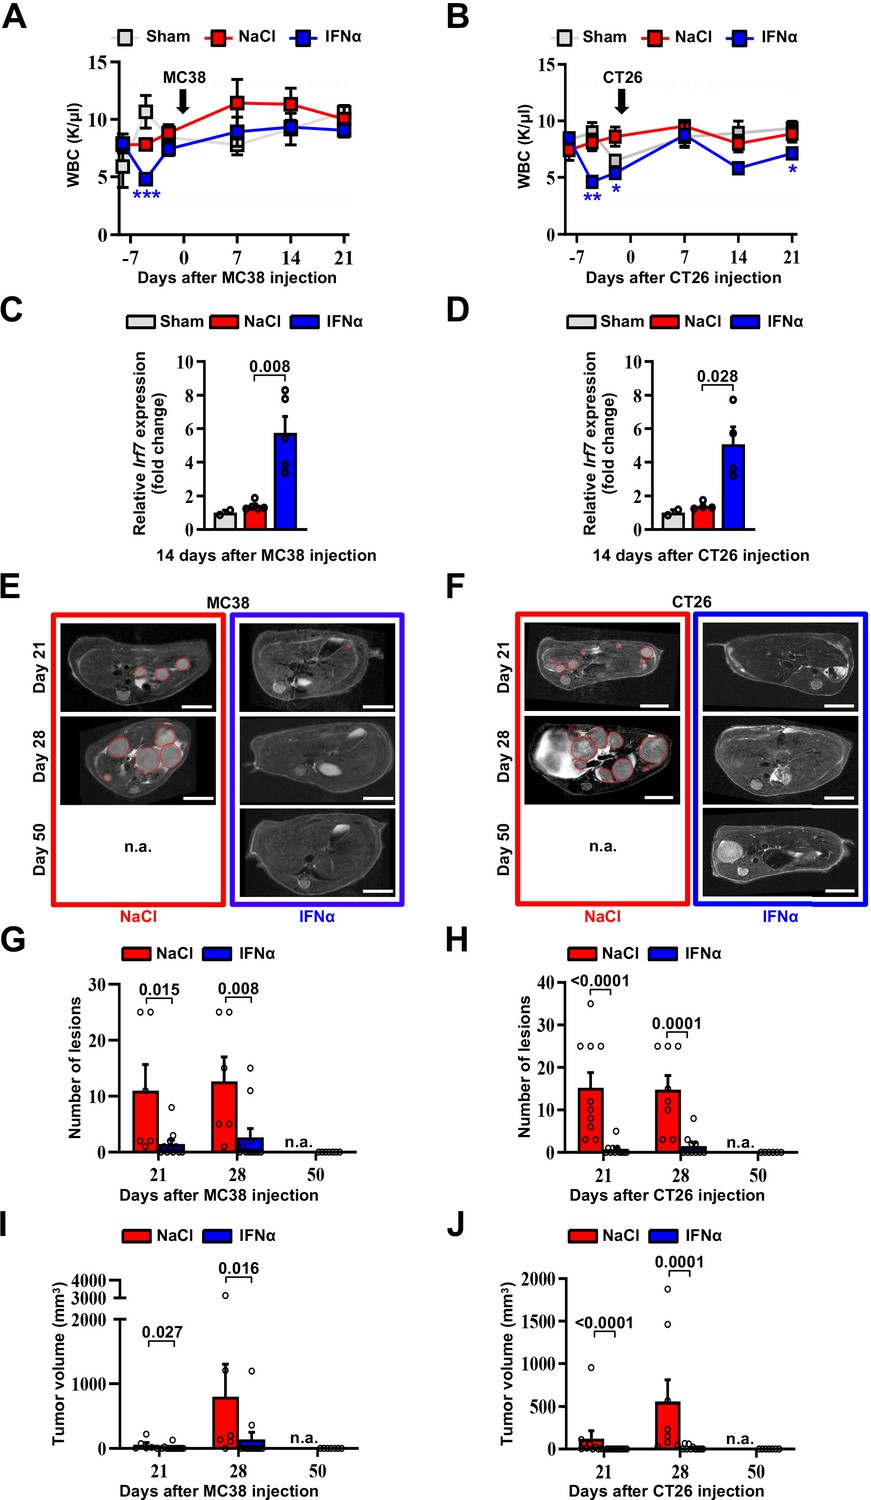
Continuous intraperitoneal IFNα administration reduces MC38 and CT26 metastatic tumor burden without causing significant hematologic toxicity.
(A–B) WBC counts of mice treated with NaCl or IFNα and injected with MC38 (A) or CT26 (B) at the indicated time points. Horizontal dashed lines delimit normal WBC range. (Arrows indicate the time of MC38 or CT26 cells injection.) Mean values ± SEM are shown; p-values were calculated by one-way ANOVA Tukey’s multiple comparison test. Significant p-values are referred to NaCl group. *p≤0.05; **p≤0.01; ***p≤0.001. (C–D), Quantitative real-time PCR analyses of the relative expression levels of the Irf7 mRNAs within the metastatic liver tissue of mice treated with NaCl (n=5) or IFNα (n=5) at 14 days after intrasplenic injection of MC38 or CT26 cells. The basal Irf7 mRNA expression was estimated in the liver tissue of Sham control mice (n=3) and the relative expressions of Irf7 are shown as mean value ± SEM; p-values were calculated by Mann-Whitney test relative to NaCl treated mice. (E–F) Representative T2 MRI analysis of the liver of mice treated with MOP-NaCl (red frame) and MOP-IFNα (blue frame) at 21, 28, and 50 days after injection of MC38 (E) or CT26 (F) cells. Red dashed lines mark CRC liver metastases characterized as slightly-hyperintense regions in T2-weighted Sequences. n.a.=not assessed, is referred to mice euthanized before the specified time point; scale bar: 5 mm. (G–H) Quantification of the number of lesions in the liver of mice treated with MOP-NaCl and MOP-IFNα at indicated time points after MC38 (G) and CT26 (H) cells injection by MRI analysis. Mean values ± SEM are shown; p-values were calculated by Mann-Whitney test; n.a.=not assessed, is referred to mice euthanized before the specified time point. (I–J), Quantification of the total tumor volume in the liver of mice treated with MOP-NaCl and MOP-IFNα at indicated time points after MC38 (I) and CT26 (J) cells injection by MRI analysis. Mean values ± SEM are shown; p-values were calculated by Mann-Whitney test; n.a.=not assessed, is referred to mice euthanized before the indicated time point.
-
Figure 2—figure supplement 1—source data 1
Data for the graphs in the figure.
- https://cdn.elifesciences.org/articles/80690/elife-80690-fig2-figsupp1-data1-v1.zip
Figure 3 with 2 supplements
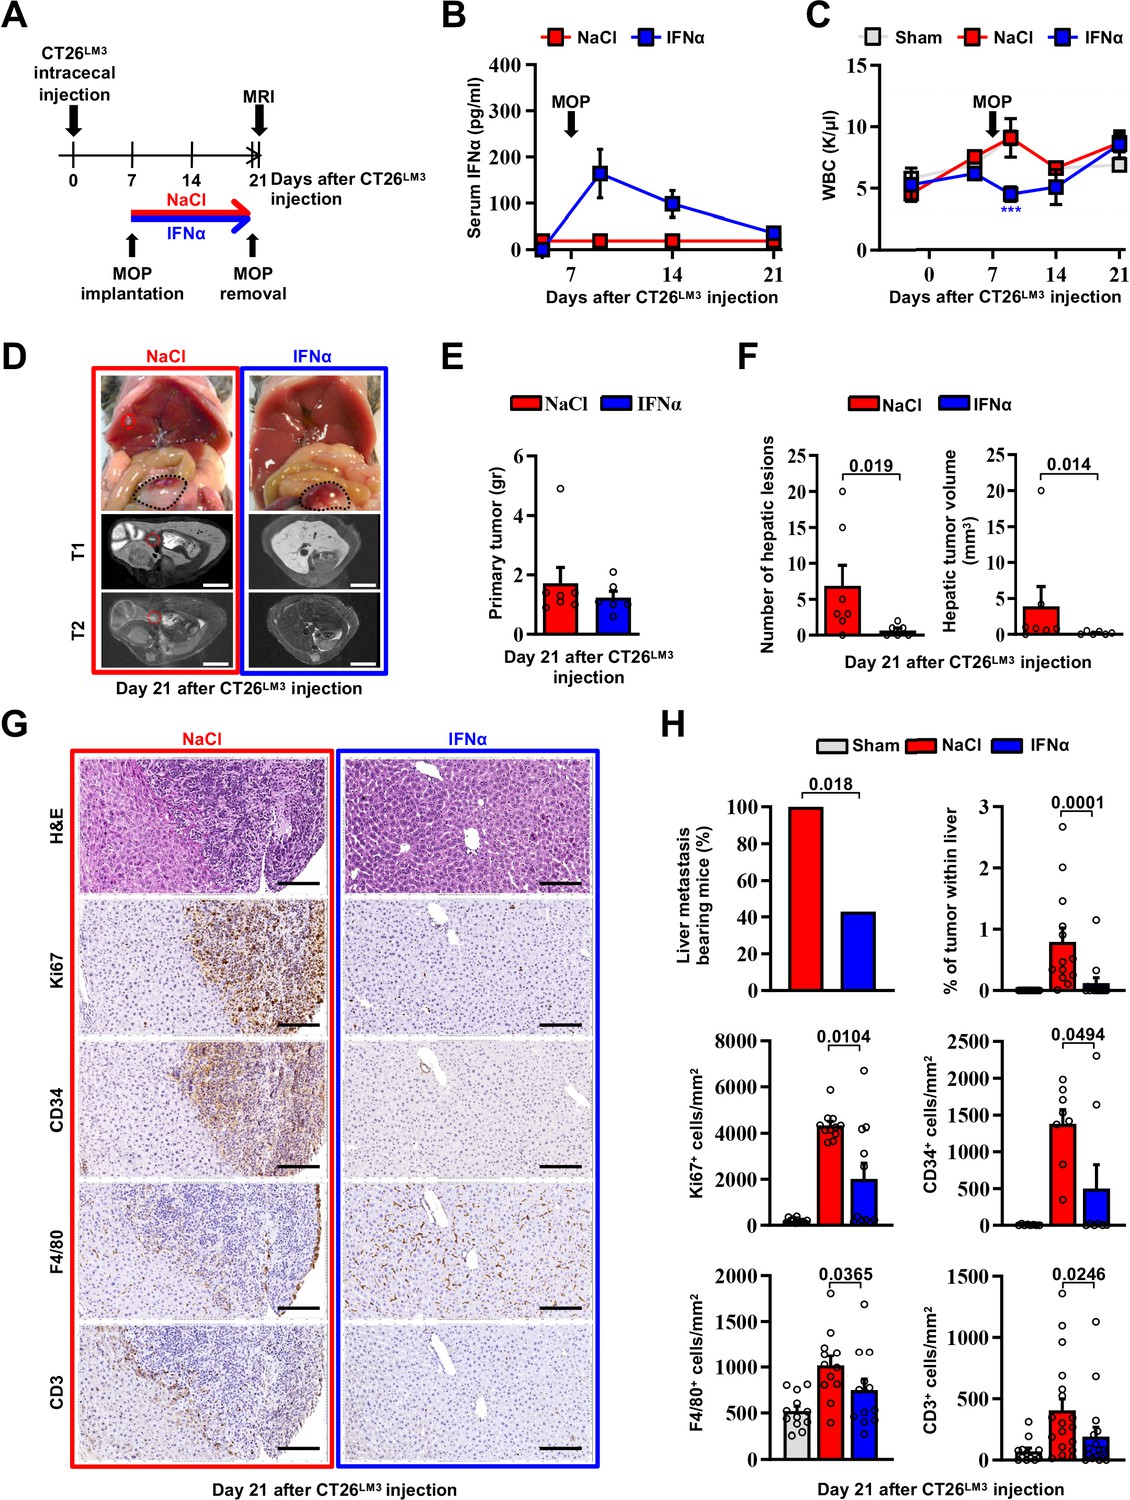
Continuous IFNα administration prevents spontaneous hepatic colonization of orthotopically implanted CT26LM3 cells.
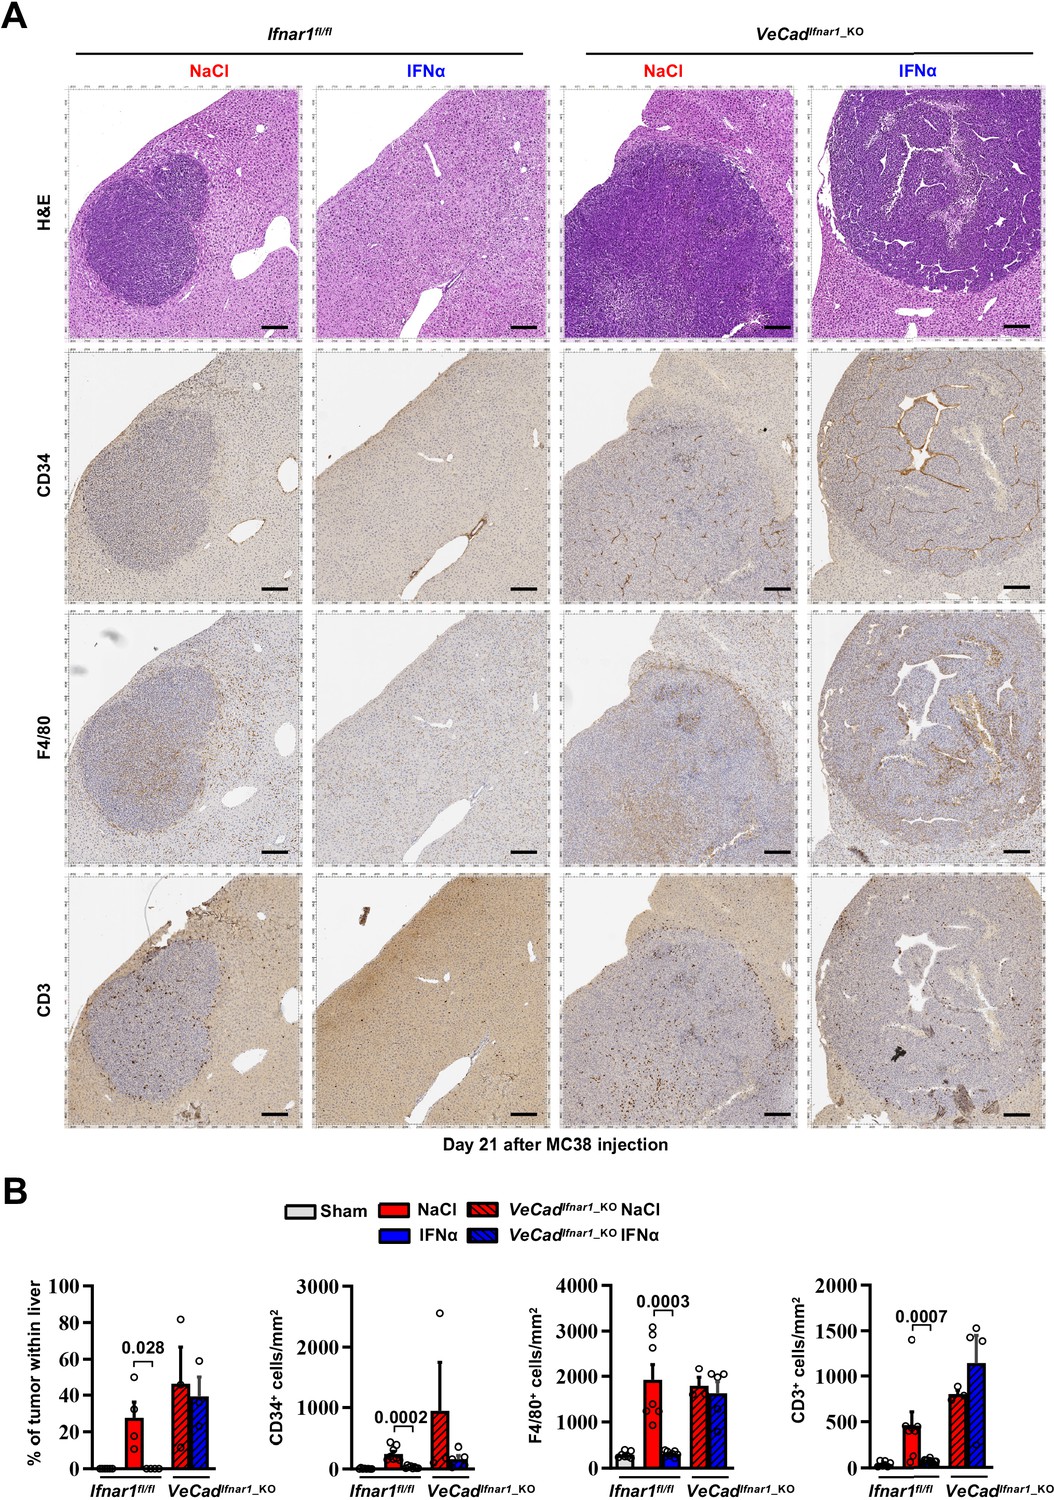
(A) Schematic representation of the experimental procedure. Seven days after intracecal injection of 2x10⁵ CT26LM3 cells, mice were randomly assigned to receive either continuous NaCl (n=7) or IFNα (n=6) administration and analyzed by MRI 14 days later. (B) Quantification of plasma IFNα concentration at the indicated time point after cecal wall injection of CT26LM3 cells in mice described in a. The arrow indicates the time of NaCl or IFNα therapy initiation. Mean values ± SEM are shown. (C) WBC counts from mice described in (A) continuously treated with NaCl or IFNα at indicated time points. Horizontal dashed lines delimit the normal WBC range. The time of MOP implantation has also been depicted. Mean value ± SEM are shown; p-values were calculated by one-way ANOVA Tukey’s multiple comparison test. Significant p-values are referred to NaCl group. ***p≤0.001. (D) Representative images (top panels) of the hepatic lesions and intracecal tumors observed in NaCl- (red frame) and IFNα-treated (blue frame) mice, 21 days after CT26LM3 cells intracecal wall injection, and the corresponding hepatic contrast-enhanced MRI, T1-weighted (middle panels) and T2-weighted (bottom panels) sequences. Red dashed lines identify macroscopic liver metastatic lesions. Scale bars = 5 mm. (E) Quantification of the weight of primary CRC tumors 21 days after CT26LM3 cells intracecal wall injection of mice described in D. (F) Quantification of the number of hepatic lesions and total tumor volume of liver metastases by MRI analysis of mice described in D. Mean values ± SEM are shown; p-values were calculated by Mann-Whitney test. (G) Representative H&E, Ki67, CD34, F4/80, and CD3 immunohistochemical micrographs of liver metastatic lesions found in NaCl- (red frame) and IFNα-treated (blue frame) mice, 21 days after intracecal injection of CT26LM3 cells. Scale bar = 100 μm. (H) Quantification of the percentage of mice bearing liver metastases, as well as the percentage of tumor area and the number of cells expressing Ki67, CD34, F4/80, and CD3 per mm2 determined by IHC. Immunohistochemical measurements were conducted on at least 1000 mm2 of total liver area for both experimental conditions. Mean values ± SEM are shown; p-values were calculated by Mann-Whitney test.
-
Figure 3—source data 1
Data for the graphs in the figure.
- https://cdn.elifesciences.org/articles/80690/elife-80690-fig3-data1-v1.zip
Figure 3—figure supplement 1
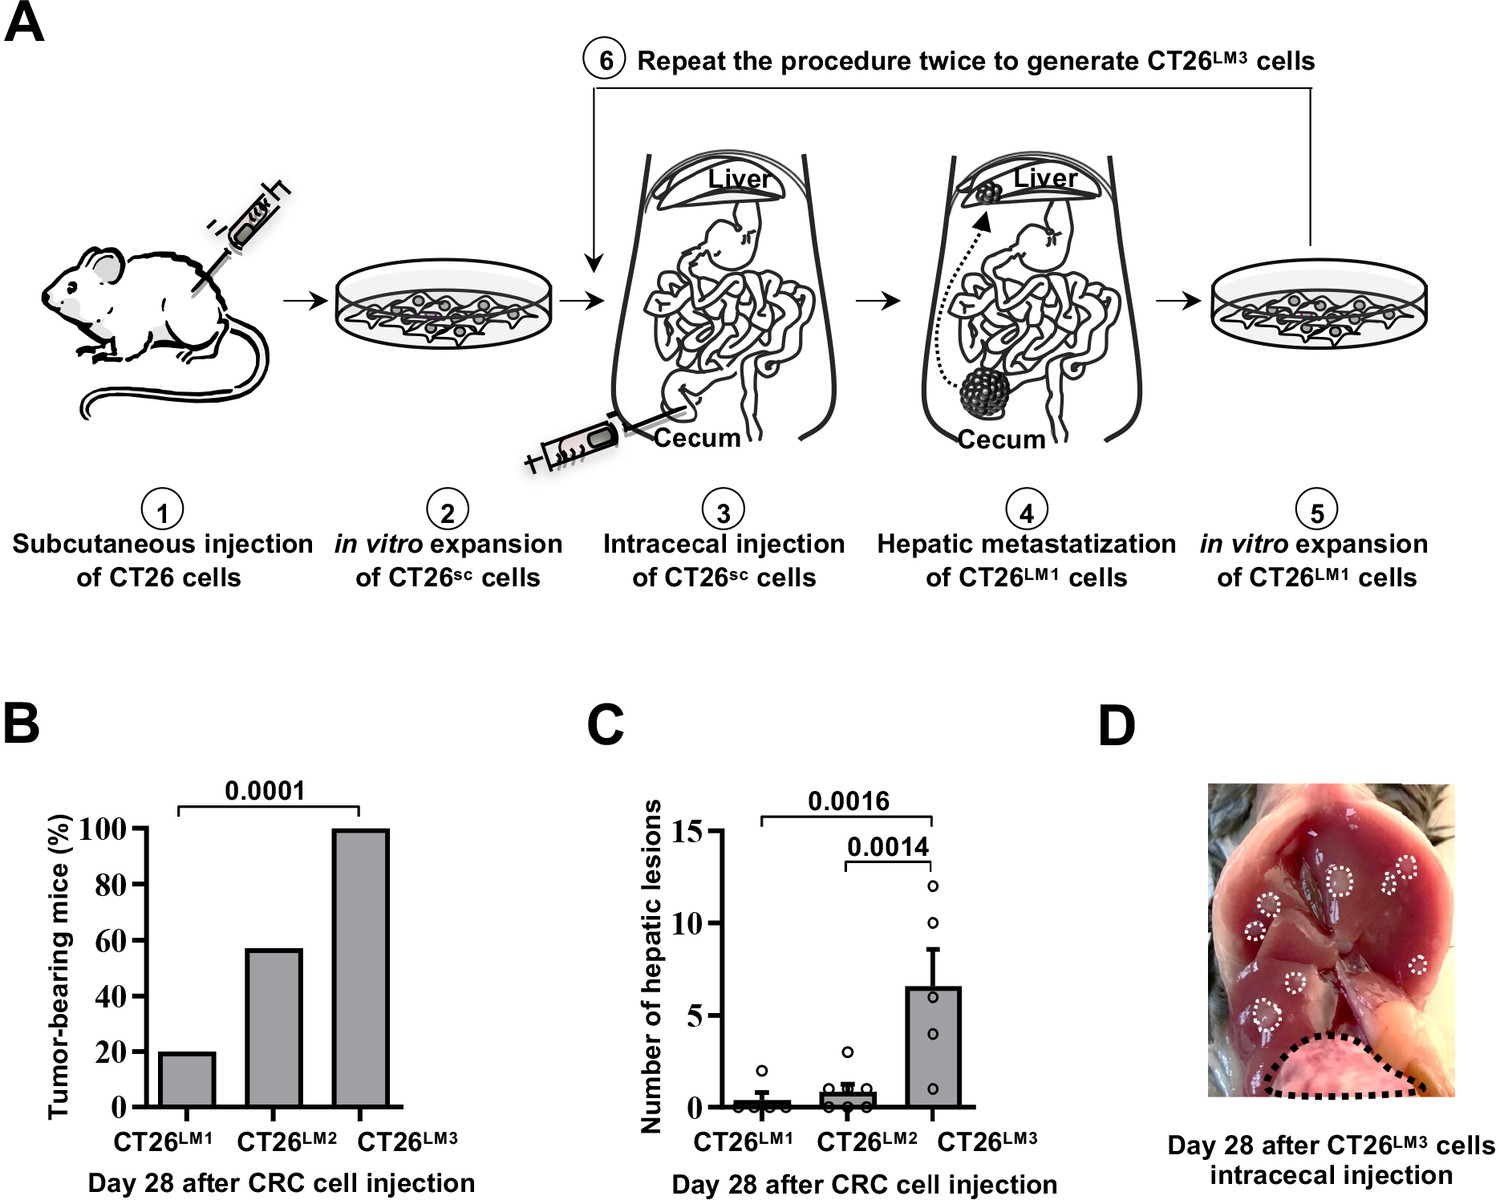
In vivo selection of CT26LM3 cells with increased spontaneous liver metastatic potential.
(A) Schematic representation of the experimental procedure. (1) 2x10⁶ CT26 cells were grown subcutaneously (sc) c into NSG immunodeficient mice. (2) Excised tumors were disaggregated and cultured in vitro to generate CT26sc cells. (3) 2x10⁶ CT26sc cells were injected into the cecal wall of immunocompetent CB6 mice. (4) After 28 days, the number of liver metastatic foci that arised from primary cecal tumors were counted and (5) metastatic liver tumor cells were isolated and cultured in vitro to generate CT26LM1 cells. (6) 2x10⁵ CT26LM1 cells were injected into the cecal wall of a new immunocompetent mice to obtain CT26LM2 cells. The procedure was repeated with 2x10⁵ CT26LM2 cells to obtain CT26LM3 cells. (B) Percentage of mice bearing at least one macroscopic liver metastasis 28 days after intracecal wall injection of CT26LM1 (n=5), CT26LM2 (n=7) or CT26LM3 (n=5) cells. Mean values are shown; p-value was calculated by Fisher’s exact test. (C) Number of hepatic lesions in the same mice described in (B). Mean values ± SEM are shown; p-values were calculated by Mann-Whitney test. (D) Representative image of the hepatic lesions observed in mice 28 days after intracecal injection of CT26LM3. Black dashed line identifies macroscopic cecal primary tumor whereas white dashed lines delineate liver metastatic lesions.
-
Figure 3—figure supplement 1—source data 1
Data for the graphs in the figure.
- https://cdn.elifesciences.org/articles/80690/elife-80690-fig3-figsupp1-data1-v1.zip
Figure 3—figure supplement 2
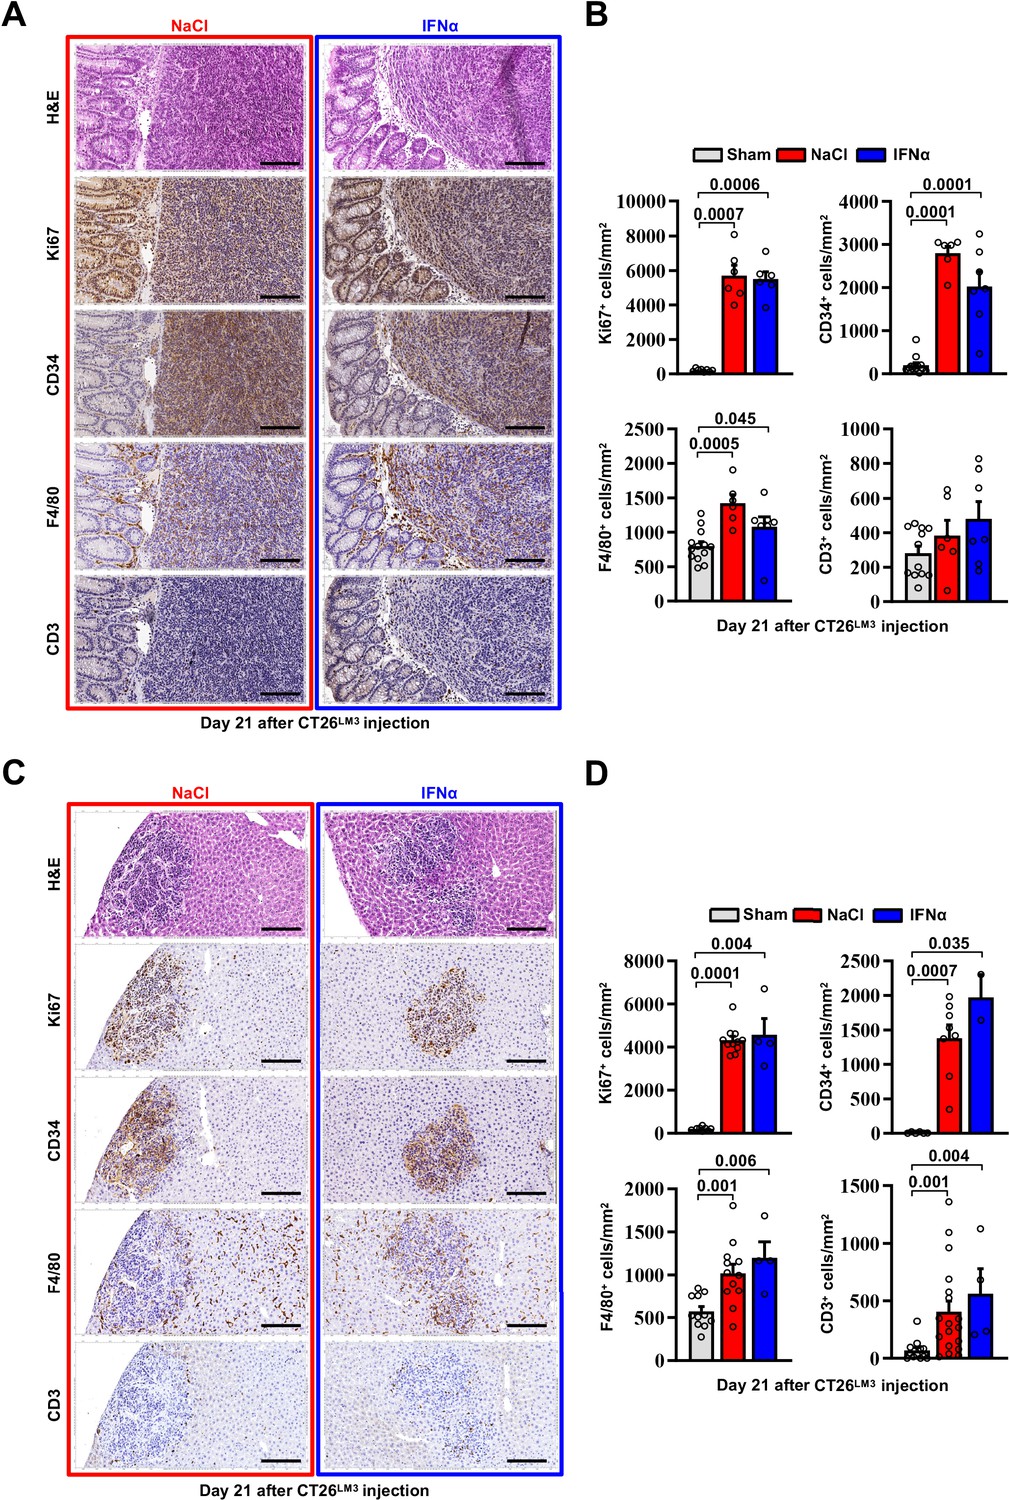
Immunophenotypic analysis of primary tumors and liver metastases in the orthotopic CT26LM3 model.
(A) Representative H&E, Ki67, CD34, F4/80, and CD3 immunohistochemical micrographs of primary CRC cecal tumors developed in NaCl- (red frame) and IFNα-treated (blue frame) mice, 21 days after intracecal injection of CT26LM3 cells. Scale bar = 100 μm. (B) Quantification of the number of cells expressing Ki67, CD34, F4/80, and CD3 per mm2 determined by IHC. Immunohistochemical measurements were conducted on at least 1000 mm2 of total liver area of sham mice and within all metastatic lesions found in both experimental conditions. Mean values ± SEM are shown; p-values were calculated by Mann-Whitney test. (C) Representative H&E, Ki67, CD34, F4/80, and CD3 immunohistochemical micrographs showing liver tumor characteristics of metastases found in NaCl- (red frame) and IFNα-treated (blue frame) mice, 21 days after intracecal injection of CT26LM3 cells. Scale bar = 100 μm. (D) Quantification of the number of cells expressing Ki67, CD34, F4/80, and CD3 per mm2 determined by IHC. Immunohistochemical measurements were conducted on at least 1000 mm2 of total liver area of sham mice and within all metastatic lesions found in both experimental conditions. Mean values ± SEM are shown; p-values were calculated by Mann-Whitney test.
-
Figure 3—figure supplement 2—source data 1
Data for the graphs in the figure.
- https://cdn.elifesciences.org/articles/80690/elife-80690-fig3-figsupp2-data1-v1.zip
Figure 4 with 3 supplements
HECs mediate the antimetastatic activity of IFNα.
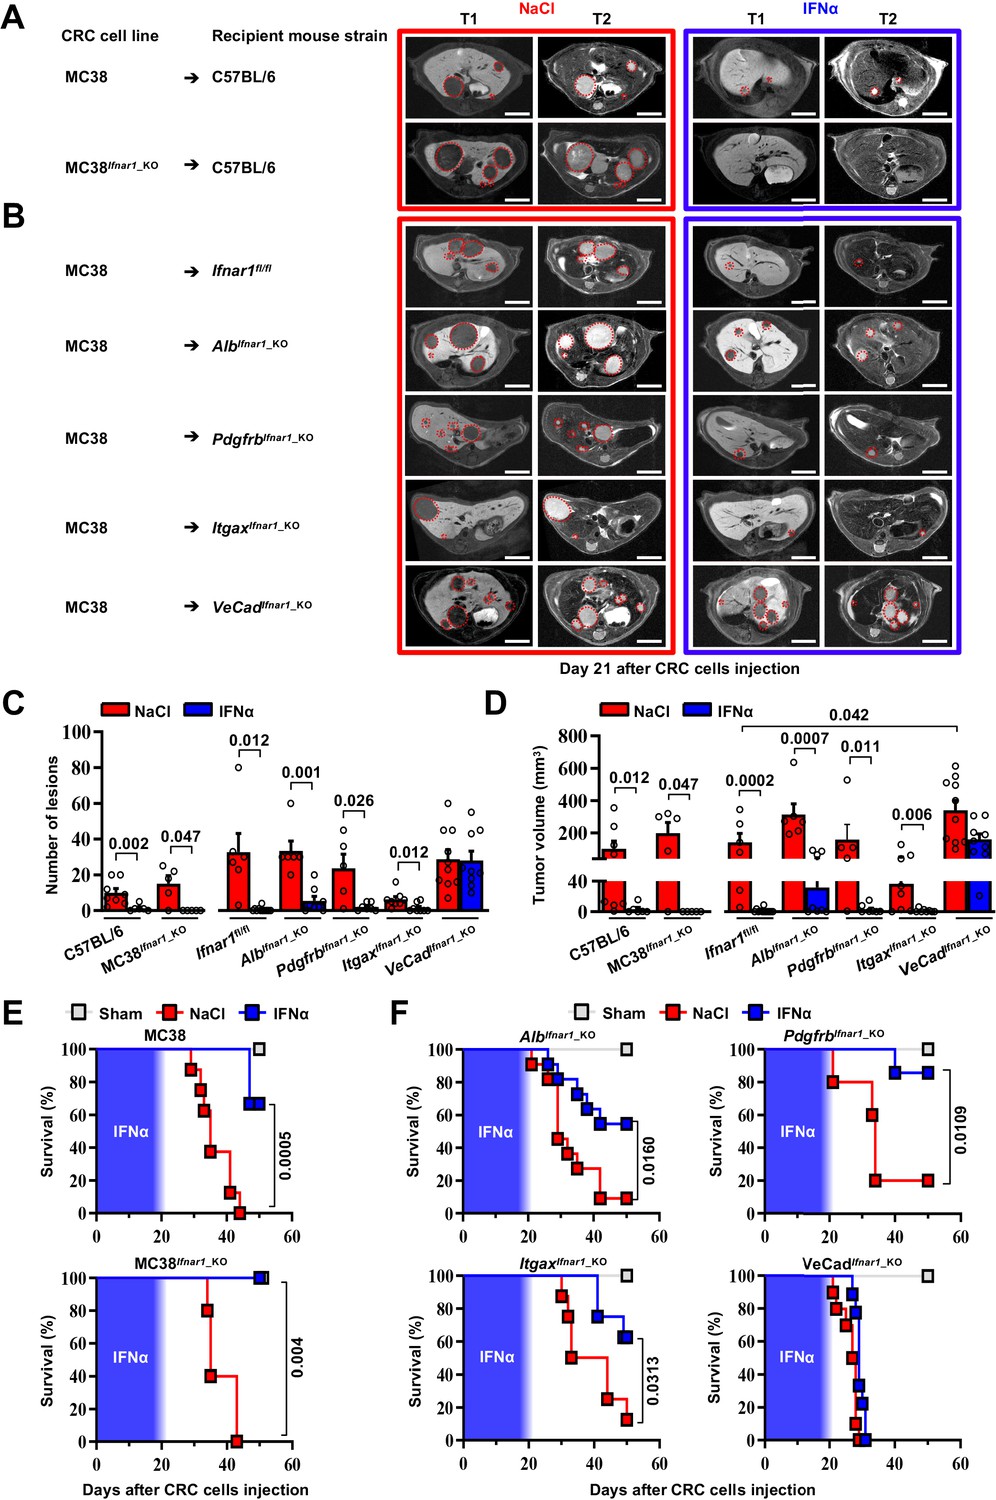
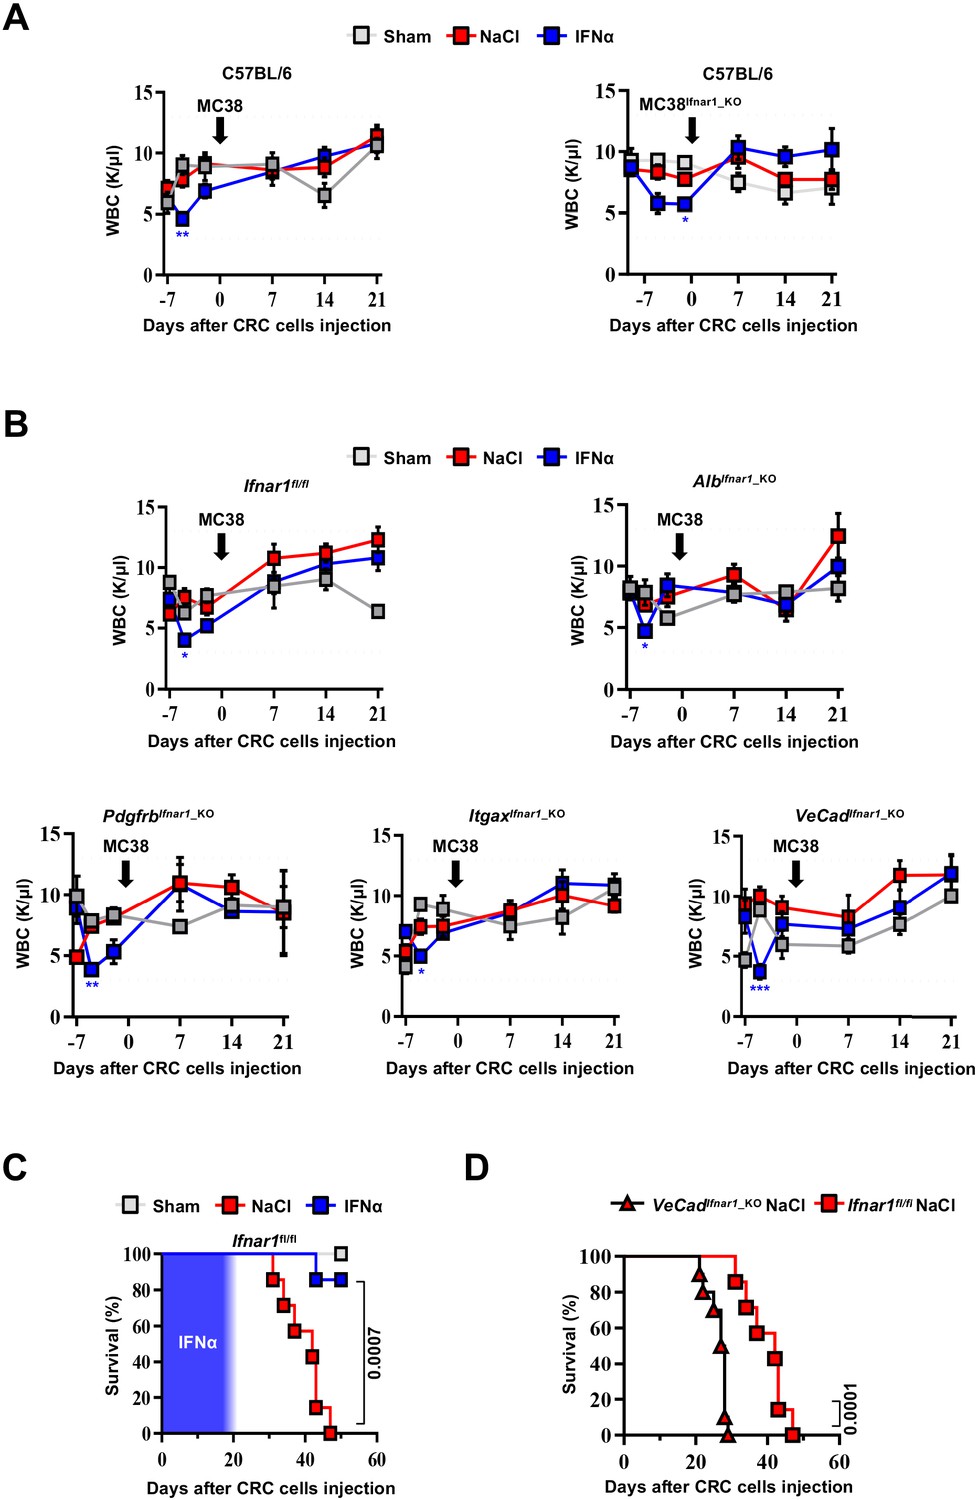
(A) Representative hepatic contrast-enhanced MRI of wild-type mice (C57BL/6) at day 21 after injection of 5x10⁴ MC38 cells or 5x10⁴ MC38Ifnar1_KO cells. Treatment with NaCl (red frame) and IFNα (blue frame) was initiated 7 days prior to intrasplenic injection of CRC cells. Red dashed lines highlight CRC liver metastases, characterized as hypointense and slightly-hyperintense regions in T1- and T2-weighted sequences, respectively. Scale bar = 5 mm. The number of mice for each experimental condition is also indicated. (B) Representative hepatic contrast-enhanced MRI at day 21 after MC38 intrasplenic injection of Ifnar1fl/fl mice and mice lacking Ifnar1 on hepatocytes (AlbIfnar1_KO), hepatic stellate cells (PdgfrbIfnar1_KO), CD11c-expressing DCs/KCs/LMCs (ItgaxIfnar1_KO) and endothelial cells (VeCadIfnar1_KO) injected with 5x10⁴ MC38 cells. Treatment with NaCl (red frame) and IFNα (blue frame) was initiated 7 days before MC38 cells intrasplenic injection. Red dashed lines highlight CRC liver metastases, characterized as hypointense and slightly-hyperintense regions in T1- and T2-weighted sequences, respectively. Scale bar = 5 mm. Number of mice for each experimental condition are also indicated. (C) Quantification of the number of hepatic lesions by MRI analysis, 21 days after CRC cells injection, of NaCl and IFNα-treated mice found in C57BL/6 mice, Ifnar1fl/fl mice and all conditional Ifnar1_KO mouse models described in (A) and (B). Mean values ± SEM are shown; p-values were calculated by Mann-Whitney test. (D) Quantification of total tumor volume of liver metastases by MRI analysis at day 21 after CRC intrasplenic injection of NaCl- and IFNα-treated mice found in C57BL/6 mice, Ifnar1fl/fl mice and all conditional Ifnar1_KO mouse models analyzed. Mean values ± SEM are shown; p-values were calculated by Mann-Whitney test. (E) Kaplan-Meier survival curves of C57BL/6 mice injected with MC38 cells (top) or MC38Ifnar1_KO cells (bottom) described in (A). Sham injected animals (n=3) were used as control. The blue pattern indicates the time frame of IFNα ip release; p-values were calculated by log-rank/Mantel-Cox test. (F) Kaplan-Meier survival curves of the indicated groups of mice described in (B). Sham injected animals (n=3 per group) were used as control. The blue pattern indicates the time frame of IFNα ip release. The total number of mice for each experimental group were: NaCl-C57BL/6 n=8; IFNα-C57BL/6 n=6; NaCl-MC38Ifnar1_KO-C57BL/6 n=5; IFNα-MC38Ifnar1_KO-C57BL/6 n=6; NaCl-Ifnar1fl/fl n=6; IFNα-Ifnar1fl/fl n=11; NaCl-AlbIfnar1_KO n=6; IFNα-AlbIfnar1_KO n=8; NaCl-PdgfrbIfnar1_KO n=5; IFNα-PdgfrbIfnar1_KO n=7; NaCl-ItgaxIfnar1_KO n=8; IFNα-ItgaxIfnar1_KO n=8 and NaCl-VeCadIfnar1_KO n=10; IFNα-VeCadIfnar1_KO n=9. Data pooled from at least two independent experiments of each experimental group; p-values were calculated by log-rank/Mantel-Cox test.
-
Figure 4—source data 1
Data for the graphs in the figure.
- https://cdn.elifesciences.org/articles/80690/elife-80690-fig4-data1-v1.zip
Figure 4—figure supplement 1
Characterization of conditional Ifnar1 knockout MC38 cells and liver specific Ifnar1 knockout mouse models.
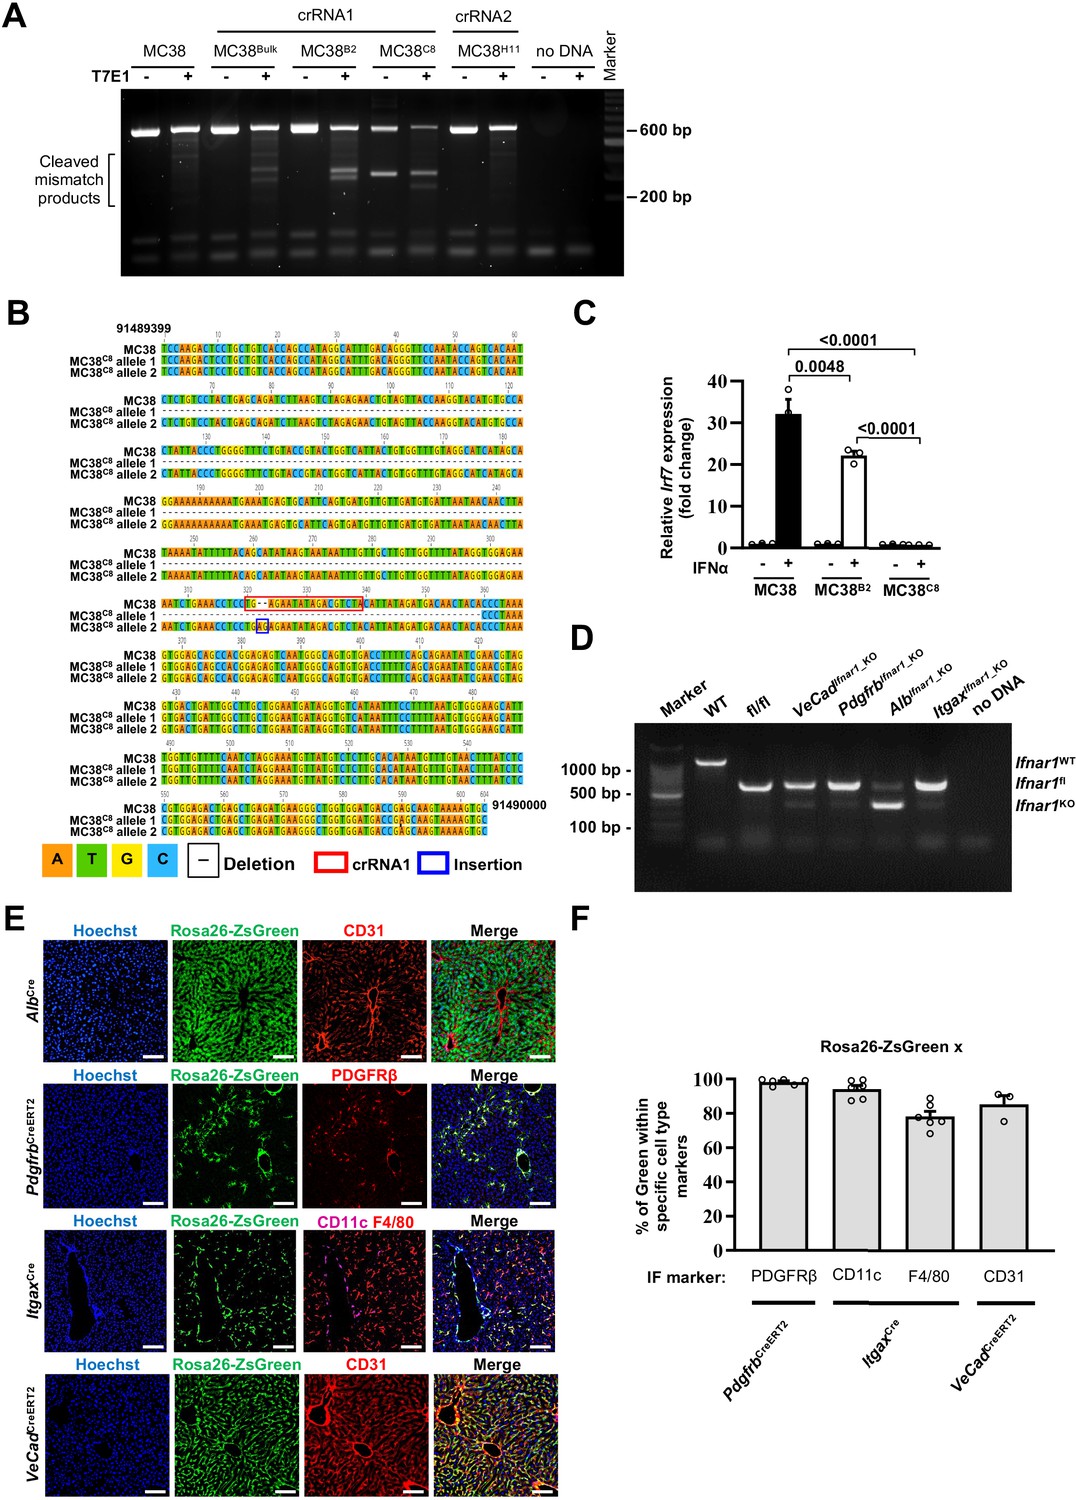
(A) T7E1 mismatch detection assay was used to screen three representative single-cell MC38 clones (MC38B2 and MC38C8 transfected with crRNA1 or MC38H11 transfected with crRNA2). Additionally, untransfected MC38, the bulk crRNA1 MC38 line (defined as MC38Bulk) and a no DNA control were also treated or not with T7E1 and analyzed as further controls. A 100 bp Marker lane was used as reference. Note that only MC38 transfected with crRNA1 showed cleaved mismatched products and were further characterized. (B) Sanger sequencing was performed to validate the location and nature of indel events of the MC38C8 cell clone. The location of crRNA1 is depicted in red, insertions are highlighted in blue and dashed lines indicate deleted regions. Sequence alignment of MC38 and the two Ifnar1 alleles of MC38C8 confirmed a 296 bp deletion in allele 1 and a 2 bases insertion in allele 2, causing a non-functional frame shift. (C) Functional screening of MC38B2 and MC38C8 cells and MC38 controls, was determined by quantitative real-time PCR of the Irf7 gene after 4 hours of in vitro stimulation with 300 ng/ml IFNα (n=3). Mean values ± SEM are shown; p-values were calculated by one-way ANOVA Tukey’s multiple comparison test. (D) VeCadCreERT2, PdgfrbCreERT2, AlbCre and ItgaxCre mice were crossed with Ifnar1fl/fl mice to generate progenies with Ifnar1 conditional deletion in the corresponding cell type. Amplified Ifnar1 products from hepatic genomic DNA of C57BL/6 (WT), Ifnar1fl/fl, VeCadIfnar1_KO, PdgfrbIfnar1_KO, AlbIfnar1_KO and ItgaxIfnar1_KO mice and a no DNA control are shown. A 100 bp Marker lane was used as reference. The expected PCR amplicons size are 1100 bp for Ifnar1 WT, 669 bp for Ifnar1fl and 389 bp for Ifnar1 deleted alleles. Note that the ratio between each floxed band and deleted band is consistent with the relative abundance of each cell type within the liver. (E) Composite immunofluorescent characterization of the patterns of Cre recombination in AlbCre, PdgfrbCreERT2, ItgaxCre , and VeCadCreERT2 mice crossed to Rosa26-ZsGreen reporter mice. Representative IF show specific recombination in hepatocytes, hepatic stellate cells (PDGFRβ+), endothelial cells (CD31+), and CD11c+ hepatic DCs and F4/80+ KCs, respectively; Scale bar = 100 µm. (F) Immunofluorescent quantification of the percentage of GFP+ cells that colocalize with specific cell type markers (PDGFRβ+, CD11c+F4/80+, and CD31+) for the most relevant Cre recombinant mouse models (PdgfrbCreERT2, ItgaxCre, and VeCadCreERT2, respectively).
-
Figure 4—figure supplement 1—source data 1
Original gel file and uncropped gel with labeling of panel (A).
- https://cdn.elifesciences.org/articles/80690/elife-80690-fig4-figsupp1-data1-v1.zip
-
Figure 4—figure supplement 1—source data 2
Data for the graphs in the figure.
- https://cdn.elifesciences.org/articles/80690/elife-80690-fig4-figsupp1-data2-v1.zip
-
Figure 4—figure supplement 1—source data 3
Original gel file and uncropped gel with labeling of panel (D).
- https://cdn.elifesciences.org/articles/80690/elife-80690-fig4-figsupp1-data3-v1.zip
Figure 4—figure supplement 2
LSECs mediate the antimetastatic activity of IFNα.
(A) WBC counts at indicated time point from C57BL/6, injected with MC38 or MC38Ifnar1_KO cells and treated with NaCl or IFNα. Sham injected animals (n=3) were used as controls. Horizontal dashed lines delimit normal WBC range. Arrows indicate the time of MC38 cells injection. Mean values ± SEM are shown; p-values were calculated by two-way ANOVA mixed-effect analysis. Significant p-values are referred to NaCl group. *p≤0.05; **p≤0.01. (B) WBC counts at indicated time point from Ifnar1fl/fl, AlbCre, PdgfrbCreERT2, ItgaxCre, and VeCadCreERT2 mice injected with MC38 cells and treated with NaCl or IFNα. Sham injected animals (n=3) were used as controls. Horizontal dashed lines delimit normal WBC range. Arrows indicate the time of MC38 cells injection. Mean values ± SEM are shown; p-values were calculated by two-way ANOVA mixed-effect analysis. Significant p-values are referred to NaCl group. *p≤0.05; **p≤0.01; ***p≤0.001. (C) Kaplan-Meier survival curves of Ifnar1fl/fl mice injected with MC38 cells. Sham injected animals per group (n=3) were used as control. The blue pattern indicates the time frame of IFNα ip release. Mean values are shown; p-values were calculated by log-rank/Mantel-Cox test. (D) Kaplan-Meier survival analysis of MOP-NaCl-treated VeCadIfnar1_KO mice in relation to all cell type-specific conditional Ifnar1_KO mice and Ifnar1fl/fl mice showing that upon Ifnar1 loss from endothelial cells mouse survival was compromised. Mean values are shown; p-values were calculated by log-rank/Mantel-Cox test.
-
Figure 4—figure supplement 2—source data 1
Data for the graphs in the figure.
- https://cdn.elifesciences.org/articles/80690/elife-80690-fig4-figsupp2-data1-v1.zip
Figure 4—figure supplement 3
Characterization of liver metastases developed in VeCadIfnar1_KO mice at day 21 after intramesenteric MC38 cells injection.
(A) Representative H&E, CD34, F4/80 and CD3 immunohistochemical micrographs of liver metastatic lesions found in NaCl- (red frame, n=4) and IFNα-treated (blue frame, n=7) Ifnar1fl/fl mice or in NaCl- (red frame, n=4) and IFNα-treated (blue frame, n=4) VeCadIfnar1_KO mice. Scale bar = 100 μm. (B) Quantification of the percentage of tumor area and the number of cells expressing CD34, F4/80, and CD3 per mm2 determined by IHC. Immunohistochemical measurements were conducted on at least 1000 mm2 of total liver area for both experimental conditions. Mean values ± SEM are shown; p-values were calculated by Mann-Whitney test.
-
Figure 4—figure supplement 3—source data 1
Data for the graphs in the figure.
- https://cdn.elifesciences.org/articles/80690/elife-80690-fig4-figsupp3-data1-v1.zip
Figure 5 with 6 supplements
Continuous IFNα administration limits trans-sinusoidal migration of CRC cells by strengthening the hepatic vascular barrier.
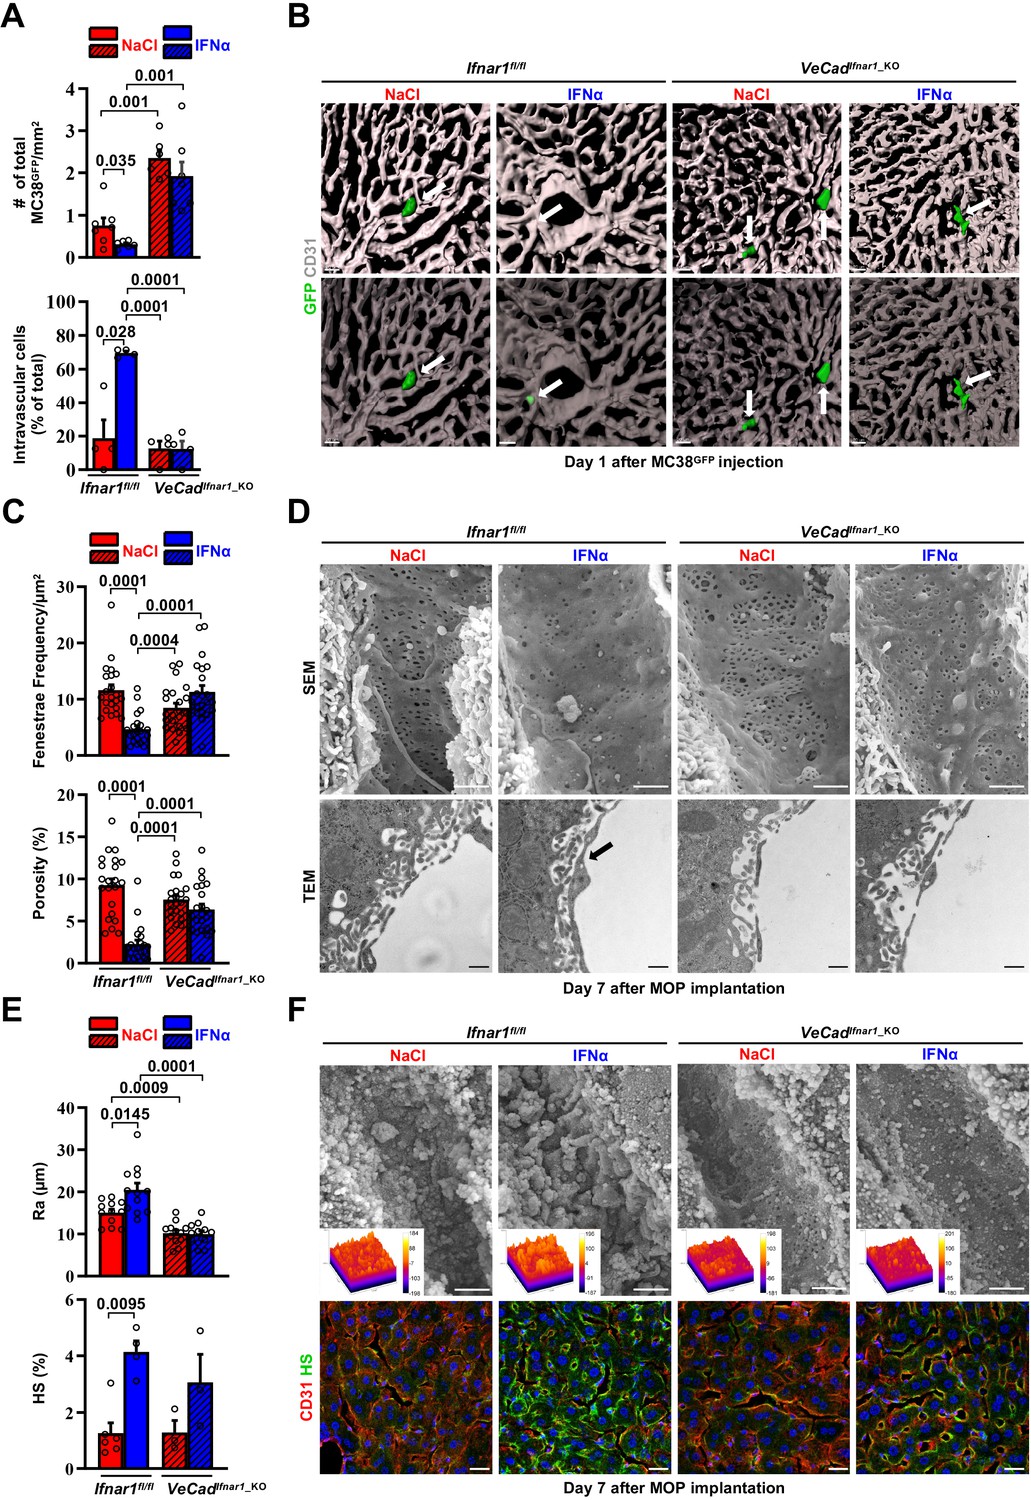
(A) Total number of MC38GFP cells per area (top) and total number of intravascular MC38GFP cells per tissue area (bottom). The total hepatic area was approximately 5 mm2 for each experimental group. Intravascular localization was measured on 20 x images, 5 randomly selected images per mouse (n=3 per group). Mean values ± SEM are shown; p-values were calculated by Mann-Whitney test. (B) Confocal reconstruction of the liver vasculature from Ifnar1fl/fl and VeCadIfnar1_KO mice 24 hr after MC38GFP cells (green) intramesenteric vein injection in mice that were treated with NaCl or IFNα for 7 days. CD31 is shown in grey. To allow visualization of intravascular MC38GFP cells and to enhance image clarity, the transparency of the sinusoidal rendering was increased up to 80% (bottom). Scale bars = 20µm. (C) Fenestrae frequency histogram (top) and percentage of vessel porosity (the percentage of liver endothelial surface area occupied by fenestrae, bottom) in liver sections of control Ifnar1fl/fl and VeCadIfnar1-KO mice treated for 7 days with continuous NaCl or IFNα therapy. Quantification was performed on 17.000 x SEM images, 10 randomly selected images per mouse (n=3 per group). A total area of approximately 720 µm2 of sinusoidal surface was analyzed for each mouse. Mean values ± SEM are shown; p-values were calculated by Mann-Whitney test. (D) Representative scanning electron micrographs (SEM, top) and transmission electron micrographs (TEM, bottom) images from liver sections of mice described in (C), showing hepatic fenestrations and endothelial features. Arrow indicates the increased endothelial thickness observed after continuous IFNα therapy in Ifnar1fl/fl mice. SEM scale bars = 1 µm; TEM scale bars = 500 nm. (E) Quantification of the arithmetical mean deviation or Ra coefficient (top) and the percentage of hepatic area positive for HS staining (bottom) on Ifnar1fl/fl and VeCadIfnar1_KO livers treated with continuous NaCl or IFNα therapy for 7 days. Quantification was performed on at least 3 Ifnar1fl/fl and VeCadIfnar1_KO livers per group. Mean values ± SEM are shown; p-values were calculated by Mann-Whitney test. (F) Liver sinusoidal endothelial glycocalyx (GCX) visualization by scanning electron micrographs (SEM, top) from Ifnar1fl/fl and VeCadIfnar1_KO livers that were perfused with lanthanum nitrate (a heavy metal that allows GCX visualization by stabilizing negatively charged GCX structures) 7 days after continuous NaCl or IFNα therapy. Scale bars = 1 µm. Inserts display a representation of the 3D topographic surface of a selected area within the liver sinusoid of each experimental condition. Representative immunofluorescence micrographs of Heparan sulfate (HS; green) and CD31 (red) staining from Ifnar1fl/fl and VeCadIfnar1_KO mice treated with continuous NaCl or IFNα therapy for 7 days, showing increased HS accumulation after IFNα therapy only in Ifnar1fl/fl mice (bottom). Hoechst (blue) was used for nuclear counterstaining. Scale bars = 20µm.
-
Figure 5—source data 1
Data for the graphs in the figure.
- https://cdn.elifesciences.org/articles/80690/elife-80690-fig5-data1-v1.zip
-
Figure 5—source data 2
High-magnification immunofluorescence images of each channel.
- https://cdn.elifesciences.org/articles/80690/elife-80690-fig5-data2-v1.zip
Figure 5—figure supplement 1

Continuous IFNα administration induces hepatic endothelial capillarization strengthening the liver vascular barrier.
(A) Representative composite immunofluorescence images showing a pan-endothelial cell marker (CD31, blue) and a liver sinusoidal marker (LYVE-1; red) 5 min after MC38GFP cells (green) injection in Ifnar1fl/fl or VeCadIfnar1_KO mice. Colocalization between CD31 and LYVE-1 is shown in magenta. ×3 magnification shows entrapment of CRC cells at the beginning of the hepatic sinusoid. Scale bar = 20 µm. (B) Quantitative analysis of hepatic sinusoids diameter from transmission electron micrographs (TEM) images of Ifnar1fl/fl and VeCadIfnar1_KO mice after 7 days of continuous NaCl or IFNα therapy. Quantification was performed on 3.400 x TEM images of three animals per group, nine randomly selected images per mouse. A total area of approximately 286 µm2 was analyzed for each mouse. Mean values ± SEM are shown; p-values were calculated by Mann-Whitney test. (C) FACS analysis showing the percentage of ITGB2+ (top graph) and ITGA4+ (bottom graph) cells within the hepatic CD31+ non-parenchymal cells (NPC) population of Ifnar1fl/fl and VeCadIfnar1_KO mice after 7 days of continuous NaCl or IFNα therapy. For each experimental group, five animals were analyzed. Mean values ± SEM are shown; p-values were calculated by Mann-Whitney test. (D) Table displaying the quantification of endothelial thickness (nm), the Space of Disse density (%), the amount of collagen deposits (expressed as the percentage of hepatic sinusoids exhibiting visible collagen fibers) and the presence of basal lamina (expressed as the percentage of hepatic sinusoids exhibiting continuous basal lamina) quantified in TEM images of three animals per group. Randomly selected images (10 fields/mouse) were acquired from Ifnar1fl/fl and VeCadIfnar1_KO mouse livers treated for 7 days with continuous NaCl or IFNα therapy. Mean values ± SEM are shown; p-values were calculated by Mann-Whitney test. *p<0.05. (E) Representative composite immunofluorescent micrographs of mouse liver cryosections, from Ifnar1fl/fl and VeCadIfnar1_KO mice treated for 7 days with continuous NaCl or IFNα therapy and stained with CD31 pan-endothelial marker (red) and the ECM components, Collagen IV (green, top images) or Laminin (green, bottom images). Hoechst (blue) was used for nuclear counterstaining. Scale bars = 20µm. (F) Quantification of the percentage of hepatic area positive for Collagen type IV (top graph) or Laminin (bottom graph) staining on Ifnar1fl/fl and VeCadIfnar1_KO livers treated with continuous NaCl or IFNα therapy for 7 days. Quantification was performed on 20 x images of at least 3 mice per group, 10 randomly selected images per mouse. Mean values ± SEM are shown; p-values were calculated by Mann-Whitney test. (G) Representative composite immunofluorescent micrographs of mouse liver cryosections, from Ifnar1fl/fl and VeCadIfnar1_KO mice treated for 7 days with continuous NaCl or IFNα therapy, with CD31 pan-endothelial marker (red) and the cell-adhesion molecules ICAM1 (green, top images) or E-selectin (green, bottom images). Hoechst (blue) was used for nuclear counterstaining. Scale bars = 20 µm. (H) Quantification of the percentage of hepatic area positive for ICAM1 (top graph) or E-selectin (bottom graph) staining on Ifnar1fl/fl and VeCadIfnar1_KO livers treated with continuous NaCl or IFNα therapy for 7 days. Quantification was performed on 20 x images of at least 3 mice per group, 10 randomly selected images per mouse. Mean values ± SEM are shown; p-values were calculated by Mann-Whitney test.
-
Figure 5—figure supplement 1—source data 1
Data for the graphs in the figure.
- https://cdn.elifesciences.org/articles/80690/elife-80690-fig5-figsupp1-data1-v1.zip
-
Figure 5—figure supplement 1—source data 2
Collagen type IV.
High magnification immunofluorescence images of each channel.
- https://cdn.elifesciences.org/articles/80690/elife-80690-fig5-figsupp1-data2-v1.zip
-
Figure 5—figure supplement 1—source data 3
Laminin.
High-magnification immunofluorescence images of each channel.
- https://cdn.elifesciences.org/articles/80690/elife-80690-fig5-figsupp1-data3-v1.zip
-
Figure 5—figure supplement 1—source data 4
ICAM1.
High-magnification immunofluorescence images of each channel.
- https://cdn.elifesciences.org/articles/80690/elife-80690-fig5-figsupp1-data4-v1.zip
-
Figure 5—figure supplement 1—source data 5
E-Selectin.
High-magnification immunofluorescence images of each channel.
- https://cdn.elifesciences.org/articles/80690/elife-80690-fig5-figsupp1-data5-v1.zip
Figure 5—figure supplement 2
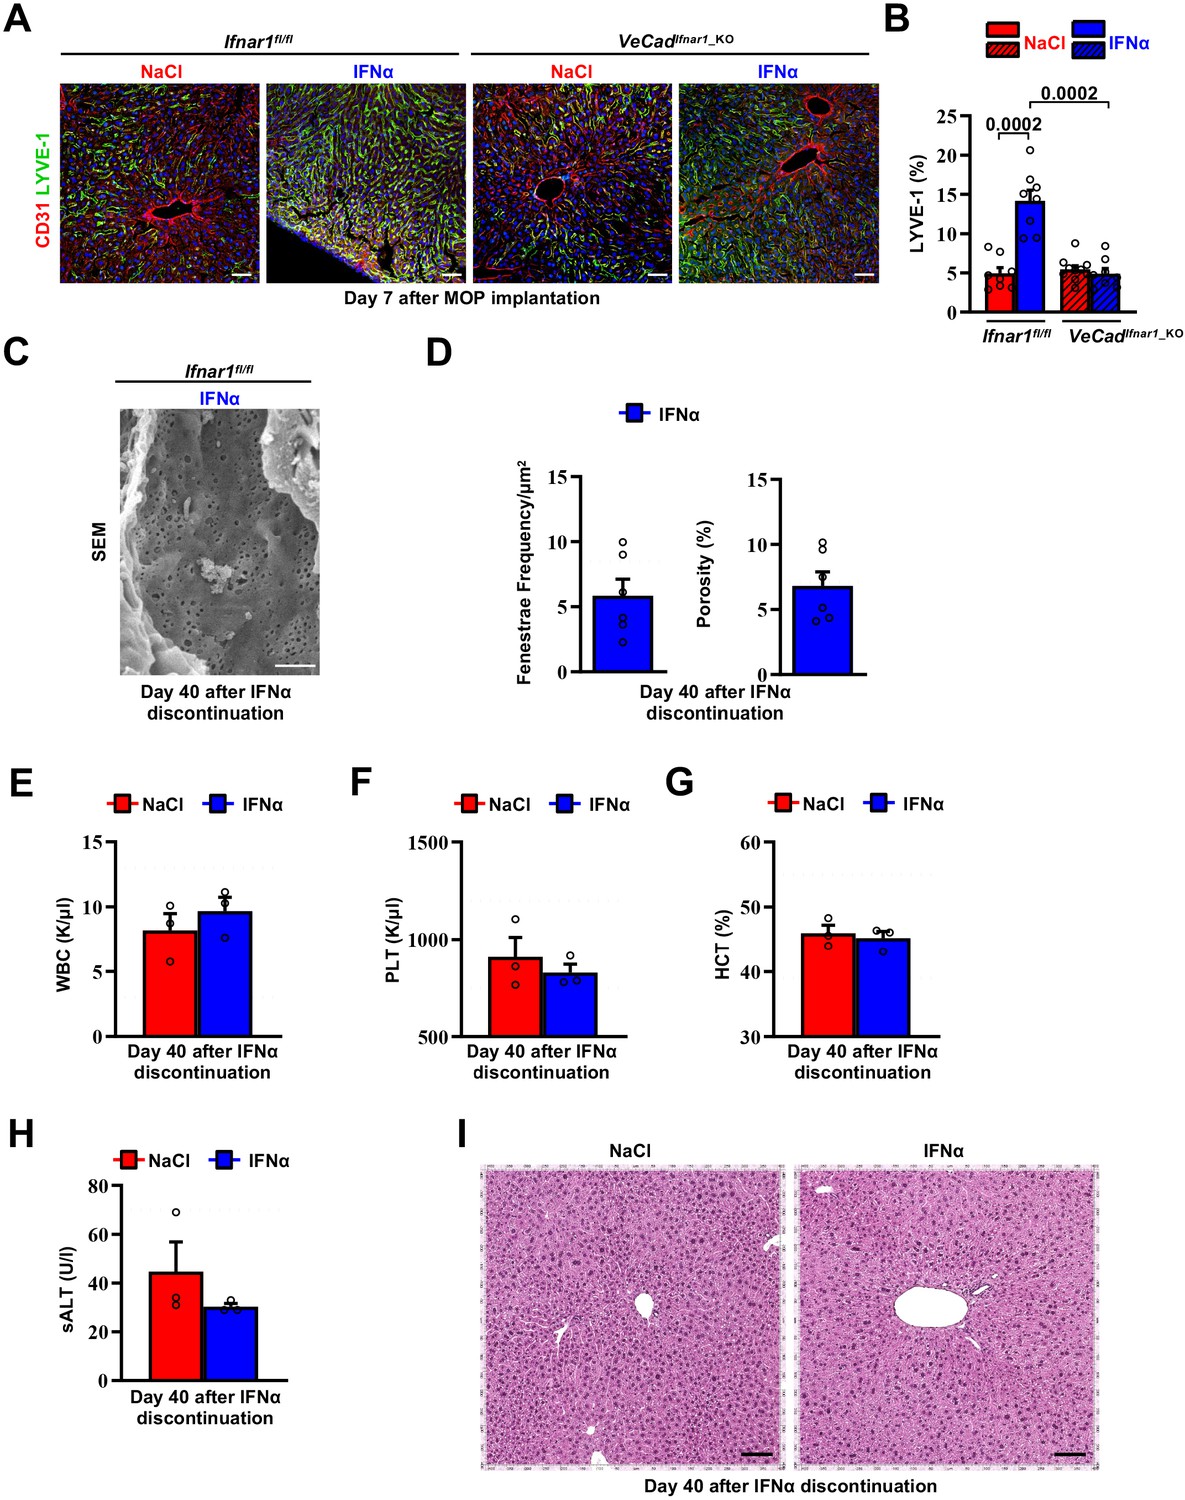
Continuous IFNα administration induces hepatic endothelial capillarization that is reversed after discontinuation of IFNα therapy.
(A) Representative composite immunofluorescent micrographs of mouse liver cryosections, from Ifnar1fl/fl and VeCadIfnar1_KO mice treated for 7 days with continuous NaCl or IFNα therapy, with CD31 (red) and LYVE-1 (green). Hoechst (blue) was used for nuclear counterstaining. Scale bars = 20 µm. (B) Quantification of the percentage of hepatic area positive for LYVE-1 staining of mice described in (A). Quantification was performed on 20 x images of at least 3 mice per group. Mean values ± SEM; p-values Mann-Whitney test. (C) Representative scanning electron micrographs (SEM) images from liver sections from IFNα-treated Ifnar1fl/fl mice 40 days after continuous IFNα therapy discontinuation (n=3 per group), showing hepatic fenestrations. Scale bars = 1 µm. (D) Histograms depicting fenestrae frequency (left) and percentage of vessel porosity (right) quantified in liver sections of IFNα treated Ifnar1fl/fl mice 40 days after treatment discontinuation of mice described in (C). Dashed lines represent the average of fenestrae frequency (left) or porosity (right) from 6 randomly selected NaCl-treated images. Quantification was performed on 17.000 x SEM images, 2 randomly selected images per mouse. A total area of approximately 300 µm2 of sinusoidal surface was analyzed. Mean values ± SEM are shown. (E–I) White blood cell (WBC) counts (E), Platelet (PLT) count (F), Hematocrit (HCT) (G) and serum Alanine Aminotransferases (sALT) quantification (H) of NaCl-treated control mice and mice described in (C). Horizontal dashed lines delimit normal ranges. Mean values ± SEM are shown. (I) Representative hepatic H&E micrographs from NaCl-treated mice at day 7 after MOP implantation and IFNα-treated Ifnar1fl/fl mice at day 40 after IFNα therapy discontinuation. Scale bar = 100 µm.
-
Figure 5—figure supplement 2—source data 1
LYVE-1.
High-magnification immunofluorescence images of each channel.
- https://cdn.elifesciences.org/articles/80690/elife-80690-fig5-figsupp2-data1-v1.zip
-
Figure 5—figure supplement 2—source data 2
Data for the graphs in the figure.
- https://cdn.elifesciences.org/articles/80690/elife-80690-fig5-figsupp2-data2-v1.zip
Figure 5—video 1
3D reconstruction of a representative extravasated MC38GFP cell found within the liver parenchyma of a NaCl-treated Ifnar1fl/fl mouse.
Confocal reconstruction of the liver vasculature of a Ifnar1fl/fl NaCl-treated mouse 24 hr after MC38GFP cells (green) intramesenteric injection. CD31 is shown in grey. To allow visualization of intravascular MC38GFP cells and to enhance image clarity, the transparency of the sinusoidal rendering was increased up–to 80%. Scale bar = 20µm.
Figure 5—video 2
3D reconstruction of an intravascular MC38GFP cell found within a blood vessel of an IFNα-treated Ifnar1fl/fl mouse.
Confocal reconstruction of the liver vasculature of a Ifnar1fl/fl IFNα-treated mouse 24 hr after MC38GFP cells (green) intramesenteric injection. CD31 is shown in grey. To allow visualization of intravascular MC38GFP cells and to enhance image clarity, the transparency of the sinusoidal rendering was increased up–to 80%. Scale bar = 20µm.
Figure 5—video 3
3D reconstruction of an extravasated MC38GFP cell found within the liver parenchyma of a NaCl-treated VeCadIfnar1_KO mouse.
Confocal reconstruction of the liver vasculature of a VeCadIfnar1_KO NaCl-treated mouse 24 hr after MC38GFP cells (green) intramesenteric vein injection. CD31 is shown in grey. To allow visualization of intravascular MC38GFP cells and to enhance image clarity, the transparency of the sinusoidal rendering was increased up to 80%. Scale bar = 20µm.
Figure 5—video 4
3D reconstruction of extravasated MC38GFP cells found within the liver parenchyma of an IFNα-treated VeCadIfnar1_KO mouse.
Confocal reconstruction of the liver vasculature of a VeCadIfnar1_KO IFNα treated mouse 24 hr after MC38GFP cells (green) intramesenteric vein injection. CD31 is shown in grey. To allow visualization of intravascular MC38GFP cells and to enhance image clarity, the transparency of the sinusoidal rendering was increased up to 80%. Scale bar = 20µm.
Figure 6 with 1 supplement
HECs acquire an antimetastatic transcriptional profile upon continuous IFNα sensing.
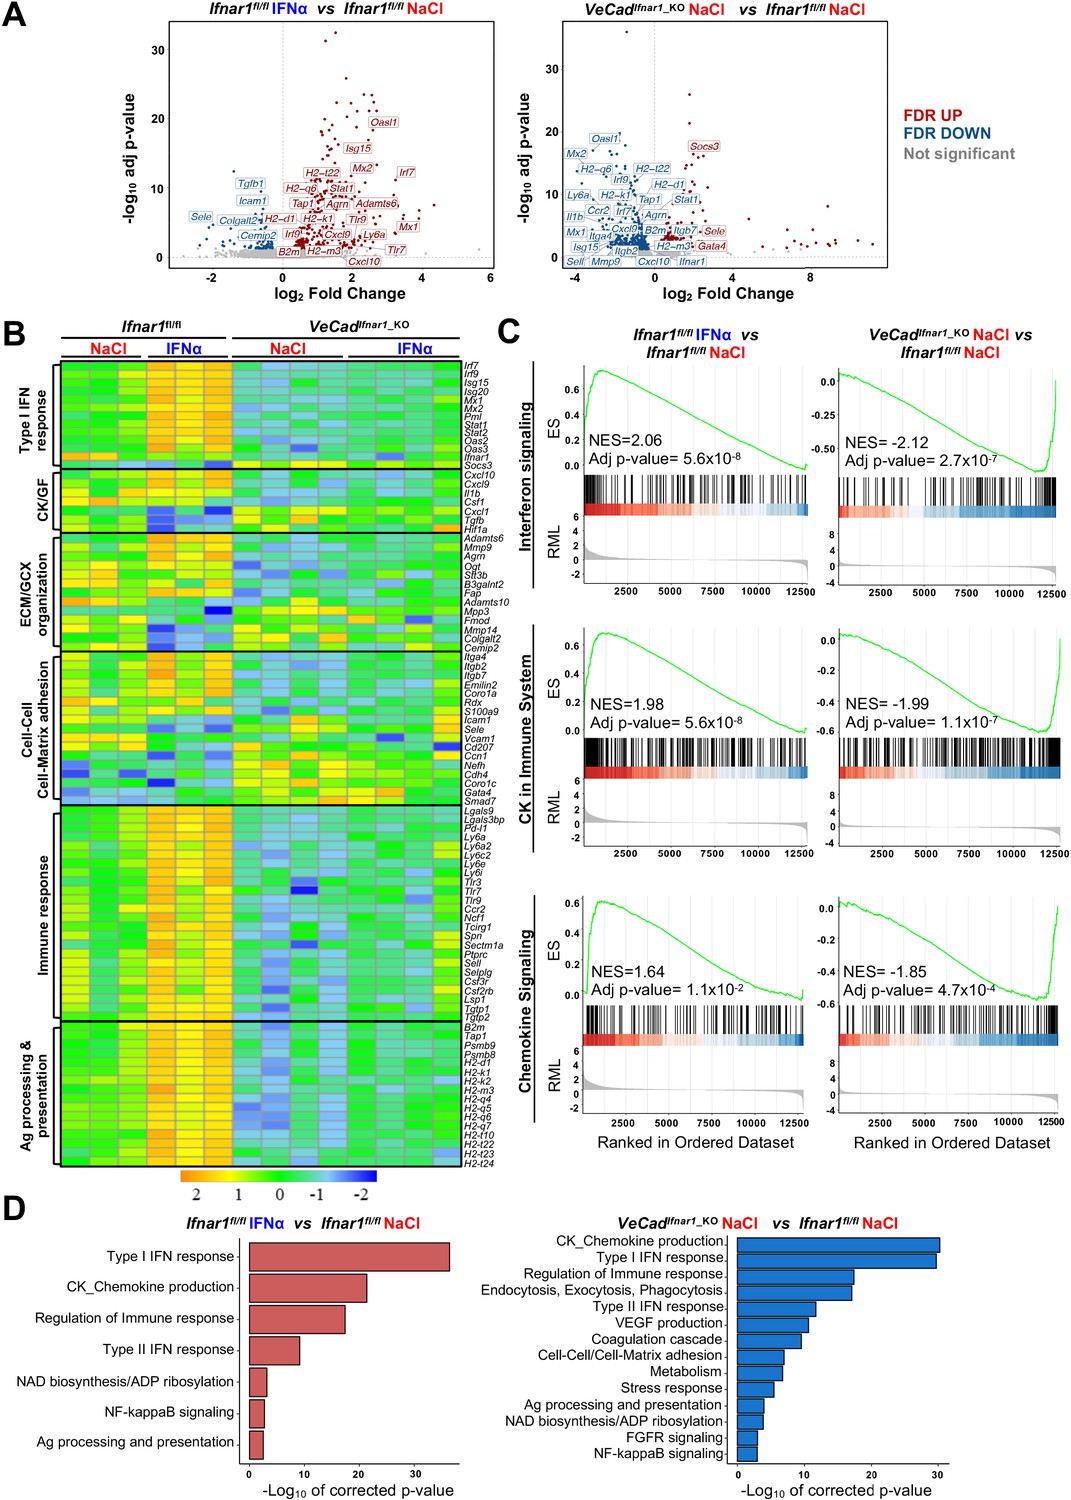
(A) Volcano plots of differential gene expression (DGE) results obtained from the comparisons between HECs-derived from Ifnar1fl/fl mice treated with NaCl and IFNα for 7 days (left) and between HECs-derived from VeCadIfnar1_KO and Ifnar1fl/fl NaCl-treated mice (right) (Ifnar1fl/fl n=3; VeCadIfnar1_KO n=4). Significant false discovery rate (FDR <0.05) up- and down-regulated genes are highlighted in red and blue colors, respectively, not significant genes are depicted in grey. (B) Heatmap of the expression values (log2-transformed rpkm) of manually selected genes retrieved from differentially regulated pathways. (C) Pre-ranked Gene Set Enrichment Analysis (GSEA) enrichment plots of the indicated pathways between CD31+ cells from Ifnar1fl/fl-IFNα and Ifnar1fl/fl-NaCl (left) and between VeCadIfnar1_KO-NaCl and Ifnar1fl/fl-NaCl-treated animals (right). (D) Bar charts showing the adjusted p-values (-log10 transformed) of selected pathways from the enrichment analysis performed on comparisons between Ifnar1fl/fl-IFNα and Ifnar1fl/fl-NaCl CD31+ cells (left graph) and between VeCadIfnar1_KO-NaCl and Ifnar1fl/fl-NaCl CD31+ cells (right graph).
-
Figure 6—source data 1
Gene Ontology (GO) of biological process enrichment analysis of all differentially expressed genes.
Excel spreadsheet with all significant pathways found in the comparison between IFNα-treated Ifnar1fl/fl vs NaCl-treated Ifnar1fl/fl HECs/LSECs and NaCl-treated VeCadIfnar1_KO-NaCl vs NaCl-treated Ifnar1fl/fl LSECs were generated using GO Biological Processes 2018 collection.
- https://cdn.elifesciences.org/articles/80690/elife-80690-fig6-data1-v1.zip
Figure 6—figure supplement 1
HECs acquire an antimetastatic transcriptional profile upon continuous IFNα sensing.
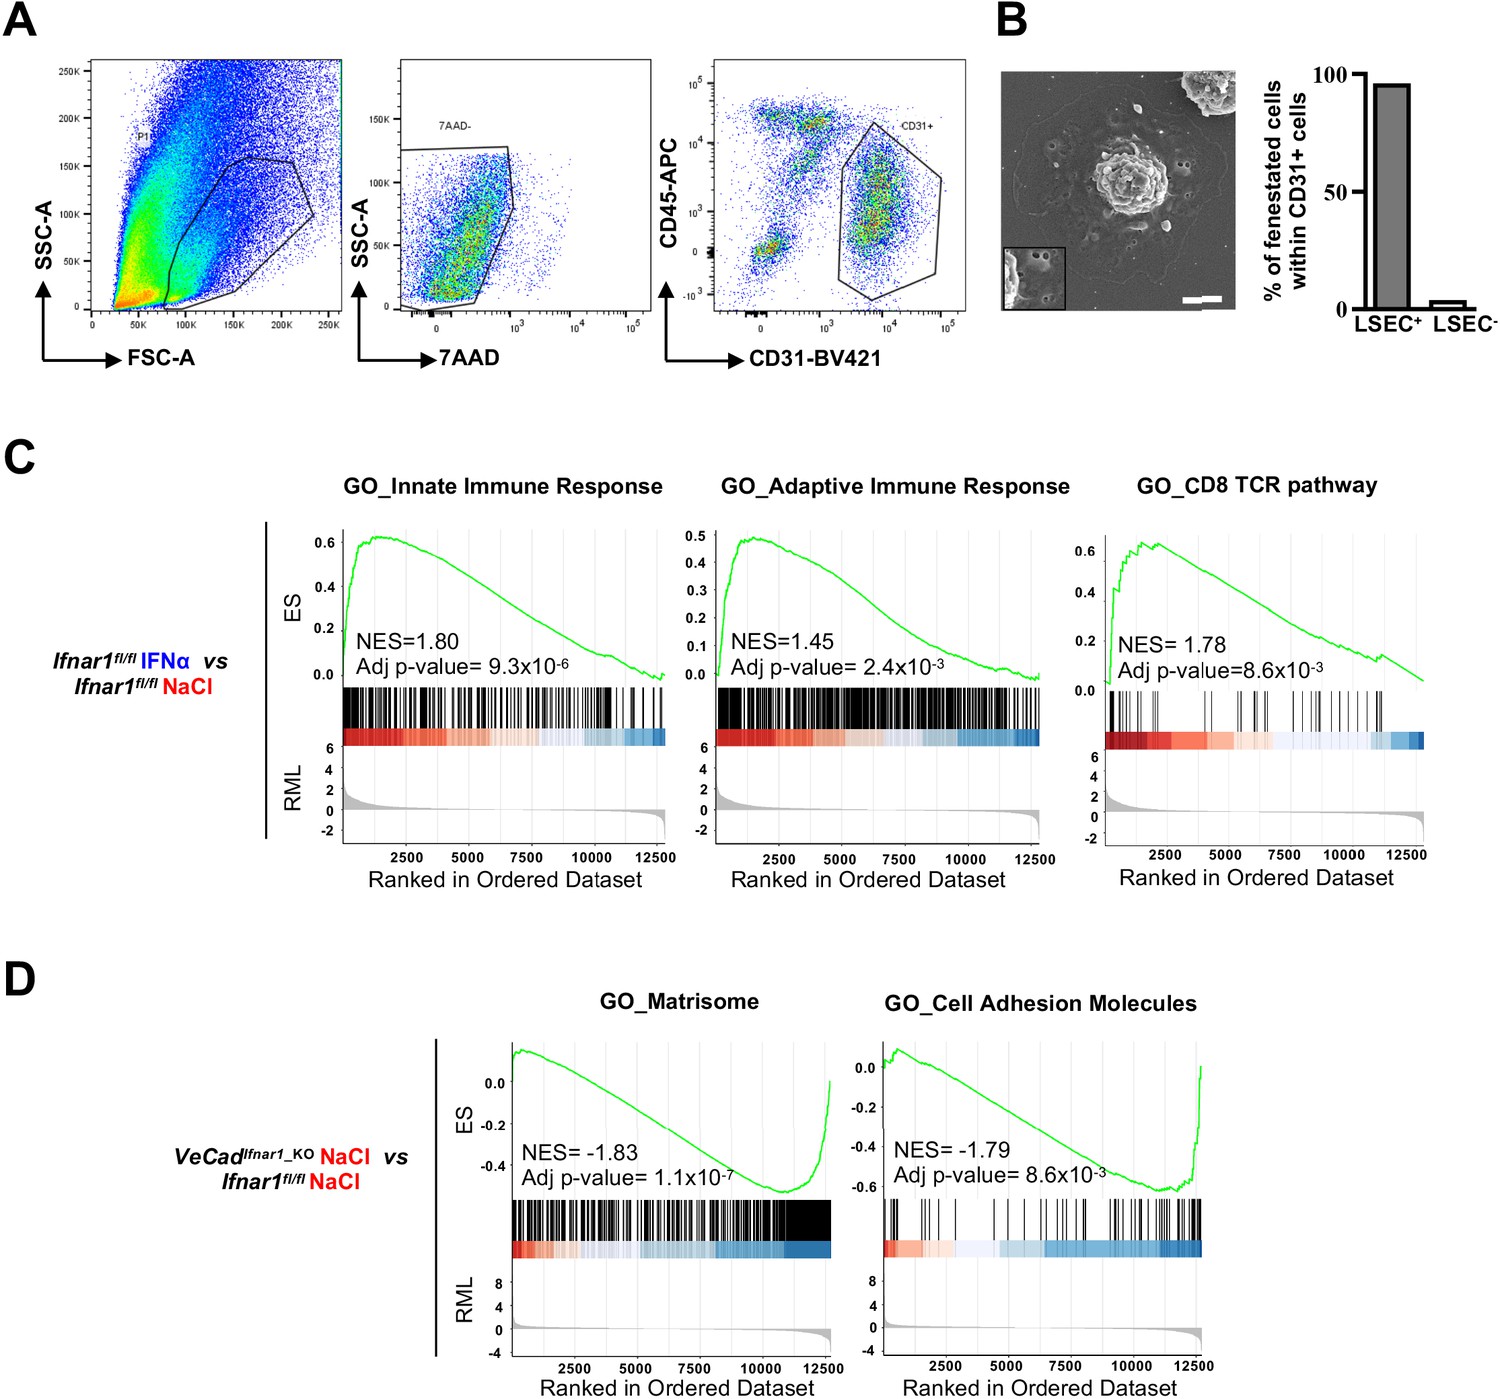
(A) Flow cytometry gating strategy for the sorting and isolation of CD31+ HECs isolated from the livers of Ifnar1fl/fl and VeCadIfnar1_KO mice 7 days after continuous NaCl and IFNα therapy. Viable cells were first selected on their morphology (using FSC/SSC parameters), followed by the exclusion of doublets and 7AAD+ dead cells. (B) Representative SEM micrograph of the hepatic CD31+-sorted cell 12 hr after in vitro adhesion onto fibronectin-coated coverslips. ×1,3 magnification highlights LSEC fenestration. Scale bar = 2 µm. The presence of LSEC fenestrations on ~96% of CD31+ cells indicates that most sorted cells represent bona vide LSECs (n=24 cells). (C) Pre-ranked Gene Set Enrichment Analysis (GSEA) enrichment plots of the indicated pathways evaluated on the comparisons between IFNα-treated Ifnar1fl/fl and NaCl-treated Ifnar1fl/fl CD31+ HECs. (D) Pre-ranked Gene Set Enrichment Analysis (GSEA) enrichment plots of the indicated pathways evaluated on the comparisons between VeCadIfnar1_KO and Ifnar1fl/fl NaCl-treated CD31+ HECs.
-
Figure 6—figure supplement 1—source data 1
Data for the graphs in the figure.
- https://cdn.elifesciences.org/articles/80690/elife-80690-fig6-figsupp1-data1-v1.zip
Figure 7 with 2 supplements
Continuous IFNα sensing improves immunostimulatory properties of HECs to provide long-term tumor protection.
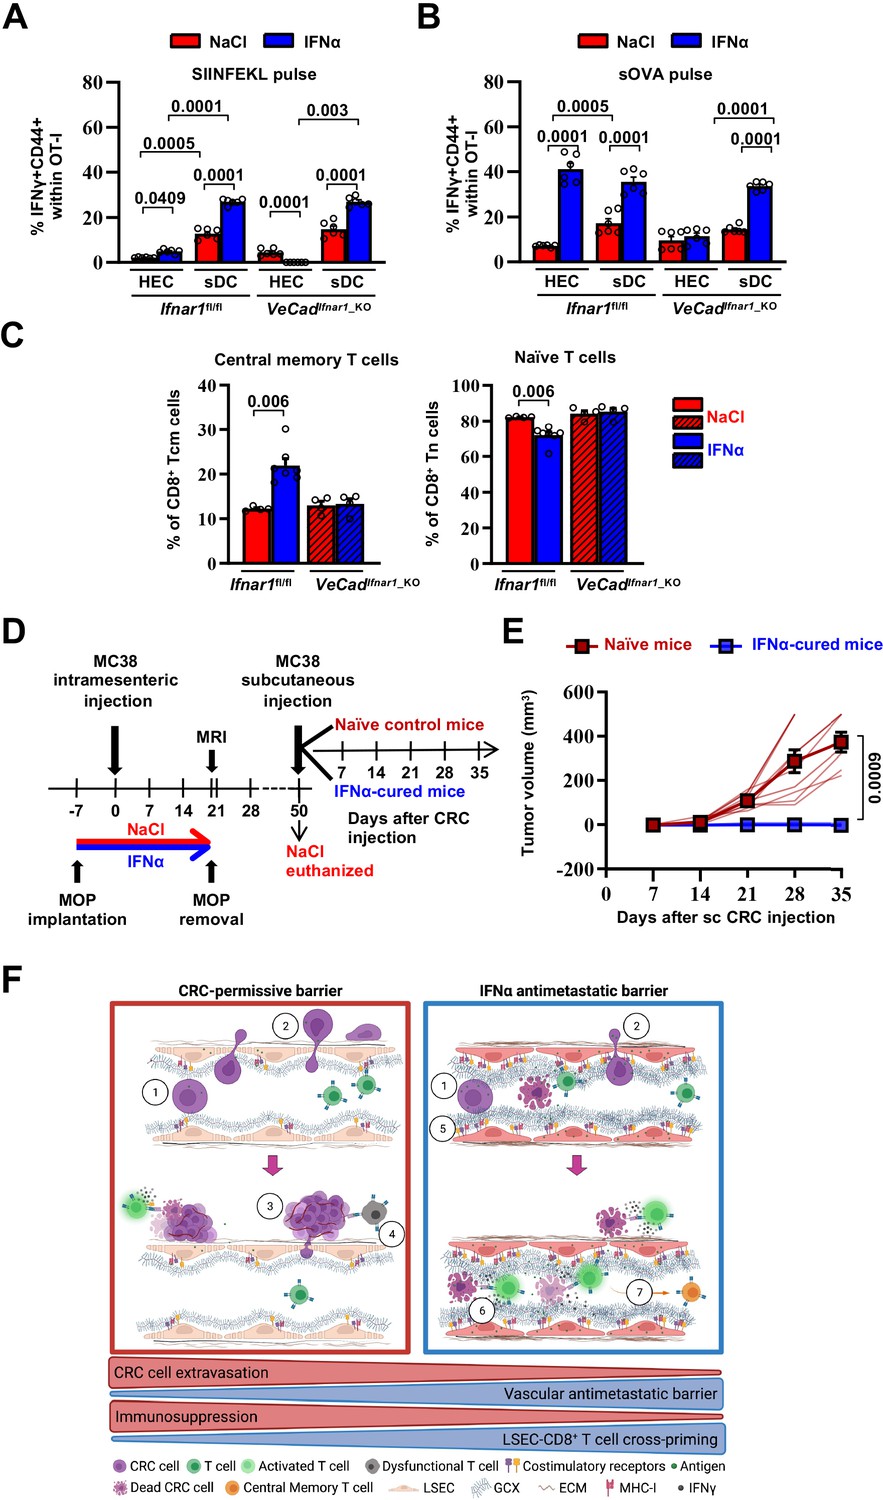
(A–B) Quantification of the percentage of OT-I CD8+ T cells expressing CD44+IFNγ+ generated after the co-cultured with HECs, including LSECs, or sDCs isolated from Ifnar1fl/fl and VeCadIfnar1-KO mice and stimulated with SIINFEKL peptide (A) or soluble OVA protein (sOVA) (B) in the presence of NaCl or IFNα. Mean values ± SEM are shown; p-values were calculated by two-way ANOVA test from two independent experiments with three biological replicates each. (C) Quantification of the percentage of splenic T central memory (Tcm, CD8+CD44+CD62L+) and naïve T cells (Tn, CD8+CD44-CD62L+) populations 21 days after intramesenteric MC38 cells injection into NaCl- or IFNα-treated Ifnar1fl/fl and VeCadIfnar1_KO mice. Quantification was performed on least 4 mice per group. Mean values ± SEM are shown; p-values were calculated by Mann-Whitney test. (D) Schematic representation of the experimental procedure used for tumor rechallenge. IFNα-Ifnar1fl/fl-cured mice and naïve Ifnar1fl/fl mice were subcutaneously rechallenged with 5x10³ MC38 cells and received no further treatment. Tumor growth was monitored weekly for 35 days. Note that we used aged-matched Ifnar1fl/fl naïve mice because NaCl-treated mice had to be euthanized for ethical reasons by day 50. (E) Kinetics of subcutaneous tumor growth in naïve (n=10) and IFNα-cured (n=7) mice. Both, mean tumor volume and individual animal measurements are shown. Mean values ± SEM are shown; p-values were calculated by two-way ANOVA test. (F) Schematic model: CRC cells emerging from the primary tumor reach the hepatic sinusoids via the portal circulation and arrest - mostly because of size constrains - at the portal side of the sinusoidal circulation (1), CRC cells trans-sinusoidally migrate into the liver parenchyma (2) and develop micro-metastases that will eventually grow overtime (3; red frame), promoting the generation of an immunosuppressive microenvironment leading to dysfunctional T cells (4; red frame). Conversely, IFNα therapy (blue frame), by modifying LSECs porosity, thickness, deposition of basal membrane and GCX depth, builds up a vascular antimetastatic barrier (5), that impairs CRC trans-sinusoidal migration, promoting intravascular containment of invading tumor cells (6) that together with IFNα-mediated increased cross-presentation and cross-priming by HECs/LSEC, will lead to naïve CD8+ T cell activation and secondary generation of long-term antitumor immunity and protection from secondary tumor challenge (7). Created with https://biorender.com/.
-
Figure 7—source data 1
Data for the graphs in the figure.
- https://cdn.elifesciences.org/articles/80690/elife-80690-fig7-data1-v1.zip
Figure 7—figure supplement 1
Continuous IFNα sensing improves immunostimulatory properties of HECs to provide long-term tumor protection.
(A) FACS analysis showing the mean fluorescence intensity (MFI) of MHC-I (left) and the percentage of CD86 (middle) and IL-6RA cells (right) within the hepatic CD31+ non-parenchymal cells (NPC) population of Ifnar1fl/fl and VeCadIfnar1_KO mice after 7 days of continuous NaCl or IFNα therapy. For each experimental group, three animals were analyzed. Mean values ± SEM are shown; p-values were calculated by two-way ANOVA test. (B–C) Representative FACS profiles showing the percentage of OT-I CD8+ T cells expressing CD44+IFNγ+ obtained from the co-cultured with HECs (top) or sDCs (bottom) isolated from Ifnar1fl/fl and VeCadIfnar1-KO mice and stimulated with SIINFEKL peptide (b) or soluble OVA protein (c). (D) Representative FACS analysis of splenic T naïve (Tn; CD44-CD62L+) and T central memory (Tcm; CD44+CD62L+) endogenous CD8+ T cells identified 21 days after intramesenteric MC38 cells injection into NaCl- or IFNα-treated Ifnar1fl/fl and VeCadIfnar1_KO mice.
-
Figure 7—figure supplement 1—source data 1
Data for the graphs in the figure.
- https://cdn.elifesciences.org/articles/80690/elife-80690-fig7-figsupp1-data1-v1.zip
Figure 7—figure supplement 2
Isolation and flow cytometry characterization of HECs and sDCs.
(A) Schematic diagram of the protocol used to isolate HECs, including LSECs, from murine liver tissue (left) and sDCs from mouse spleen (right). (B) Assessment of LSEC purity by flow cytometry using CD31 as a pan-endothelial marker, CD146 as a specific marker for LSECs and F4/80 to identify Kupffer cells contaminants. Analysis was performed in Ifnar1fl/fl and VeCadIfnar1_KO-derived LSECs. (C) Schematic representation of the experimental procedure used for cross-priming analysis of in vitro cultured HECs and sDCs, pulsed with SIINFEKL peptide or sOVA and co-cultured with naïve OT-I CD8+ T cells for 3 days to evaluate the percentage of CD8+ T cells that co-express both CD44 and IFNγ. (D) Evaluation by flow cytometry of the purity and the characteristics of sDCs isolated from Ifnar1fl/fl and VeCadIfnar1-KO mice. The percentage of conventional DCs was estimated by analyzing the amount of CD8α+ cells within CD11c+ DCs. Plasmacytoid DCs (pDCs) were measured by B220+CD11c+ staining and the maturation status of DCs was evaluated with MHC-I and MHC-II markers.
Tables
Appendix 1—key resources table
| Reagent type (species) or resource | Designation | Source or reference | Identifiers | Additional information |
|---|---|---|---|---|
| Strain, strain background (Mus musculus) | C57BL/6 J | Charles River, Italy | Strain code: 632 | Inbred |
| Strain, strain background (Mus musculus) | BALB/c | Charles River Lab | Strain code: 028 | Inbred |
| Strain, strain background (Mus musculus) | NSG (NOD.Cg-Prkdcscid Il2rgtm1Wjl/SzJ) | Charles River Lab | Strain code: 614 | Immun odeficient |
| Strain, strain background (Mus musculus) | Ifnar1fl/fl (B6(Cg)-Ifnar1tm1.1Ees/J) | Jackson Lab | JAX:028256 | C57BL/6 J background |
| Strain, strain background (Mus musculus) | AlbCre (B6.Cg-Speer6-ps1Tg(Alb-cre)21Mgn/J) | Jackson Lab | JAX:003574 | C57BL/6 J background |
| Strain, strain background (Mus musculus) | PdgfrbCreERT2 (B6.Cg-Tg(Pdgfrb-cre/ERT2)6096Rha/J) | Jackson Lab | JAX:029684 | C57BL/6 J background |
| Strain, strain background (Mus musculus) | ItgaxCre (CD11c, B6.Cg-Tg(Itgax-cre)1-1Reiz/J) | Jackson Lab | JAX:008068 | C57BL/6 J background |
| Strain, strain background (Mus musculus) | Rosa26-ZsGreen (B6.Cg-Gt(ROSA)26Sortm6(CAG-ZsGreen1)Hze/J) | Jackson Lab | JAX:007906 | C57BL/6 J background |
| Strain, strain background (Mus musculus) | VeCadCreERT2 (Cdh5(PAC)-CreERT2 mice) | Taconic, Models for life | Provided by S. Brunelli (UniMib, Milan) | C57BL/6 J background |
| Strain, strain background (Mus musculus) | OT-I mice (C57BL/6-Tg(TcraTcrb) 1100Mgb/Crl) | Charles River Lab | JAX:003831 | C57BL/6 J background |
| Antibody | Anti-CD126, IL-6RA, (clone: D7715A7) (Rat monoclonal) | Biolegend | Cat# 115806, RRID:AB_313676 | FC (1:100) |
| Antibody | anti-CD18, ITGB2 (clone M18/2) (Rat monoclonal) | Biolegend | Cat# 101402, RRID:AB_312811 | FC (1:100) |
| Antibody | Anti-CD49d, ITGA4, (clone 9C10(MFR4.B)) (Rat monoclonal) | Biolegend | Cat# 103706, RRID:AB_313046 | FC (1:100) |
| Antibody | Anti-H-2Kb/H-2Db (clone 28-8-6) (Mouse monoclonal) | Biolegend | Cat# 114605, RRID:AB_313596 | FC (1:100) |
| Antibody | Anti-CD86 (clone GL-1) (Rat monoclonal) | Biolegend | Cat# 105007, RRID:AB_313150 | FC (1:100) |
| Antibody | Anti-CD146 (clone ME-9F1) (Rat monoclonal) | Biolegend | Cat# 134704, RRID:AB_2143527 | FC (1:100) |
| Antibody | Anti-CD44 (clone IM7) (Rat monoclonal) | Biolegend | Cat# 103044, RRID:AB_2650923 | FC (1:100) |
| Antibody | Anti-CD62L (clone MEL-14) (Rat monoclonal) | Biolegend | Cat# 104420, RRID:AB_493376 | FC (1:100) |
| Antibody | Anti- CD16/CD32, (Rat monoclonal) | BioXCell | Cat# BE0307; RRID:AB_2736987 | FC (1:100) |
| Antibody | Anti-GFP, (Rabbit polyclonal) | Thermo Fisher Sci | Cat# A11122, RRID:AB_221569 | IF (1:100) |
| Antibody | Anti-GFP (clone FM264G) (Rat monoclonal) | Biolegend | Cat# 338008, RRID:AB_2563288 | IF (1:100) |
| Antibody | Anti-CD31, PECAM1, (Goat polyclonal) | R&D Systems | Cat# AF3628, RRID:AB_2161028 | IF (1:300) |
| Antibody | Anti-PDGFRβ, CD140b (clone APB5) (Rat monoclonal) | eBioscience | Cat# 14-1402-82, RRID:AB_467493 | IF (1:200) |
| Antibody | Anti-CD11c, (clone N418)(Armenian hamster monoclonal) | Biolegend | Cat#117312, RRID:AB_492850 | IF (1:100) |
| Antibody | Anti-Heparan Sulfate (clone F58-10E4) (Mouse monoclonal) | Amsbio | Cat# 370255 S, RRID:AB_10891554 | IF (1:50) |
| Antibody | Anti-LYVE-1 (Rabbit polyclonal) | Novus Biol | Cat# NB600-1008, RRID:AB_10000497 | IF (1:300) |
| Antibody | Anti-Collagen type IV (Rabbit polyclonal) | Abcam | Cat# ab19808, RRID:AB_445160 | IF (1:100) |
| Antibody | Anti-Laminin (Rabbit polyclonal) | Sigma-Aldrich | Cat# L9393, RRID:AB_477163 | IF (1:300) |
| Antibody | Anti-CD54, ICAM1 (clone YN1/1.7.4) (Rat monoclonal) | Biolegend | Cat#116101, RRID:AB_313692 | IF (1:100) |
| Antibody | Anti-CD62E, E-selectin (clone 10E9.6) (Rat monoclonal) | BD Bioscience | Cat#550290, RRID:AB_393585 | IF (1:100) |
| Antibody | Anti-Rabbit AF488 (Donkey polyclonal) | Thermo Fisher Sci | Cat#32790, RRID:AB_2762833 | IF (1:200) |
| Antibody | Anti-Goat AF546 (Donkey polyclonal) | Thermo Fisher Sci | Cat#A-11056, RRID:AB_2534103 | IF (1:200) |
| Antibody | Anti-Rat AF647 (Donkey polyclonal) | Jackson IR | Cat#712-605-153, RRID:AB_2340694 | IF (1:200) |
| Antibody | Anti-IgM conjugated to APC (clone II/41) (Rat monoclonal) | Thermo Fisher Sci | Cat#17-5790-82, RRID:AB_469458 | IF (1:100) |
| Antibody | Anti-Ki-67 (clone SP6) (Rabbit recombinant antibody) | Thermo Fisher Sci | Cat# MA5-14520, RID:AB_10979488 | IHC (1:200) |
| Antibody | Anti-CD34 (clone MEC14.7) (Rat monoclonal) | Biolegend | Cat# 119301, RRID:AB_345279 | IHC (1:300) |
| Antibody | Anti-F4/80 (clone A3-1) (Rat monoclonal) | Bio-Rad | Cat# MCA497, RRID:AB_2098196 | IHC (1:200) |
| Antibody | Anti-CD3 (clone SP7) (Rabbit monoclonal) | Abcam | Cat# ab21703, RRID:AB_446487 | IHC (1:100) |
| Antibody | Anti-pSTAT1 (Clone 58D6) (Rabbit monoclonal) | Cell Signaling | Cat# BK9167S, RRID:AB_561284 | IHC (1:800) |
| Antibody | Anti-CD11c microbeads ultrapure | Miltenyi Biotec | Cat# 130-125-835 | 100 µL per 10⁸ total cells |
| Antibody | Anti-F4/80 microbeads ultrapure | Miltenyi Biotec | Cat# 130-110-443 | 100 µL per 10⁸ total cells |
| Antibody | InVivoMAb Anti-mouse GM-CSF(clone MP1-22E9) (Rat monoclonal) | BioXcell | Cat# BE0259 RRID:AB_2687738 | 40 ng/ml |
| Peptide, recombinant protein | Recombinant mouse IFNα1, carrier-free | Biolegend | Cat# 751802 | |
| Peptide, recombinant protein | NH2-SIINFEKL-COOH (SL-8 peptide) | Proimmune | Cat# GMPT5995 | |
| Chemical compound, drug | Albumin from chicken egg white (ovalbumin) | Sigma-Aldrich | Cat# 55039 | |
| Chemical compound, drug | Gadoxetic acid (Primovist; Gd-EOB-DTPA) | Bayer Schering Pharma | N/A | |
| Chemical compound, drug | Tamoxifen | Sigma Aldrich | Cat# T5648-5G | |
| Chemical compound, drug | Lipofectamine 2000 | Thermo Fisher Sci | Cat# 11668019 | |
| Chemical compound, drug | Paraformaldehyde powder | Sigma-Aldrich | Cat# 158127 | |
| Chemical compound, drug | Sodium Cacodylate powder | Sigma-Aldrich | Cat# C0250 | |
| Chemical compound, drug | 25% EM grade Glutaraldehyde | ProSciTech | Cat# C001 | |
| Chemical compound, drug | Osmium tetroxide | ProSciTech | Cat# C011 | |
| Chemical compound, drug | Lanthanum (III) nitrate hexahydrate | MERK | Cat# 331937–11 G | 2% |
| Chemical compound, drug | Zinc formalin fixative | Sigma-Aldrich | Cat# Z2902-3.75L | |
| Chemical compound, drug | Fibronectin human plasma | MERK | Cat# F2006-1MG | |
| Chemical compound, drug | Percoll | Sigma-Aldrich | Cat# P4937-500ML | |
| Chemical compound, drug | Matrigel Matrix | BD Bioscience | Cat# 354248 | |
| Chemical compound | 7-AAD Viability staining solution | Biolegend | Cat# 420404 | FC (1:100) |
| Chemical compound, drug | EGM-2MV endothelial cell growth medium-2 BulletKit | Lonza | Cat# CC-3202 | |
| Chemical compound, drug | Brefeldin A | Sigma-Aldrich | Cat# B7651 | |
| Commercial assay, kit | VeriKine-HS Mouse IFNα All-Subtype ELISA Kit | PBL Assay Sci | Cat# 42115–1 | |
| Commercial assay, kit | GeneArt CRISPR Nuclease Vector with OFP Reporter Kit | Thermo Fisher Sci | Cat# A21174 | |
| Commercial assay, kit | TOPO TA Cloning Kit | Thermo Fisher Sci | Cat# 450641 | |
| Commercial assay, kit | CellTiter-Glo Luminescent Cell Viability Assay | Promega | Cat# G7570 | |
| Commercial assay, kit | ReliaPrep RNA Cell Miniprep System | Promega | Cat# Z6011 | |
| Commercial assay, kit | ReliaPrep RNA Tissue Miniprep System | Promega | Cat# Z6111 | |
| Commercial assay, kit | TURBO DNA-free kit | Ambion | Cat# AM1907 | |
| Commercial assay, kit | QIAamp DNA Mini kit | Qiagen | Cat# 51304 | |
| Commercial assay, kit | RNeasy Mini Kit | Qiagen | Cat# 74104 | |
| Commercial assay, kit | Procyte kit | Idexx | Cat# 9926306–00 | |
| Commercial assay, kit | Live/Dead fixable near-IR dead cell stain kit | Thermo Fisher Sci | Cat# L34975 | FC (1:500) |
| Commercial assay, kit | Live/Dead fixable Green dead cell stain kit | Thermo Fisher Sci | Cat# L34970 | FC (1:100) |
| Commercial assay, kit | DNAse TURBO | Thermo Fisher Sci | Cat# AM1907 | |
| Commercial assay, kit | Foxp3/Transcription Factor Staining buffer set | Thermo Fisher Sci | Cat# 00-5523-00 | |
| Cell lines (Mus musculus) | CT26 | ATCC | Cat# CRL-2638, RID:CVCL_7256 | |
| Cell lines (Mus musculus) | MC38 | Kindly provided by P. Berraondo López - Centro de Investigación Médica Aplicada (Spain) | RRID:CVCL_B288 | |
| Sequence-based reagent | Ifnar1 intron 3 forward | Prigge et al., 2015 | PCR primers | ACTCAGGTTCG CTCCATCAG |
| Sequence-based reagent | Ifnar1 intron 3 reverse | Prigge et al., 2015 | PCR primers | GCACATTGACCATT ACAAGAGTAG |
| Sequence-based reagent | Ifnar1 exon2 forward | This paper | PCR primers | TCCAAGACTCC TGCTGTC |
| Sequence-based reagent | Ifnar1 exon2 reverse | This paper | PCR primers | GCACTTTTAC TTGCTCGGT |
| Sequence-based reagent | ItgaxCre forward | Jackson Lab | PCR primers | ACTTGGCAGCTG TCTCCAAG |
| Sequence-based reagent | ItgaxCre reverse | Jackson Lab | PCR primers | GTGGCAGATGG CGCGGCA |
| Sequence-based reagent | ALBCre forward | Jackson Lab | PCR primers | CCAGGCTAAGTGCC TTCTCTACA |
| Sequence-based reagent | ALBCre reverse | Jackson Lab | PCR primers | AATGCTTCTGTCC GTTTGCCGGT |
| Sequence-based reagent | PdgfrbCre forward | Jackson Lab | PCR primers | GAACTGTCACC GGGAGGA |
| Sequence-based reagent | PdgfrbCre reverse | Jackson Lab | PCR primers | AGGCAAATTTT GGTGTACGG |
| Sequence-based reagent | VeCadCre forward | Wang et al., 2010 | PCR primers | GCCTGCATTACCG GTCGATGCAACG |
| Sequence-based reagent | VeCadCre reverse | Wang et al., 2010 | PCR primers | GTGGCAGATGGCG CGGCAACACCAT |
| Sequence-based reagent | RosaZsgreen forward | Jackson Lab | PCR primers | AACCAGAAGTGG CACCTGAC |
| Sequence-based reagent | RosaZsgreen reverse | Jackson Lab | PCR primers | GGCATTAAAGC AGCGTATCC |
| Sequence-based reagent | crRNA1 | Thermo Fisher Sci | CRISPR RNA guide | TAGACGTCTATATT CTCAGGGTTTT |
| Sequence-based reagent | crRNA2 | Thermo Fisher Sci | CRISPR RNA guide | ATGTAGACGTCTAT ATTCTCGTTTT |
| Sequence-based reagent | Mm00516793_g1 | Thermo Fisher Sci | Taqman probe Irf7 | |
| Sequence-based reagent | Mm00836412_m1 | Thermo Fisher Sci | Taqman probe Oas1 | |
| Sequence-based reagent | Mm 99999915_g1 | Thermo Fisher Sci | Taqman probe Gapdh | |
| Software and algorithms | FlowJo v10.5 or greater | Tree Star | RRID:SCR_008520 | |
| Software and algorithms | Prism version 8 or greater | GraphPad | RRID:SCR_002798 | |
| Software and algorithms | ImageScope software | Leica Biosystems | RRID:SCR_014311 | |
| Software and algorithms | Imaris version 7.2.3 | Bitplane | RRID:SCR_007370; | |
| Software and algorithms | Fiji software or ImageJ software | NIH | RRID:SCR_002285; 003070 | |
| Software and algorithms | MIPAV v5.3.4 or greater | CIT, NIH | RRID:SCR_007371 | |
| Software and algorithms | EsivisionPro 3.2 software | Soft Imaging Sys | N/A | |
| Software and algorithms | OsiriX DICOM viewer version 3.9.2 or greater | Pixmeo SARL | N/A | |
| Software and algorithms | Trimmomatic version 0.32 | Bolger et al., 2014 | RRID:SCR_011848 | |
| Software and algorithms | STAR aligner version 2.5.3 a | STAR SRL | RRID:SCR_004463 | |
| Software and algorithms | GENECODE version M22 | Ensmbl 97 | N/A | |
| Software and algorithms | R-4.0.3 software | R Core Team | N/A | |
| Software and algorithms | DESeq2 version 1.30.1 | Love et al., 2014 | N/A | |
| Software and algorithms | EnrichR R package version 3.3 | Chen et al., 2013 | RRID:SCR_020938 | |
| Software and algorithms | GeneArt CRISPR Search and Design Tool | Thermo Fisher Sci | N/A | |
| Other | Alzet osmotic pumps 1002 | Alzet | Cat# 10104844 | Mini osmotic pump (MOP) |
| Other | Alzet osmotic pumps 1004 | Alzet | Cat# 10104846 | Mini osmotic pump (MOP) |
| Other | ProCyte Dx Hematology Analyzer | IDEXX Lab | N/A | Instruments |
| Other | Bruker Horizontal 7-Tesla MRI scanner | BioSpec | N/A | Instruments |
| Other | ViiA7 Fast Real-Time PCR System | Applied Biosys | Cat# 4453543 | Instruments |
| Other | Aperio Scanscope XT Leica | Leica Biosystems | RRID:SCR_018457 | Instruments |
| Other | Leica SP8 LIGHTNING confocal microscope | Leica Biosystems | RRID:SCR_018169 | Instruments |
| Other | FEI Talos L120C G2 Transmission electron microscope | Thermo Fisher Sci | N/A | Instruments |
| Other | Zeiss FEG Gemini 500 Scanning electron microscope | Zeiss | N/A | Instruments |
| Other | FACSCanto II High Throughput Sampler | BD Bioscience | N/A | Instruments |
| Other | FACS LSRFortessa | BD Bioscience | N/A | Instruments |
| Other | FACSAria Fusion | BD Bioscience | N/A | Instruments |
| Other | Illumina NovaSeq 6000 machine | Illumina | RRID:SCR_016387 | Instruments |
| Other | Leica CM1520 Cryostat | Leica Biosystems | RRID:SCR_017543 | Instruments |
| Other | Leica VT1000S Vibratome | Leica Biosystems | RRID:SCR_016495 | Instruments |
| Other | EM UC7 ultramicrotome | Leica Biosystems | RRID:SCR_016694 | Instruments |
Additional files
Download links
A two-part list of links to download the article, or parts of the article, in various formats.
Downloads (link to download the article as PDF)
Open citations (links to open the citations from this article in various online reference manager services)
Cite this article (links to download the citations from this article in formats compatible with various reference manager tools)
Continuous sensing of IFNα by hepatic endothelial cells shapes a vascular antimetastatic barrier
eLife 11:e80690.
https://doi.org/10.7554/eLife.80690


