Glutamine metabolism modulates chondrocyte inflammatory response
- Department of Orthopedic Surgery, Washington University School of Medicine, United States
- Department of Mechanical Engineering and Material Sciences, Washington University School of Medicine, United States
- Bone and Mineral Division, Department of Medicine, Washington University School of Medicine, United States
- Shriners Hospital for Children, United States
Figures
Figure 1 with 1 supplement
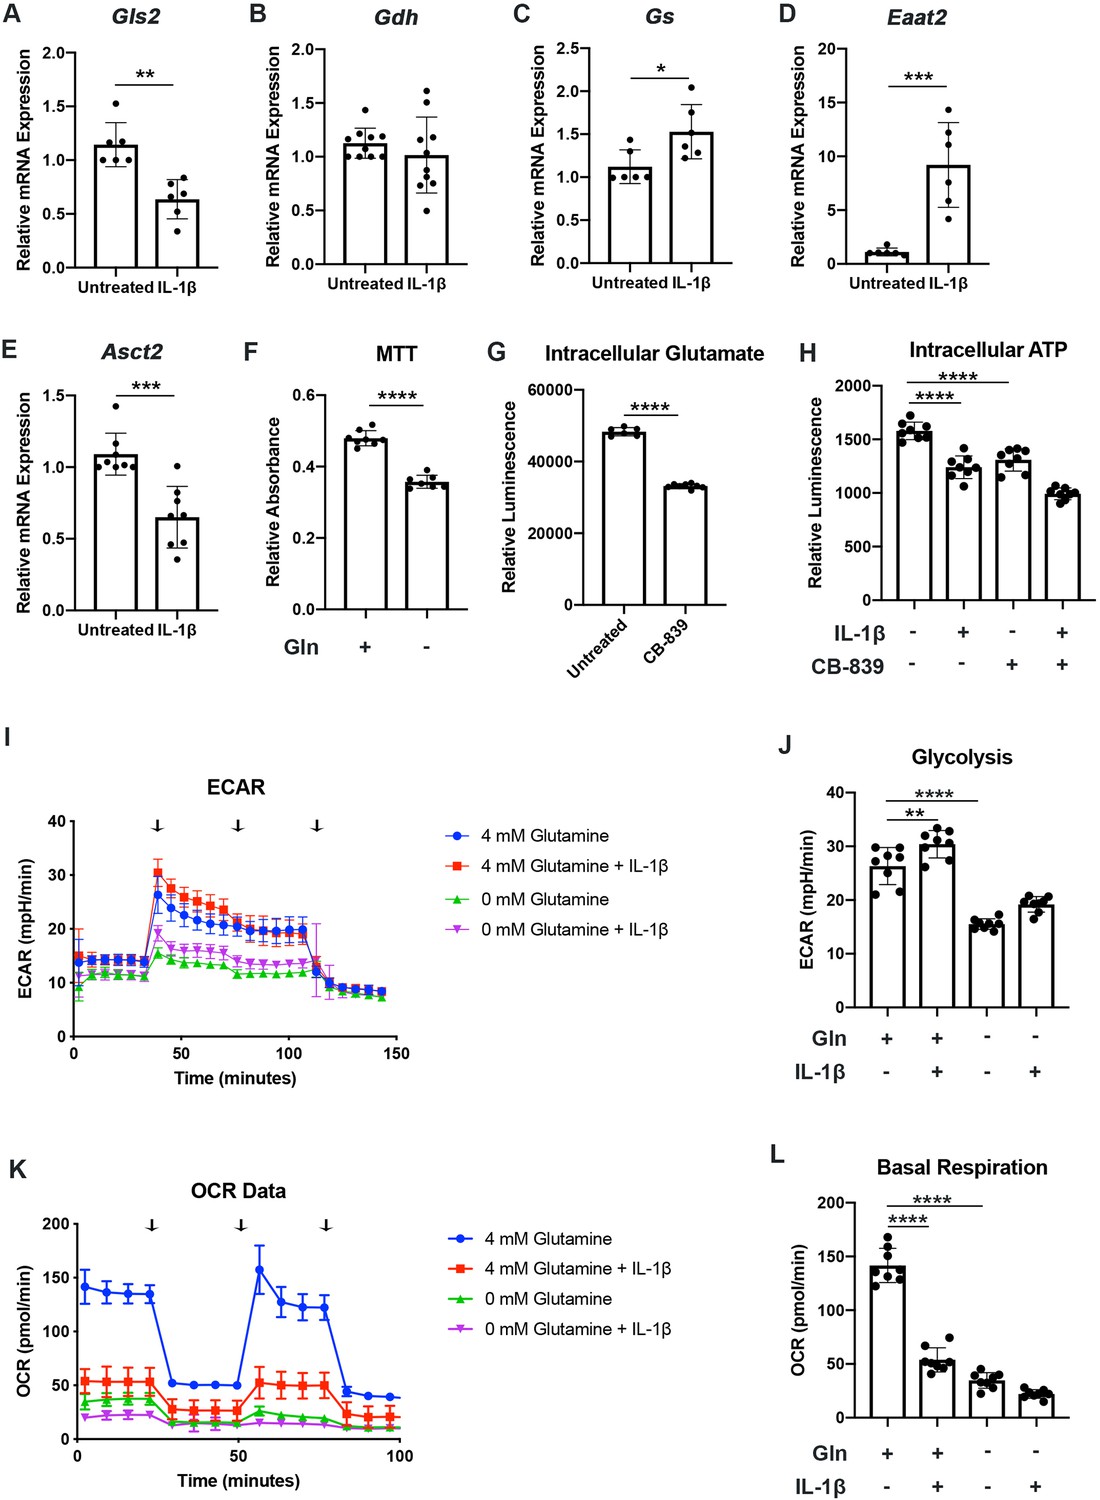
Chondrocytes rely upon glutamine for energy production.
(A–E) Primary murine chondrocytes were treated with IL-1β (10ng/mL) for 24hr. Gene expression of Gls2, Gdh, Gs, Eaat2, and Asct2 was measured by quantitative PCR. Results from n=6-10 independent biological samples (as depicted in individual panels). Unpaired Student’s T test was performed (A: **p=0.0011, B: p=0.375, C: *p=0.0227, D: ***p=0.0005, and E: ***p=0.0003). (F) Primary murine chondrocytes were cultured in media with 4mM glutamine and 0mM glutamine under constant glucose conditions. After 24hr, viability was measured by (3-(4, 5-dimethylthiazolyl-2)-2, 5-diphenyltetrazolium bromide) (MTT) assay. Results from n=6 samples from one representative experiment. Unpaired Student’s T test was performed, ****p<0.0001. (G) Primary murine chondrocytes were treated with CB-839 (1uM). Intracellular glutamate was measured by luminescent assay (n=6). Unpaired Student’s T test was performed, ****p<0.0001. (H) Primary murine chondrocytes were treated with CB-839 and/or IL-1β for 24hr. Intracellular ATP was measured by luminescent assay. Results from one representative experiment (n=8). One-way ANOVA was performed followed by Tukey’s multiple comparisons test, ****p<0.0001. (I–L) Primary sternal chondrocytes were cultured in media containing glutamine or media without glutamine for 24hr. Cells were then treated with IL-1β (10ng/mL) for 24hr. All values were normalized to cell viability of treatments relative to untreated cells as measured by MTT assay. (I–J) Extracellular acidification rate (ECAR) measurement in glycolysis stress test (Injection 1: no treatment, Injection 2: glucose, Injection 3: oligomycin, and Injection 4: 2-DG) or (K–L) Oxygen consumption rate (OCR) measurement in MitoStress test (Injection 1: no treatment, Injection 2: oligomycin, Injection 3: Carbonyl cyanide-p-trifluoromethoxyphenylhydrazone (FCCP), and Injection 4: antimycin A/rotenone) was performed on Seahorse Instrument. Measurements were performed every 6min with n=eight replicates per timepoint for each condition. Arrows represent injections timepoints. Graphs shown in Figure 1J and L are from a single timepoint. One-way ANOVA was performed followed by Tukey’s multiple comparisons test. J:**p=0.0077 and ****p<0.0001; L:****p<0.0001.
-
Figure 1—source data 1
Depicting original raw data related to Figure 1.
- https://cdn.elifesciences.org/articles/80725/elife-80725-fig1-data1-v2.xlsx
Figure 1—figure supplement 1
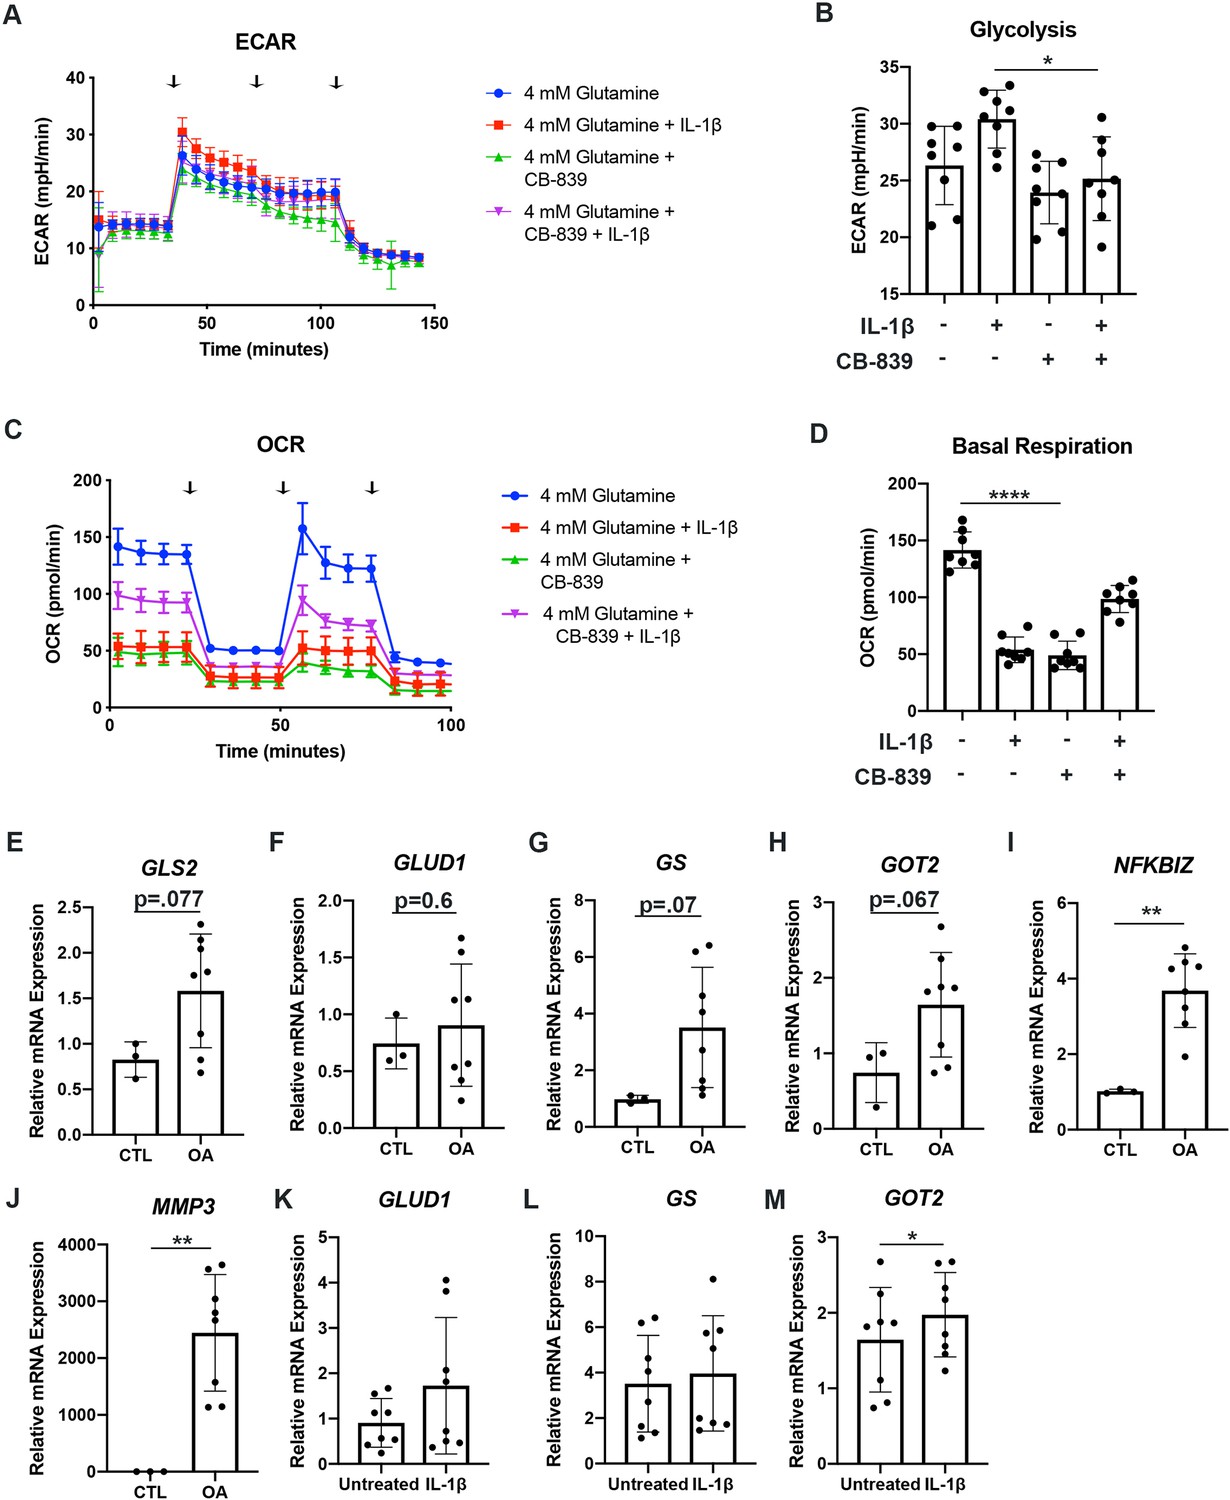
Chondrocytes rely upon glutamine for energy production.
(A–D) Primary sternal chondrocytes were cultured in media containing glutamine with or without CB-839 (1mM). Cells were then treated with IL-1β (10ng/mL) for 24hr. All values were normalized to cell viability of treatments relative to untreated cells as measured by MTT assay. (A–B) Extracellular acidification rate (ECAR) measurement in glycolysis stress test (Injection 1: no treatment, Injection 2: glucose, Injection 3: oligomycin, and Injection 4: 2-DG) (n=8) or (C–D) Oxygen consumption rate (OCR) measurement in MitoStress test (Injection 1: no treatment, Injection 2: oligomycin, Injection 3: FCCP, and Injection 4: antimycin A/rotenone) was performed on Seahorse Instrument. Measurements were performed every 6 min with n=eight replicates per timepoint for each condition. Arrows represent injection timepoints. Graphs shown in Figure 1—figure supplement 1B and D are from a single timepoint. One-way ANOVA was performed followed by Tukey’s multiple comparisons test. B: *p=0.012 and D: ****p<0.0001. (E–J) Human chondrocytes were isolated from osteoarthritis (OA) cartilage or healthy cartilage isolated from patients. Gene expression was measured by quantitative PCR (qPCR) (n=8). (K–M) Human chondrocytes were isolated from knee cartilage and cultured in media. Cells were treated with IL-1β for 24 hr. Gene expression was measured by qPCR from n=8 biological samples. Unpaired Student’s T test was performed. I:**p=0.0013, J:**p=0.0032, and M:*p=0.05.
-
Figure 1—figure supplement 1—source data 1
Depicting original raw data related to Figure 1—figure supplement 1.
- https://cdn.elifesciences.org/articles/80725/elife-80725-fig1-figsupp1-data1-v2.xlsx
Figure 2 with 1 supplement
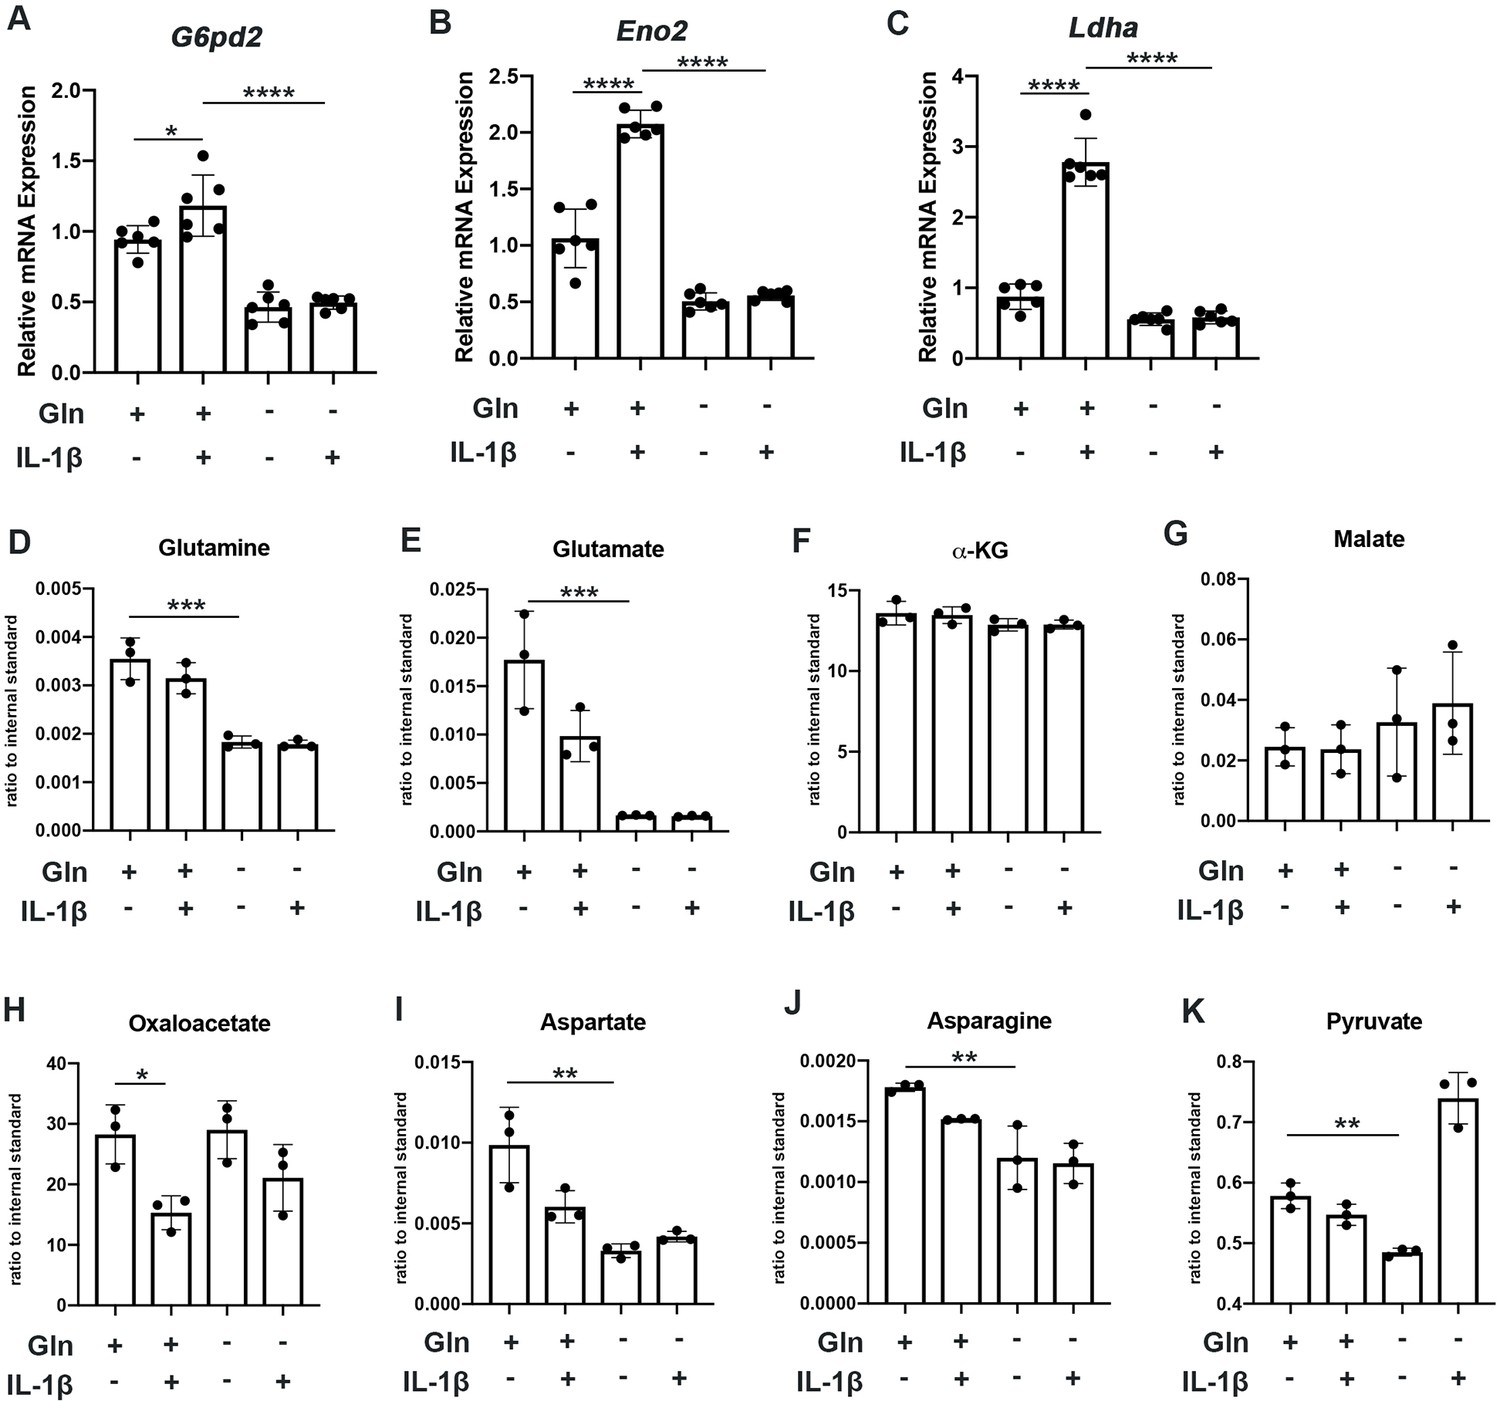
Glutamine deprivation causes metabolic reprogramming to inhibit glycolysis.
(A–C) Primary murine chondrocytes were cultured in media containing 4 mM glutamine or 0 mM glutamine for 24 hr. Cells were then treated with IL-1β (10 ng/mL) for 24 hr. Gene expression of G6pd2, Eno1, and Ldha was measured by quantitative PCR from n=6 replicates. One-way ANOVA was performed followed by Tukey’s multiple comparisons test. A: *p=0.0242, ****p<0.0001, B: ****p<0.0001, and C: ****p<0.0001. (D–K) Under similar conditions, metabolite levels were measured by Liquid chromatography–mass spectrometry (LC-MS) with n=3 replicates. One-way ANOVA was performed followed by Tukey’s multiple comparisons test. D: ***p=0.0003, E:***p=0.0006, F: p>0.05, G: p>0.05, H:*p=0.036, I: **p=0.0012, J:**p=0.0079, and K: **p=0.009.
-
Figure 2—source data 1
Depicting original raw data related to Figure 2.
- https://cdn.elifesciences.org/articles/80725/elife-80725-fig2-data1-v2.xlsx
Figure 2—figure supplement 1
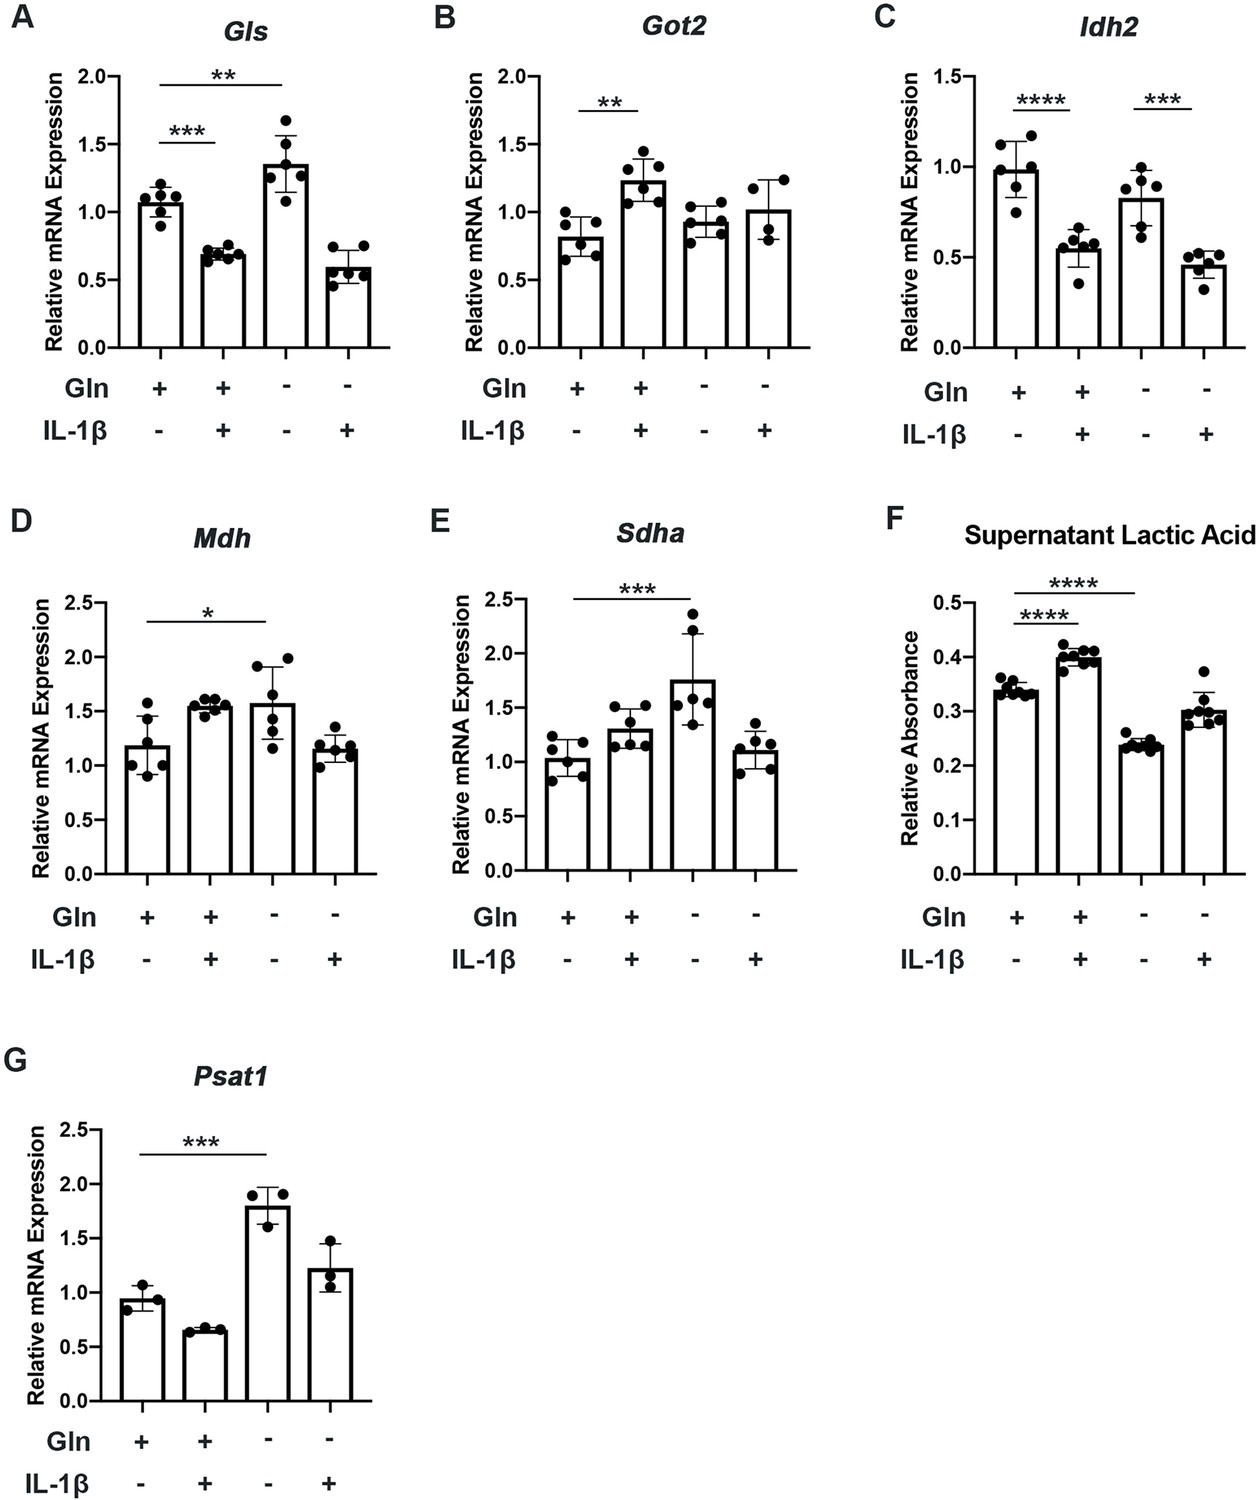
Glutamine deprivation causes metabolic reprogramming to inhibit glycolysis.
(A–E) Primary murine chondrocytes were cultured in media containing 4 mM glutamine or 0 mM glutamine for 24 hr. Cells were then treated with IL-1β (10 ng/mL) for 24 hr. Gene expression of Gls, Got2, Idh2, Mdh, and Sdha was measured by quantitative PCR (qPCR) from n=6 replicates. One-way ANOVA was performed followed by Tukey’s multiple comparisons test. A: **p=0.0085 and ***p<0.0004; B: **p=0.0011; C: ****p<0.0001 and ***p=0.0003; D:*p=0.036; E:***p=0.0005. (F) Under similar conditions, supernatant was collected, and lactic acid was measured. One-way ANOVA was performed followed by Tukey’s multiple comparisons test. ****p<0.0001. (G) Gene expression of Psat1 was measured under similar conditions by qPCR. One-way ANOVA was performed followed by Tukey’s multiple comparisons test. ***p=0.0006.
-
Figure 2—figure supplement 1—source data 1
Depicting original raw data related to Figure 2—figure supplement 1.
- https://cdn.elifesciences.org/articles/80725/elife-80725-fig2-figsupp1-data1-v2.xlsx
Figure 3 with 1 supplement
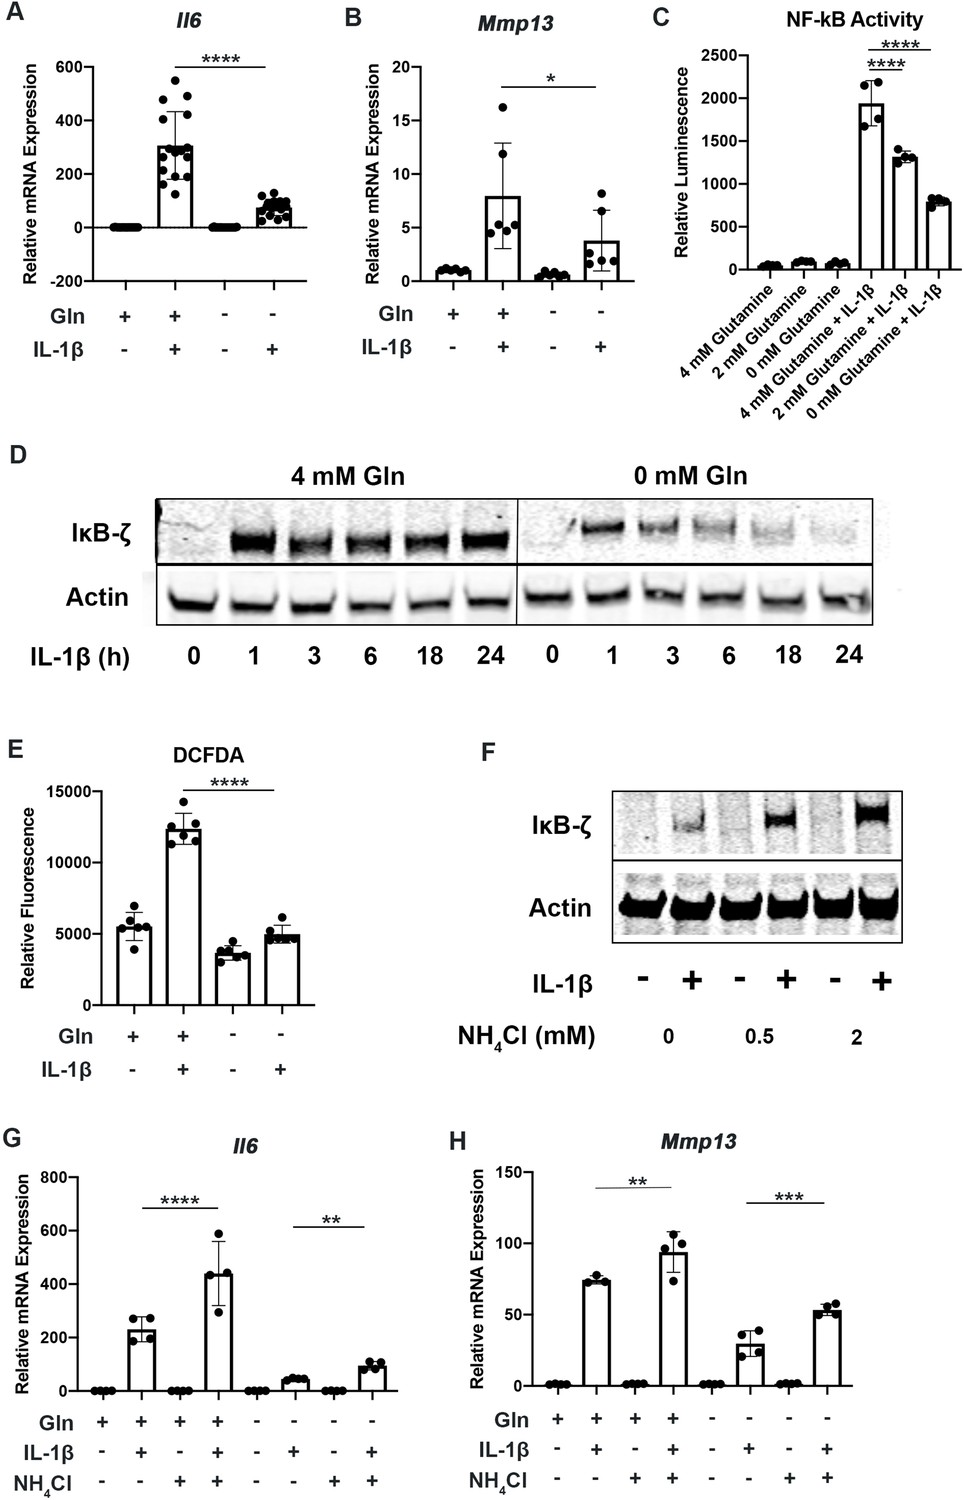
Glutamine deprivation inhibits the inflammatory response.
(A–B) Primary murine chondrocytes were cultured in media containing 4 mM glutamine or 0 mM glutamine for 24 hr. Cells were then treated with IL-1β (10 ng/mL) for 24 hr. Gene expression of Il6 and Mmp13 was measured by quantitative PCR (qPCR). One-way ANOVA was performed followed by Tukey’s multiple comparisons test. A:****p<0.0001 (n=16) and B: *p=0.0489 (n=6). (C) Primary murine chondrocytes were isolated from NF-κB-luciferase reporter mice. Chondrocytes were then cultured in media containing 4 mM, 2 mM, or 0 mM glutamine for 24 hr. Cells were then treated with IL-1β for 24 hr. NF-κB activity was measured by luciferase assay. n=4. One-way ANOVA was performed followed by Tukey’s multiple comparisons test. ****p<0.0001. (D) Primary murine chondrocytes were cultured in media containing 4 mM glutamine or 0 mM glutamine for 24 hr. Cells were treated with IL-1β for the indicated timepoints. IκB-ζ protein (85kDa) was measured by immunoblotting, with actin (42kDa) used as housekeeping. Image displays representative experiment. (E) Primary murine chondrocytes were cultured in media containing 4mM glutamine or 0 mM glutamine for 24 hr. Cells were then treated with IL-1β (10 ng/mL) for 24 hr. ROS levels were measured by 2’,7’ –dichlorofluorescin diacetate (DCFDA) assay using microplate reader. n=6. One-way ANOVA was performed followed by Tukey’s multiple comparisons test. ****p<0.0001. (F) Primary chondrocytes were cultured in media containing glutamine and supplemented with ammonium chloride at the indicated concentrations for 24 hr in the presence of IL-1β. IκB-ζ protein was measured by immunoblotting. (G–H) Primary chondrocytes were cultured in media containing 4 mM or 0 mM glutamine for 6 hr. Cells were then supplemented with or without 2 mM ammonium chloride. IL-1β stimulation was performed for 24 hr. Gene expression of Il6 and Mmp13 was measured by qPCR. n=4. One-way ANOVA was performed followed by Tukey’s multiple comparisons test. G: ****p<0.0001, **p=0.0065, and H: **p=0.0096, ***p=0.0005.
-
Figure 3—source data 1
Depicting original raw data related to Figure 3.
- https://cdn.elifesciences.org/articles/80725/elife-80725-fig3-data1-v2.xlsx
-
Figure 3—source data 2
Original raw data for Figure 3D, F.
- https://cdn.elifesciences.org/articles/80725/elife-80725-fig3-data2-v2.zip
Figure 3—figure supplement 1
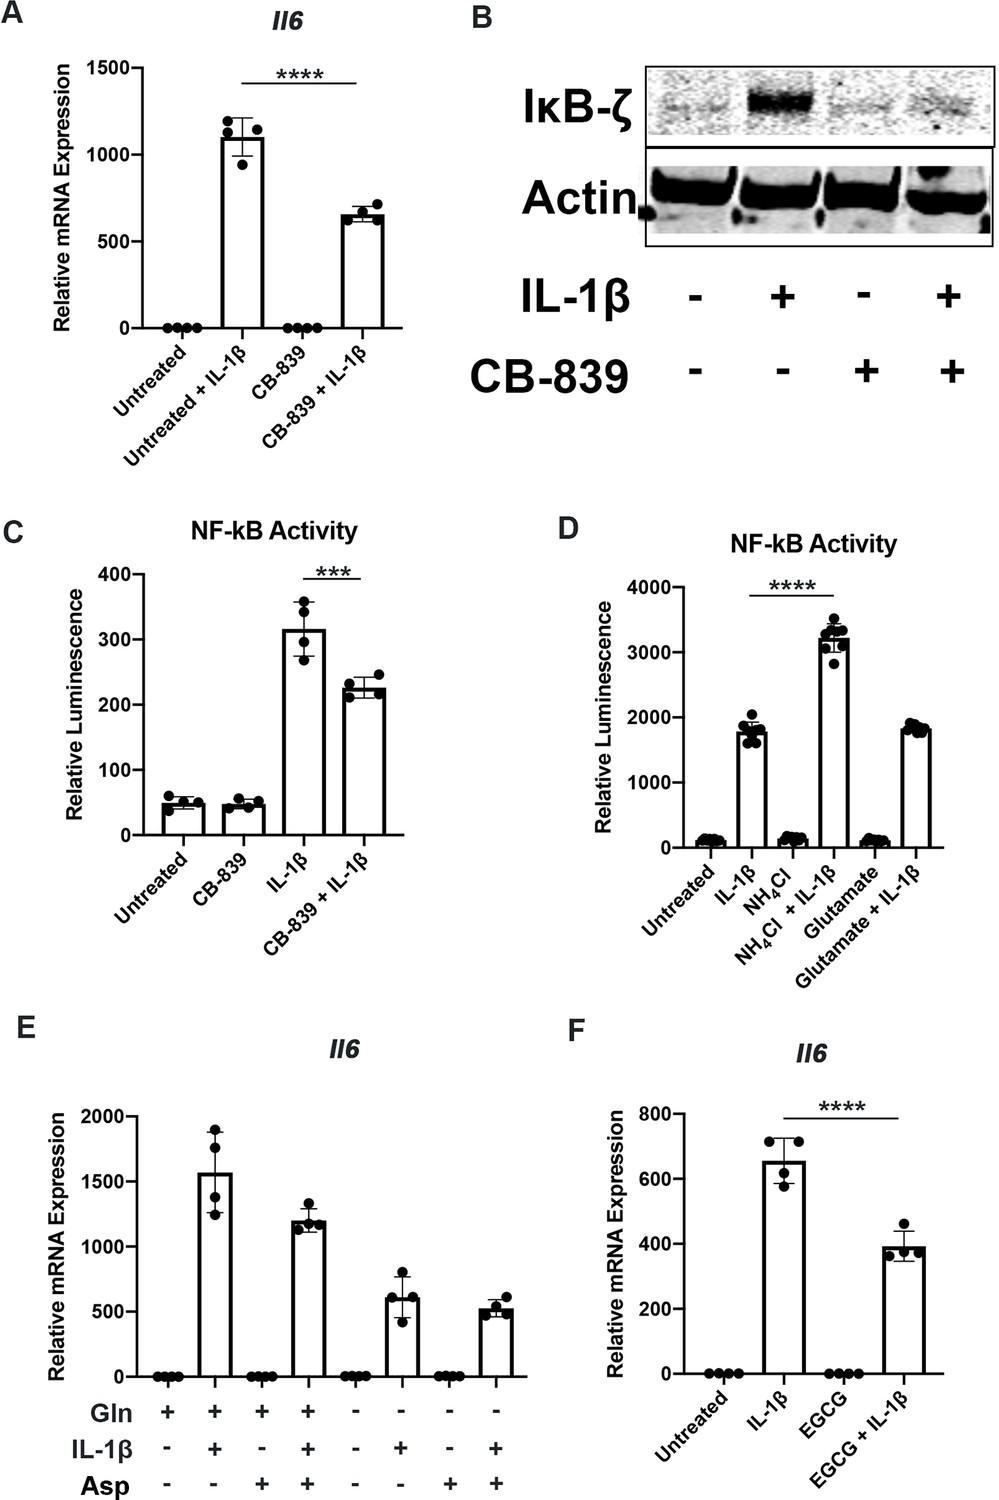
Glutamine deprivation inhibits the inflammatory response.
(A) Primary murine chondrocytes were treated with IL-1β in the presence or absence of CB-839 (1 mM) for 24 hr. Gene expression of Il6 was measured by quantitative PCR (qPCR). Results are representative of one experiment. n=4. One-way ANOVA was performed followed by Tukey’s multiple comparisons test. ****p<0.0001. (B) Under similar conditions, IκB-ζ protein (85kDa) levels were measured by immunoblotting. (C) Primary NF-κB-luciferase reporter chondrocytes were treated with IL-1β in the presence or absence of CB-839 (1 mM) for 24 hr. NF-κB activity was measured by luciferase assay. One-way ANOVA was performed followed by Tukey’s multiple comparisons test. ***p=0.0007 (D) Primary NF-κB-luciferase reporter chondrocytes were treated with IL-1β in the presence or absence of ammonium chloride (2 mM) or glutamate (200 μM). NF-κB activity was measured by luminescent luciferase assay. n=8. One-way ANOVA was performed followed by Tukey’s multiple comparisons test. ****p<0.0001. (E) Primary chondrocytes were cultured in media containing 4 mM or 0 mM glutamine for 6 hr. Cells were then supplemented with or without asparagine (1 mM) dissolved in PBS (IL-1β stimulation was performed for 24 hr). Gene expression of Il6 was measured by qPCR. n=4. One-way ANOVA was performed followed by Tukey’s multiple comparisons test. p>0.05. (F) Chondrocytes were treated with IL-1β in the presence or absence of Epigallocatechin 3-gallate (ECGC) for 24 hr. Gene expression of Il6 was measured by qPCR. Results are representative of one experiment. n=4. One-way ANOVA was performed followed by Tukey’s multiple comparisons test. ****p<0.0001.
-
Figure 3—figure supplement 1—source data 1
Depicting original raw data related to Figure 3—figure supplement 1.
- https://cdn.elifesciences.org/articles/80725/elife-80725-fig3-figsupp1-data1-v2.xlsx
-
Figure 3—figure supplement 1—source data 2
Original raw data related to Figure 3—figure supplement 1B.
- https://cdn.elifesciences.org/articles/80725/elife-80725-fig3-figsupp1-data2-v2.zip
Figure 4 with 1 supplement
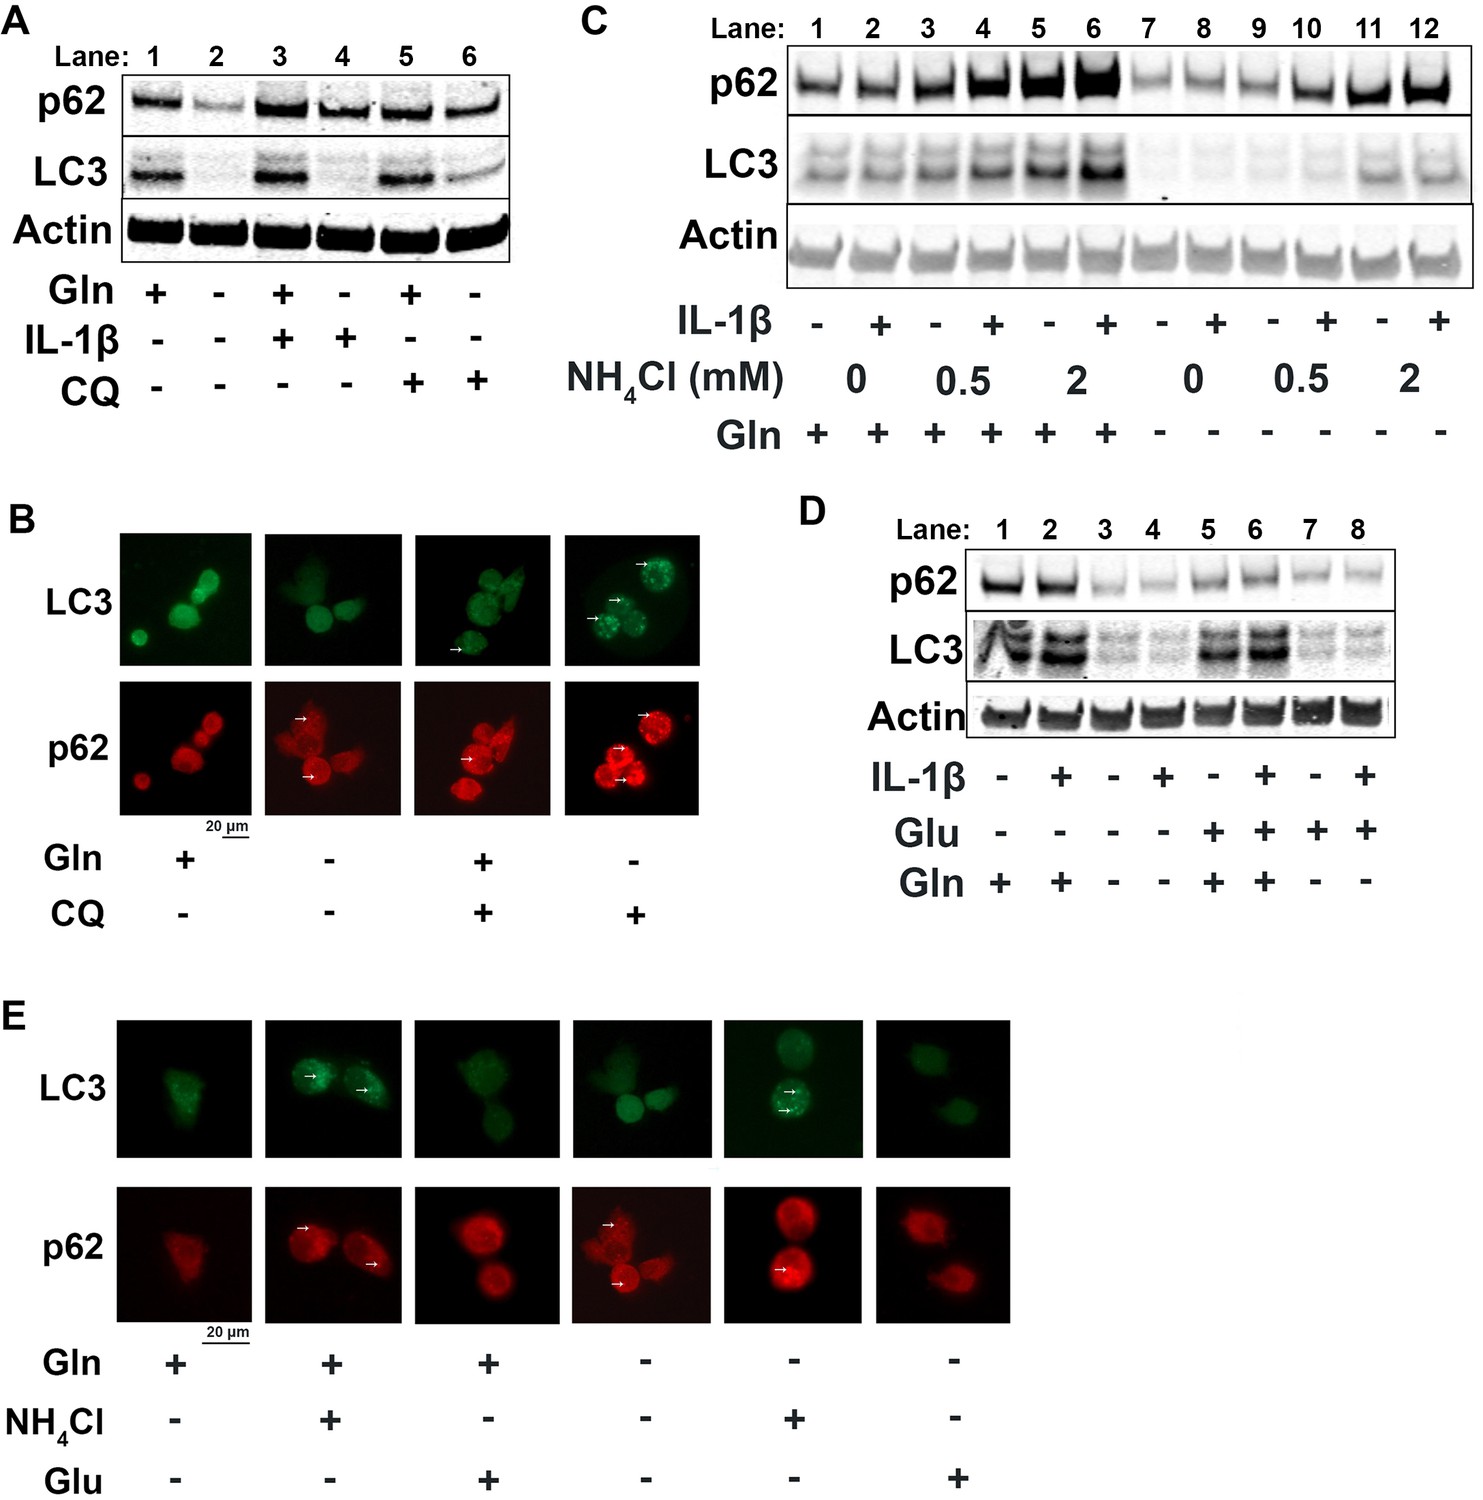
Glutamine deprivation promotes autophagy, and ammonia inhibits autophagy.
(A) Primary murine chondrocytes were cultured in media containing 4 mM glutamine or 0 mM glutamine for 24 hr. Cells were then treated with IL-1β (10 ng/mL) in the presence or absence of chloroquine (10 μM) for 24 hr. Protein expressions of p62 (62kDa) and LC3-II (17kDa) were measured by immunoblotting, with representative image displayed. Bands quantified in supplemental figure. (B) Primary murine chondrocytes were plated on coated cover slips cultured in glutamine containing or glutamine free media for 12 hr. Cells were treated with chloroquine (10 μM) for 6 hr. Cells were fixed with 4% formaldehyde in PBS, and immunofluorescence (IF) was performed for LC3B and p62. Cells were mounted on slides and imaged with representative images displayed. (C) Primary chondrocytes were cultured in media containing 4 mM or 0 mM glutamine. Cells were supplemented with ammonium chloride at the indicated concentrations. After 6 hr, cells were treated with IL-1β (10 ng/mL) for 24 hr. Immunoblotting was performed for p62 and LC3B to display autophagosome processing. Image displays representative experiment. Bands quantified in supplemental figure. (D) Primary chondrocytes were cultured in media containing 4 mM or 0 mM glutamine. Cells were supplemented with glutamate (200 μM). After 6 hr, cells were treated with IL-1β (10 ng/mL) for 24 hr. Immunoblotting was performed for p62 and LC3b. Image displays representative experiment. Bands quantified in supplemental figure. (E) Primary murine chondrocytes were plated on coated cover slips cultured in glutamine containing or glutamine free media for 12 hr. Cells were supplemented with ammonium chloride (2 mM) or glutamate (200 μM). Cells were fixed with 4% formaldehyde, and IF was performed for LC3b and p62. Cells were mounted on slides and imaged with representative images to display autophagosome punctate.
-
Figure 4—source data 1
Depicting original raw data related to Figure 4.
- https://cdn.elifesciences.org/articles/80725/elife-80725-fig4-data1-v2.xlsx
-
Figure 4—source data 2
Original raw data related to Figure 4A,C,D.
- https://cdn.elifesciences.org/articles/80725/elife-80725-fig4-data2-v2.zip
Figure 4—figure supplement 1
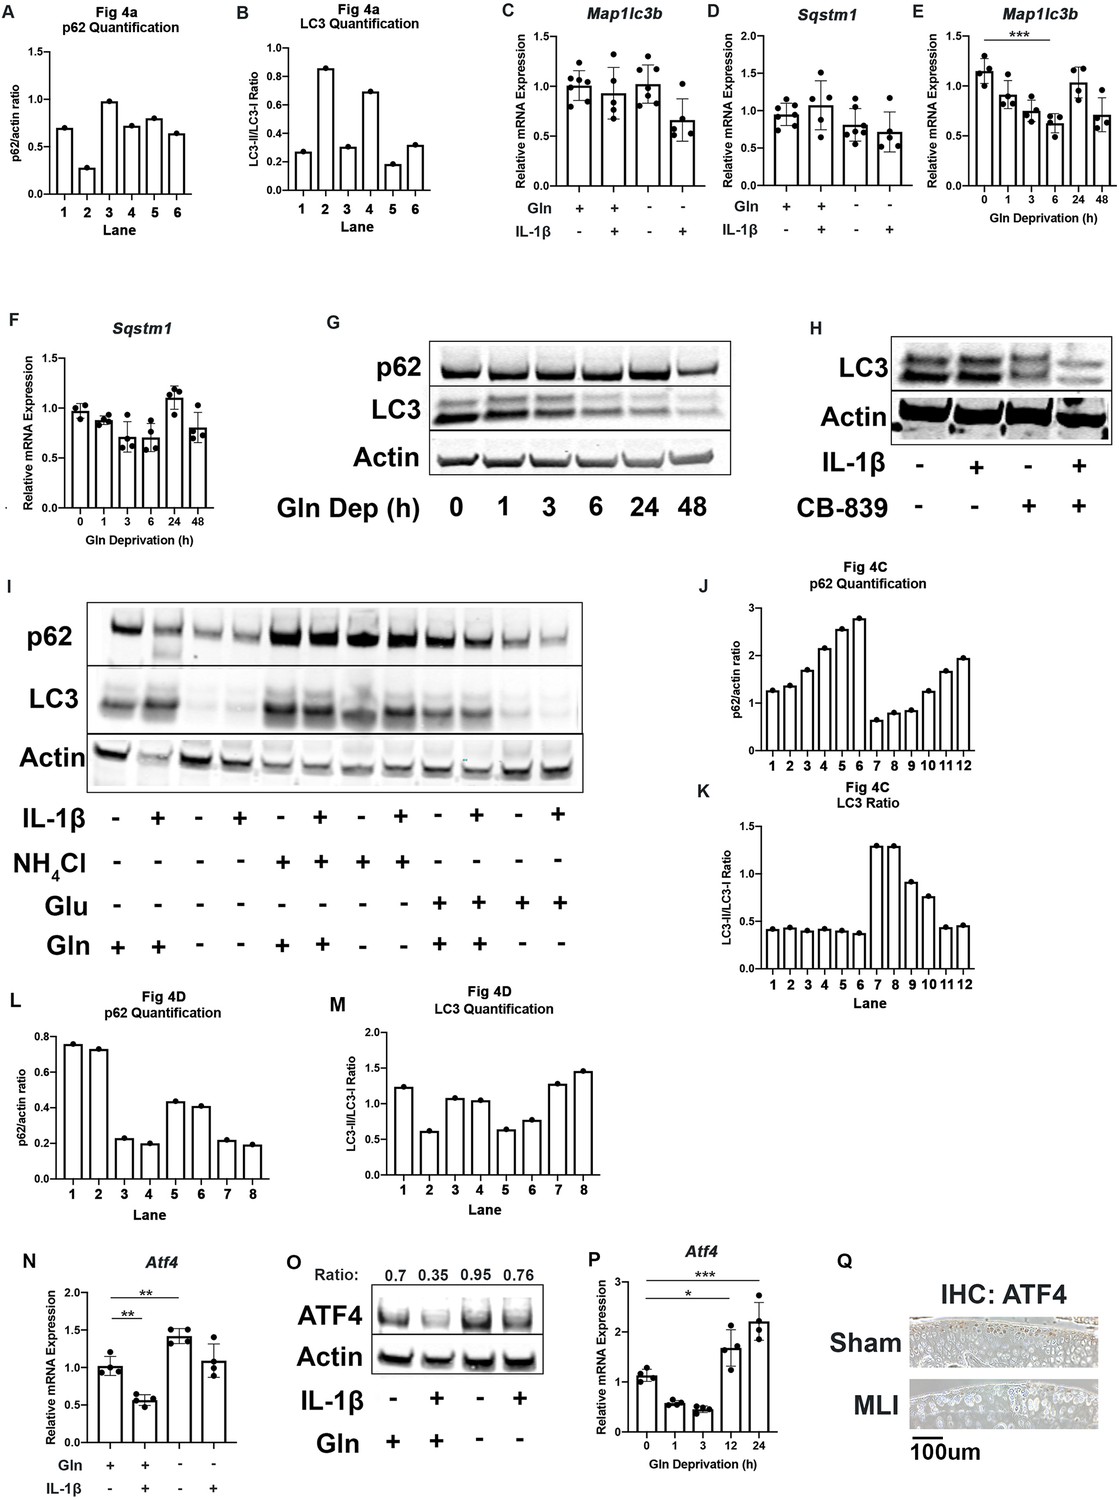
Glutamine deprivation promotes autophagy, and ammonia inhibits autophagy.
(A–B) Quantification of western blot image displayed in Figure 4A. p62 pixel intensity and actin pixel intensity were measured. Each lane is represented as the ratio of p62/actin pixel density. A similar measurement was taken of LC3-I and LC3-II, with ratio of LC3-1/LC3-II represented for each lane.
(C–D) Primary murine chondrocytes were cultured in media containing 4 mM glutamine or 0 mM glutamine for 24 hr. Cells were then treated with IL-1β (10 ng/mL) for 24 hr. Gene expression of Map1lc3b and Sqstm1 was measured by quantitative PCR (qPCR). Results from five to six biological replicates. One-way ANOVA was performed followed by Tukey’s multiple comparisons test. (E–F) Chondrocytes were plated in glutamine-free media for different amounts of time. Gene expression of Map1lc3b and Sqstm1 was measured by qPCR. One-way ANOVA was performed followed by Tukey’s multiple comparisons test. ***p=0.0004. (G) Under similar conditions, immunoblotting was performed for LC3 and p62. (H) Chondrocytes were treated with IL-1β in the presence or absence of CB-839 for 24 hr. Immunoblotting was performed for LC3. (I) Primary chondrocytes were cultured in media containing 4 mM or 0 mM glutamine. Cells were supplemented with ammonium chloride (2 mM) or glutamate (200 μM). After 6 hr, cells were treated with IL-1β (10 ng/mL) for 24 hr. Immunoblotting was performed for p62 and LC3B. Image displays representative experiment. (J–K) Quantification of western blot image displayed in Figure 4C. p62 pixel intensity and actin pixel intensity were measured. Each lane is represented as the ratio of p62/actin pixel density. A similar measurement was taken of LC3-I and LC3-II, with ratio of LC3-1/LC3-II represented for each lane. (L–M) Quantification of western blot image displayed in Figure 4D. p62 pixel intensity and actin pixel intensity were measured. Each lane is represented as the ratio of p62/actin pixel density. A similar measurement was taken of LC3-I and LC3-II, with ratio of LC3-1/LC3-II represented for each lane. (N) Primary murine chondrocytes were cultured in media containing 4 mM glutamine or 0 mM glutamine for 24 hr. Cells were then treated with IL-1β (10 ng/mL) for 24 hr. Gene expression of Atf4 was measured by qPCR. Results from n=4 replicates. One-way ANOVA was performed followed by Tukey’s multiple comparisons test. **p=0.0033 and **p=0.0088. (O) Immunoblotting was performed under similar conditions for ATF4 (38kDa). Fold change is listed above the lanes, normalized to actin. (P) Chondrocytes were plated in glutamine-free media for different amounts of time. Gene expression of Atf4 was measured by qPCR. One-way ANOVA was performed followed by Tukey’s multiple comparisons test. *p=0.0419 and ***p=0.0001. (Q) Meniscal-ligamentous injury (MLI) surgery was performed on 12-week-old mice to induce osteoarthritis (OA) with sham surgery performed on contralateral leg. After 2 weeks, knee joints were collected and sectioned. Immunohistochemistry (IHC) was performed for ATF4 which is display as brown stain, with representative image displayed.
-
Figure 4—figure supplement 1—source data 1
Depicting original raw data related to Figure 4—figure supplement 1.
- https://cdn.elifesciences.org/articles/80725/elife-80725-fig4-figsupp1-data1-v2.xlsx
-
Figure 4—figure supplement 1—source data 2
Original raw data related to Figure 4—figure supplement 1G,H,I,O.
- https://cdn.elifesciences.org/articles/80725/elife-80725-fig4-figsupp1-data2-v2.zip
Figure 5 with 1 supplement
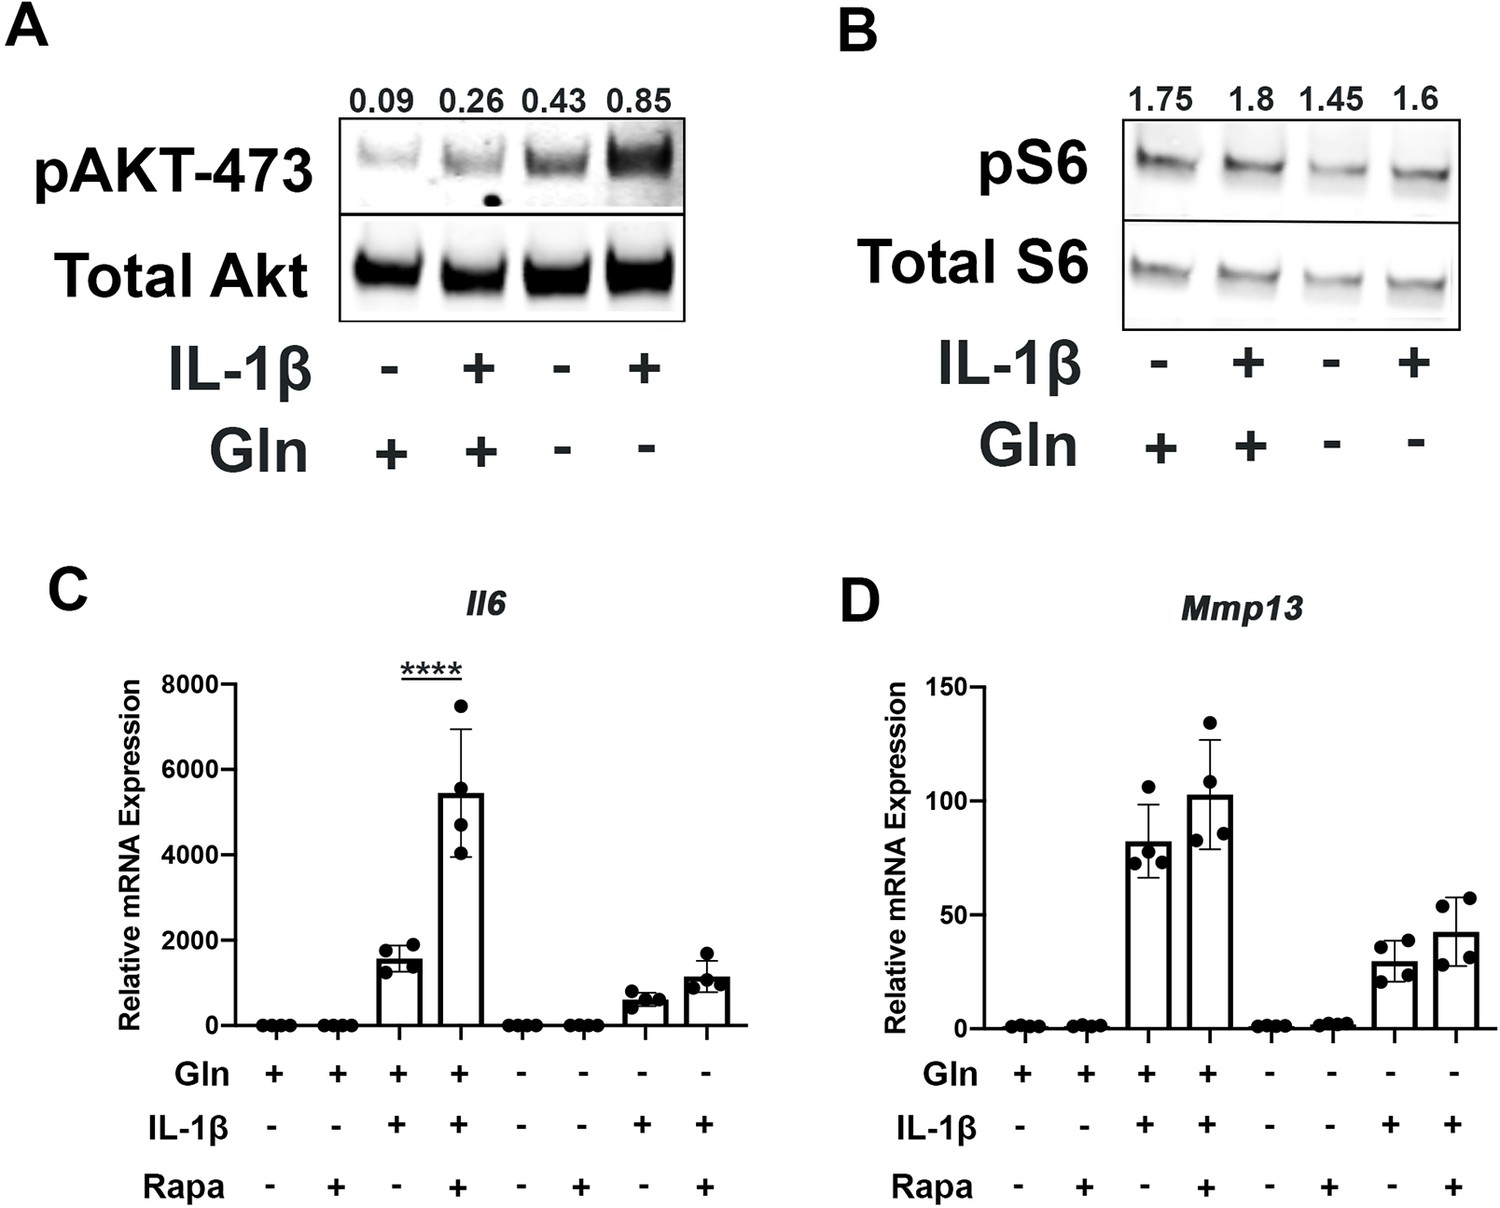
Glutamine deprivation modulates mTOR activation.
(A) Primary murine chondrocytes were cultured in media containing 4 mM glutamine or 0 mM glutamine for 24 hr. Cells were then treated with IL-1β (10 ng/mL). After 24 hr, lysates were collected, and immunoblotting was performed for pAKT (60kDa) and total Akt (58kDa). (B) Under similar conditions, immunoblotting was performed for pS6 and total S6 (32kDa). (C–D) Primary murine chondrocytes were cultured in media containing 4 mM glutamine or 0 mM glutamine for 24 hr. Cells were then treated with IL-1β (10 ng/mL) in the presence or absence of rapamycin 50 nM for 24 hr. Gene expression of Il6 and Mmp13 was measured by quantitative PCR. Results from one representative experiment. n=4. One-way ANOVA was performed followed by Tukey’s multiple comparisons test. C:****p<0.0001.
-
Figure 5—source data 1
Depicting original raw data related to Figure 5.
- https://cdn.elifesciences.org/articles/80725/elife-80725-fig5-data1-v2.xlsx
-
Figure 5—source data 2
Original raw data related to Figure 5A, B.
- https://cdn.elifesciences.org/articles/80725/elife-80725-fig5-data2-v2.zip
Figure 5—figure supplement 1
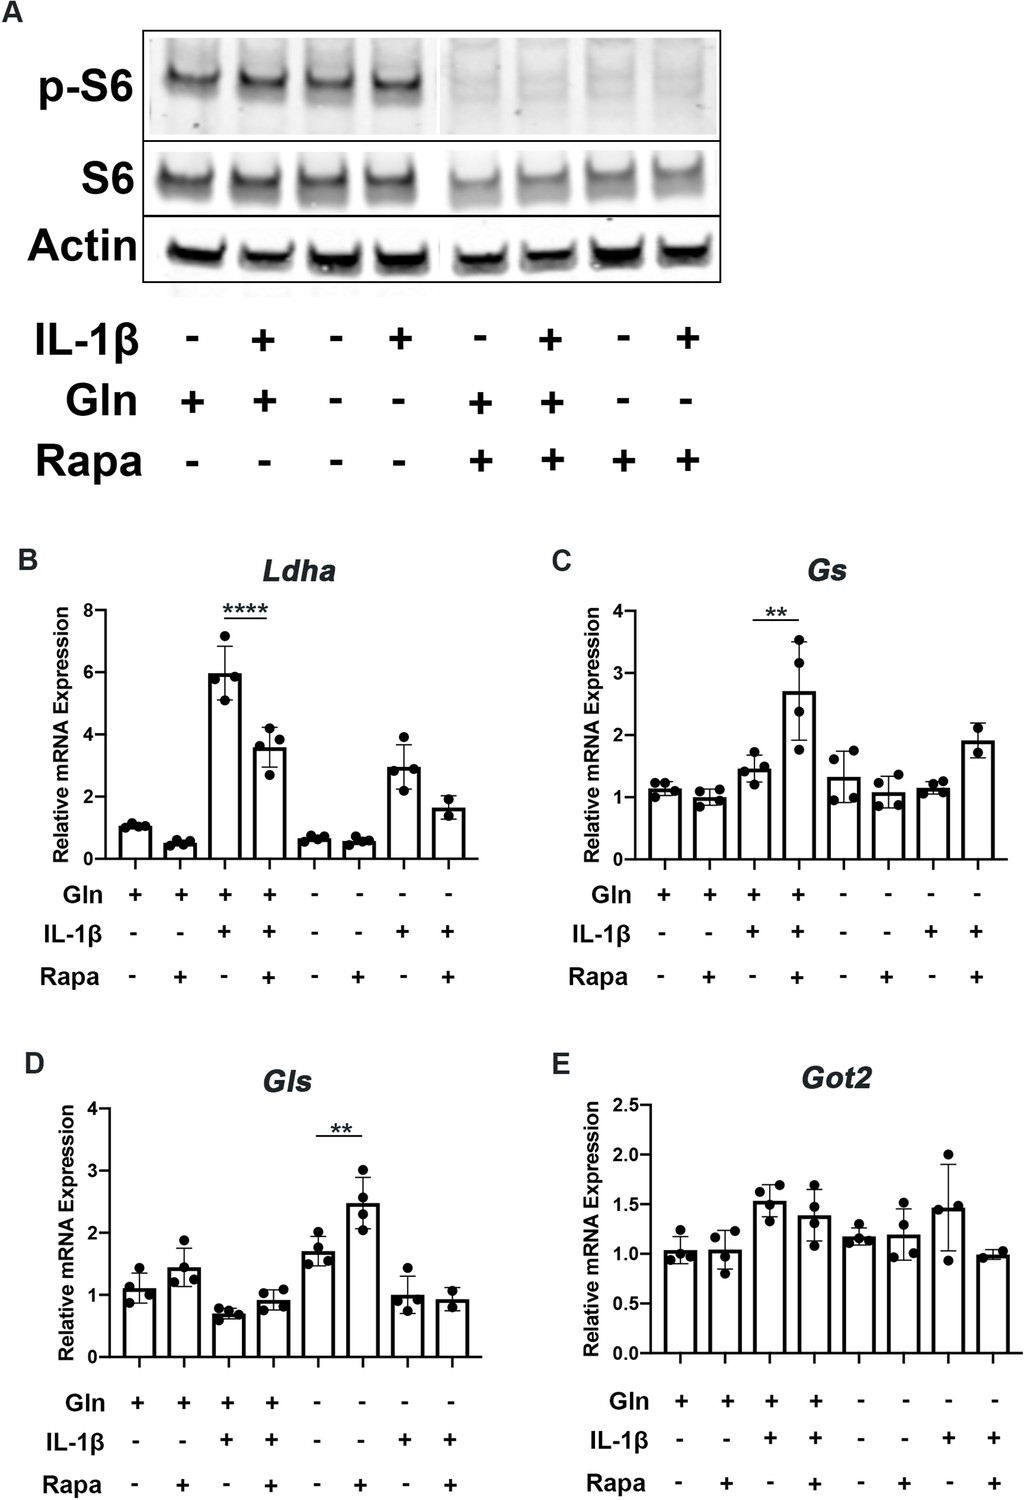
Glutamine deprivation modulates mTOR activation.
(A) Primary murine chondrocytes were cultured in media containing 4 mM glutamine or 0 mM glutamine for 24 hr. Cells were then treated with IL-1β (10 ng/mL) for 24 hr in the presence or absence of rapamycin (50 nM). Immunoblotting was performed for pS6 and total S6 (32kDa). (B–E) Under similar conditions, gene expression was measured by quantitative PCR. One-way ANOVA was performed followed by Tukey’s multiple comparisons test. B:****p<0.0001, C: **p=0.0017, and D:**p=0.0088. n=4.
-
Figure 5—figure supplement 1—source data 1
Depicting original raw data related to Figure 5—figure supplement 1.
- https://cdn.elifesciences.org/articles/80725/elife-80725-fig5-figsupp1-data1-v2.xlsx
-
Figure 5—figure supplement 1—source data 2
Original raw data related to Figure 5—figure supplement 1A.
- https://cdn.elifesciences.org/articles/80725/elife-80725-fig5-figsupp1-data2-v2.zip
Tables
Key resources table
| Reagent type (species) or resource | Designation | Source or reference | Identifiers | Additional information |
|---|---|---|---|---|
| Genetic reagent (Mus, musculus) | C57BL/6mice | Jackson Labs | RRID:IMSR_JAX:000664 | |
| Genetic reagent (Mus, musculus) | NF-kB luciferase reporter mice | Jackson Labs | RRID:IMSR_JAX:027529 | |
| Biological sample (human) | Human osteoarthritis chondrocytes | Isolated from discarded human tissues, Arra et al., 2020 | ||
| Biological sample (mouse) | Murine chondrocytes | Isolated from sterna of newborn pups of genetic strains indicated above, Arra et al., 2020 | ||
| Antibody | Anti-ATF4 (rabbit polyclonal) | ThermoFisher | 10835–1-AP, RRID:AB_2058600 | 1:1,000 for Western blot |
| Antibody | Biotinylated secondary (horse anti-rabbit polyclonal) | Vector Biolabs | BP-1100 | 1:1,000 for IHC |
| Antibody | Anti-LC3b (rabbit polyclonal) | Cell Signaling Technology | 2775, RRID:AB_915950 | 1:1,000 Western blot; 1:100 for IF |
| Antibody | Anti-p62 (mouse monoclonal) | Abnova | 2C11, RRID:AB_437085 | 1:1,000 Western blot; 1:100 for IF |
| Antibody | Anti-IkB-z (rat monoclonal) | Invitrogen | 14-16801-82, RRID:AB_11218083 | 1:1,000 Western blot |
| Antibody | Anti-p-Akt (rabbit polyclonal) | Cell Signaling Technology | 9271, RRID:AB_329825 | 1:1,000 Western blot |
| Antibody | Anti-Akt (rabbit polyclonal) | Cell Signaling Technology | 9272, RRID:AB_329827 | 1:1,000 Western blot |
| Antibody | Anti-p-S6 (rabbit polyclonal) | Cell Signaling Technology | 2211, RRID:AB_331679 | 1:1,000 Western blot |
| Antibody | Anti-S6 (rabbit polyclonal) | Cell Signaling Technology | 2217, RRID:AB_331355 | 1:1,000 Western blot |
| Antibody | Anti-Actin (mouse monoclonal) | Sigma-Aldrich | A2228, RRID:AB_476697 | 1:10,000 Western blot |
| Sequence-based reagent | quantitative PCR primers | Integrated DNA technologies | N/A | Custom DNA oligos |
| Peptide, recombinant protein | Collagenase D | Roche | COLLD-RO | |
| Peptide, recombinant protein | Pronase | Roche | PRON-RO | |
| Peptide, recombinant protein | IL-1b | Peprotech | 211-11B | 10ng/mL |
| Commercial assay or kit | Diaminobenzidine (DAB) peroxidase kit | Vector Biolabs | SK4100 | |
| Commercial assay or kit | Lactate assay kit | Eton Biosciences | 1.2E+09 | |
| Commercial assay or kit | Purelink RNA Mini Kit | Ambion | 12183025 | |
| Commercial assay or kit | High capacity cDNA Reverse Transcription Kit | Applied Biosystems | 4368814 | |
| Commercial assay or kit | ATP assay kit | Biovision | K255 | |
| Commercial assay or kit | Luminescence assay kit | GoldBio | I-930 | |
| Commercial assay or kit | Glutamate-Glo Assay kit | Promega | J7021 | |
| Chemical compound and drugs | CB-839 | Selleck | S7655 | |
| Chemical compound and drugs | Rapamycin | MedChem Express | HY-10219 | |
| Chemical compound and drugs | Ammonium Chloride | Sigma-Aldrich | A9434 | |
| Chemical compound and drugs | L-glutamic acid | Sigma-Aldrich | G1626 | |
| Chemical compound and drugs | Streptavidin Horseradish peroxidase (HRP) | Vector Biolabs | SA-5004–1 | |
| Chemical compound and drugs | DAPI | Cell Signaling Technology | 9071 | |
| Chemical compound and drugs | Trizol | ThermoFisher | 15596026 | |
| Chemical compound and drugs | DCFDA | Sigma-Aldrich | D6883 | |
| Chemical compound and drugs | MTT | Sigma-Aldrich | M655 | |
| Chemical compound and drugs | Immunocal | Fisher Scientific | NC9044643 | |
| Chemical compound and drugs | iTaq universal SYBR Green | BioRad | 1725120 | |
| Software and algorithm | Gen5 software | Agilent BioTek | BTGENSCPRIM | |
| Software and algorithm | Prism | Graphpad | RRID:SCR_002798 | |
| Software and algorithm | Wave | Agilent BioTek | RRID:SCR_014526 |
Table 1
List of primers.
| Primer | Sequence (5’→3’) |
|---|---|
| m-Il6 | GCTACCAAACTGGATATAATCAGGA |
| CCAGGTAGCTATGGTACTCCAGAA | |
| m-Mmp13 | GCCAGAACTTCCCAACCAT |
| TCAGAGCCCAGAATTTTCTCC | |
| m-Atf4 | TCGATGCTCTGTTTCGAATG |
| AGAATGTAAAGGGGGCAACC | |
| m-Lc3 | TGGGACCAGAAACTTGGTCT |
| GACCAGCACCCCAGTAAGAT | |
| m-p62 | AGAATGTGGGGGAGAGTGTG |
| TCTGGGGTAGTGGGTGTCAG | |
| m-GLS | CTACAGGATTGCGAACATCTGAT |
| ACACCATCTGACGTTGTCTGA | |
| m-GDH | GGCCGATTGACCTTCAAATA |
| TCCTGTCCTGGAACTCTGCT | |
| m-GS | CATTGACAAACTGAGCAAGAGG |
| AAGTCGTTGATGTTGGAGGTT | |
| m-EAAT2 | GGCAATCCCAAACTCAAGAA |
| GTGCTATTGGCCTCCTCAGA | |
| m-ASCT2 | CAACCAAAGAGGTGCTGGAT |
| CCTCCACCTCACAGAGAAGC | |
| m-G6pd2 | CTGAATGAACGCAAAGCTGA |
| CAATCTTGTGCAGCAGTGGT | |
| m-Eno1 | GCCTCCTGCTCAAAGTCAAC |
| AACGATGAGACACCATGACG | |
| m-Ldha | TGGAAGACAAACTCAAGGGCGAGA |
| TGACCAGCTTGGAGTTCGCAGTTA | |
| m-Mdh | GGTGCAGCCTTAGATAAATACGC |
| AGTCAAGCAACTGAAGTTCTCC | |
| m-Sdha | AACACTGGAGGAAGCACACC |
| AGTAGGAGCGGATAGCAGGA | |
| m-Idh2 | AACCGTGACCAGACTGATGAC |
| ATGGTGGCACACTTGACAGC | |
| m-Got2 | GATCCGTCCCCTGTATTCCA |
| CACCTCTTGCAACCATTGCTT | |
| h-GLS2 | TCTCTTCCGAAAGTGTGTGAGC |
| CCGTGAACTCCTCAAAATCAGG | |
| h-GLUD1 | TATCCGGTACAGCACTGACG |
| GCTCCATGGTGAATCTTCGT | |
| h-GS | CCTGCTTGTATGCTGGAGTC |
| GATCTCCCATGCTGATTCCT | |
| h-GOT2 | GTTTGCCTCTGCCAATCATATG |
| GAGGGTTGGAATACATGGGAC | |
| h-NFKBIZ | CCGTTTCCCTGAACACAGTT |
| AGAAAAGACCTGCCCTCCAT | |
| h-MMP3 | CTGGACTCCGACACTCTGGA |
| CAGGAAAGGTTCTGAACTGACC | |
| h-ATF4 | TCTCCAGCGACAAGGCTAA |
| CAATCTGTCCCGGAGAAGG |
Additional files
Download links
A two-part list of links to download the article, or parts of the article, in various formats.
Downloads (link to download the article as PDF)
Open citations (links to open the citations from this article in various online reference manager services)
Cite this article (links to download the citations from this article in formats compatible with various reference manager tools)
Glutamine metabolism modulates chondrocyte inflammatory response
eLife 11:e80725.
https://doi.org/10.7554/eLife.80725


