The lingering effects of Neanderthal introgression on human complex traits
- Department of Computational Biology, Cornell University, United States
- Department of Human Genetics, University of California, Los Angeles, United States
- Department of Computer Science, University of California, Los Angeles, United States
- Analytical and Translational Genetics Unit, Center for Genomic Medicine, Massachusetts General Hospital, United States
- Program in Medical and Population Genetics, Broad Institute of MIT and Harvard, United States
- Stanley Center for Psychiatric Research, Broad Institute of MIT and Harvard, United States
- Dana-Farber Cancer Institute, Harvard Medical School, United States
- Department of Genetics, Harvard Medical School, United States
- Department of Human Evolutionary Biology, Harvard University, United States
- Center for Genetic Epidemiology, Department of Public and Population Health Sciences, University of Southern California, United States
- Division of Genetics,Department of Medicine, Brigham and Women’s Hospital, Harvard Medical School, United States
- Howard Hughes Medical Institute, Harvard Medical School, United States
- Department of Computational Medicine, University of California, Los Angeles, United States
Figures
Figure 1 with 2 supplements
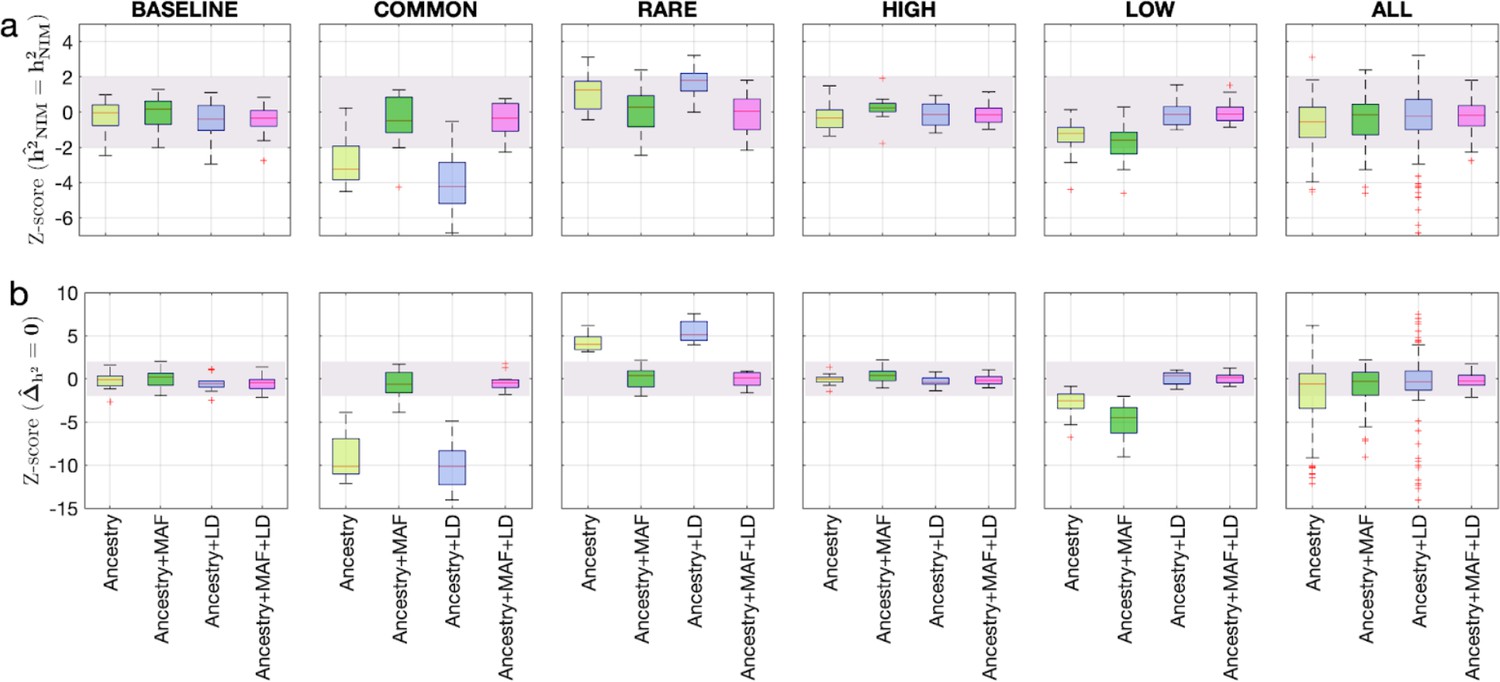
Benchmarking approaches for estimating the heritability components of Neanderthal introgression.
We group simulations by relationships between minor allele frequency (MAF) and local linkage disequilibrium at an SNP on effect size (MAF-LD coupling): BASELINE, COMMON, RARE, HIGH, LOW. In each group, we perform 12 simulations with varying polygenicity and heritability (see ‘Methods’). Additionally, we combine results from all simulations together as ALL. We plot the distributions of two Z-scores (y-axis), one on each row: (a) Z-score ( = ) tests whether the estimated and true Neanderthal Informative Mutations (NIM) heritability are equal, and (b) Z-score () tests whether the estimated per-NIM heritability is the same as the per-SNP heritability of modern human (MH) SNPs (see ‘Methods’). In each panel, we present results from a variance components analysis method (RHE-mc) using four different input annotations: ancestry only where ancestry is either NIM or MH, ancestry + MAF, ancestry + LD, ancestry + MAF + LD. A calibrated method is expected to have Z-scores distributed around zero and within ±2 (shaded region). Among all tested approaches, only RHE-mc with ancestry + MAF + LD annotations is calibrated across simulations.
-
Figure 1—source data 1
RHE-mc results in simulated data.
- https://cdn.elifesciences.org/articles/80757/elife-80757-fig1-data1-v2.zip
Figure 1—figure supplement 1
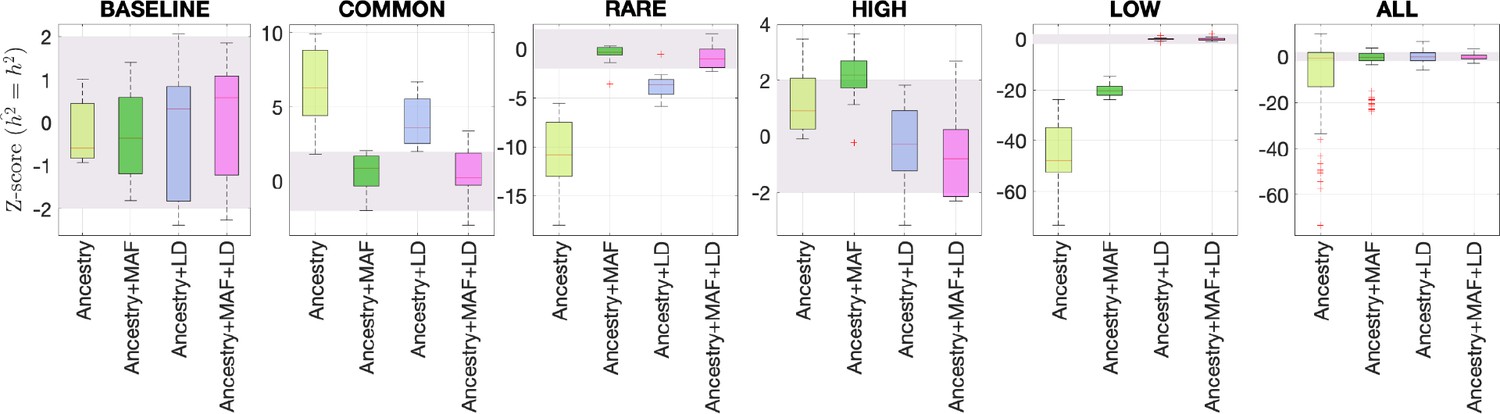
Benchmarking different methods for estimating the total SNP heritability.
We grouped the simulations by the five different MAF-LD coupling: BASELINE, COMMON, RARE, HIGH, LOW, as labeled on top of each column. In each group, there are 12 simulations with different levels of polygenicity and heritability (see ‘Methods’). Additionally, we combined simulations from all five architectures together as ALL for the sixth column. On the y-axis, Z-score () tests whether the estimated and simulated total heritability are equal. In each panel, the results from RHE-mc with four different annotations, ancestry only, ancestry + MAF, ancestry + LD, ancestry + MAF + LD are shown on the x-axis. A calibrated method is expected to have all Z-scores distributed around zero and within ±2 (shaded region). Among all tested methods, only RHE-mc with annotation ancestry + MAF + LD satisfies this criterion.
Figure 1—figure supplement 2
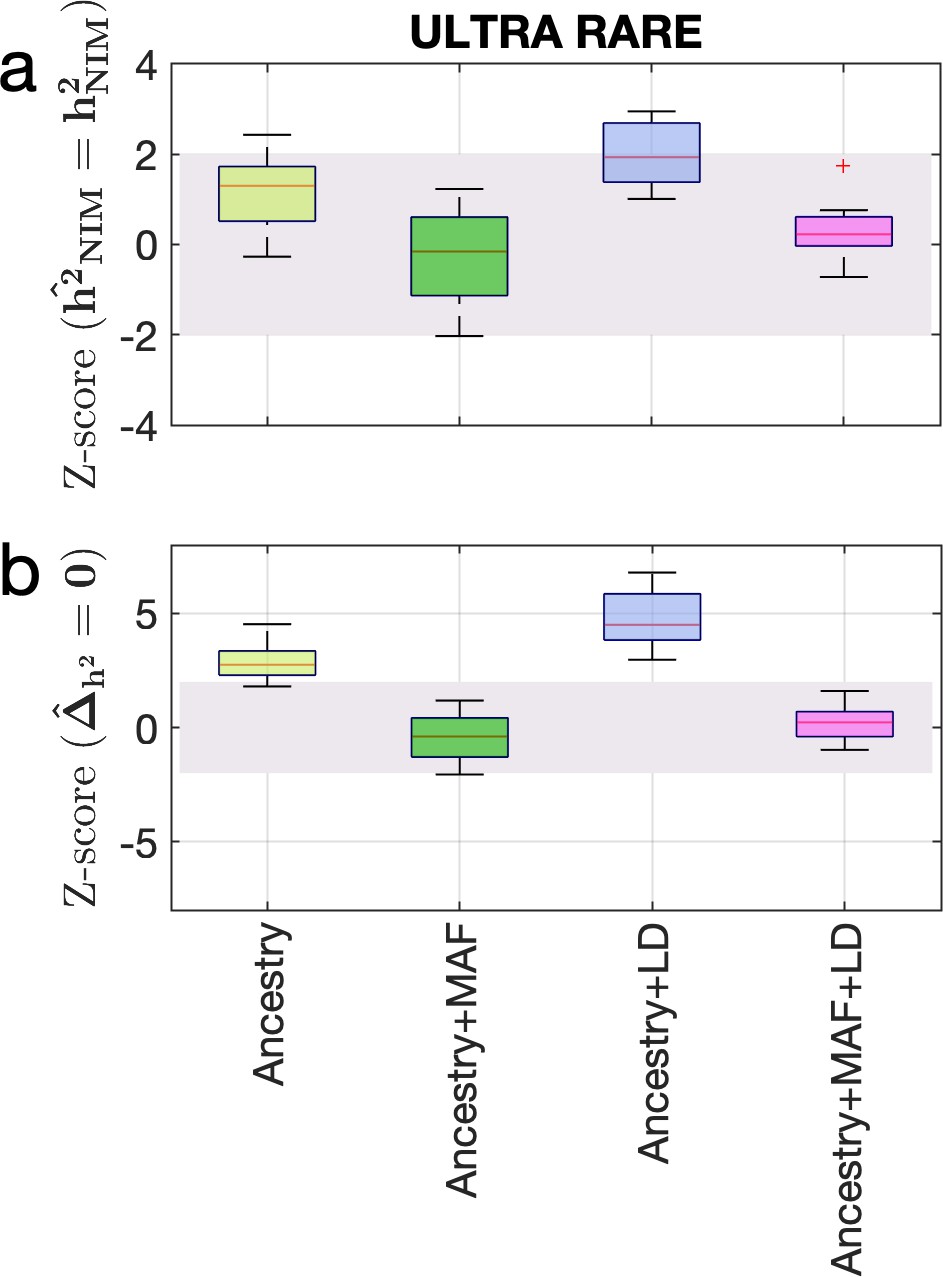
Estimating the heritability components of Neanderthal introgression under a genetic architecture in which rare variants are enriched for phenotypic effects.
We performed simulations under an ULTRA RARE genetic architecture in which SNPs with MAF <1% account for 90% of the causal variants. We plot the distributions of two Z-scores (y-axis), one on each row: (a) Z-score ( = ) tests whether the estimated and true Neanderthal Informative Mutations (NIM) heritability are equal, and (b) Z-score () tests whether the estimated per-NIM heritability is the same as the per-SNP heritability of modern human (MH) SNPs. In each panel, we present results from a variance components analysis method (RHE-mc) using four different input annotations: ancestry only where ancestry is either NIM or MH, ancestry + MAF, ancestry + LD, ancestry + MAF + LD.
Figure 2
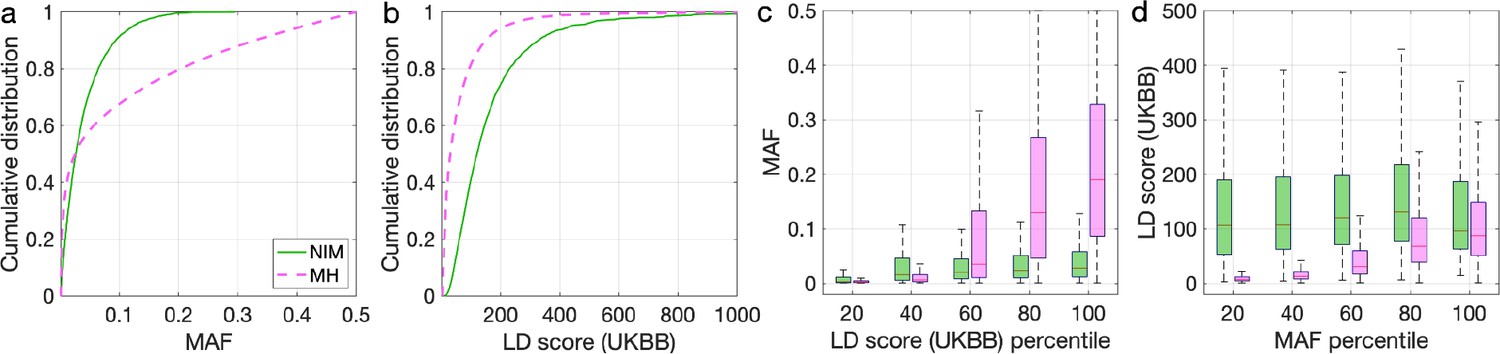
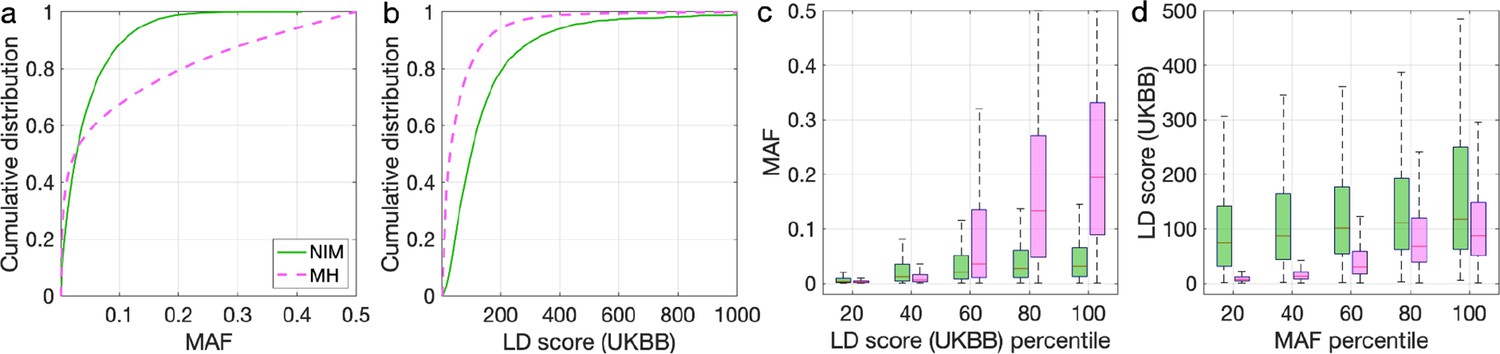
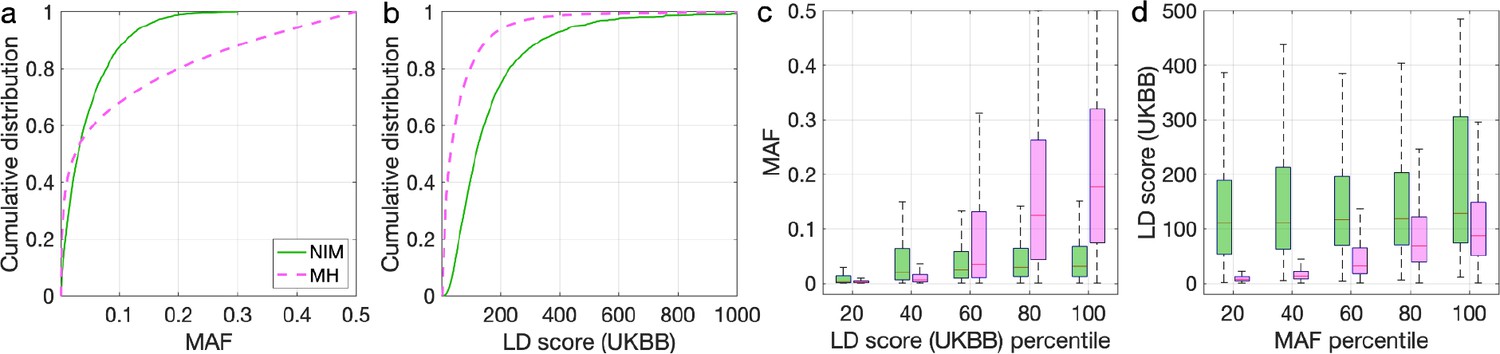
Distributions of minor allele frequency (MAF) and LD-score in Neanderthal Informative Mutations (NIMs) and modern human (MH) SNPs.
Empirical cumulative distribution functions of (a) MAF and (b) LD scores of NIMs (in solid green line) and MH SNPs (in pink dashed line) estimated in the UK Biobank (UKBB). (c) Boxplots of MAFs of NIMs (on the left filled in green) and MH SNPs (on the right side filled in pink) while controlling for LD score (UKBB). (d) Boxplots of LD score (UKBB) of NIMs and MH SNPs while controlling for MAF. NIMs and MH SNPs are divided by the 20, 40, 60, 80, 100 (c) LD score (UKBB) percentile or MAF percentile (d) based on all QC-ed SNPs (7,774,235 imputed SNPs with MAF >0.001). The lower and upper edges of a box represent the first and third quartile (qu1 and qu3), respectively; the horizontal red line inside the box indicates median (md); the whiskers extend to the most extreme values inside inner fences, md ± 1.5 (qu3–qu1).
Figure 3 with 1 supplement
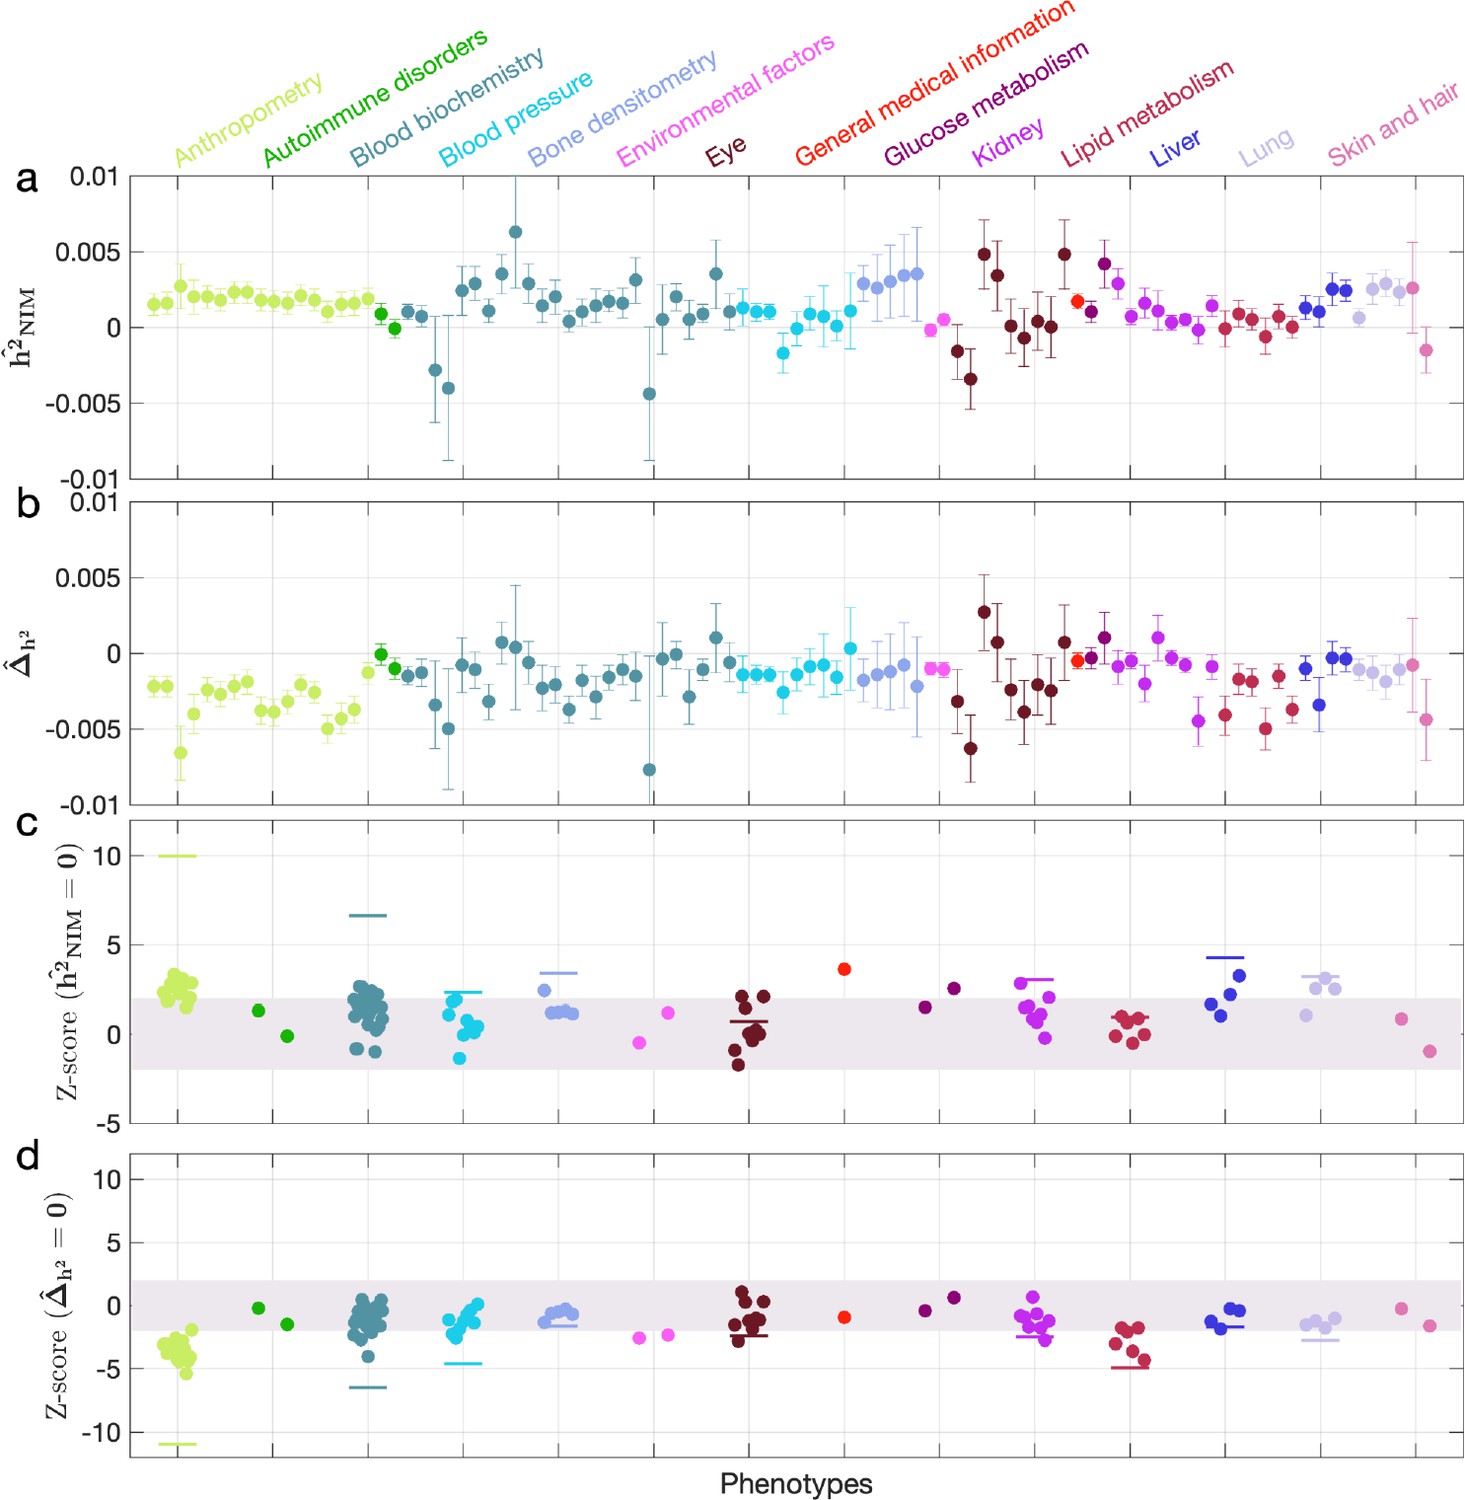
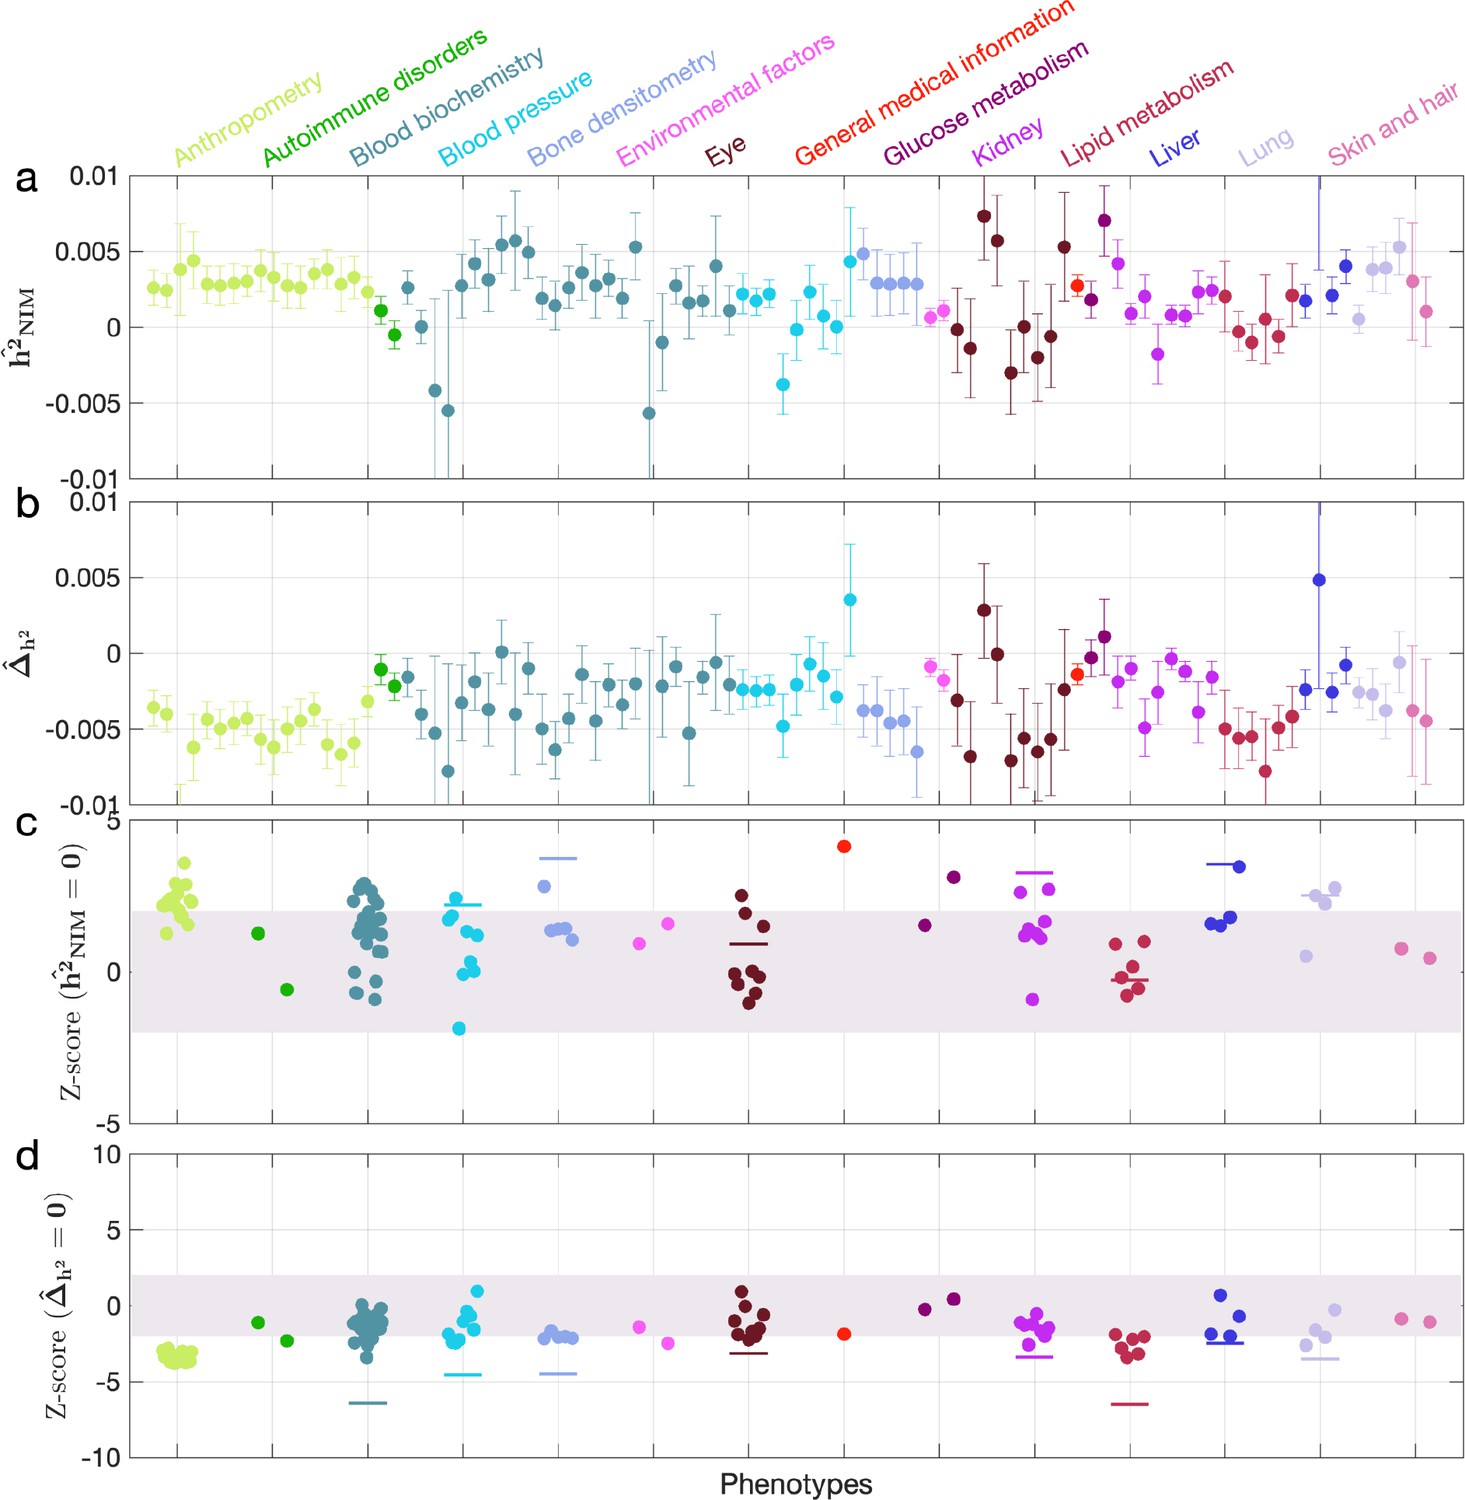
Neanderthal Informative Mutation (NIM) heritability in UK Biobank (UKBB) phenotypes.
(a) Estimates of NIM heritability () and (c) the Z-score of (testing the hypothesis that NIM heritability is positive) for each UKBB phenotype. Analogously, (b) estimates of and Z-score (d) of (testing the hypothesis that per-NIM heritability is equal to per-SNP heritability at modern human [MH] SNPs after controlling for MAF and LD). Phenotypic categories are shown in alphabetical order and listed on the top of panel (a) in the same color and alphabetical order (from top to bottom, and left to right) as they are in the figure. The estimate for each phenotype is shown as one colored dot, on the x-axis based on its phenotypic category, and on the y-axes based on its Z-score () and Z-score (), for panels (c) and (d) respectively. For each phenotypic category with at least four phenotypes, their Z-scores from random effect meta-analysis are plotted with the flat colored lines (see ‘Methods’). The color shades cover Z-scores around zero and within ±2. g.
-
Figure 3—source data 1
UKBB phenotype annotation.
- https://cdn.elifesciences.org/articles/80757/elife-80757-fig3-data1-v2.zip
-
Figure 3—source data 2
RHE-mc results with Ancestry+MAF+LD annotations and NIM PCs included in covariates applied to 96 UKBB phenotypes.
- https://cdn.elifesciences.org/articles/80757/elife-80757-fig3-data2-v2.zip
Figure 3—figure supplement 1
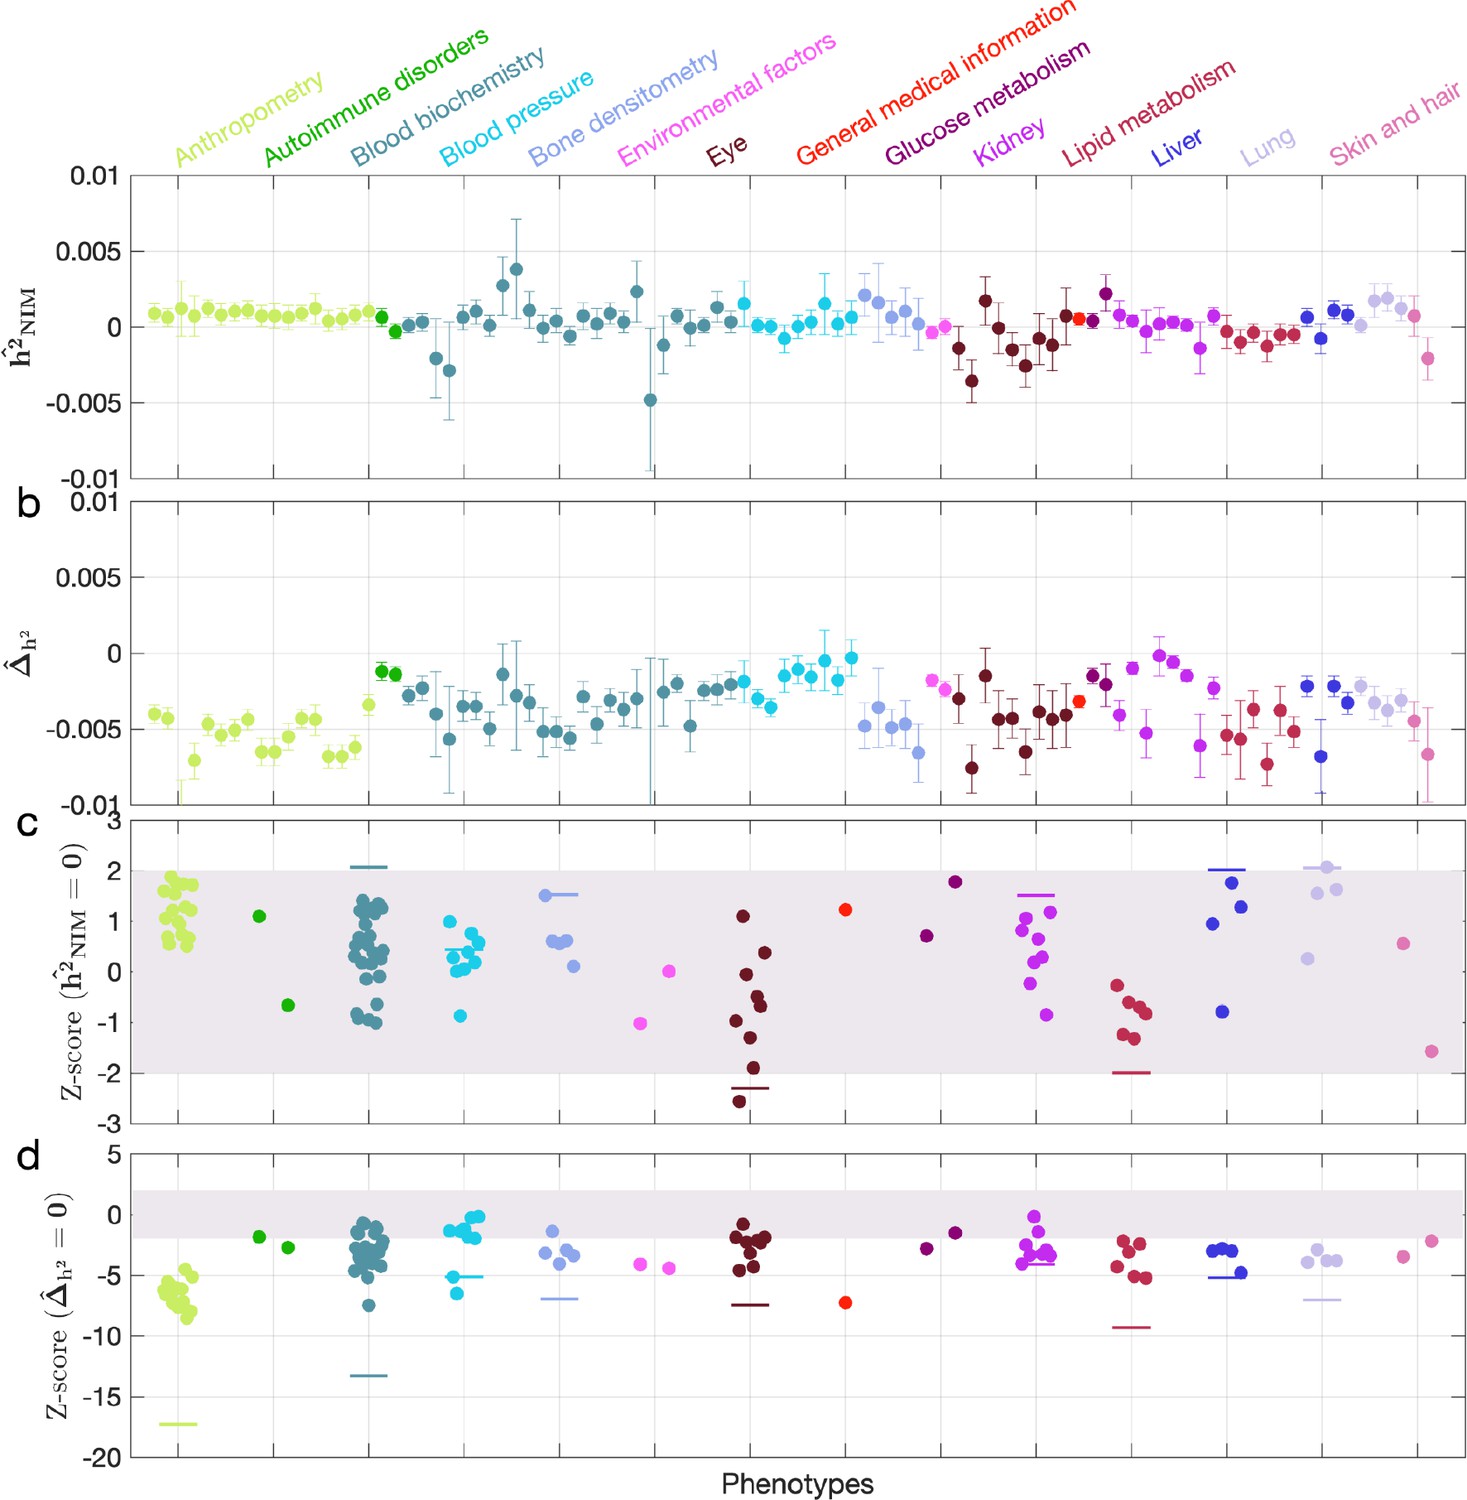
Neanderthal Informative Mutation (NIM) heritability in UK Biobank (UKBB) phenotypes after accounting for background selection.
(a) Estimates of NIM heritability () and (c) the Z-score of (testing the hypothesis that NIM heritability is positive) for each UKBB phenotype. Analogously, (b) estimates of and Z-score (d) of (testing the hypothesis that per-NIM heritability is equal to per-SNP heritability at modern human [MH] SNPs after controlling for MAF and B-value, a measure of background selection). Phenotypic categories are shown in alphabetical order and listed on the top of panel (a) in the same color and alphabetical order (from top to bottom, and left to right) as they are in the figure.
Figure 4 with 1 supplement
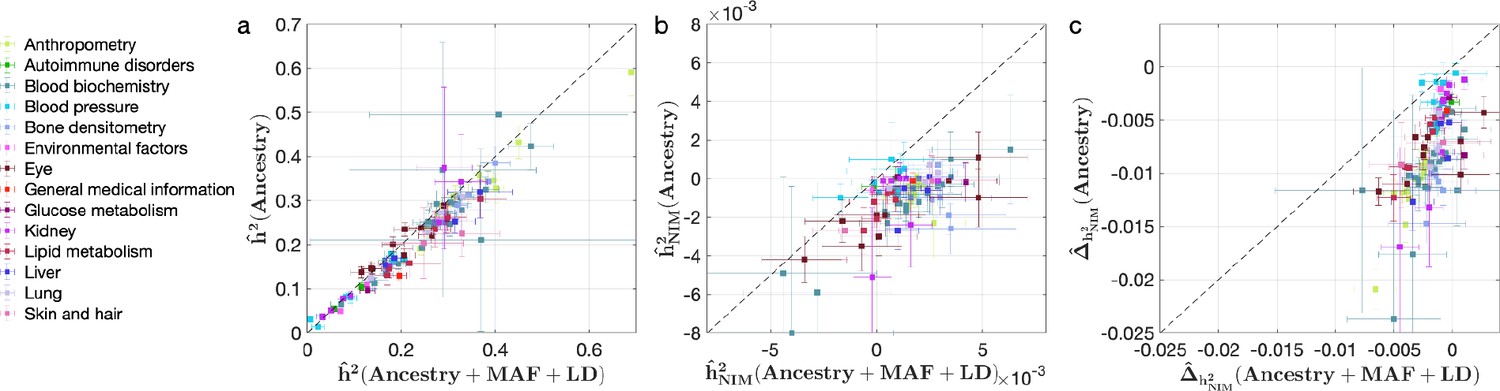
Comparing heritability analyses with and without controlling for minor allele frequency (MAF) and LD in UK Biobank (UKBB) phenotypes.
Each phenotype is shown with one dot colored by the phenotypic category it belongs to, on the y-axis based on its point estimate and standard error (estimated by RHE-mc with Ancestry annotation) and on the x-axis based on its point estimate and standard error (estimated by RHE-mc with ancestry + MAF + LD annotation). Estimates shown are (a) total heritability , (b) Neanderthal Informative Mutation (NIM) heritability , and (c) the difference between per-NIM heritability and matched modern human (MH) SNPs heritability . Not controlling for MAF and LD leads to underestimation of NIM heritability, which leads to false positives when testing whether heritability at an NIM is elevated or depleted relative to an MH SNP.
-
Figure 4—source data 1
RHE-mc results with Ancestry only annotation and NIM PCs included in covariates applied to 96 UKBB phenotypes.
- https://cdn.elifesciences.org/articles/80757/elife-80757-fig4-data1-v2.zip
Figure 4—figure supplement 1
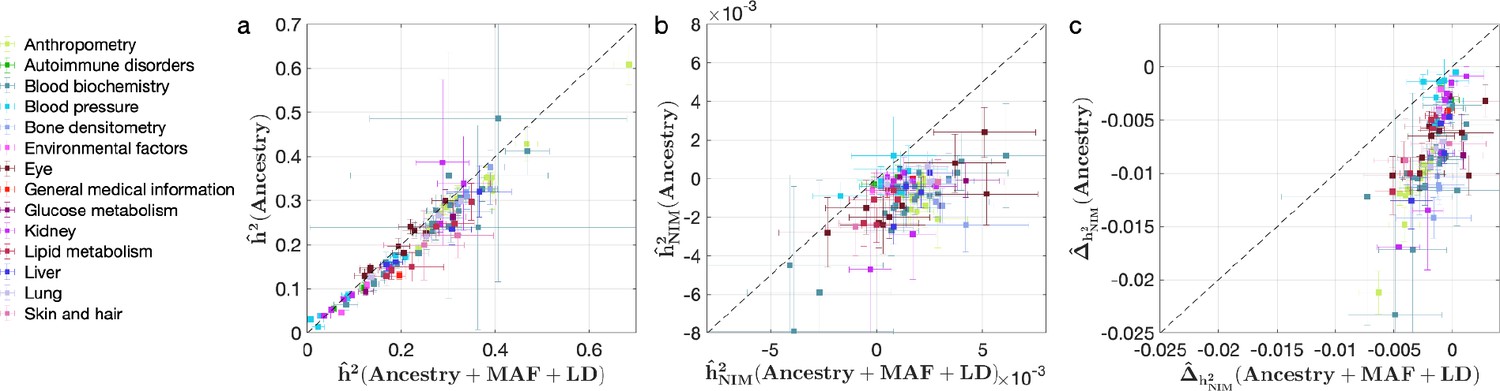
Comparing heritability estimates from RHE-mc without controlling for Neanderthal Informative Mutation (NIM) principal components (PCs) with Ancestry + MAF + LD annotation and RHE-mc with Ancestry annotation in UK Biobank (UKBB) phenotypes.
This figure is plotted in the same way as Figure 4. The trend that not controlling for minor allele frequency (MAF) and LD leads to underestimation of (a) total heritability , (b) NIM heritability , and stronger NIM heritability depletion (c) is also apparent when NIM PCs are not controlled for.
Figure 5
Fine mapping of Neanderthal Informative Mutations (NIMs) in simulations and the UK Biobank (UKBB).
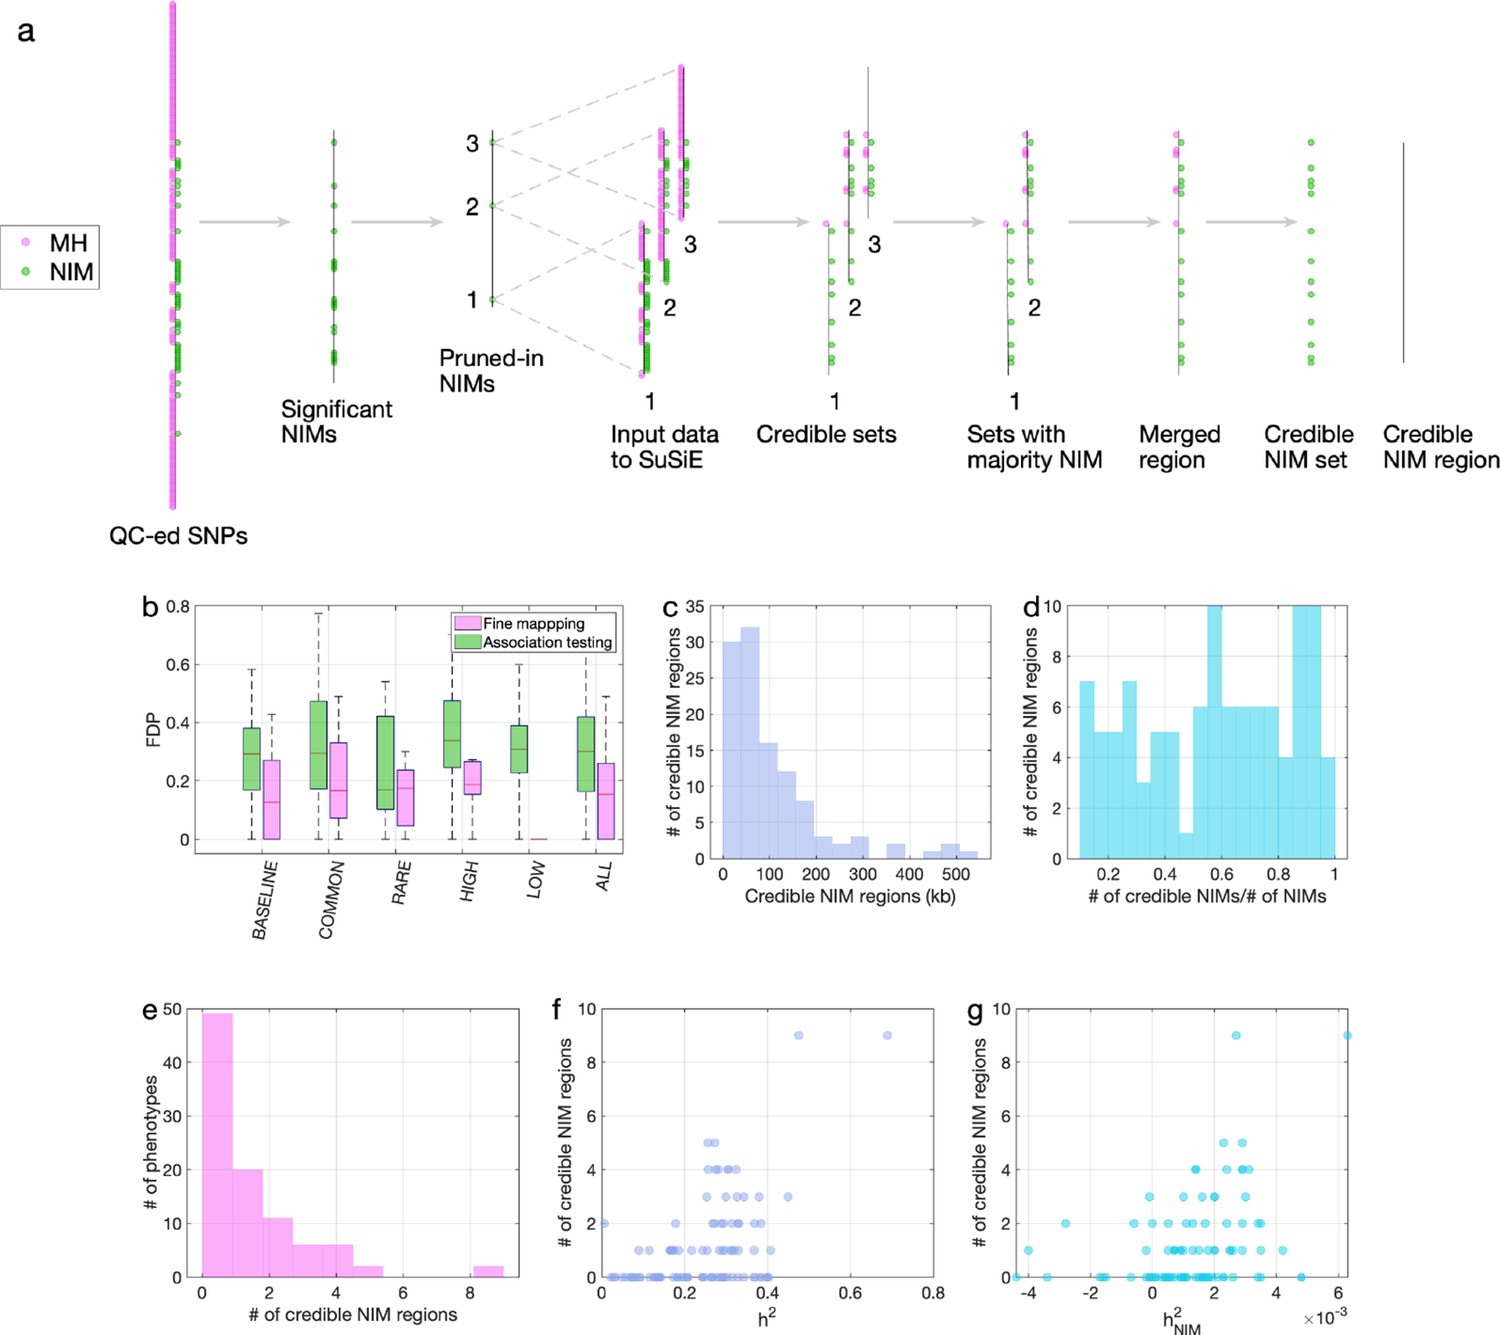
(a) Fine mapping pipeline to identify NIMs that aims to identify genomic regions at which NIMs are likely to modulate phenotypic variation (credible NIM regions). (b) Comparison of approaches for identifying credible NIM regions. For each simulation, false discovery proportion (FDP) is computed for association testing compared to our pipeline (combining association testing and fine-mapping). The distributions of the FDP are shown across genetic architectures (summarized across groupings of coupling of effect size, minor allele frequency [MAF] and LD) and summarized across architectures (ALL). Our approach to identifying credible NIMs decreases FDP in all studied architectures (the LOW LD setting has a median and quartiles of zero across replicates). (c) The distribution of the length of credible NIM regions across 96 UKBB phenotypes. (d) Distribution of the ratio between the number of credible NIMs and number of tested NIMs (in the example of panel (a), the number of tested NIMs is the union of NIMs in input to the fine-mapping software (SuSiE) 1 and 2) showing that our approach is effective in prioritizing NIMs that affect phenotype. (e) The distribution of the number of credible NIM regions among phenotypes. The number of credible NIM regions is positively correlated with (f) heritability (g) NIM heritability.
-
Figure 5—source data 1
Fine mapping FDP in simulated data.
- https://cdn.elifesciences.org/articles/80757/elife-80757-fig5-data1-v2.zip
Figure 6 with 3 supplements
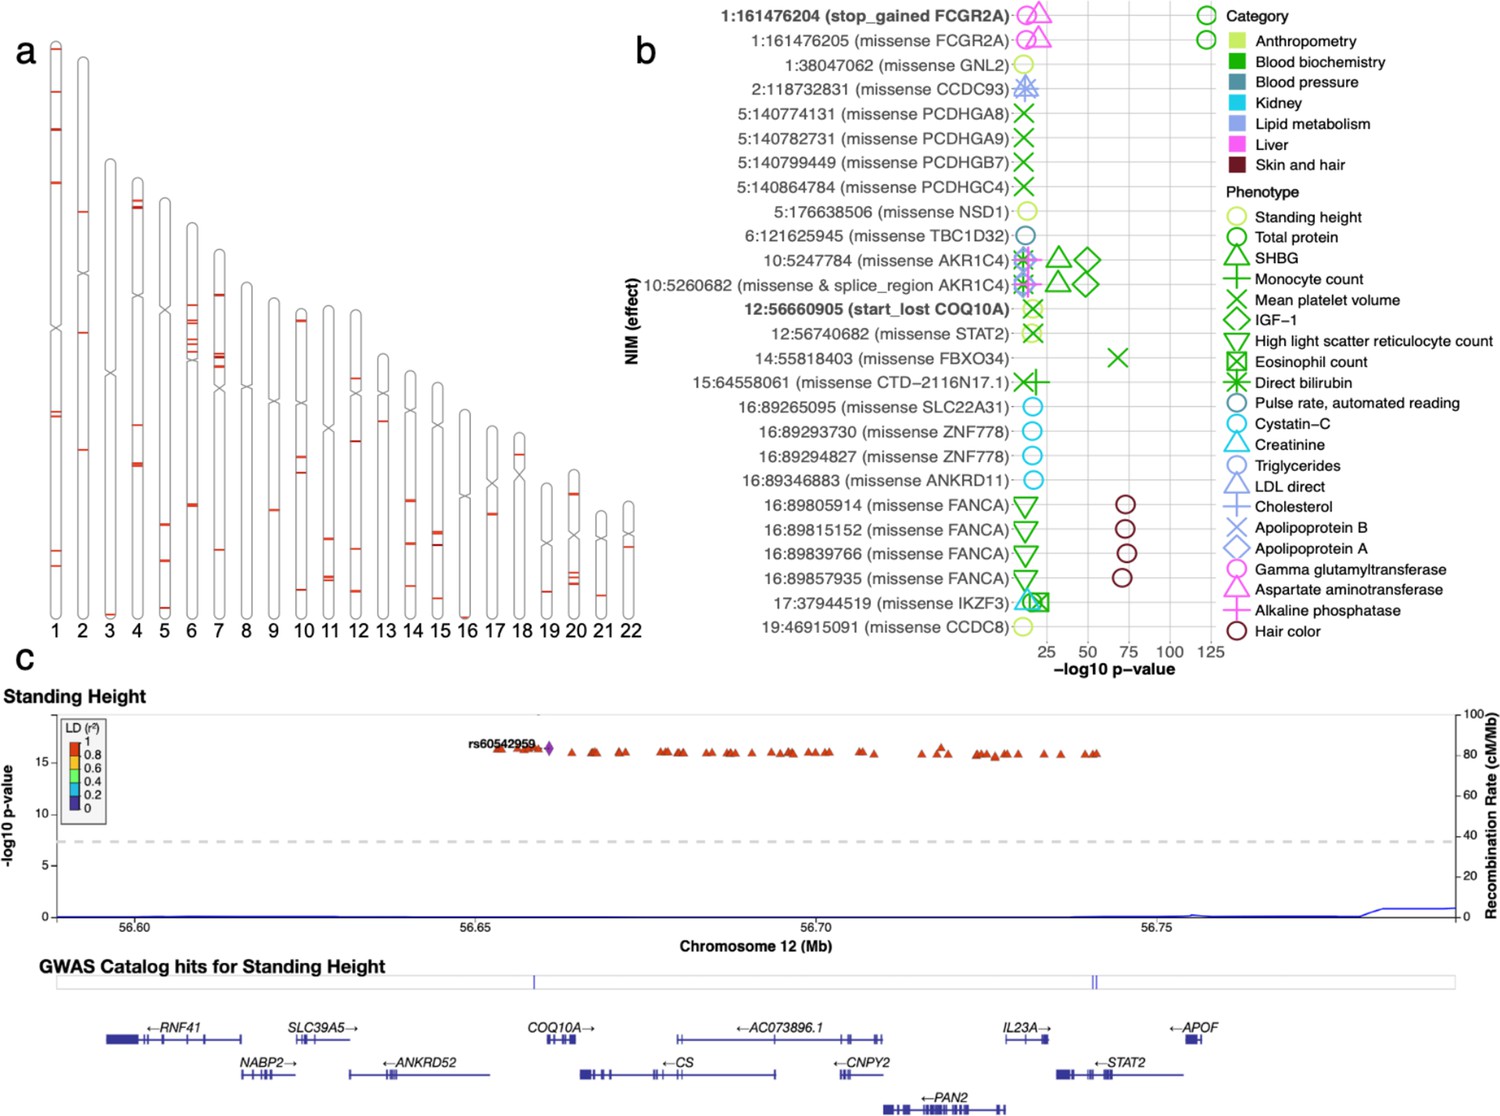
Analysis of credible Neanderthal Informative Mutations (NIMs).
(a) Distribution of credible NIMs across the genome. (b) High and moderate impact credible NIMs annotated by SnpEff software (Cingolani et al., 2012). A total of 26 credible NIMs have high (marked in bold) or moderate impact effects on nearby genes (chromosome number and hg19 coordinates). The effects of the SNP and the gene name are displayed. This plot shows significant associations of these NIMs with specific phenotypes (color denotes the phenotype category). (c) Plot of 300 kb region surrounding rs60542959 (marked in black diamond; hg19 coordinates), a credible NIM for standing height that results in loss of the start codon in COQ10A. The plot displays other significantly associated NIMs in the region along with their LD (r2) to rs60542969 in 1000 Genomes Europeans (Boughton et al., 2021).
-
Figure 6—source data 1
112 credible NIM sets and credible NIMs.
- https://cdn.elifesciences.org/articles/80757/elife-80757-fig6-data1-v2.zip
-
Figure 6—source data 2
SnpEff annotation of all unique credible NIMs.
- https://cdn.elifesciences.org/articles/80757/elife-80757-fig6-data2-v2.zip
Figure 6—figure supplement 1
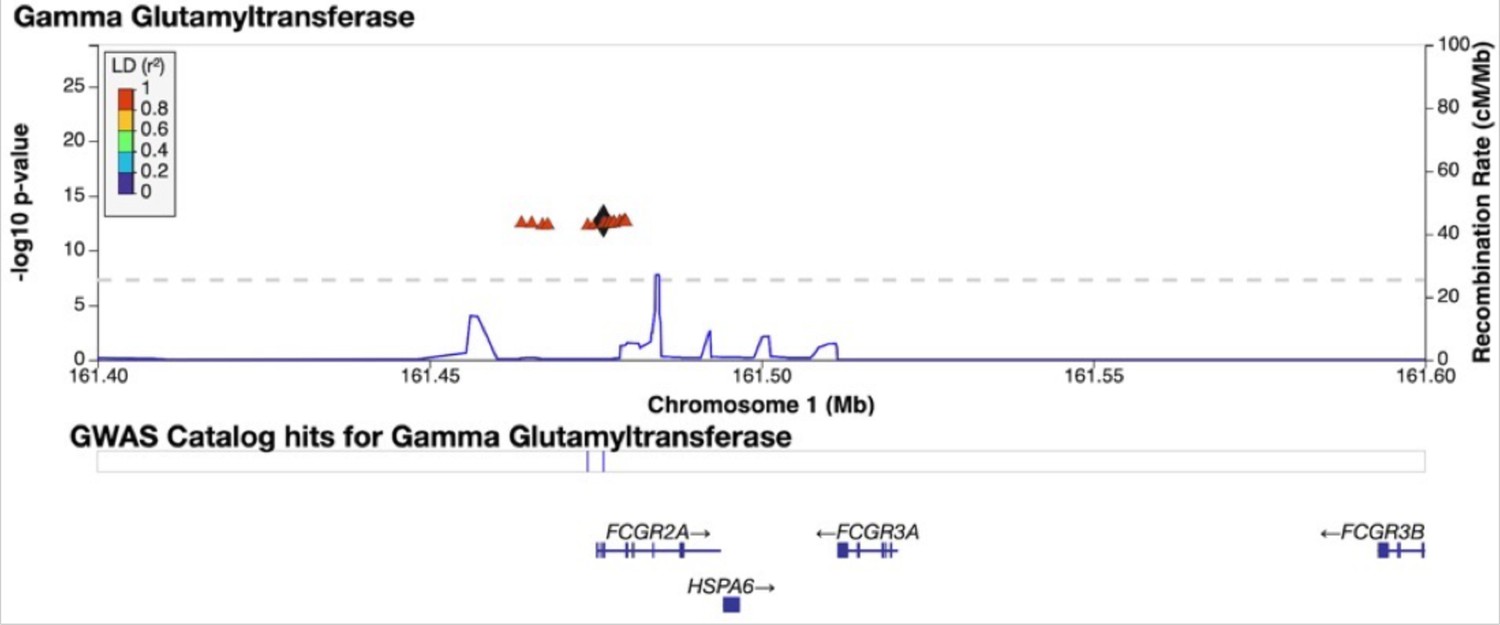
Credible Neanderthal Informative Mutation (NIM) in the FCGR2A gene associated with gamma-glutamyl transferase levels.
Plot of 200 kb region surrounding rs9427397 (marked in black diamond; hg19 coordinates), a credible NIM in FCGR2A that introduces a premature stop codon and is associated with increased levels of gamma glutamyltransferase (while also associated with increased levels of aspartate aminotransferase and decreased total protein). The plot displays other NIMs in the region along with their LD (r2) to rs9427397 computed in 1000 Genomes Europeans.
Figure 6—figure supplement 2
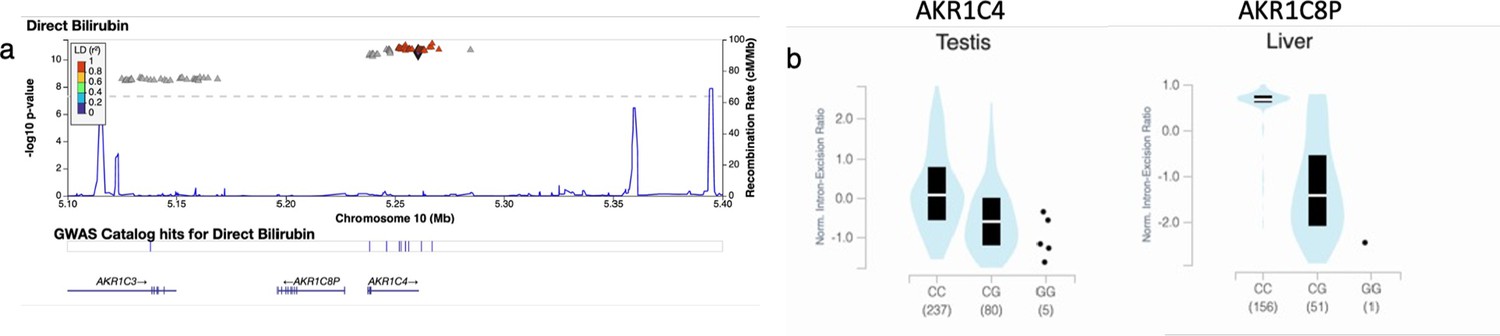
Credible Neanderthal Informative Mutation (NIM) in the AKR1C4 gene is associated with bilirubin levels.
(a) Plot of 300 kb region surrounding rs17134592 (marked in black diamond; hg19 coordinates), a non-synonymous NIM in AKR1C4, that is associated with increased serum bilirubin levels. The plot displays other NIMs in the region along with their LD (r2) to rs17134592. (b) rs17134592 is a splicing QTL in liver (AKR1C8P) and testis (AKR1C4) identified in GTEx v8.
Figure 6—figure supplement 3
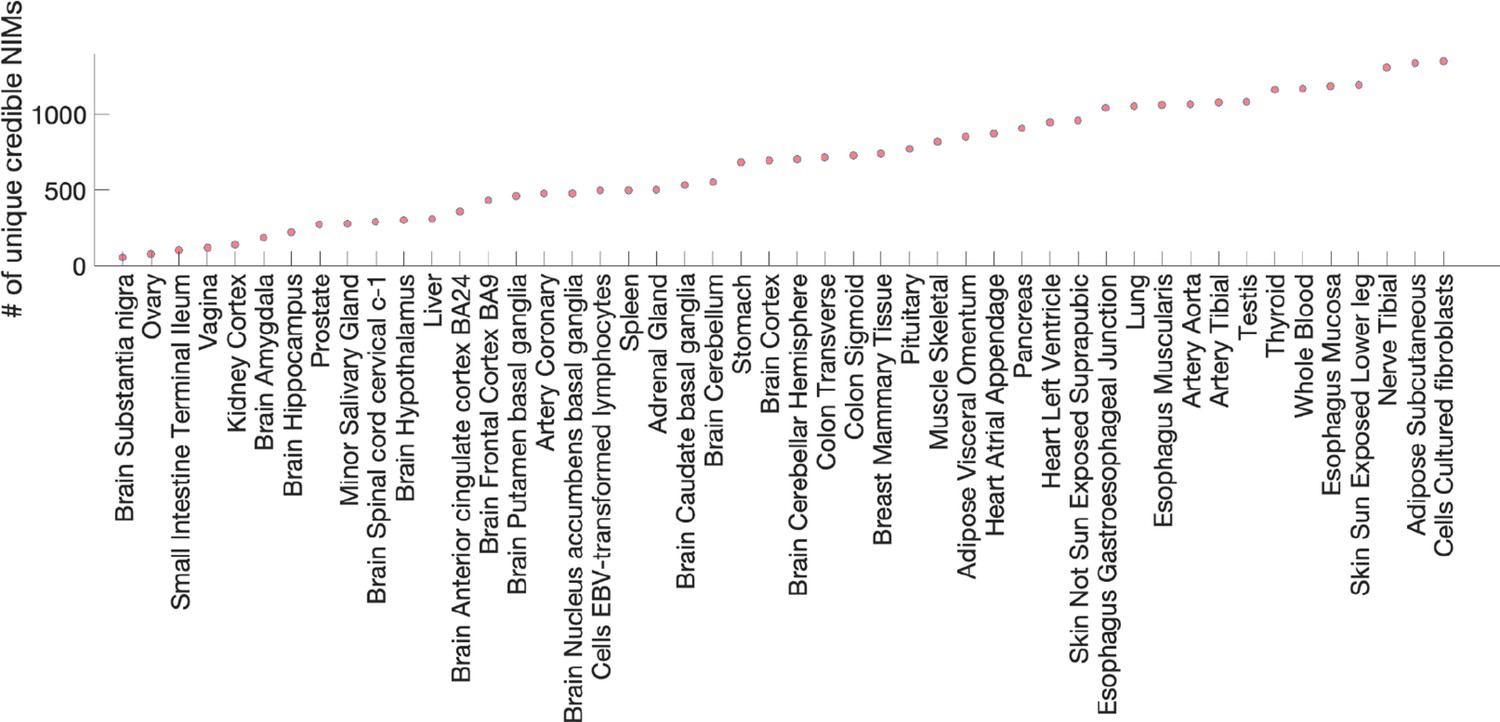
Number of unique credible Neanderthal Informative Mutations (NIMs) that are expression quantitative trait loci (eQTLs).
The x-axis lists the tissues where credible NIMs are found as eQTLs, and the y-axis is the number of eQTLs observed in the tissue that is a credible NIM.
Appendix 2—figure 1
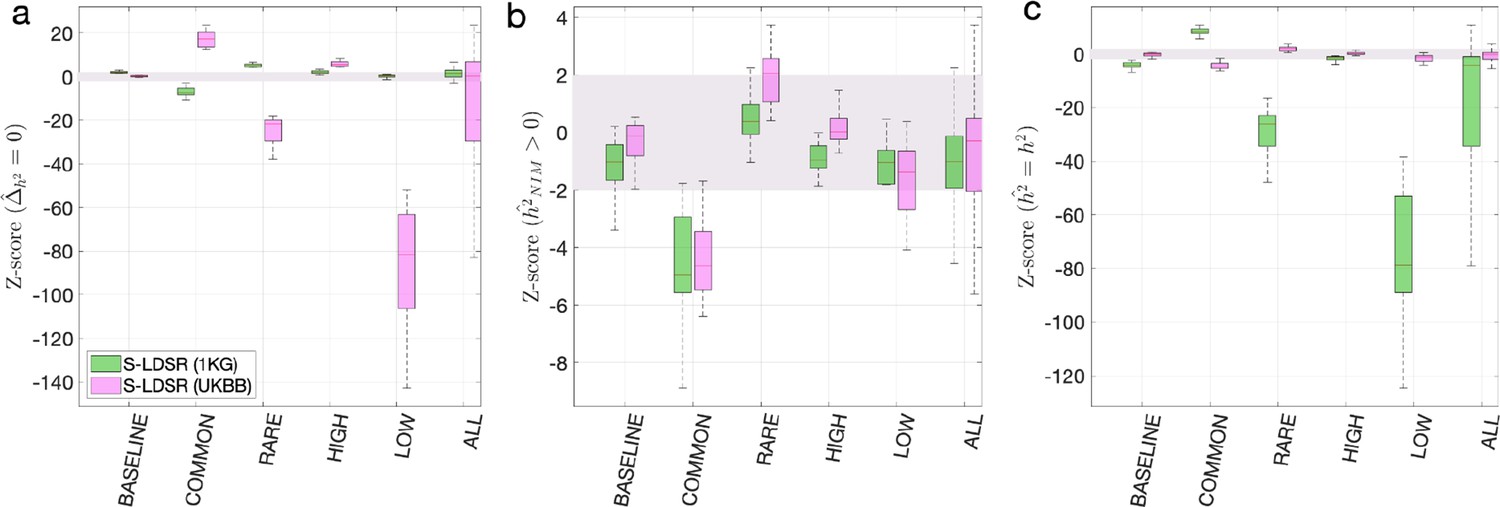
Benchmark stratified LDSC regression (S-LDSR) with in-sample and out-of-sample LD scores.
We group the simulations by the MAF-LD coupling: BASELINE, COMMON, RARE, HIGH, LOW, and ALL, as labeled on the x-axis. We plot the distributions of three Z-scores (y-axis), one on each panel: (a) Z-score () tests whether the estimated Neanderthal Informative Mutation (NIM) heritability is different from the matched modern human (MH) heritability, (b) Z-score ( = ) tests whether the estimated and expected NIM heritability are equal, and (c) Z-score () tests whether the estimated and simulated total heritability are equal. In each panel, S-LDSR with the out-of-sample LD score from 1000 Genomes (1KG) is shown in green and S-LDSR with in-sample LD score from UKBB in pink. In S-LDSR, only ancestry annotation is used. The Z-scores within ±2 are color shaded. S-LDSR (1KG) is not calibrated even for BASELINE architecture.
Appendix 3—figure 1
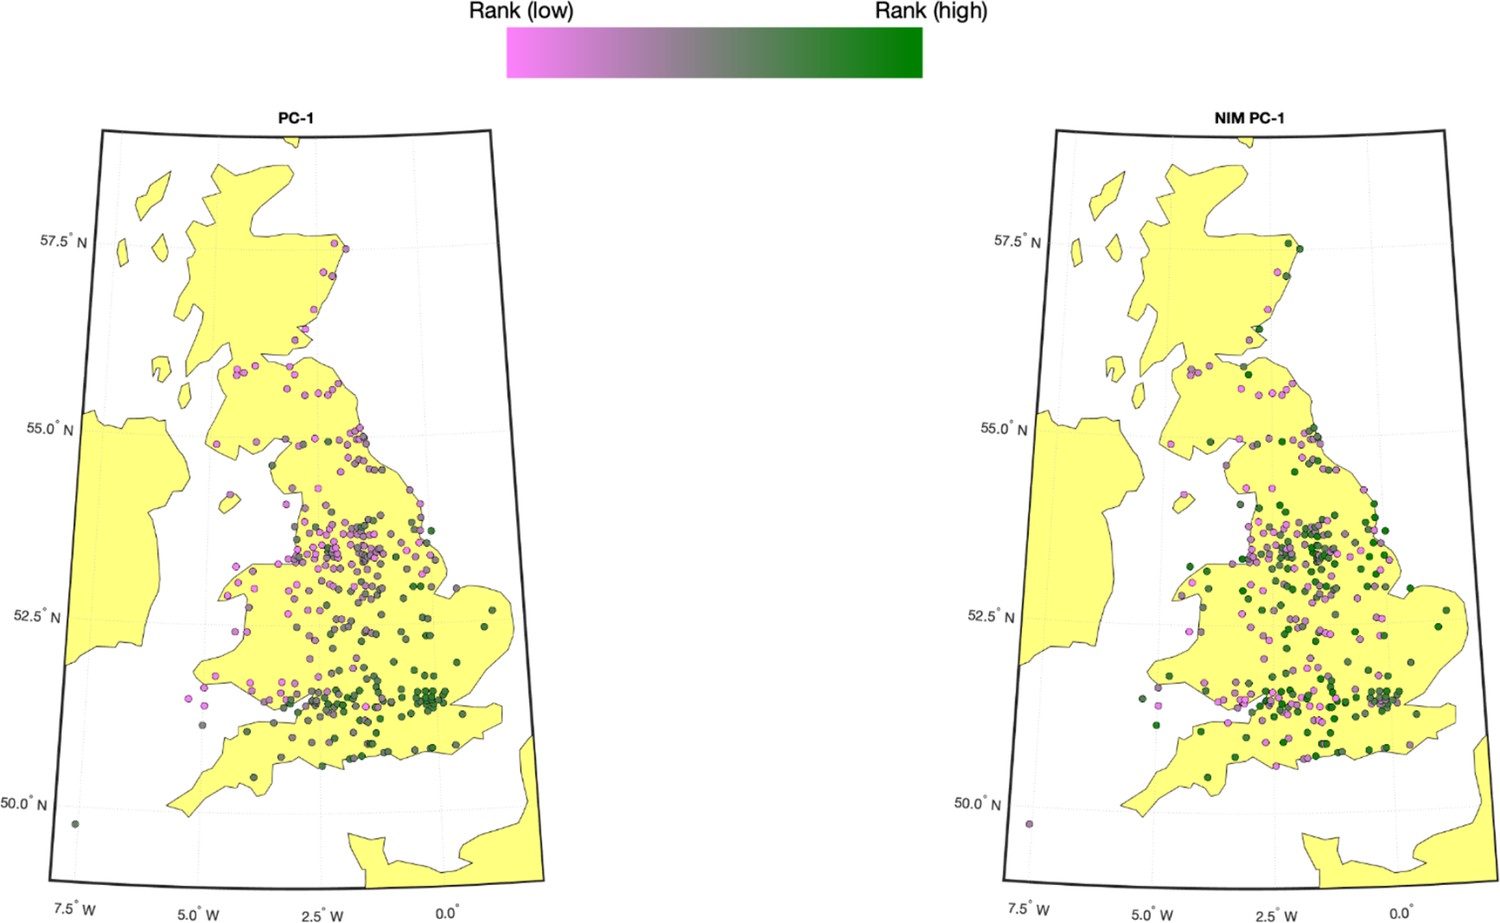
Population structure within white British samples.
PC-1 from the whole genome genotypes (released by UK Biobank [UKBB]) is shown on the left, and Neanderthal Informative Mutation (NIM) PC-1 is shown on the right. We used a 20-by-20 grid along the latitude and longitude, dividing the map into 400 colonies. We then computed the average PC projection as well as the median longitude and latitude among the individuals belonging to each colony, if there are at least 10 individuals in a colony. Each color-filled circle with a 5 km radius represents one colony on the map. To maximize the visible differences, we sorted the colonies by their PC values and used the rank to determine the color of the colony. Compared to NIM PC-1, PC-1 shows a much stronger correlation with geographical location.
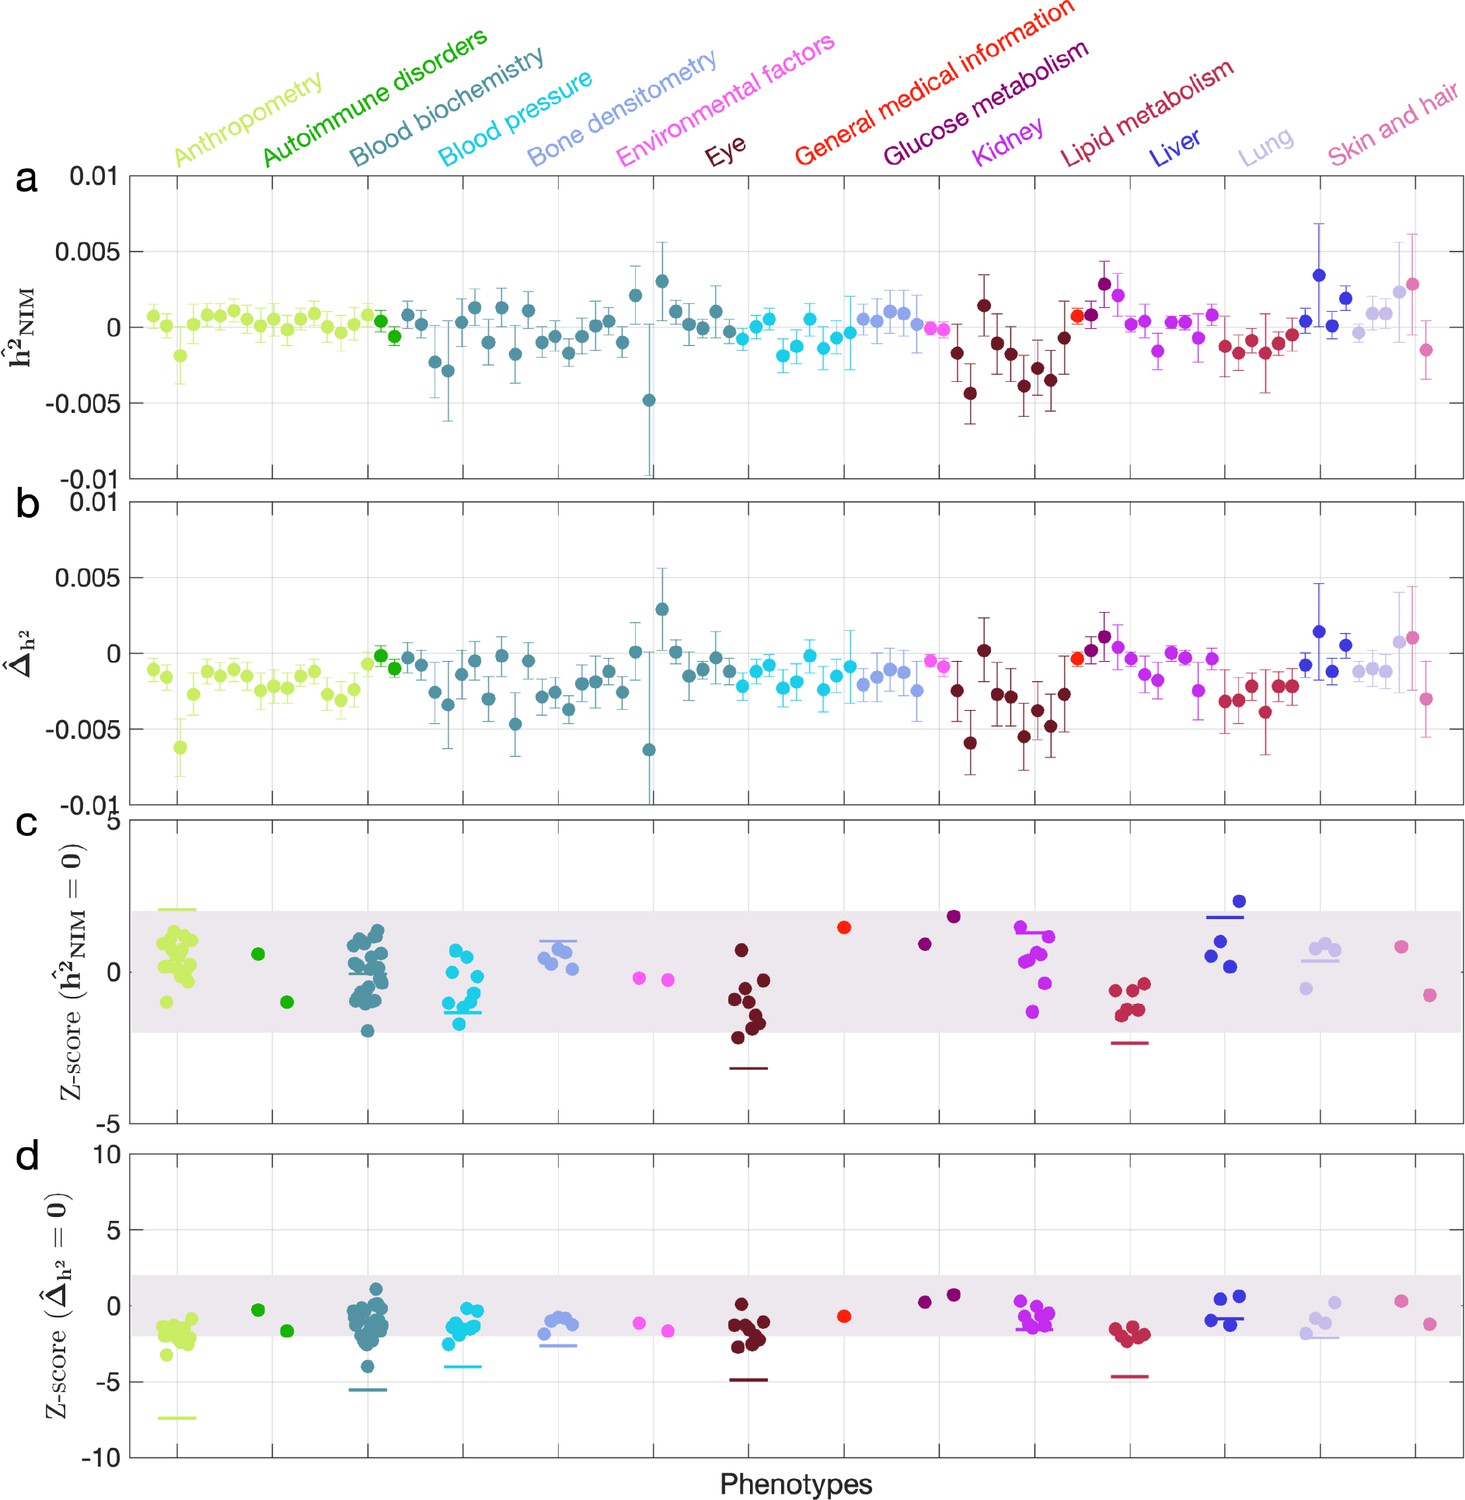
Appendix 3—figure 2

Neanderthal Informative Mutation (NIM) heritability in the 96 UK Biobank (UKBB) phenotypes without controlling for NIM principal components (PCs).
This figure is plotted in the same way as Figure 3. Heritability estimates are largely similar, but fewer phenotypes are significant. Three phenotypes have significant positive NIM heritability (Z-score ()>3): overall health rating, waist-hip-ratio, and gamma glutamyltransferase. Fourteen phenotypes (standing height, sitting height, weight, body fat percentage, whole-body fat-free mass, whole-body water mass, trunk fat-free mass, trunk predicted mass, basal metabolic rate, RBC count, apolipoprotein A, HDL cholesterol, triglycerides) are significantly depleted for NIM heritability (Z-score < –3).
Appendix 5—figure 1
Distributions of minor allele frequency (MAF) and LD-score in Neanderthal Informative Mutations (NIMs) identified by Sprime in all 1KG populations and modern human (MH) SNPs.
Empirical cumulative distribution functions of (a) MAF and (b) LD scores of NIMs identified by Sprime (in solid green line) and MH SNPs (in pink dashed line) estimated in the UK Biobank (UKBB). (c) Boxplots of MAFs of NIMs (on the left filled in green) and MH SNPs (on the right side filled in pink) while controlling for LD score (UKBB). (d) Boxplots of LD score (UKBB) of NIMs and MH SNPs while controlling for MAF. NIMs and MH SNPs are divided by the 20, 40, 60, 80, 100 (c) LD score (UKBB) percentile or MAF percentile (d) based on all QC-ed SNPs (7,774,235 imputed SNPs with MAF > 0.001). The lower and upper edges of a box represent the first and third quartile (qu1 and qu3), respectively; the horizontal red line inside the box indicates median (md); the whiskers extend to the most extreme values inside inner fences, md ± 1.5 (qu3–qu1).
Appendix 5—figure 2
Distributions of minor allele frequency (MAF) and LD-score in Neanderthal Informative Mutations (NIMs) identified by Sprime in 1KG European populations and modern human (MH) SNPs.
Empirical cumulative distribution functions of (a) MAF and (b) LD scores of NIMs identified by Sprime (in solid green line) and MH SNPs (in pink dashed line) estimated in the UK Biobank (UKBB). (c) Boxplots of MAFs of NIMs (on the left filled in green) and MH SNPs (on the right side filled in pink) while controlling for LD score (UKBB). (d) Boxplots of LD score (UKBB) of NIMs and MH SNPs while controlling for MAF. NIMs and MH SNPs are divided by the 20, 40, 60, 80, 100 (c) LD score (UKBB) percentile or MAF percentile (d) based on all QC-ed SNPs (7,774,235 imputed SNPs with MAF > 0.001). The lower and upper edges of a box represent the first and third quartile (qu1 and qu3), respectively; the horizontal red line inside the box indicates median (md); the whiskers extend to the most extreme values inside inner fences, md ± 1.5 (qu3–qu1).
Appendix 5—figure 3
Neanderthal Informative Mutation (NIM) heritability in the 96 UK Biobank (UKBB) phenotypes for the least stringent set of NIMs identified using Sprime by McArthur et al., 2021.
(a) Estimates of NIM heritability () and (c) the Z-score of (testing the hypothesis that NIM heritability is positive) for each UKBB phenotype. Analogously, (b) estimates of and Z-score (d) of (testing the hypothesis that per-NIM heritability is equal to per-SNP heritability at modern human [MH] SNPs after controlling for MAF and LD).
Appendix 5—figure 4
Neanderthal Informative Mutation (NIM) heritability in the 96 UK Biobank (UKBB) phenotypes for the most stringent set of NIMs identified using Sprime by McArthur et al., 2021 NIMs.
(a) Estimates of NIM heritability () and (c) the Z-score of (testing the hypothesis that NIM heritability is positive) for each UKBB phenotype. Analogously, (b) estimates of and Z-score (d) of (testing the hypothesis that per-NIM heritability is equal to per-SNP heritability at modern human [MH] SNPs after controlling for MAF and LD).
Additional files
Download links
A two-part list of links to download the article, or parts of the article, in various formats.
Downloads (link to download the article as PDF)
Open citations (links to open the citations from this article in various online reference manager services)
Cite this article (links to download the citations from this article in formats compatible with various reference manager tools)
The lingering effects of Neanderthal introgression on human complex traits
eLife 12:e80757.
https://doi.org/10.7554/eLife.80757


