Prolonged nicotine exposure reduces aversion to the drug in mice by altering nicotinic transmission in the interpeduncular nucleus
- Sorbonne Université, Inserm, CNRS, Neuroscience Paris Seine - Institut de Biologie Paris Seine (NPS - IBPS), France
- Brain Plasticity Unit, CNRS, ESPCI Paris, PSL Research University, France
- Institut Pasteur, Unité Neurobiologie intégrative des systèmes cholinergiques, Département de neuroscience, France
Figures
Figure 1 with 1 supplement
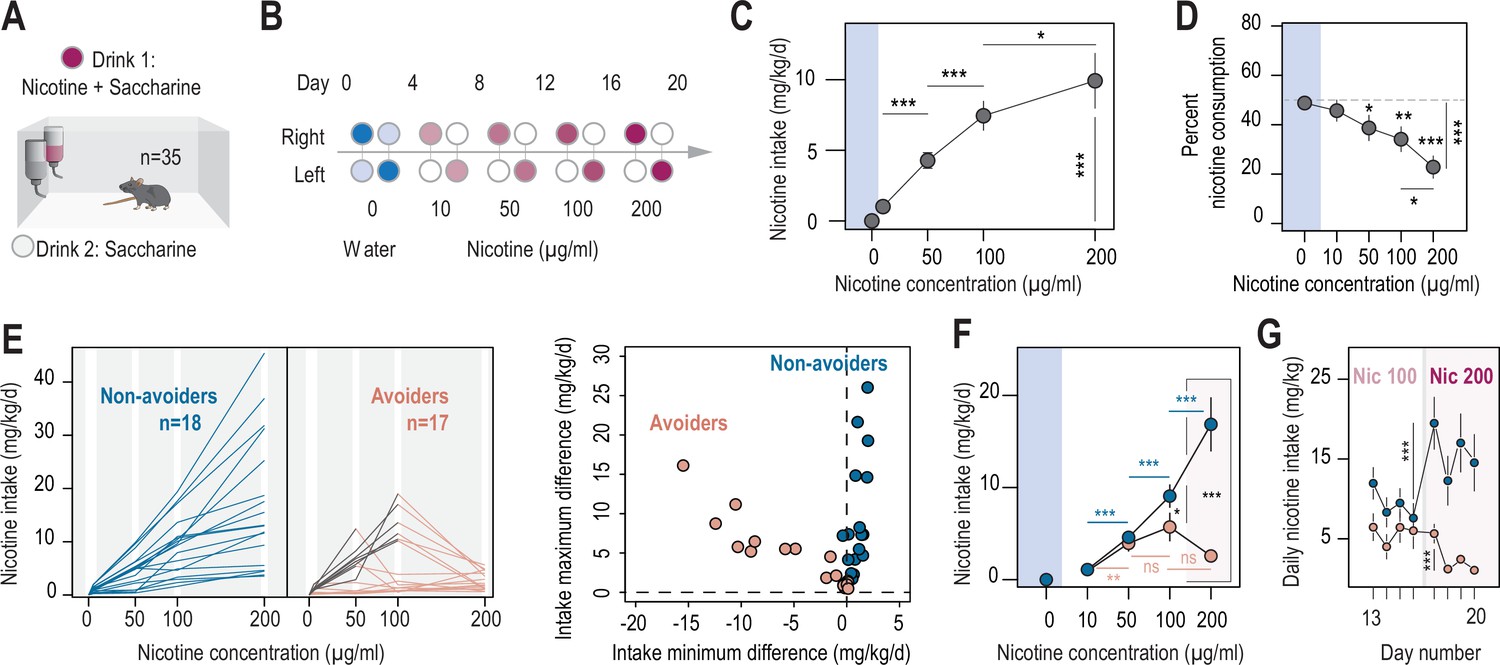
Two different profiles, avoiders and non-avoiders, emerged in WT mice subjected to a two-bottle choice nicotine-drinking test.
(A) Continuous access, two-bottle choice setup. (B) Two-bottle choice paradigm. Each dot represents a bottle and is color-coded according to whether it contains water (blue or light blue), nicotine plus 2% saccharine (red, gradient of color intensities according to the nicotine concentration), or 2% saccharine (white) solutions. The nicotine concentration in the bottle increased progressively from 10 to 50, 100 and 200 µg/ml. Each condition lasted 4 days, and the bottles were swapped every other day. (C) Nicotine intake (mg/kg/day), averaged over 4 days, at different nicotine concentrations (Friedman test, n=35, df = 3, p<0.001 and Mann-Whitney post-hoc test with Holm-Bonferroni correction). (D) Percent nicotine consumption in WT mice for each concentration of nicotine, averaged over 4 days (Friedman test, n=35, df = 4, p<0.001 and Mann-Whitney post-hoc test with Holm-Bonferroni correction). (E) Left, nicotine intake in individual avoiders (n=17) and non-avoiders (n=18). Right, minimum and maximum values of the difference in nicotine intake between 2 consecutive days, for each individual. (F) Nicotine intake in avoiders and non-avoiders for each nicotine concentration, averaged over 4 days (Mann-Whitney comparison with a Holm-Bonferroni correction). (G) Daily nicotine intake in avoiders and non-avoiders for nicotine 100 and 200 µg/ml (paired Mann-Whitney). Note the drop in nicotine consumption at day 18 for avoiders. In all figure panels, avoiders are depicted in pinkish-orange while non-avoiders are in blue. *** p<0.001, ** p<0.01, * p<0.05.
-
Figure 1—source data 1
Source data for Figure 1.
- https://cdn.elifesciences.org/articles/80767/elife-80767-fig1-data1-v2.xlsx
Figure 1—figure supplement 1
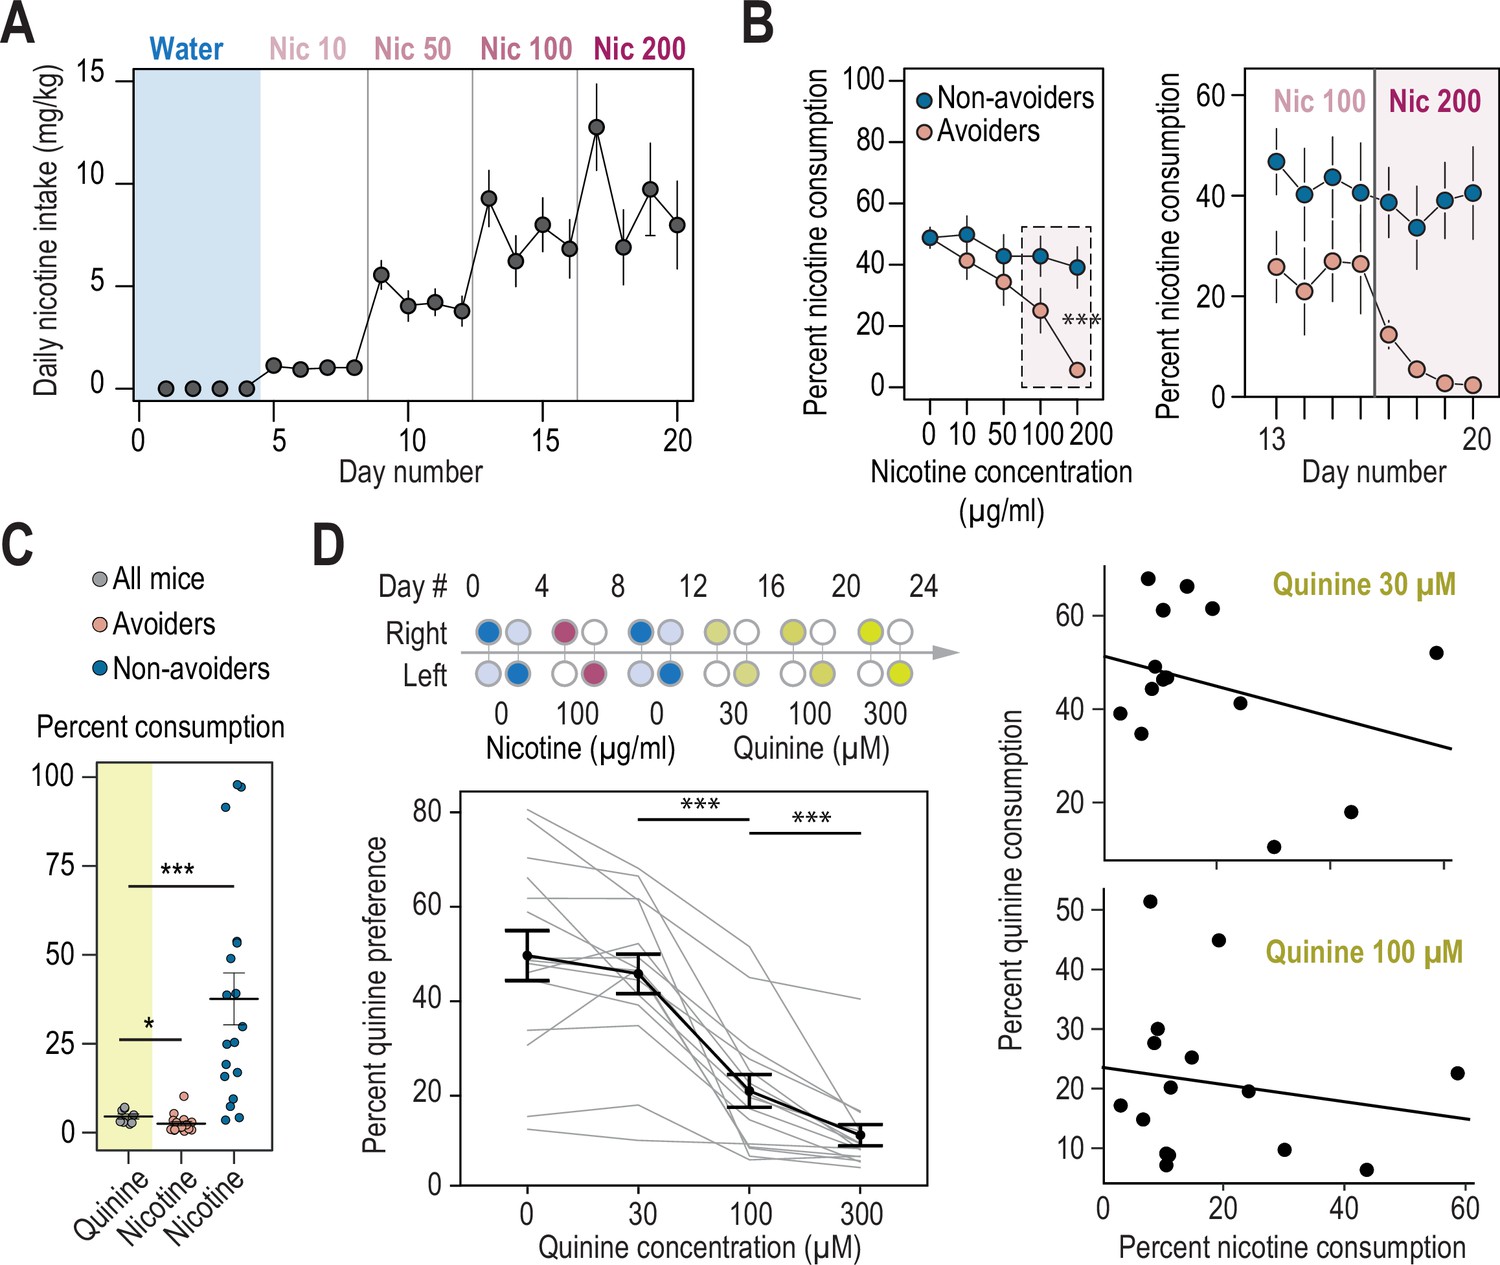
Nicotine intake and consumption profiles in avoiders and non-avoiders.
(A) Nicotine intake measured every day (mg/kg/day) for WT mice in the two-bottle choice task (n=35). (B) Percent nicotine consumption for avoider and non-avoider mice for each concentration of nicotine, averaged over 4 days for the entire session (left) or depicted each day for the last 8 days (right). (C) Percent quinine consumption (600 μM) in WT animals (n=8 mice, 4.3+/-0.6 %), compared to percent nicotine consumption (200 μg/ml) in avoiders (n=17 mice, 2.3+/-0.6 %, Mann-Whitney p=0.033) and non-avoiders (n=18 mice, 41.6+/-8.9 %, Mann-Whitney p=0.0003). (D) Top left, schematics of the two-bottle choice nicotine and quinine drinking test: 4 days of water vs. water habituation; 4 days of nicotine (100 μg/ml) plus 2% saccharine, vs. 2% saccharine; 4 days of water vs. water; 12 days of quinine vs. water (3 concentrations tested, 4 days each). Bottles were swapped every other day. Bottom left, percent quinine preference for the three concentrations tested (Friedman test, n=15, df = 3, p<0.0001 and Mann-Whitney post-hoc test with Holm-Bonferroni correction p(Quin 30-100)=0.0004, p(Quin 100-300)=0.0004). Right, absence of correlation between nicotine and quinine consumption for quinine concentrations of 30 µM (F1,13 = 1.45, R2=0.031, p=0.25) and 100 µM (F1,13 = 0.37, R2=0.047, p=0.55). *** p<0.001, ** p<0.01, * p<0.05.
Figure 2 with 1 supplement
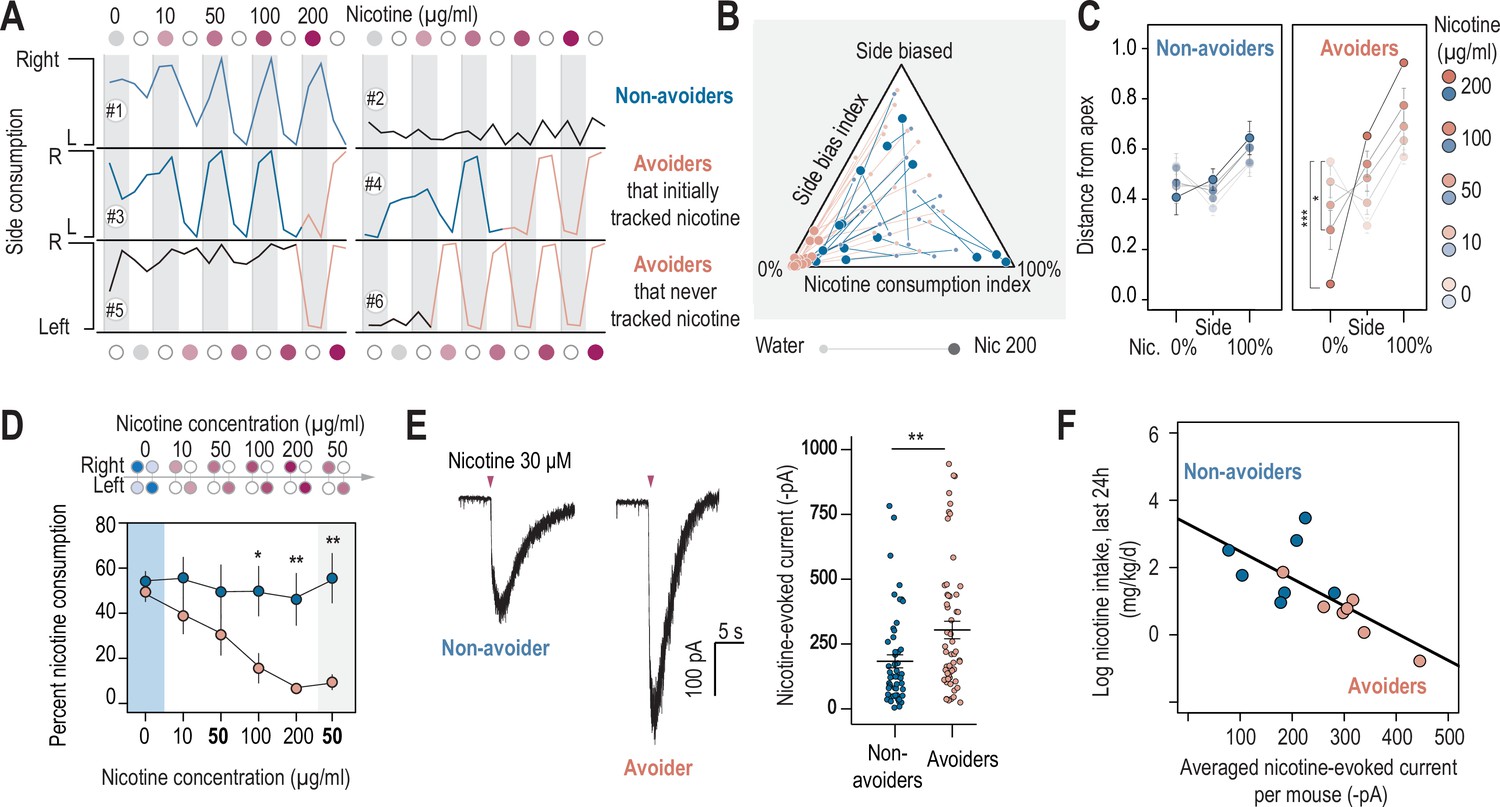
Nicotine intake was negatively correlated with the amplitude of the response to nicotine in IPN neurons.
(A) Representative examples of choice behaviors (% consumption on the right vs. left bottle) in WT mice when the right-hand side bottle contains either nicotine +saccharine (red dots, grey stripe) or saccharine only (white dots, white stripes). Mice are same as in Figure 1. (B) Pseudo-ternary diagram representing, for each individual (18 non-avoiders and 17 avoiders, see Figure 1), its nicotine consumption index over its side bias index. Bottom left apex: 0% nicotine consumption (0%); Bottom right apex: 100% nicotine consumption (100%); Top apex: 100% side preference (Side biased, i.e. mice that never switch side). Small dots correspond to the habituation period (water vs. water) while bigger dots correspond to the condition with 200 µg/ml of nicotine in one bottle. Note how all avoider mice end up in the bottom left apex (0% nicotine consumption) at the end of the task. (C) Average distance from the three apices for each condition in the task (0, 10, 50, 100, and 200 µg/ml of nicotine, color-coded from light to dark), for avoiders and non-avoiders. Only avoider mice significantly changed their drinking strategy as nicotine concentration increased (paired Mann-Whitney test with Holm-Bonferroni correction). (D) Average percent nicotine consumption for avoider (n=8 mice) and non-avoider mice (n=8) for each concentration of nicotine. The 50 µg/ml nicotine solution was presented a second time to the mice, at the end of the session, for 4 days. (Mann-Whitney test, Holm-Bonferroni correction, p(50 Nic)=0.04, p(100 Nic)=0.005, p(200 Nic)=0.004). (E) Representative (left) and average (right) currents recorded in voltage-clamp mode (–60 mV) from IPN neurons of non-avoiders (blue, n=52 neurons from 7 mice, I=–183.20 ± 25 pA) and avoiders (red, n=57 neurons from 7 mice, I=–254.64 ± 33 pA) following a puff application of nicotine (30 µM, 200ms). Avoiders presented greater nicotine-evoked currents than non-avoiders (Mann-Whitney test, p=0.0027). (F) Correlation between the dose consumed (log scale, over the last 24 hr prior to the recording) and the averaged nicotine evoked-current (-pA) per mouse (n=14 mice, R2=0.47, F1-12 = 12.45, p=0.004). In all figure panels, avoiders are depicted in pinkish-orange and non-avoiders in blue. *** p<0.001, ** p<0.01, * p<0.05.
-
Figure 2—source data 1
Source data for Figure 2.
- https://cdn.elifesciences.org/articles/80767/elife-80767-fig2-data1-v2.xlsx
Figure 2—figure supplement 1
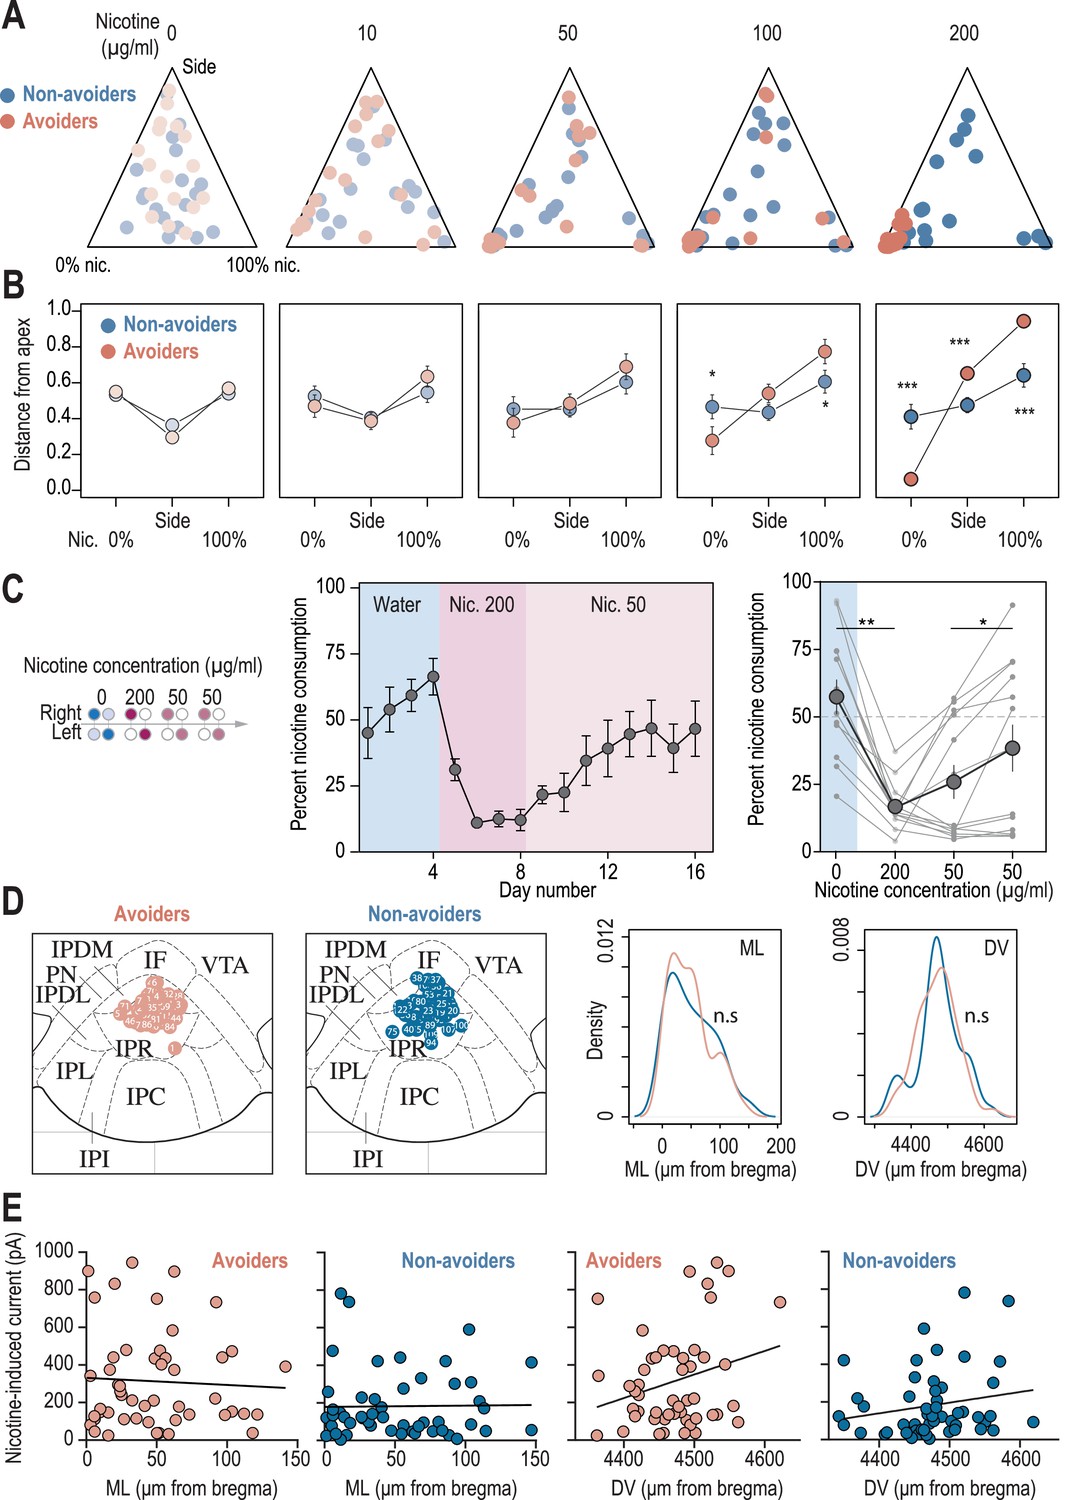
Behavioral and electrophysiological characterization of avoiders and non-avoiders.
(A) Ternary representations for avoiders (red) and non-avoiders (blue), illustrating their nicotine consumption index over their side bias index, as nicotine concentration increases during the task. Note how all avoiders end up, at the end of the task, in the bottom left apex corresponding to 0% nicotine consumption. (B) Distance from each of the three apices for avoiders (red) and non-avoiders (blue) as nicotine concentration increases during the task. Note how the behavior of avoiders is highly nicotine-concentration dependent (Mann-Whitney, Nic 100 µg/ml: p(Sacc)=0.018; p(Nic)=0.011; Nic 200 µg/ml: p(Sacc)<0.001, p(Side)<0.001, p(Nic)<0.001). (C) Percent nicotine consumption in a modified protocol, in which mice are directly proposed a high nicotine concentration (200 µg/ml) followed by 8 days at 50 µg/ml. Middle, average percent nicotine consumption (n=13 mice) for each day. Right, percent nicotine consumption averaged over 4 days (Friedman test, n=13, df = 3, p=0.012 and Mann-Whitney post-hoc test with Holm-Bonferroni correction p(Nic 0-200)=0.001, p(Nic 50-50)=0.012). Individual mice are shown. (D) Left, localization of the neurons recorded in patch-clamp experiments, for avoider (n=57 neurons from 7 mice) and non-avoider mice (n=52 neurons from 7 mice). The images of 7 avoider neurons and 1 non-avoider neuron were missing and thus could not be placed on these maps. Right, the mediolateral (ML) and dorsoventral distributions of the recorded neurons were identical between the two groups (T-test, DV: p=0.73, ML: p=0.78). (E) Left, absence of correlation between the mediolateral (ML) coordinates of the neurons and their response to nicotine, for avoider (F1,48 = 0.14, R2=0.0029, p=0.7094) and non-avoider mice (F1,49 = 0.01, R2=0.0002, p=0.92). Right, absence of correlation between the dorsoventral (DV) coordinates of the neurons and their response to nicotine, for avoider (F1,48 = 3.59, R2=0.069, p=0.064) and non-avoider mice (F1,49 = 1.85, R2=0.036, p=0.18). Correlations are not different between avoiders and non-avoiders for DV (Student’s t-test, p-value = 0.73) and ML coordinates (Man-Whitney, p-value = 0.78). In all panels avoiders are plotted in red and non-avoiders in blue. *** p<0.001, ** p<0.01, * p<0.05.
Figure 3 with 1 supplement
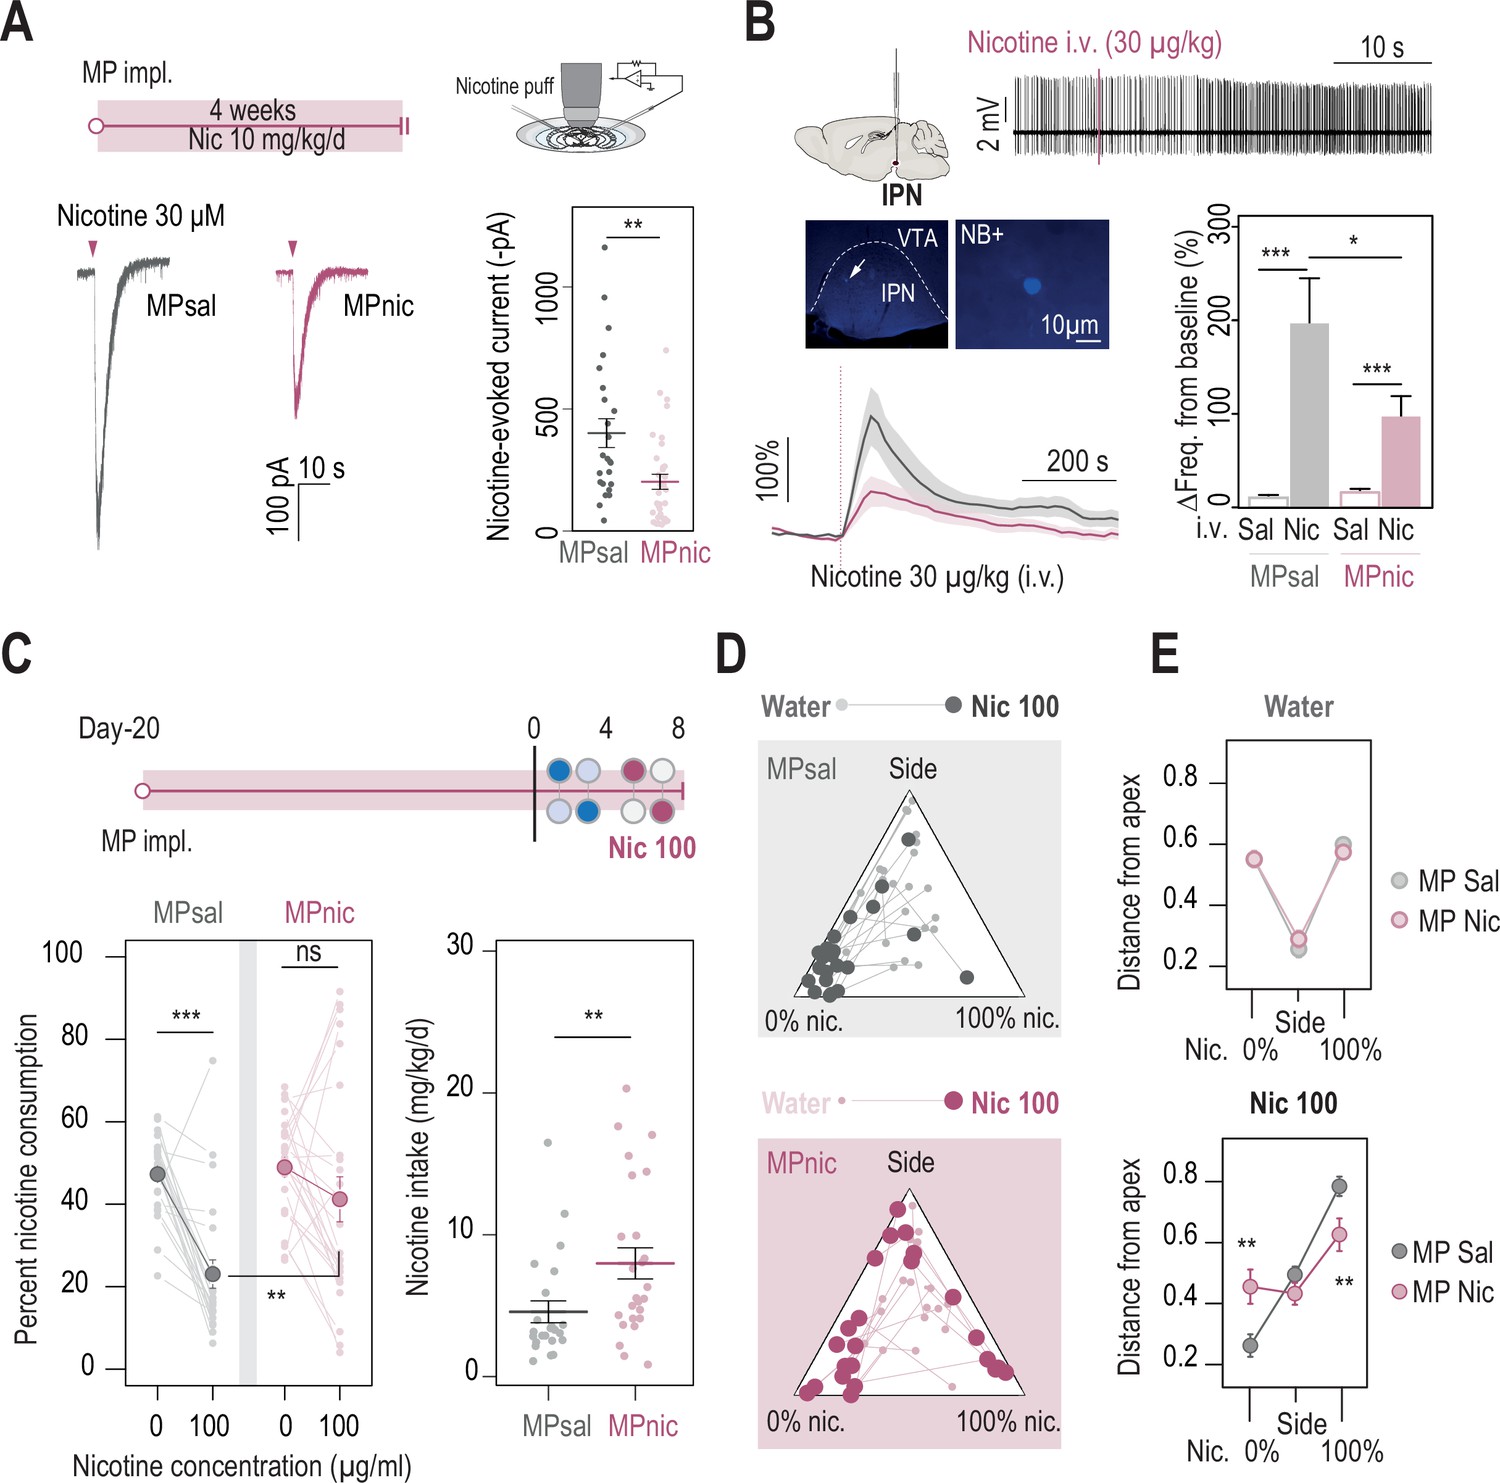
Chronic nicotine treatment altered both nAChR expression levels in the IPN and nicotine intake in WT mice.
(A) Top, passive nicotine treatment protocol. Mice were implanted subcutaneously with an osmotic minipump (MP) that continuously delivers 10 mg/kg/day of nicotine. After 4 weeks of treatment, nicotine-evoked responses in IPN neurons were recorded in whole-cell voltage-clamp mode (–60 mV) from IPN slices. Bottom, representative recordings (left) and average current amplitudes (right) following a puff application of nicotine (30 µM, 200ms) in IPN neurons of mice treated with either saline (n=24 neurons from 3 mice, I = –401±59 pA) or nicotine (n=34 neurons from 4 mice, I = –202±37 pA). Nicotine treatment reduced the amplitude of nicotine-evoked currents in IPN neurons (Mann-Whitney test, p=0.001). (B) In vivo juxtacellular recordings of nicotine-evoked responses in IPN neurons of saline- and nicotine-treated animals. Top, representative electrophysiological recording of an IPN neuron, during an i.v. injection of nicotine (30 µg/kg). Middle, post-recording identification of neurobiotin-labeled IPN neurons by immunofluorescence. Bottom, average time course and average amplitude of the change in firing frequency from baseline after an i.v. injection of saline and nicotine (30 µg/kg), for IPN neurons from saline- and nicotine-treated mice. Right, firing rate variation from baseline induced by nicotine or saline injection in IPN neurons from saline- (n=12 neurons from 6 mice) or nicotine-treated animals (n=20 neurons from 13 mice). Responses were decreased by chronic exposure to nicotine (p=0.035, Mann-Whitney test). All neurons were confirmed to be located within the IPN using juxtacellular labeling with neurobiotin. (C) Top, modified two-bottle choice protocol used to evaluate the impact of a long-term exposure to nicotine on drug intake. Mice were implanted subcutaneously with a minipump that delivered 10 mg/kg/day of nicotine continuously, for 20 days before performing the modified two-bottle choice task. After 4 days of water vs. water habituation, mice were directly exposed to a high concentration of nicotine (100 µg/ml). Bottom, percent nicotine consumption and nicotine intake at 0 and 100 µg/ml of nicotine, for mice under a chronic treatment of nicotine or saline. The saline-treated group displayed a decrease in percent nicotine consumption (n=23, from 47.3±2.0%–23.0 ± 3.4%, p=1.7e-05, Mann-Whitney paired test), but not the nicotine-treated group (n=25, from 48.9±2.4 to 41.2 ± 5.5%, p=0.16, Mann-Whitney paired test). Overall, the saline-treated group displayed a lower percent nicotine consumption (p=0.003, Mann Whitney) and lower nicotine intake than the nicotine-treated group (p=0.004, Mann-Whitney). (D) Pseudo-ternary diagrams representing each saline- and nicotine-treated mouse for its nicotine consumption index over its side bias index. Small dots correspond to the habituation period (water vs. water) and bigger dots to the condition with 100 µg/ml of nicotine in one bottle. (E) Average distance from each apex in the water vs. water (top) and water vs. nicotine 100 µg/ml conditions (bottom). Saline-treated, but not nicotine-treated mice developed a strategy to avoid nicotine (pSacc = 0.013, pSide = 0.27 pNic=0.013, Mann-Whitney test with Holm-Bonferroni correction). In all figure panels, nicotine-treated animals are displayed in red and saline-treated (control) animals in grey.
-
Figure 3—source data 1
Source data for Figure 3.
- https://cdn.elifesciences.org/articles/80767/elife-80767-fig3-data1-v2.xlsx
Figure 3—figure supplement 1
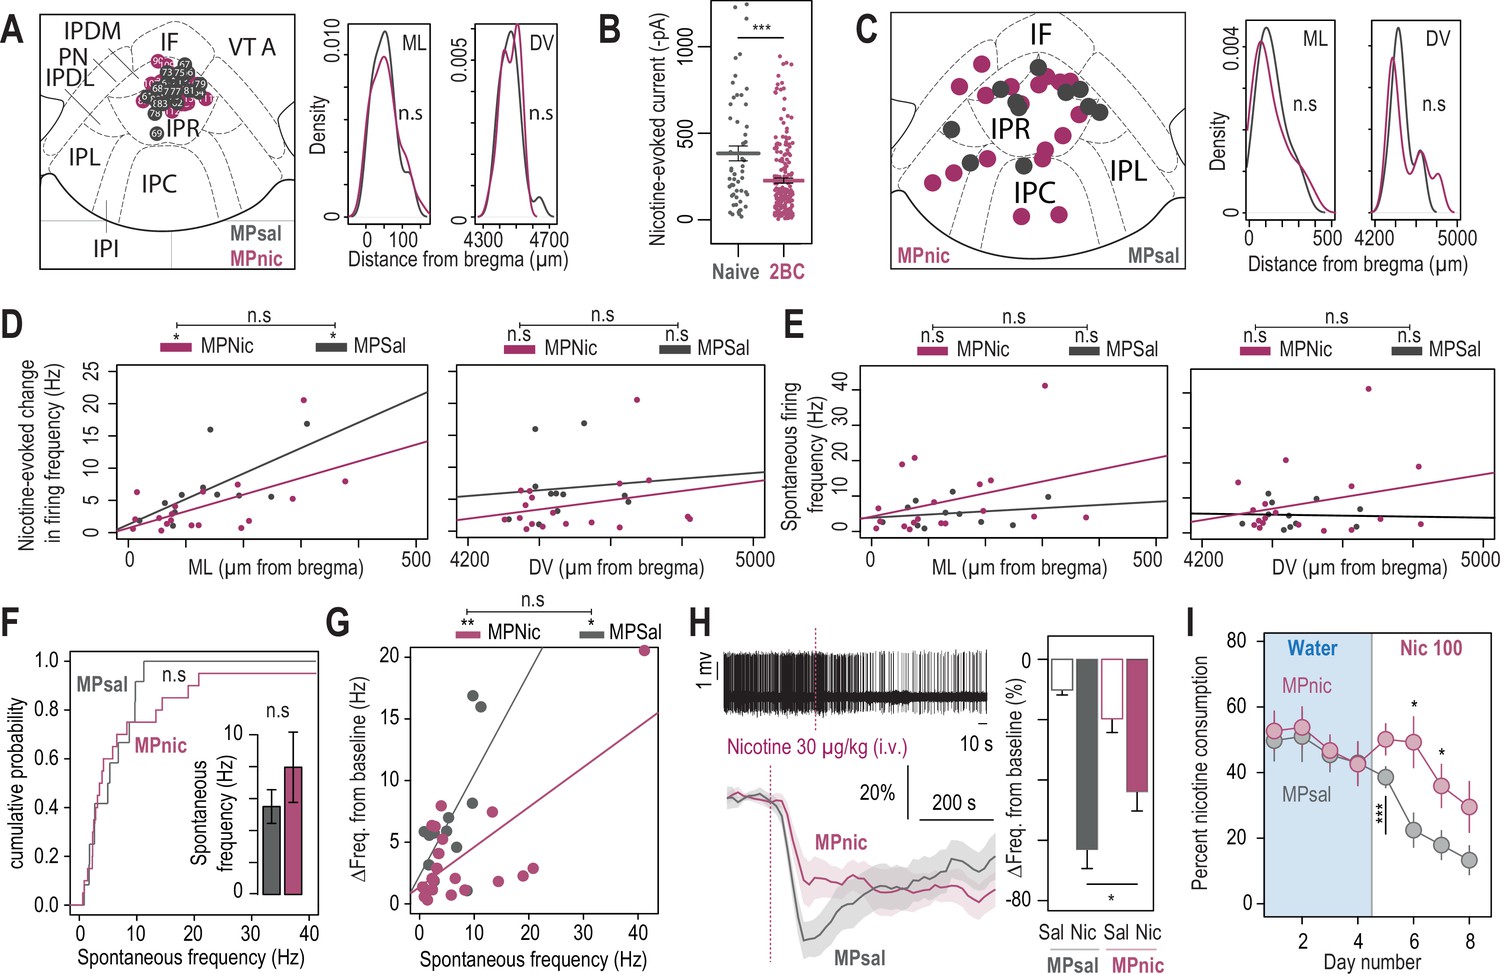
Physiological and behavioral adaptations following chronic nicotine treatment.
(A) Left, localization of the neurons recorded in patch-clamp experiments from mice implanted with saline (MPSal, n=22 neurons from 3 mice) or nicotine minipumps (MPNic, n=30 neurons from 4 mice). The images of two MPSal and four MPNic neurons were missing and thus could not be placed on this map. Right, anatomical sampling was identical between the two groups (t-test, ML: p=0.86; DV: p=0.97). (B) Nicotine-induced current (puff application, 30 µM, 200ms) recorded in voltage-clamp mode (–60 mV) from IPN neurons of naive mice kept in their home-cage (grey, n=56 neurons from 8 mice, I = –384±43 pA) and of mice that underwent the two-bottle choice task (2BC, red, n=207 neurons from 26 mice, I = –227±15 pA). Nicotine-induced currents were of smaller amplitude in 2BC mice than in naive mice (Mann-Whitney, p=0.0002). (C) Left, anatomical position of the neurons recorded in vivo (MPNic: n=20 neurons from 13 mice; MPSal: n=12 neurons from 6 mice). Right: The medio-lateral (ML) and dorsoventral (DV) distributions of the neurons were identical in both groups (Mann-Whitney, ML: p=0.52, DV: p=0.87). (D) Correlation between the mediolateral (but not the dorsoventral) coordinates of the neurons and their response to nicotine, in MPSal (ML: R2=0.43, F1,9 = 6.9, p=0.027; DV: R2=0.008, F1,9 = 0.075, p=0.79) and MPNic mice (ML: R2=0.33, F1,16 = 8.14, p0.011; DV: R2=0.06, F1,16 = 1.13, p=0.3). The correlations are not statistically different between the two groups (LM: F1,25 = 0.61, p=0.44; DV: F1,25 = 0.02, p=0.87). (E) Absence of correlation between the mediolateral or dorsoventral coordinates of the neurons and their basal firing frequency in both MPSal (ML: R2=0.04, F1,9 = 0.44, p=0.52; DV: R2=0.001, F1,9 = 0.015, p=0.9) and MPNic mice (ML: R2=0.12, F1,16 = 2.2, p=0.15; DV: R2=0.07, F1,16 = 1.27, p=0.27). The correlations are not statistically different between the two groups (ML: F1,25 = 0.46, p=0.5; DV: F1,25 = 0.39, p=0.53). (F) Cumulative distribution of the spontaneous firing frequencies of IPN neurons from nicotine- and saline-treated mice (Kolmogorov-Smirnov, p=0.56). Inset: average spontaneous frequency of IPN neurons from nicotine- and saline-treated mice (Mann-Whitney, p=0.7). (G) Positive correlation between the spontaneous activity of IPN neurons and their response to nicotine, for nicotine- (R2=0.48, F1,16 = 14.84, p=0.0014) and saline-treated mice (R2=0.38, F1,9 = 5.64, p=0.04). The correlations are not statistically different between the two groups (F1,25 = 2.65, p=0.11). (H) In vivo juxtacellular recordings of nicotine-evoked responses in nicotine-inhibited IPN neurons of saline- and nicotine-treated animals. Top left, representative electrophysiological recording of an IPN neuron, during an i.v. injection of nicotine (30 µg/kg). Bottom left, average time course and amplitude of the change in firing frequency from baseline after an i.v. injection of saline and nicotine (30 µg/kg), for IPN neurons of saline- (n=12 neurons from 7 mice) and nicotine-treated animals (n=13 neurons from 10 mice). Right, responses were on average lower after chronic exposure to nicotine (p<0.05). (I) Daily percent nicotine consumption for saline- and nicotine-treated mice, for each day in the two-bottle choice task. In saline-treated mice, avoidance to nicotine appears from the second nicotine exposition day onward. In all panels, mice treated with nicotine (MPNic) are shown in red, and control mice treated with saline (MPSal) in grey. *** p<0.001, ** p<0.01, * p<0.05.
Figure 4 with 2 supplements
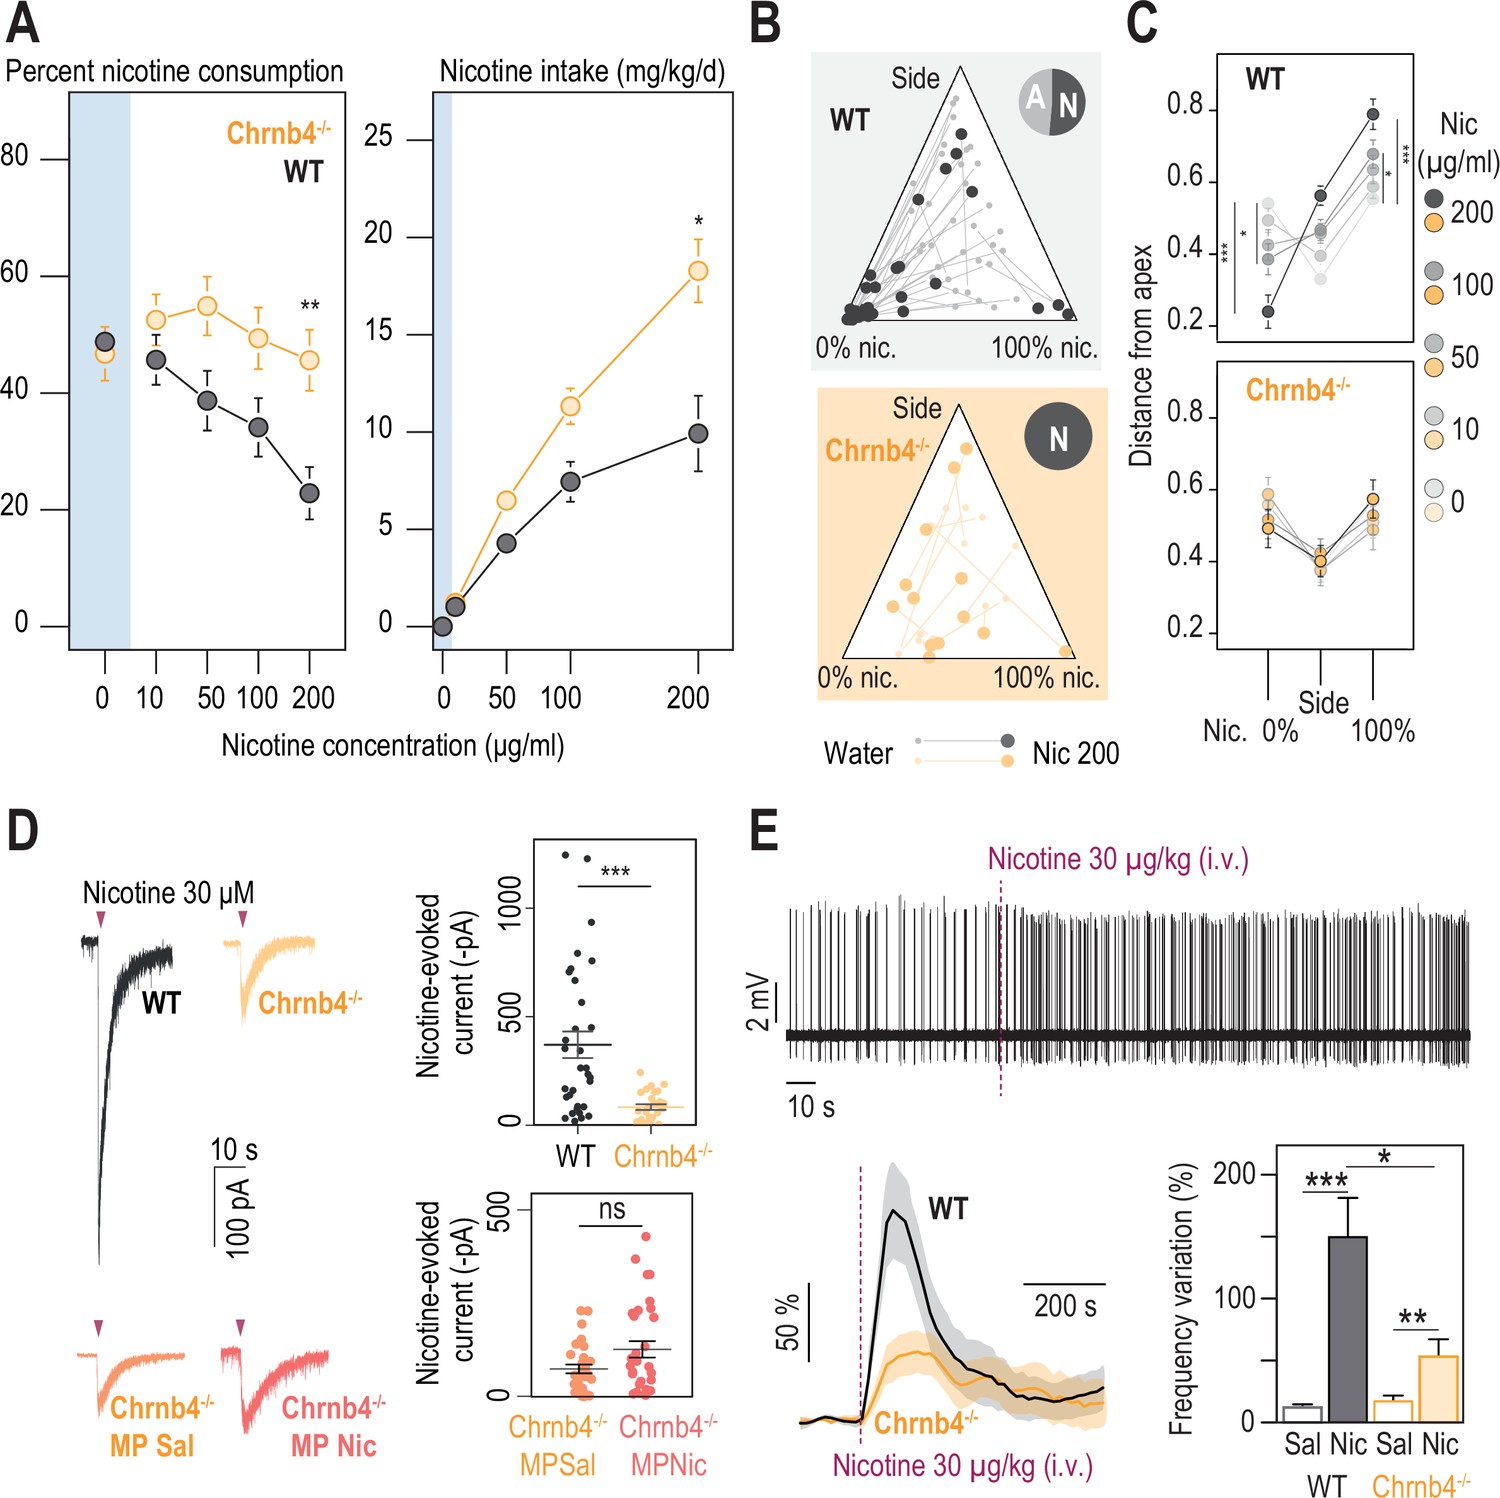
β4-containing nicotinic receptors are essential for triggering nicotine aversion in mice.
(A) Left, average percent nicotine consumption in WT and Chrnb4-/- mice for each concentration of nicotine in the two-bottle choice task. WT mice had lower percent nicotine consumption than Chrnb4-/- mice (Mann-Whitney test with Holm-Bonferroni correction). WT mice decreased their percent nicotine consumption throughout the task (Friedman test, n=35, df = 4, p<0.001 and Mann-Whitney post-hoc test with Holm-Bonferroni correction) while Chrnb4-/- mice displayed a stable percent nicotine consumption (Friedman test, n=13, df = 4, p=0.11). Right, average nicotine intake (mg/kg/day) in Chrnb4-/- and WT mice for the different concentrations of nicotine (Friedman test, n=35, df = 3, p<0.001 and Mann-Whitney post-hoc test with Holm-Bonferroni correction). Chrnb4-/- mice consumed more nicotine than WT mice (Mann-Whitney test). (B) Ternary diagram representing each WT and Chrnb4-/- individual for its nicotine consumption index over its side bias index. Small dots correspond to the habituation period (water vs. water) and bigger dots to the condition with 200 µg/ml of nicotine in one bottle. Inserts: pie charts illustrating the proportion of avoiders (A, light grey) and non-avoiders (N, dark grey) for each genotype at the end of the task. Note the absence of avoiders in Chrnb4-/- mice. (C) Average distance from each apex at 0, 10, 50, 100, and 200 µg/ml of nicotine (paired Mann-Whitney test with Holm-Bonferroni correction, p(Sacc 0–200)=0.0002, p(Sacc 0–100)=0.03; p(Nic 0–200)=0.0002, p(Sacc 0–100)=0.03). (D) Left, representative currents following a puff application of nicotine (30 µM, 200ms) in IPN neurons from naive WT and Chrnb4-/- mice, or from saline-treated (orange) and nicotine-treated (dark orange) Chrnb4-/- mice. Right, average nicotine-evoked currents recorded in IPN neurons from naïve WT (n=32 neurons from 5 mice, I = –370±61 pA) and Chrnb4-/- (n=27 neurons from 4 mice, I = –83±13 pA) mice, and from Chrnb4-/- chronically treated with either saline (Sal, n=30 neurons from 6 mice, I = –72±11 pA) or nicotine (Nic, n=31 neurons from 5 mice, I = –123±21 pA). Chrnb4-/- mice presented a large decrease in nicotine-evoked currents (Mann-Whitney test, p=4e-05). Nicotine treatment did not alter nicotine-evoked currents in IPN neurons of Chrnb4-/- mice (Mann-Whitney test, p=0.15). (E) Juxtacellular recordings of nicotine-evoked responses in IPN neurons of naive WT and Chrnb4-/- mice. Top, representative recording in Chrnb4-/- mice. Bottom left, average nicotine-evoked responses at 30 µg/kg of nicotine in IPN neurons from WT and Chrnb4-/- mice. Bottom right, average amplitude of the change in firing frequency from baseline after an i.v. injection of saline and nicotine (30 µg/kg), for IPN neurons from WT (n=18 neurons from 14 mice) and Chrnb4-/- (n=10 neurons from 8 mice) mice. Nicotine-induced responses were smaller in Chrnb4-/- than in WT mice (p=0.04, Mann Whitney test). All recorded neurons were neurobiotin-labelled and confirmed to be within the IPN. In all figure panels WT animals are depicted in grey and Chrnb4-/- mice in yellow. *** p<0.001, ** p<0.01, * p<0.05.
-
Figure 4—source data 1
Source data for Figure 4.
- https://cdn.elifesciences.org/articles/80767/elife-80767-fig4-data1-v2.xlsx
Figure 4—figure supplement 1

Behavioral differences between WT and Chrnb4-/- mice.
(A) Nicotine intake (mg/kg/day) for individual WT (n=35, same as in Figure 1) and Chrnb4-/- mice (n=13), as concentration of nicotine increases. (B) Percent quinine (600 μM) consumption is not different between WT (n=8 mice, same as in Figure 1—figure supplement 1C) and Chrnb4-/- mice (n=8 mice, Mann-Whitney, p=0.64). (C) Ternary representations for WT (black) and Chrnb4-/- mice (orange), illustrating their nicotine consumption index over their side bias index, as nicotine concentration increases during the task. (D) Distance from each of the three apices for WT (black) and Chrnb4-/- mice (orange) as nicotine concentration increases during the task. Note how the behavior of WT mice is highly nicotine-concentration-dependent compared to that of Chrnb4-/- mice. (Mann-Whitney test, Nic 100 µg/ml: p(Nic)=0.018; Nic 200 µg/ml: p(Sacc)<0.001, p(Side)<0.001, p(Nic)<0.001). In all panels, WT mice are shown in black and Chrnb4-/- mice in orange.
Figure 4—figure supplement 2
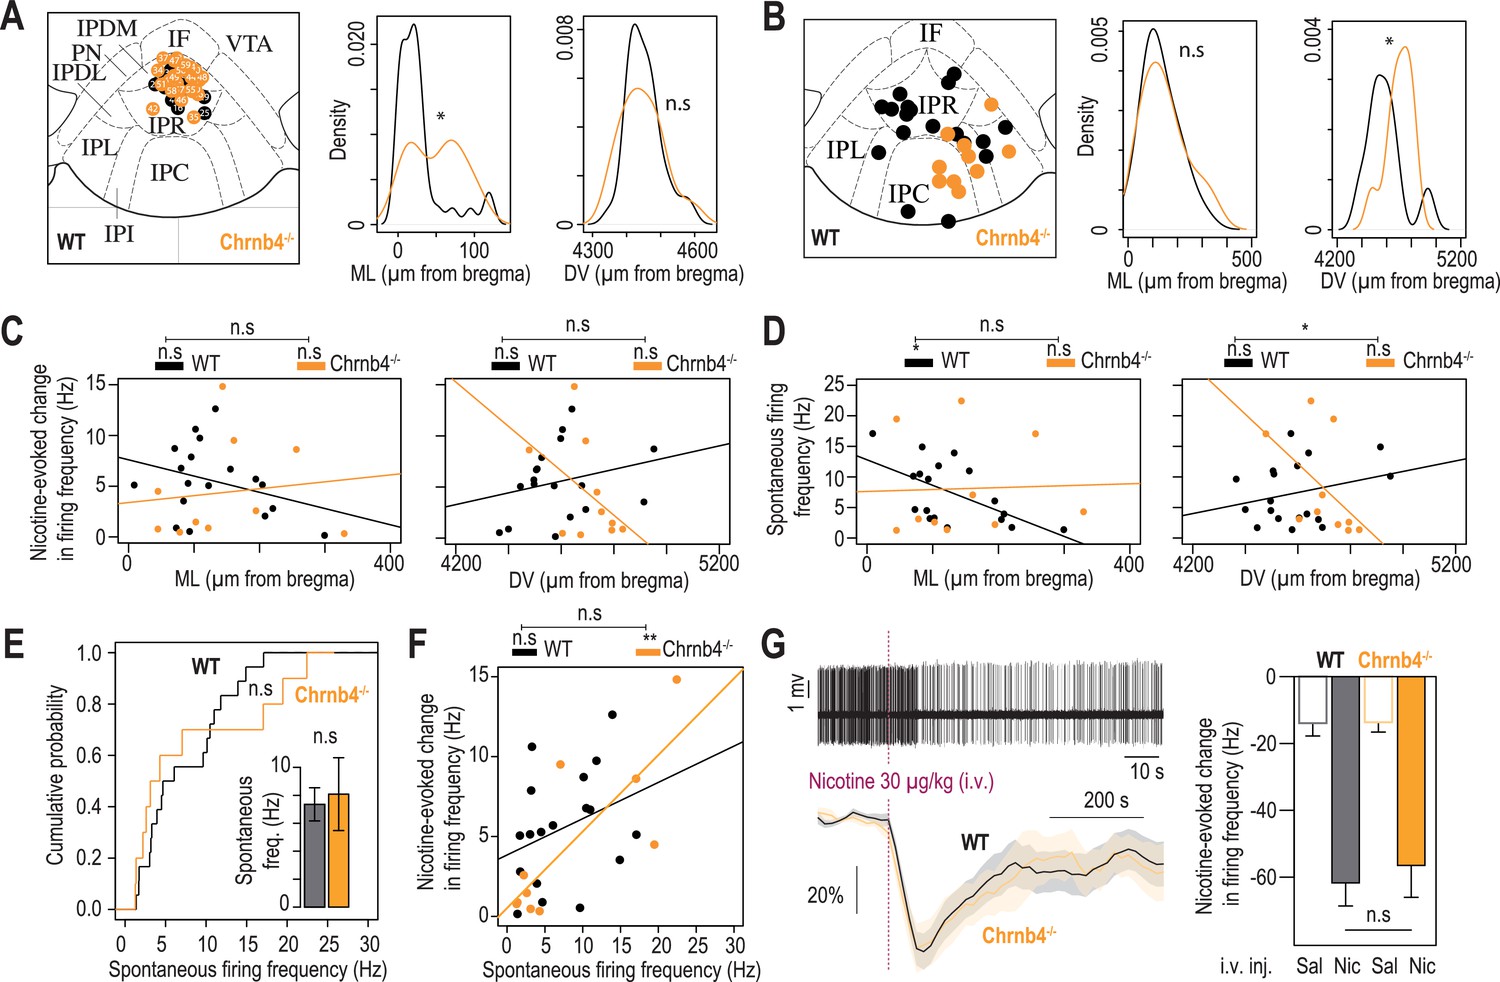
Electrophysiological differences between WT and Chrnb4-/- mice.
(A) Anatomical localization of the neurons recorded in patch-clamp electrophysiology, from WT (n=32 neurons from 5 mice) and Chrnb4-/- mice (n=26 neurons from 4 mice). The image of one Chrnb4-/- neuron was missing and thus could not be placed on this map. Anatomical sampling was different between the two groups in the ML axis (t-test, ML: p=0.012) but not the DV axis (p=0.76). (B) Anatomical distribution of the neurons recorded in vivo. There was a difference between the two groups in the DV (Mann-Whitney, p=0.02) but not the ML axis (Mann-Whitney, p=0.72). (C) Absence of correlation between the medio-lateral or dorso-ventral position of the neurons and their response to nicotine for both groups (WT ML: R2=0.1, F1,16 = 1.82, p=0.19; WT DV: R2=0.06, F1,16 = 0.1, p=0.31; Chrnb4-/- ML: R2=0.015, F1,8 = 0.12, p=0.72; Chrnb4-/- DV: R2=0.21, F1,8 = 2.17, p=0.17). The correlations are not statistically different between the two groups (ML: F1,24 = 1.22, p=0.28; DV: F1,24 = 3.9, p=0.06). (D) Correlation between the medio-lateral position of the neurons and their spontaneous firing frequency for WT (R2=0.34, F1,16 = 8.37, p=0.01) but not for Chrnb4-/- mice (R2=0.001, F1,8 = 0.009, p=0.92). Absence of correlation between the dorso-ventral position of the neurons and their spontaneous firing frequency for both groups (WT: R2=0.07, F1,16 = 1.19, p=0.29; Chrnb4-/-: R2=0.27, F1,8 = 2.9, p=0.12). The correlations between the dorso-ventral, but not medio-lateral, position of the neurons and their spontaneous firing frequency are statistically different between the two groups (ML: F1,24 = 2.16, p=0.15, DV: F1,24 = 5.48, p=0.02). (E) Cumulative distribution of the spontaneous firing frequencies of IPN neurons from WT (black, n=18 neurons from 14 mice) and Chrnb4-/- mice (orange, n=10 neurons from 8 mice; Kolmogorov-Smirnov, p=0.62). Inset: average spontaneous frequency of IPN neurons from WT and Chrnb4-/- mice (Mann-Whitney, p=0.65). (F) Positive correlation between the spontaneous activity of IPN neurons and their response to nicotine, for Chrnb4-/- (R2=0.63, F1,8 = 13.78, p=0.006) but not for WT mice (R2=0.1, F1,16 = 1.87, p=0.18). The correlations are not statistically different between the two groups (F1,24 = 1.42, p=0.24). (G) In vivo juxtacellular recordings of nicotine-evoked inhibition in IPN neurons of WT and Chrnb4-/- animals. Top, representative electrophysiological recording of an IPN neuron, during an i.v. injection of nicotine (30 µg/kg). Bottom, average time course and amplitude of the change in firing frequency from baseline after an i.v. injection of saline and nicotine (30 µg/kg), for WT (black) and Chrnb4-/- animals (yellow). Right, average amplitude of the change in firing frequency from baseline after an i.v. injection of saline and nicotine (30 µg/kg) in nicotine-inhibited IPN neurons from WT (n=16 neurons from 14 mice) and Chrnb4-/- mice (n=8 neurons from 6 mice). For all panels, WT mice are in black and Chrnb4-/- mice in orange. *** p<0.001, ** p<0.01, * p<0.05.
Figure 5 with 1 supplement
β4-containing nAChRs of the IPN are involved in the control of nicotine consumption and in aversion to nicotine in mice.
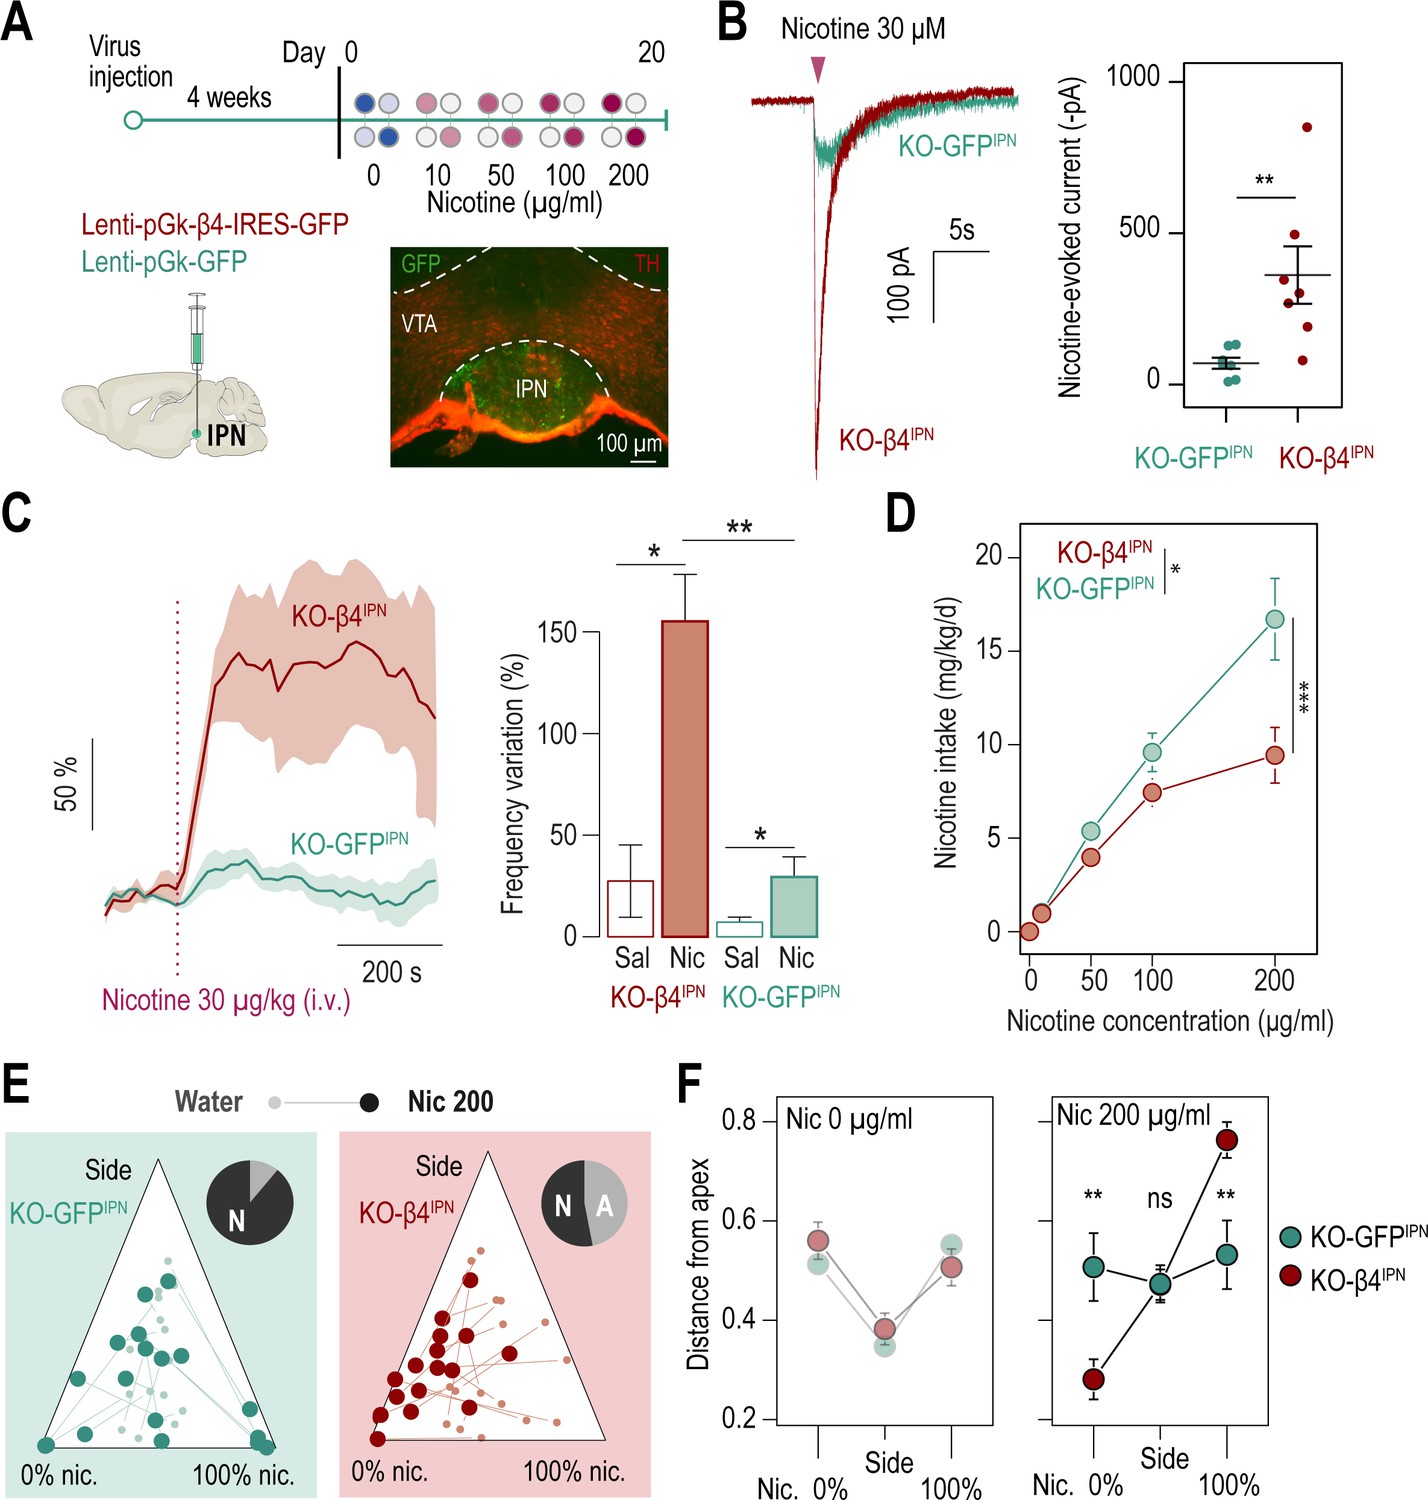
(A) Protocol: stereotaxic transduction of the β4 subunit together with GFP (or GFP alone in control mice) in the IPN of Chrnb4-/- mice, and subsequent two-bottle choice task. Bottom right: coronal section highlighting proper viral transduction of lenti-pGK-β4-IRES-GFP in the IPN. (B) Validation of the re-expression strategy using whole-cell patch-clamp recordings. Representative currents and average responses following a puff application of nicotine (30 µM, 200ms) on IPN neurons from Chrnb4-/- mice transduced in the IPN with either lenti-pGK-β4-IRES-GFP (KO-β4IPN, n=7 neurons from 2 mice, I = –362±95 pA) or lenti-pGK-GFP (KO-GFPIPN, n=7 neurons from 1 mouse, I = –71±18 pA; Mann-Whitney test, p=0.004). (C) Juxtacellular recordings of nicotine-evoked responses in IPN neurons of naive Chrnb4-/- mice transduced with either GFP (KO-GFPIPN) or β4 in the IPN (KO-β4IPN). Left, average nicotine-evoked responses at 30 µg/kg of nicotine in IPN neurons from KO-GFPIPN and KO-β4IPN mice. Right, average amplitude of the change in firing frequency from baseline after an i.v. injection of saline or nicotine (30 µg/kg), for IPN neurons of KO-GFPIPN (n=7 neurons from 4 mice) and KO-β4IPN mice (n=5 neurons from 3 mice). Nicotine-evoked responses were larger in KO-β4IPN than KO-GFPIPN mice (p=0.005, Mann Whitney test). (D) Average nicotine intake was lower in KO-β4IPN than in KO-GFPIPN (two-way repeated measure; ANOVA: genotype x dose interaction, F[3, 99]=6.3, ***p<0.001; main effect of dose, F[3, 99]=69.1 ***p<0.001, effect of genotype, F(1, 33)=6.637, *p=0.015). (E) Ternary diagram representing each Chrnb4-/- mouse, transduced with either β4 or GFP, and illustrating its nicotine consumption index over its side bias index. Small dots correspond to the habituation period (water vs. water) and bigger dots to the condition with 200 µg/ml of nicotine in one bottle. Inserts: pie charts illustrating the proportion of avoiders (A, light grey) and non-avoiders (N, dark grey) for each condition at the end of the task. (F) Average distance from each apex during the two-bottle choice task at 0 and 200 µg/ml of nicotine, for KO-β4IPN and KO-GFPIPN mice (pSacc = 0.007, pNic = 0.008, Mann-Whitney test with Holm-Bonferroni correction). In all figure panels KO-β4IPN mice are depicted in red and KO-GFPIPN mice (controls) in green. *** p<0.001, ** p<0.01, * p<0.05.
-
Figure 5—source data 1
Source data for Figure 5.
- https://cdn.elifesciences.org/articles/80767/elife-80767-fig5-data1-v2.xlsx
Figure 5—figure supplement 1
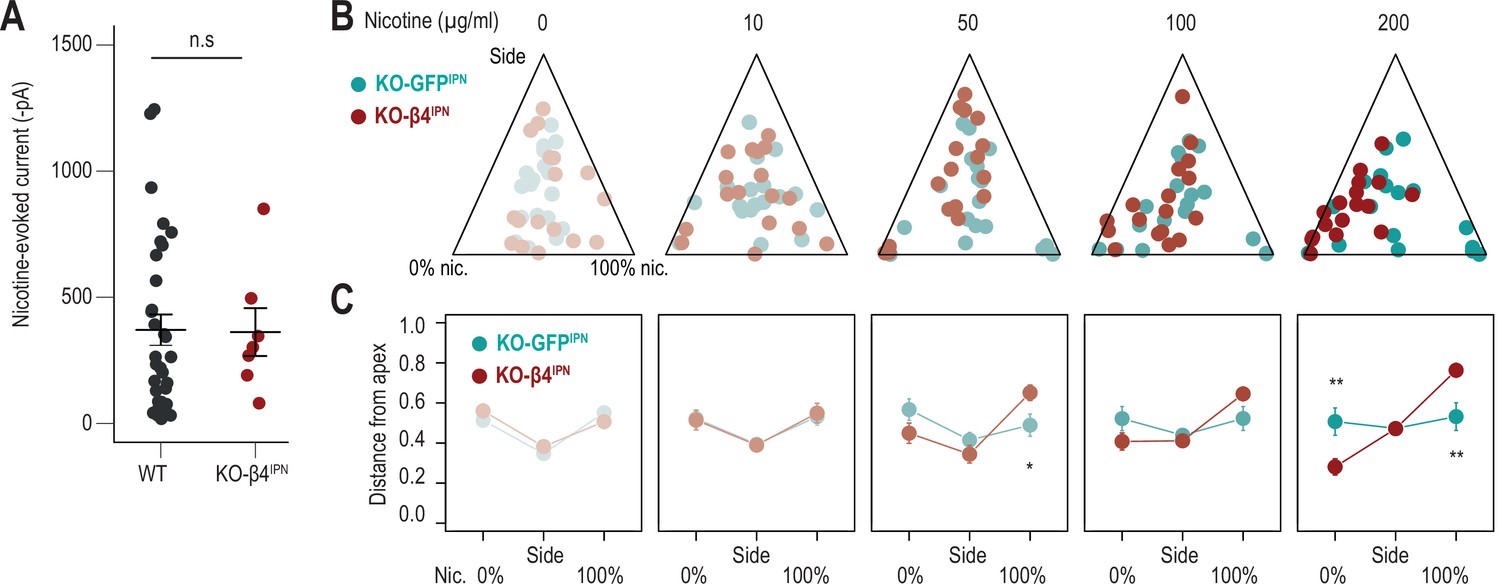
Viral rescue of β4 nAChR subunit expression in the IPN of Chrnb4-/- mice.
(A) Average nicotine-induced currents following a puff application of nicotine (30 µM, 200ms) on IPN neurons from WT (n=32 neurons from 5 mice, I = –370±61 pA) and KO-β4IPN mice (n=7 neurons from 2 mice, I = –362±95 pA; Mann-Whitney, p=0.6). (B) Ternary representations for KO-GFPIPN (controls, green) and KO-β4IPN mice (red), illustrating their nicotine consumption index over their side bias index, as nicotine concentration increases during the task. (C) Distance from each of the three apices for KO-GFPIPN (controls, green) and KO-β4IPN mice (red) as nicotine concentration increases during the task. (Mann-Whitney, Nic 50 µg/ml: p(Nic)=0.017; Nic 200 µg/ml: p(Sacc)=0.0074, p(Nic)=0.0083). *** p<0.001, ** p<0.01, * p<0.05.
Author response image 1

Author response image 2

Additional files
Download links
A two-part list of links to download the article, or parts of the article, in various formats.
Downloads (link to download the article as PDF)
Open citations (links to open the citations from this article in various online reference manager services)
Cite this article (links to download the citations from this article in formats compatible with various reference manager tools)
Prolonged nicotine exposure reduces aversion to the drug in mice by altering nicotinic transmission in the interpeduncular nucleus
eLife 12:e80767.
https://doi.org/10.7554/eLife.80767


