A brain-wide analysis maps structural evolution to distinct anatomical module
- Jupiter Life Science Initiative, Florida Atlantic University, United States
- Department of Biology, University of Massachusetts Amherst, United States
- Department of Biology, Texas A&M University, United States
- Department of Biological Sciences, Lehigh University, United States
Figures
Figure 1 with 3 supplements
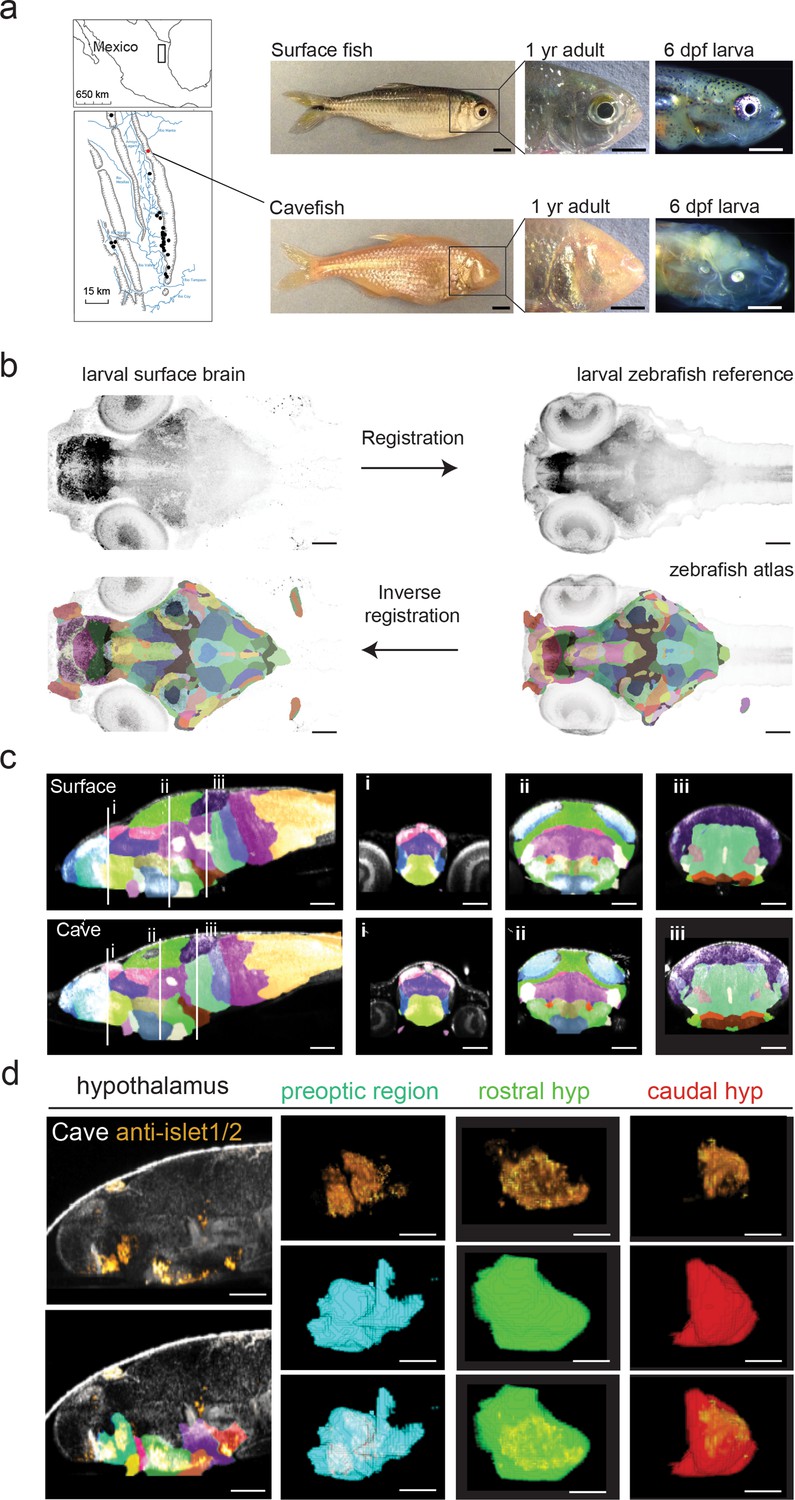
Developing a single A. mexicanus atlas to perform direct brain-wide morphometric analyses across all populations.
(a) Map showing the 29 independently evolved cave populations (black dots) of the El Abra region in Mexico. The Pachón cavefish population used for this project is marked as a red dot. Scale bars = 0.5 cm (full fish, 1 year adult) and 0.5 mm (larvae). (b) Schematic showing registration and atlas inverse registration method used to create an A. mexicanus atlas for cross-population segmentation and analysis. (c) Sagittal and transverse (i–iii) sections of the 26 region surface fish and cavefish atlas. (i) Habenula (pink), pallium (blue), ventral thalamus (purple), and preoptic (light green). (ii) optic tectum neuropil (sky blue), optic tectum cell bodies (green), tegmentum (light purple), rostral hypothalamus (dark blue), posterior tuberculum (gold), statoacoustic ganglion (beige). (iii) Cerebellum (dark purple), prepontine (light green), locus coeruleus (brown), raphe (beige), intermediate hypothalamus (dark brown), and caudal hypothalamus (bright red). (d) Islet1/2 antibody segmentation following ANTs inverse registration of cavefish atlas. Islet positive neurons exhibit the same segmentation in the preoptic, rostral, and caudal portions of the hypothalamus that have been reported islet positive in zebrafish. Scale bars (b–d) = 80 µm.
-
Figure 1—source data 1
Surface × Pachón F2 hybrid brain atlas in nifty format.
Whole-brain segmented z-stack that outlines 180 defined brain regions. Z-projections of atlas stack were used to generate images.
- https://cdn.elifesciences.org/articles/80777/elife-80777-fig1-data1-v2.zip
Figure 1—figure supplement 1

Pipeline for immunohistochemistry, automated segmentation, and volumetric comparisons of individual fish larvae.
(a) Larval fish were imaged at 5 dpf to measure external anatomical features (e.g. standard length). (b) Larvae were fixed at 6 dpf, immunostained with total-ERK (tERK) and imaged on a two-photon microscope (2P). (c) All larvae were registered to a surface × cave F2 hybrid reference brain, followed by an inverse registration of the segmented cavefish atlas. (d) The 180-region ZBB brain atlas was transformed into scalable atlases, 4 major subdivisions, 13 developmentally defined and 26 molecularly and functionally defined regions. (e) Segmented larval brains were run through CobraZ to volumetrically measure and statistically compare each brain region. Scale bar = (a) 500 µm, (b and c) 100 µm, (d) 50 µm, and (e) 25 µm.
Figure 1—figure supplement 2
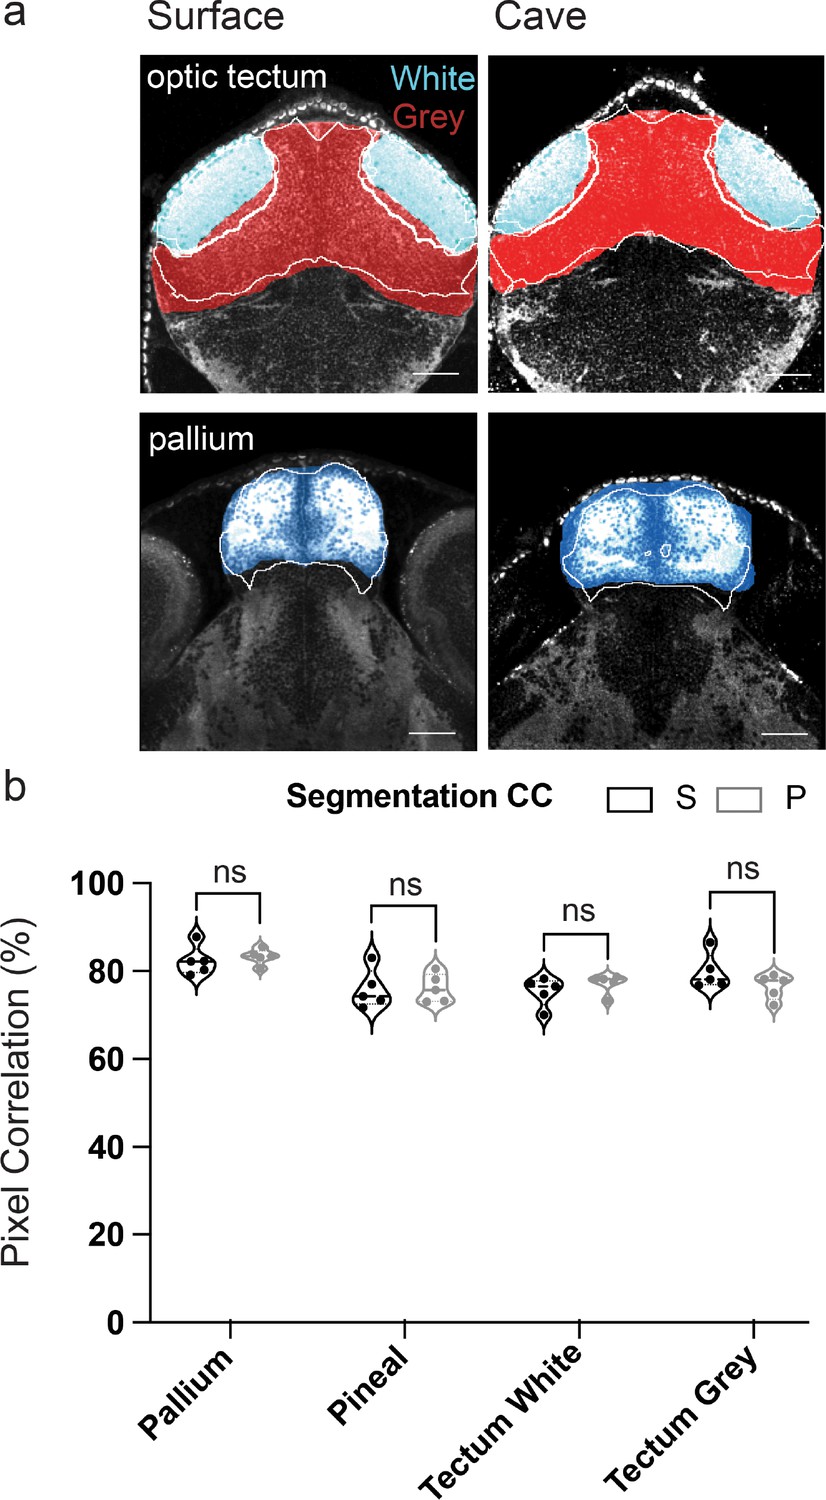
Cross-correlation analysis between hand and automated segmentation of total-ERK-defined brain segments.
(a) Optical sections (coronal) through the and optic tectum (white matter light blue and gray matter red) and pallium (dark blue). Hand segmentations are in color, while automated versions are shown in white outline. (b) Cross-correlation analysis comparing the percent of overlap between hand and automated segments for ERK-defined regions. Pixel correlation percentages did not vary between surface and cavefish. Abbreviations, S=surface fish and P=Pachón cavefish. Cross-correlation percentages were compared using a standard t-test. Scale bars = 25 µm. Statistical tables can be found in the Dryad repository associated with this study (Portella et al., 2010).
Figure 1—figure supplement 3

RNA probe and antibody analysis of segmentation accuracy across the Astyanax atlas.
Segmentation of (a) otx2 positive neurons in the optic tectum, (b) gbx1 neurons in the subpallium, (c) nos1 neurons in the thalamus, (d) oxt positive neurons in the medial preoptic regions, (e) anti-TH neurons in the locus coeruleus, and (f) 5-hydroxytryptamine (5-HT) positive neurons in the superior raphe. Hand segmentations are in color, while automated versions are shown in white outline. Inset panels show outline of segment with positive expression of marker (top) and overlay with full 180-region atlas (bottom). Scale bars = 50 µm for full field, 20 µm for inset images.
Figure 2 with 1 supplement
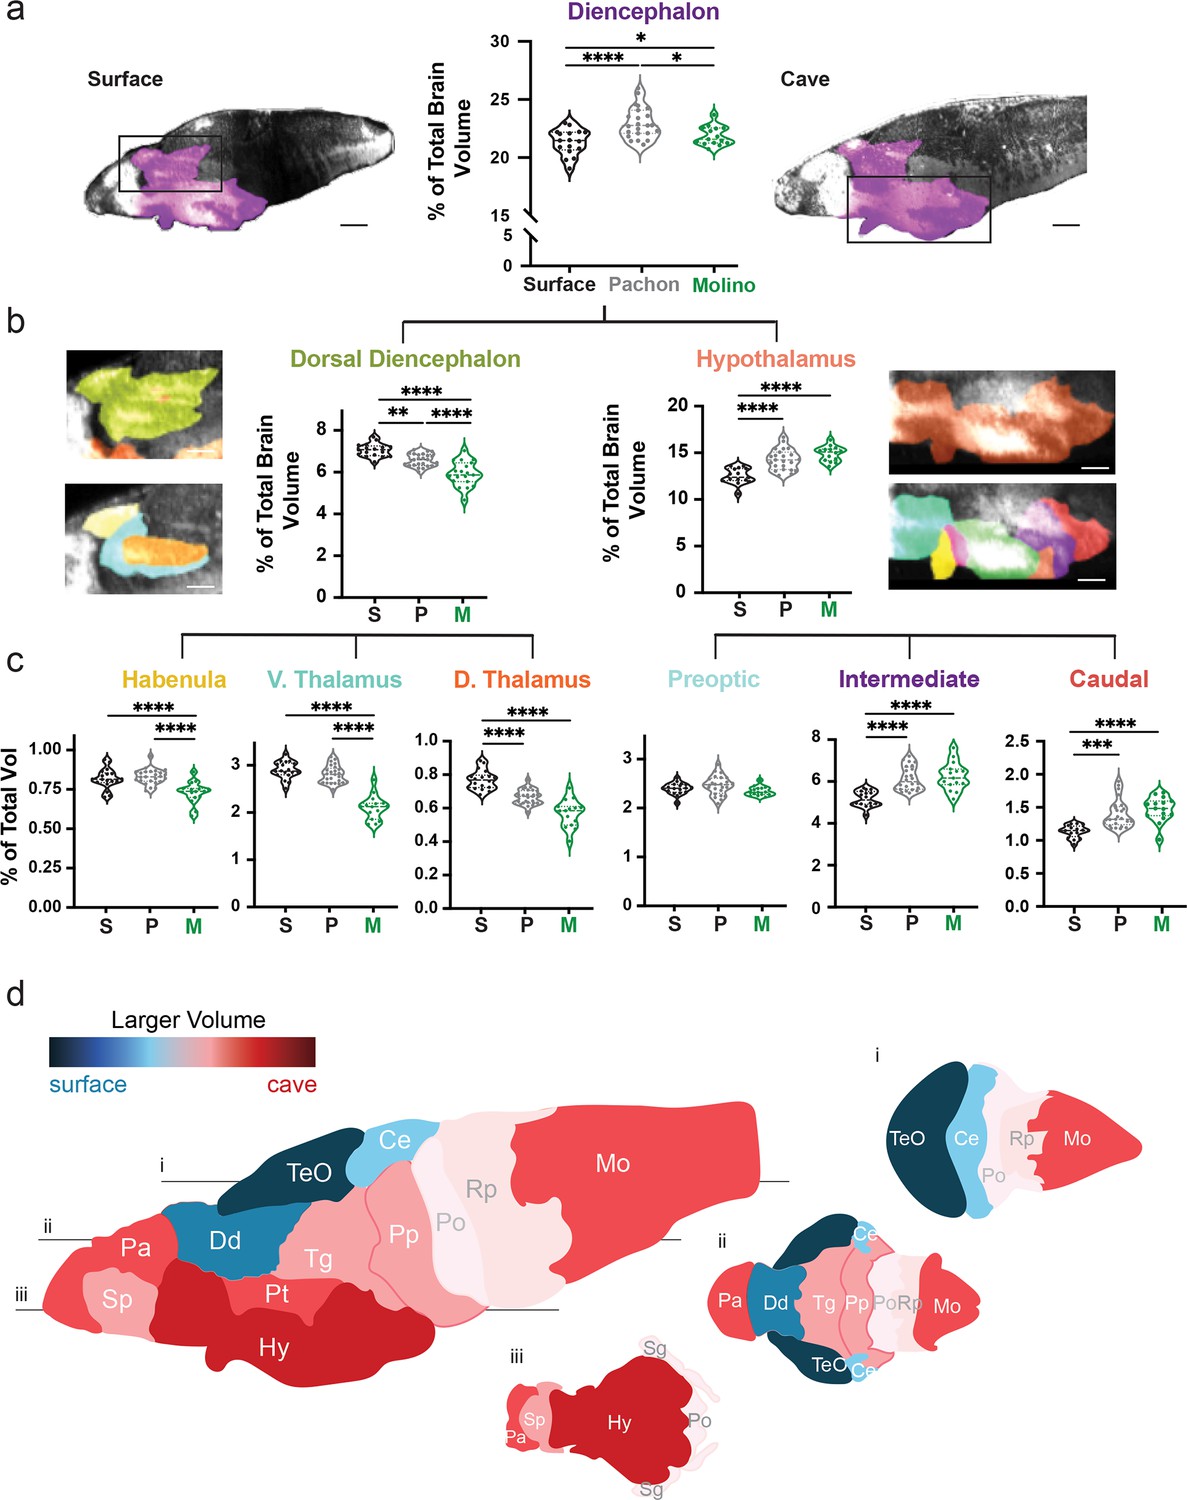
Volumetric variation in wildtype populations reveal convergent dorsal contraction and ventral expansion in the brain of two cavefish populations.
(a) Volumetric comparison of the diencephalon in surface fish, Pachón and Molino cavefish. Percent total brain volume represents pixels of segment divided by total pixels in the brain. Sagittal sections show diencephalon (purple). (b) Volumetric comparisons of the dorsal diencephalon (green) and hypothalamus (orange). (c) Volumetric comparisons of the habenula (gold), ventral thalamus (teal) and dorsal thalamus (burnt orange) of the dorsal diencephalon; along with the preoptic (cyan), intermediate zone (purple), and caudal zone (red), of the hypothalamus. Sample size = surface (16) and Pachón cavefish (24). (d) Colorimetric model depicting size differences in brain regions between surface fish and cavefish. A larger volume in surface fish results in blue coloration, while a larger volume in cavefish results in a red coloration. Horizontal optical sections depicting (i) dorsal, (ii) medial, and (iii) ventral views of the brain. p-Value significance is coded as: *=p < 0.05, **=p < 0.01, ***=p < 0.001, ****=p < 0.0001. Statistical tables can be found in the Dryad repository associated with this study (Portella et al., 2010). Scale bars = 80 µm (a), 25 µm (b).
-
Figure 2—source data 1
Volumetric values for the diencephalon of wildtype larvae.
Three columns of normalized volumetric values for wildtype surface, Pachón and Molino cavefish. Populations were analyzed via one-way ANOVA.
- https://cdn.elifesciences.org/articles/80777/elife-80777-fig2-data1-v2.zip
-
Figure 2—source data 2
Volumetric values for the dorsal diencephalon of wilid-type larvae.
Three columns of normalized volumetric values for wildtype surface, Pachón and Molino cavefish. Populations were analyzed via one-way ANOVA.
- https://cdn.elifesciences.org/articles/80777/elife-80777-fig2-data2-v2.zip
-
Figure 2—source data 3
Volumetric values for the habenula of wildtype larvae.
Three columns of normalized volumetric values for wildtype surface, Pachón and Molino cavefish. Populations were analyzed via one-way ANOVA.
- https://cdn.elifesciences.org/articles/80777/elife-80777-fig2-data3-v2.zip
-
Figure 2—source data 4
Volumetric values for the ventral thalamus of wildtype larvae.
Three columns of normalized volumetric values for wildtype surface, Pachón and Molino cavefish. Populations were analyzed via one-way ANOVA.
- https://cdn.elifesciences.org/articles/80777/elife-80777-fig2-data4-v2.zip
-
Figure 2—source data 5
Volumetric values for the dorsal thalamus of wildtype larvae.
Three columns of normalized volumetric values for wildtype surface, Pachón and Molino cavefish. Populations were analyzed via one-way ANOVA.
- https://cdn.elifesciences.org/articles/80777/elife-80777-fig2-data5-v2.zip
-
Figure 2—source data 6
Volumetric values for the hypothalamus of wildtype larvae.
Three columns of normalized volumetric values for wildtype surface, Pachón and Molino cavefish. Populations were analyzed via one-way ANOVA.
- https://cdn.elifesciences.org/articles/80777/elife-80777-fig2-data6-v2.zip
-
Figure 2—source data 7
Volumetric values for the preoptic region of wildtype larvae.
Three columns of normalized volumetric values for wildtype surface, Pachón and Molino cavefish. Populations were analyzed via one-way ANOVA.
- https://cdn.elifesciences.org/articles/80777/elife-80777-fig2-data7-v2.zip
-
Figure 2—source data 8
Volumetric values for the intermediate zone of wildtype individual larvae.
Three columns of normalized volumetric values for wildtype surface, Pachón and Molino cavefish. Populations were analyzed via one-way ANOVA.
- https://cdn.elifesciences.org/articles/80777/elife-80777-fig2-data8-v2.zip
-
Figure 2—source data 9
Volumetric values for the caudal hypothalamus of wildtype individual larvae.
Three columns of normalized volumetric values for wildtype surface, Pachón and Molino cavefish. Populations were analyzed via one-way ANOVA.
- https://cdn.elifesciences.org/articles/80777/elife-80777-fig2-data9-v2.zip
Figure 2—figure supplement 1
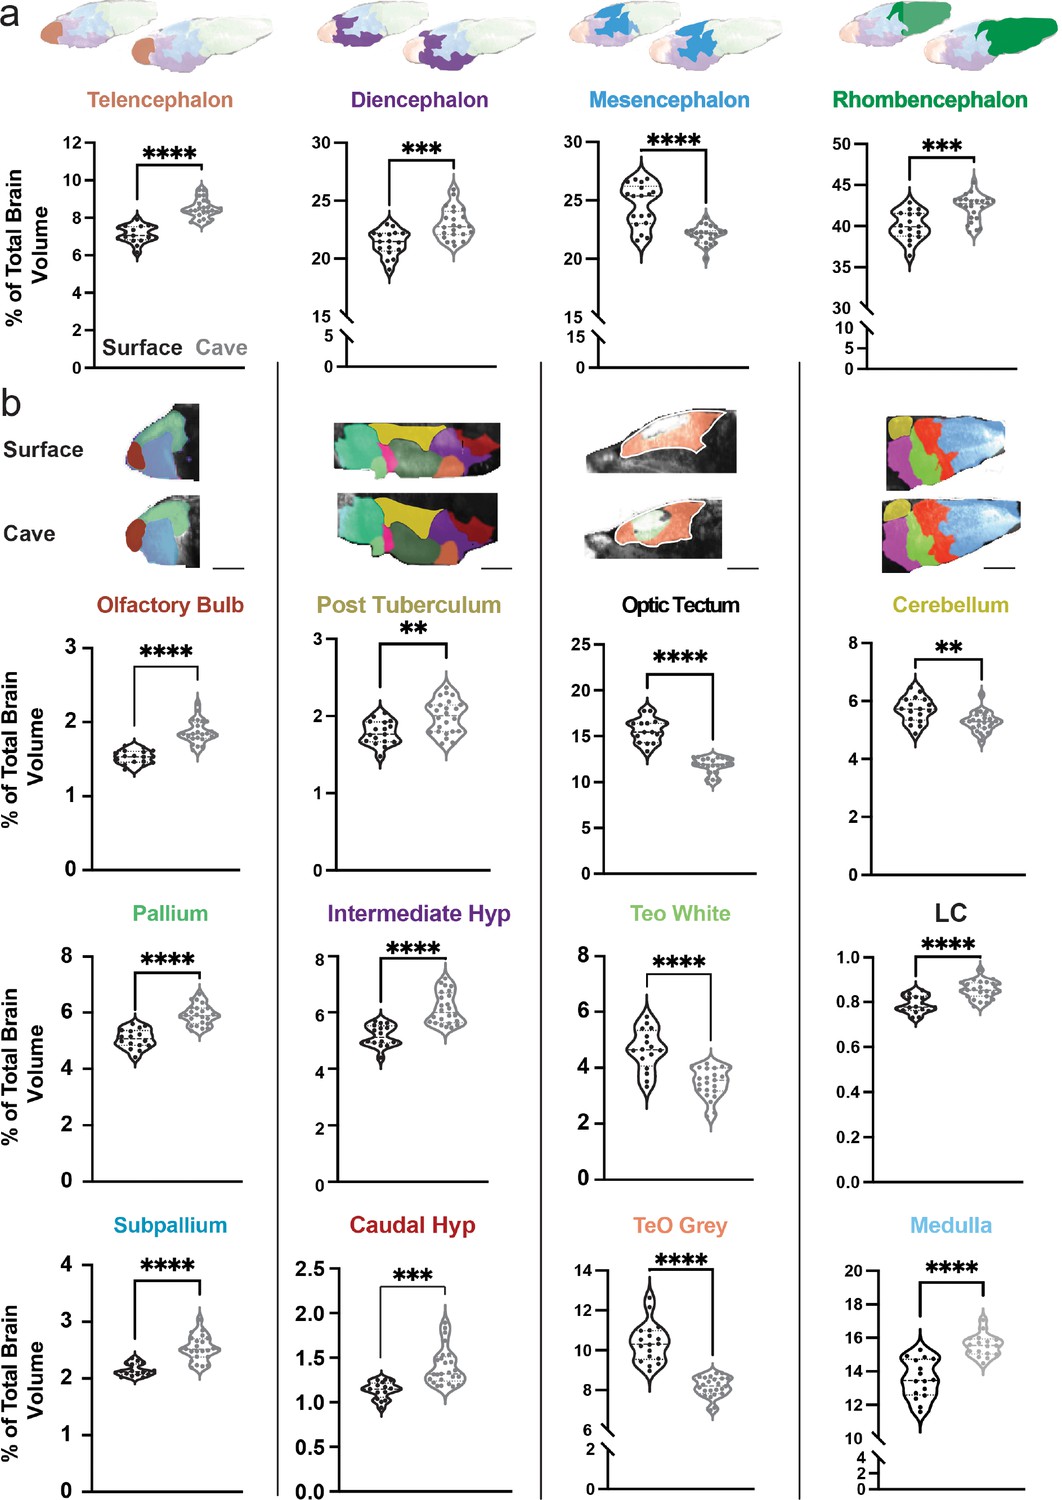
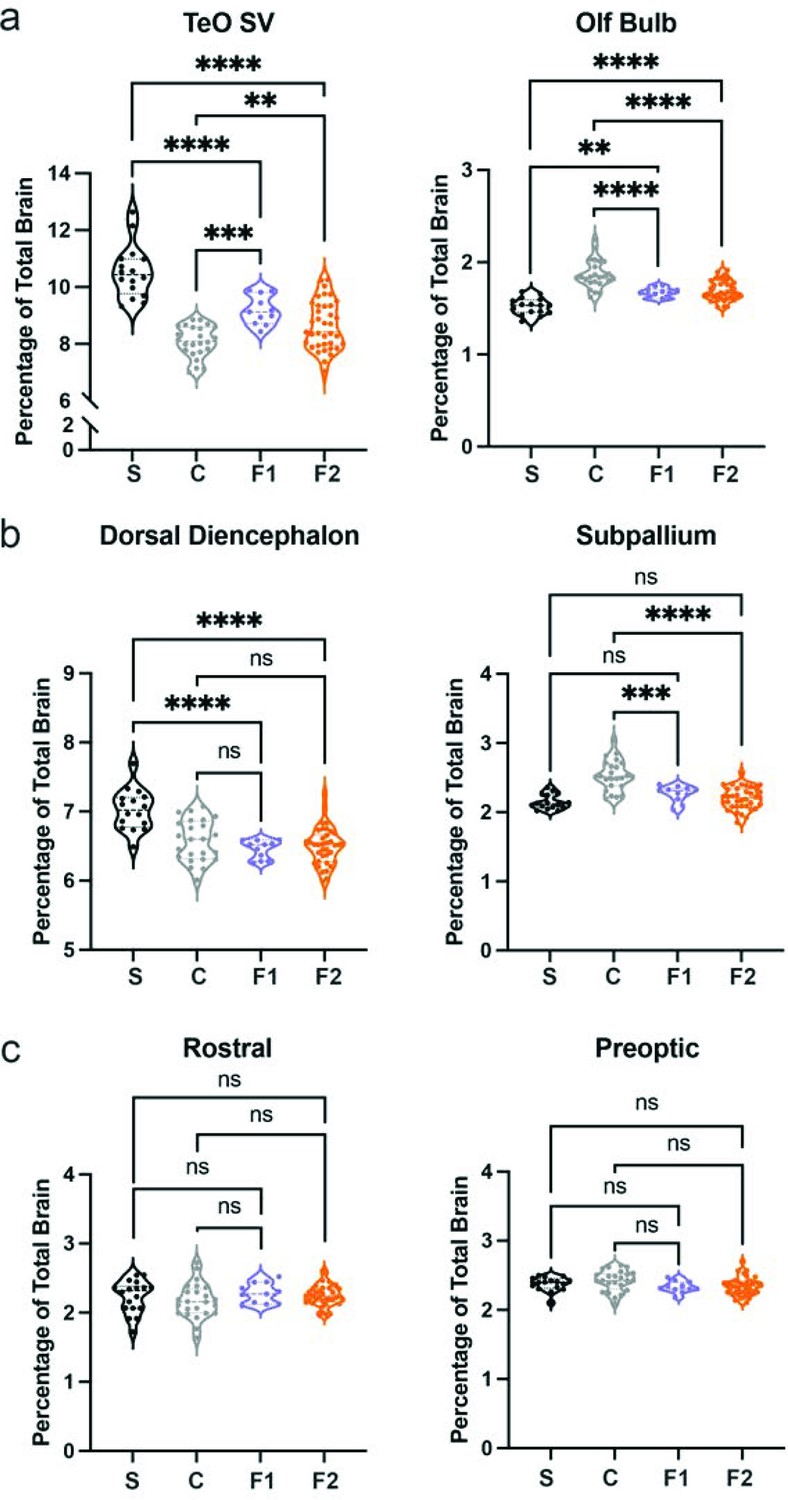
Variation in segment volume between surface and cavefish populations.
(a) Major brain divisions of the vertebrate brain and box plots comparing the volume of each region between surface and cave. Volumes are reported as percentage of total brain volume, calculated by dividing total pixels in a segment by total pixels within the brain. (b) Columns segmenting each major brain division into brain regions defined by developmental, molecular, and functional categories. Each box plots brain segment is color-coded to the corresponding atlas picture at the top of each column. All segments were statistically analyzed using a Student’s t-test and Holm’s corrected for multiple comparisons. p-Value significance is coded as: *=p < 0.05, **=p < 0.01, ***=p < 0.001, ****=p < 0.0001. Statistical tables can be found in the Dryad repository associated with this study (Portella et al., 2010). Scale bars = 40 µm (Tele, Dien, Mesen), 80 µm (Rhomb).
Figure 3 with 2 supplements
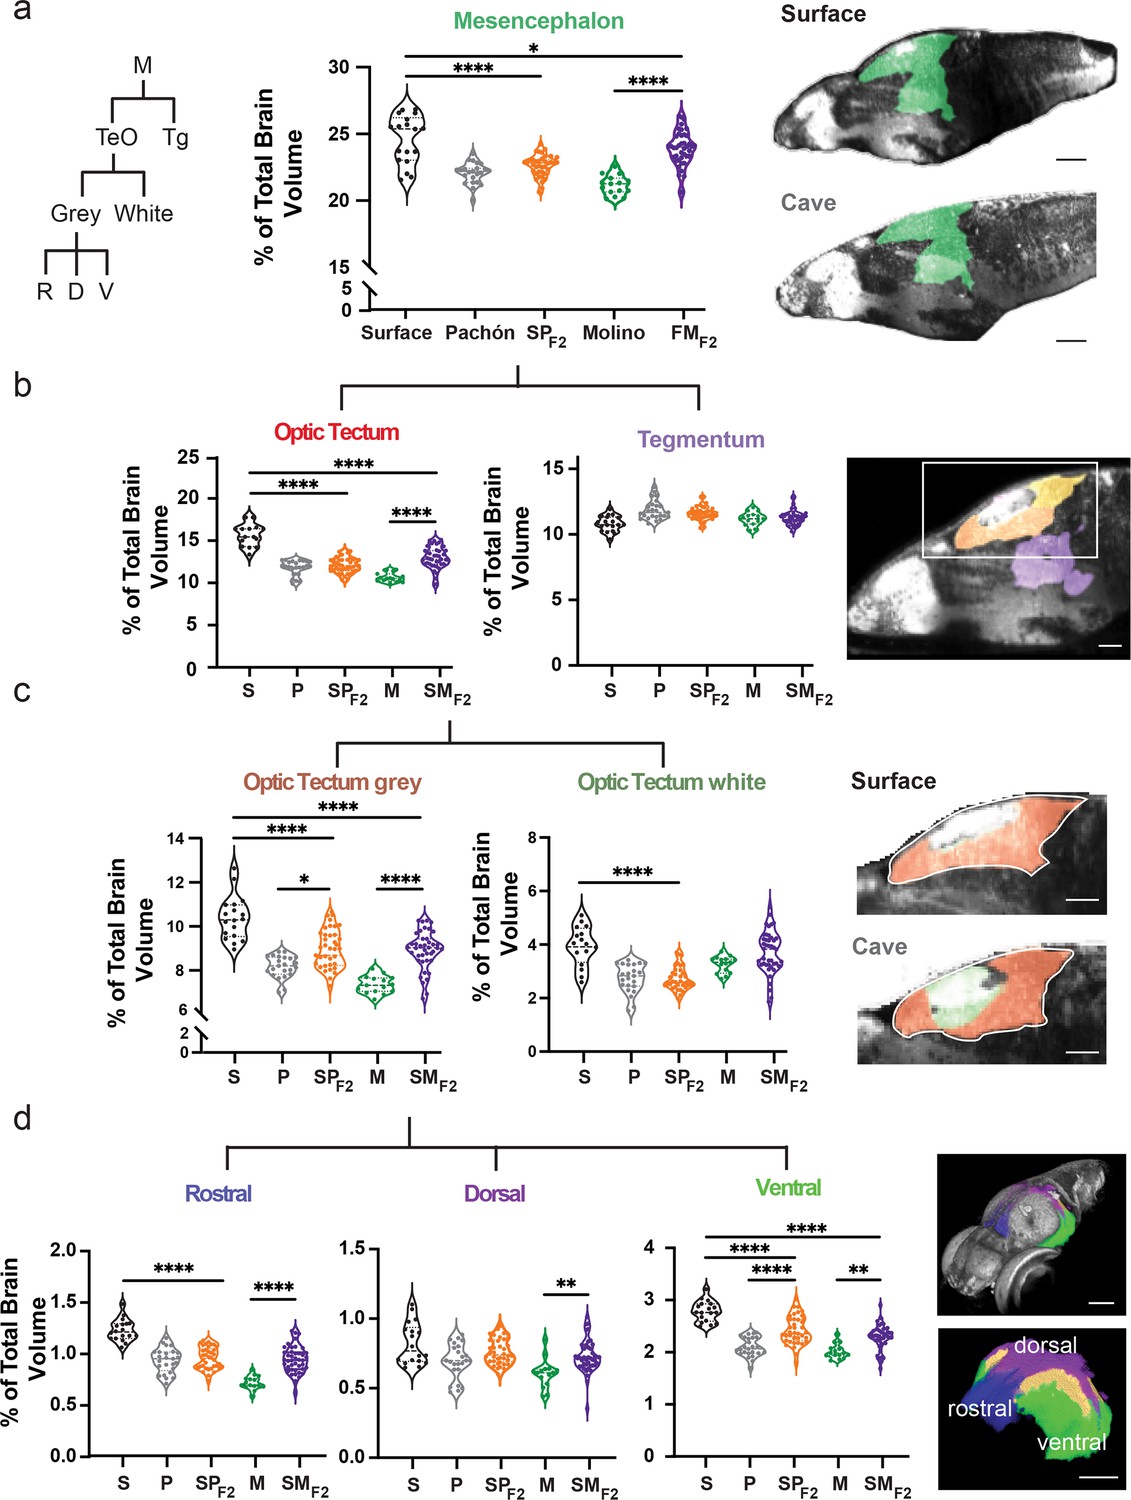
Scalable segmentation of the tectum identifies high variability in the ventral sub-nuclei of the optic tectum’s cell layers.
(a) Volumetric comparison of the mesencephalon in surface fish, Pachón cavefish, Molino cavefish, surface × Pachón F2 hybrid (SPF2), and surface × Molino F2 hybrid (SMF2) larvae. Sagittal sections showing the mesencephalon (green). Percent total brain volume represents pixels of segment divided by total pixels in the brain. Segment tree abbreviations, M – mesencephalon, TeO – optic tectum, Tg – tegmentum, R – rostral, D – dorsal, V – ventral. (b) Volumetric comparisons of the optic tectum (yellow) and tegmentum (purple). (c) Volumetric comparisons of the optic tectum white (neuropil; forest green) and gray matter (cell bodies; orange). (d) Volumetric comparisons of rostral (royal blue), dorsal (purple), and ventral (lime green) segments of the optic tectum gray matter. All segments were statistically analyzed using a standard ANOVA and Holm’s corrected for multiple comparisons. p-Value significance is coded as: *=p < 0.05, **=p < 0.01, ***=p < 0.001, ****=p < 0.0001. Statistical tables can be found in the Dryad repository associated with this study (Portella et al., 2010). Scale bars = 80 µm (a), 25 µm (b), 50 µm (c and d).
-
Figure 3—source data 1
Volumetric values for the mesencephalon of wildtype and F2 hybrid larvae.
Five columns of normalized volumetric values for wildtype surface, Pachón and Molino cavefish, and F2 surface × cave populations. Populations were analyzed via one-way ANOVA.
- https://cdn.elifesciences.org/articles/80777/elife-80777-fig3-data1-v2.zip
-
Figure 3—source data 2
Volumetric values for the tegmentum of wildtype and F2 hybrid larvae.
Five columns of normalized volumetric values for wildtype surface, Pachón and Molino cavefish, and F2 surface × cave populations. Populations were analyzed via one-way ANOVA.
- https://cdn.elifesciences.org/articles/80777/elife-80777-fig3-data2-v2.zip
-
Figure 3—source data 3
Volumetric values for the optic tectum of wildtype and F2 hybrid larvae.
Five columns of normalized volumetric values for wildtype surface, Pachón and Molino cavefish, and F2 surface × cave populations. Populations were analyzed via one-way ANOVA.
- https://cdn.elifesciences.org/articles/80777/elife-80777-fig3-data3-v2.zip
-
Figure 3—source data 4
Volumetric values for the optic tectum gray matter of wildtype and F2 hybrid larvae.
Five columns of normalized volumetric values for wildtype surface, Pachón and Molino cavefish, and F2 surface × cave populations. Populations were analyzed via one-way ANOVA.
- https://cdn.elifesciences.org/articles/80777/elife-80777-fig3-data4-v2.zip
-
Figure 3—source data 5
Volumetric values for the optic tectum white matter of wildtype and F2 hybrid larvae.
Five columns of normalized volumetric values for wildtype surface, Pachón and Molino cavefish, and F2 surface × cave populations. Populations were analyzed via one-way ANOVA.
- https://cdn.elifesciences.org/articles/80777/elife-80777-fig3-data5-v2.zip
-
Figure 3—source data 6
Volumetric values for the rostral optic tectum of wildtype and F2 hybrid larvae.
Five columns of normalized volumetric values for wildtype surface, Pachón and Molino cavefish, and F2 surface × cave populations. Populations were analyzed via one-way ANOVA.
- https://cdn.elifesciences.org/articles/80777/elife-80777-fig3-data6-v2.zip
-
Figure 3—source data 7
Volumetric values for the dorsal optic tectum of wildtype and F2 hybrid larvae.
Five columns of normalized volumetric values for wildtype surface, Pachón and Molino cavefish, and F2 surface × cave populations. Populations were analyzed via one-way ANOVA.
- https://cdn.elifesciences.org/articles/80777/elife-80777-fig3-data7-v2.zip
-
Figure 3—source data 8
Volumetric values for the ventral optic tectum of wildtype and F2 hybrid larvae.
Five columns of normalized volumetric values for wildtype surface, Pachón and Molino cavefish, and F2 surface × cave populations. Populations were analyzed via one-way ANOVA.
- https://cdn.elifesciences.org/articles/80777/elife-80777-fig3-data8-v2.zip
Figure 3—figure supplement 1
Volumetric variability in hybrid larvae reflects wildtype genetic diversity through dominant and intermediate phenotypes.
Representative regions for hybrid larvae that show (a) an intermediate brain size between wildtype surface and cave values, (b) genetic dominance with Pachón cavefish (dorsal diencephalon) or surface fish (subpallium) wildtype populations, and (c) no difference between hybrid and wildtype populations. All segments were statistically analyzed using a standard ANOVA and Holm’s corrected for multiple comparisons. p-Value significance is coded as: *=p < 0.05, **=p < 0.01, ***=p < 0.001, ****=p < 0.0001. Statistical tables can be found in the Dryad repository associated with this study (Portella et al., 2010).
Figure 3—figure supplement 2
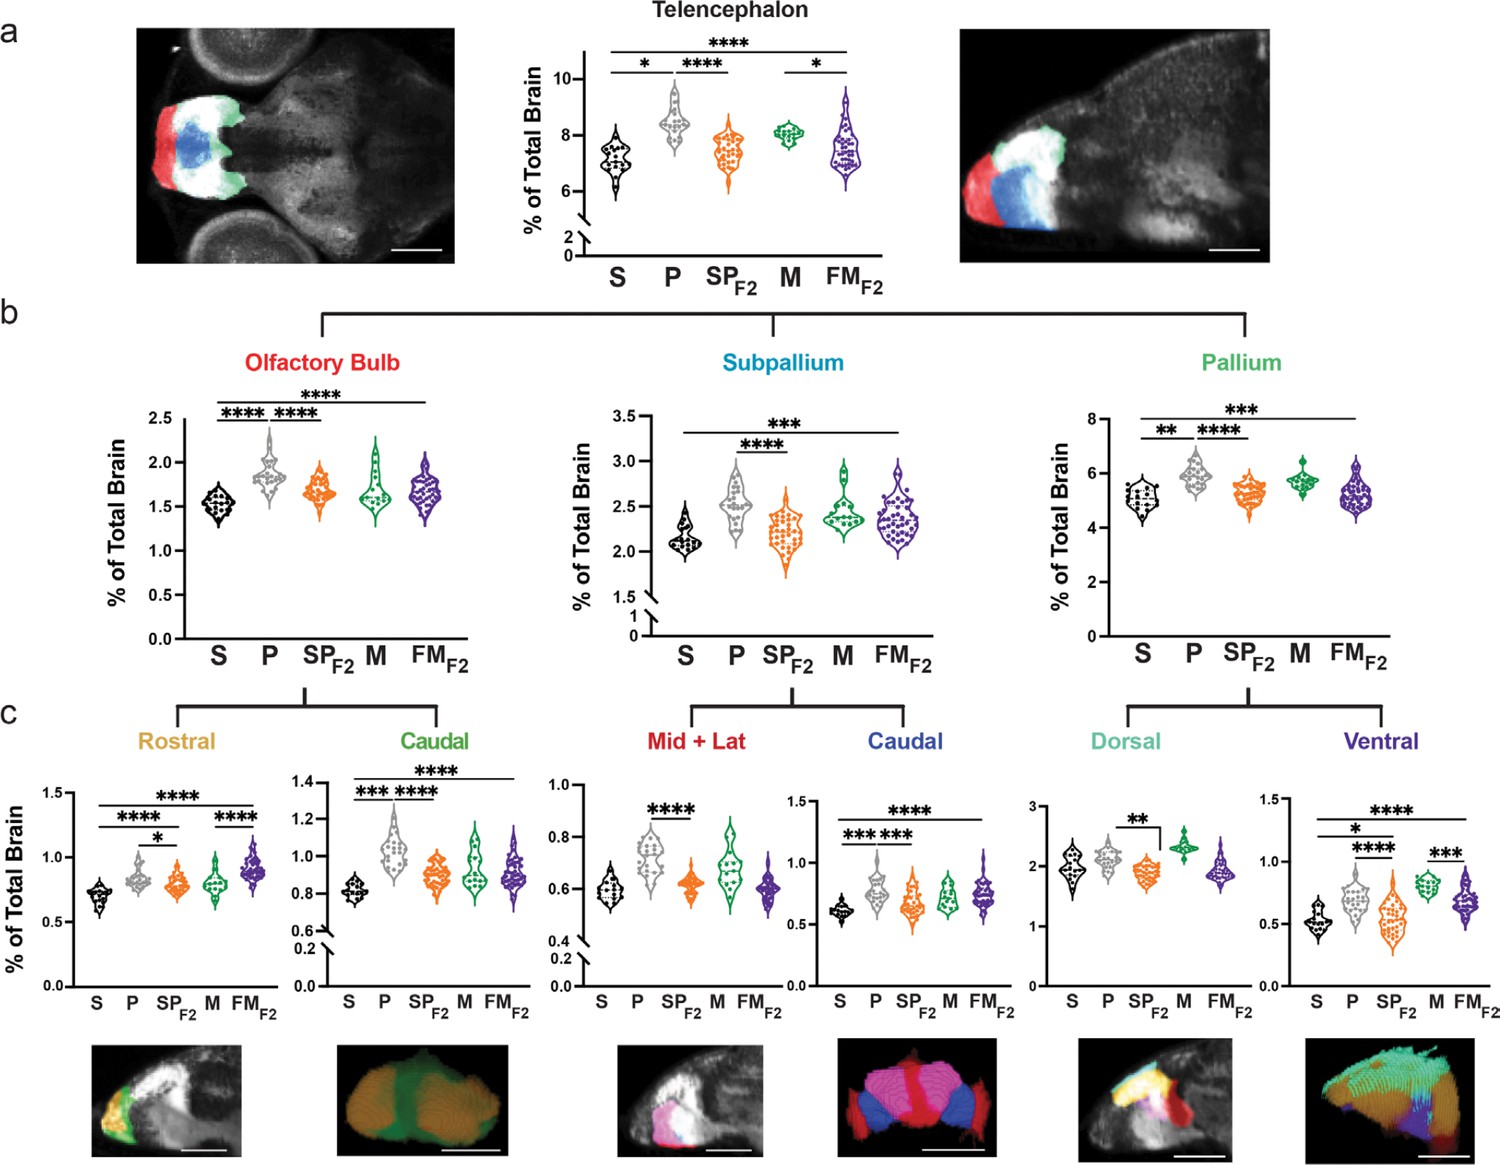
Hybrid brains link genetic variation in wildtype populations to anatomical variation in distinct sub-nuclei of the olfactory bulb, subpallium, and pallium.
(a) Volumetric comparison of the telencephalon in surface fish, Pachón cavefish, Molino cavefish, and surface × cave F2 hybrids. Percent total brain volume represents pixels of segment divided by total pixels in the brain. (b) Sagittal sections show subdivisions of the telencephalon, pallium (green), subpallium (light blue), and olfactory bulb (red). (c) Volumetric comparisons of discrete regions of the pallium, dorsal (sky blue) and ventral (purple), and olfactory bulb, rostral (gold) and caudal (green). All segments were statistically analyzed using a standard ANOVA and Holm’s corrected for multiple comparisons. p-Value significance is coded as: *=p < 0.05, **=p < 0.01, ***=p < 0.001, ****=p < 0.0001. Statistical tables can be found in the Dryad repository associated with this study (Portella et al., 2010). Scale bar = 80 µm (a), 50 µm (c).
Figure 4 with 1 supplement
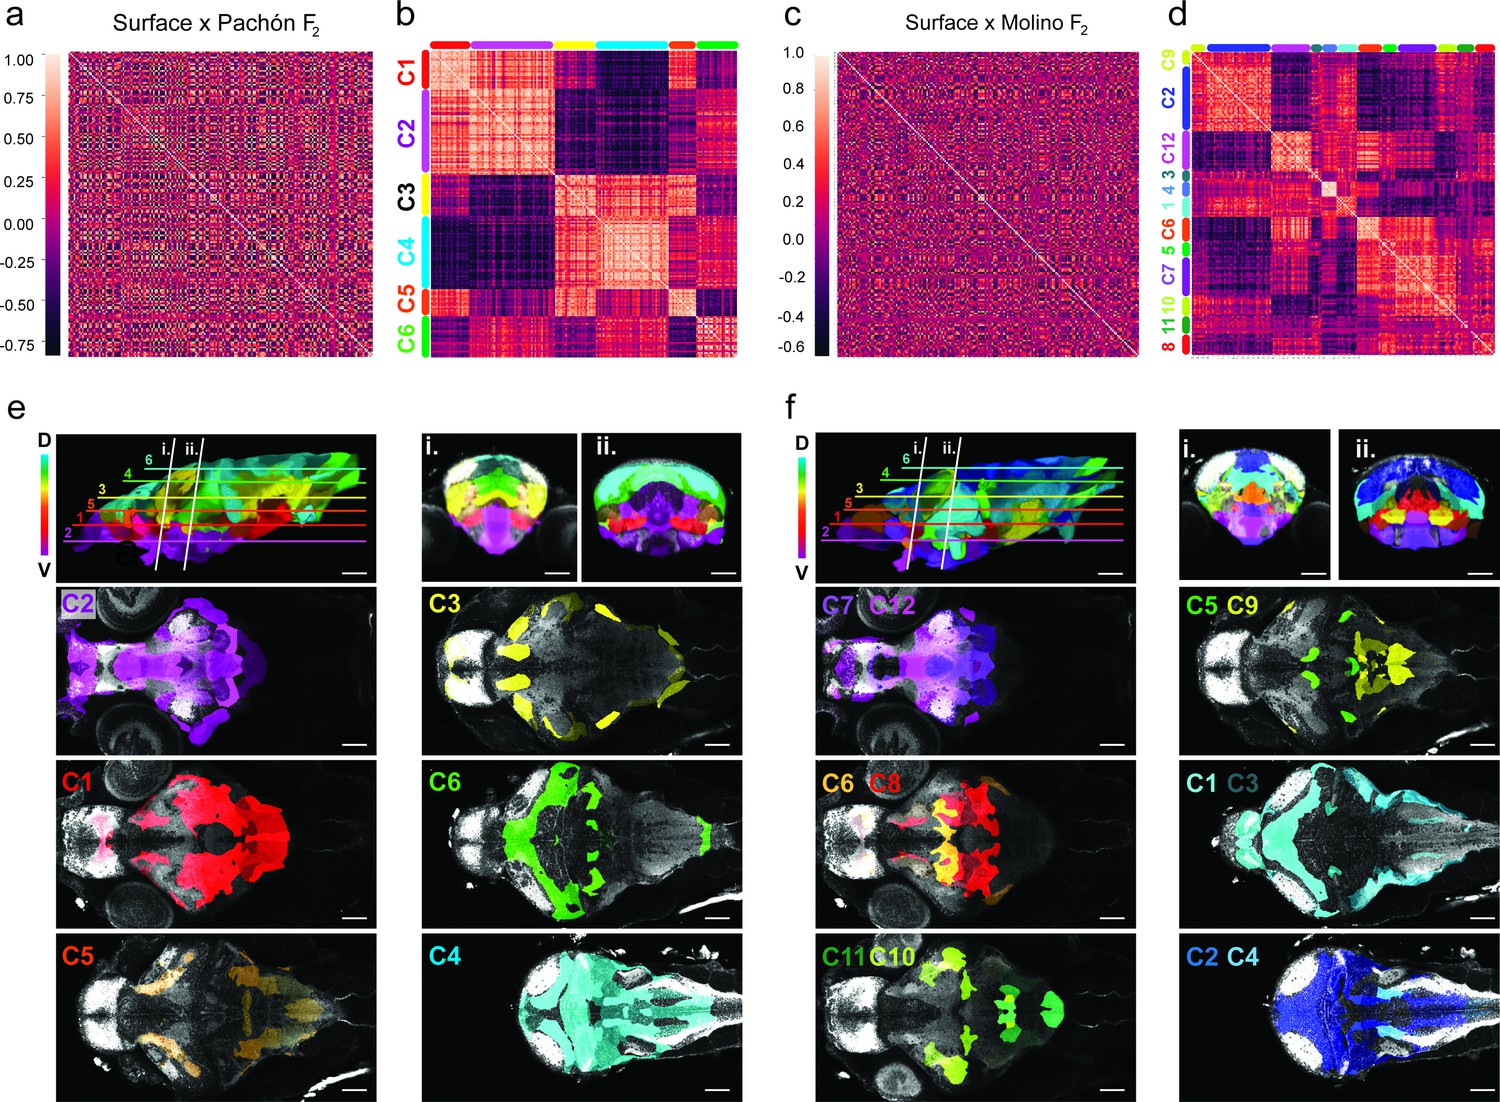
Volumetric covariation and clustering of hybrid brain regions reveals convergent associations across the dorsal-ventral axis.
(a) Cross-correlation analysis of surface to Pachón F2 hybrids for the 180 segmented Astyanax brain atlas. (b) Cluster analysis array showing six clusters exhibiting positive volumetric associations. Positive relationships are color-coded light red, negative dark red (n=37). (c) Cross-correlation analysis of surface to Molino F2 hybrids for the 180 segmented Astyanax brain atlas. (b) Cluster analysis array showing 12 clusters exhibiting positive volumetric associations a. Positive associations are color-coded light red, negative dark red (n=37). Clusters color-coded and mapped onto the surface × cave F2 hybrid reference brain for both (e) surface to Pachón F2 hybrids and (f) surface to Molino F2 hybrids. The rainbow gradient represents depth along the z-plane, blue shifted (dorsal) to red shifted (ventral). Statistical tables can be found in the Dryad repository associated with this study (Portella et al., 2010).
-
Figure 4—source data 1
Correlation coefficient matrix for 180-brain region atlas volumetric comparisons of surface × Pachón F2 hybrid larvae.
Pairwise correlation coefficients for pairwise comparisons between each brain region within the F2 population. Each individual coefficient represents the relationship between two individual brain regions within the F2 population.
- https://cdn.elifesciences.org/articles/80777/elife-80777-fig4-data1-v2.zip
-
Figure 4—source data 2
Correlation coefficient matrix for 180-brain region atlas volumetric covariation of surface × Molino F2 hybrid larvae.
Pairwise correlation coefficients for pairwise comparisons between each brain region within the F2 population. Each individual coefficient represents the relationship between two individual brain regions within the F2 population.
- https://cdn.elifesciences.org/articles/80777/elife-80777-fig4-data2-v2.zip
Figure 4—figure supplement 1

Covariation of brain region size reveals developmental tradeoff between dorsal-ventral clusters brain-wide in independently derived cavefish populations.
(a) Pairwise correlation and (b) clustering matrices comparing covariation for surface to Pachón F2 hybrids between 13 brain segments. (c) Illustrations depicting clustered segments: cluster 1 includes the subpallium (blue), hypothalamus (orange), posterior tuberculum (olive green), tegmentum (purple), and prepontine (light blue) cluster 2 includes the optic tectum (green), cerebellum (yellow), pons (light purple), reticulopontine (orchid purple), and medulla oblongata (light orange). (d) Pairwise correlation and (e) cluster matrices for surface to Molino F2 hybrids. (f) Illustration depicting surface to Molino hybrid clustered segments for clusters 1 and 3 correspond to regions found in surface to Pachón hybrid clusters 1 and 2, respectively. Note the statoacoustic ganglion (Sg) is not depicted in the illustrations of the midline sagittal section. Sample size, surface to Pachón F2 hybrids n=37 and surface to Molino F2 hybrids n=40. Statistical tables can be found in the Dryad repository associated with this study (Portella et al., 2010).
Figure 5 with 6 supplements
Shape covariation suggests volume and shape share brain-wide mechanism of brain evolution.
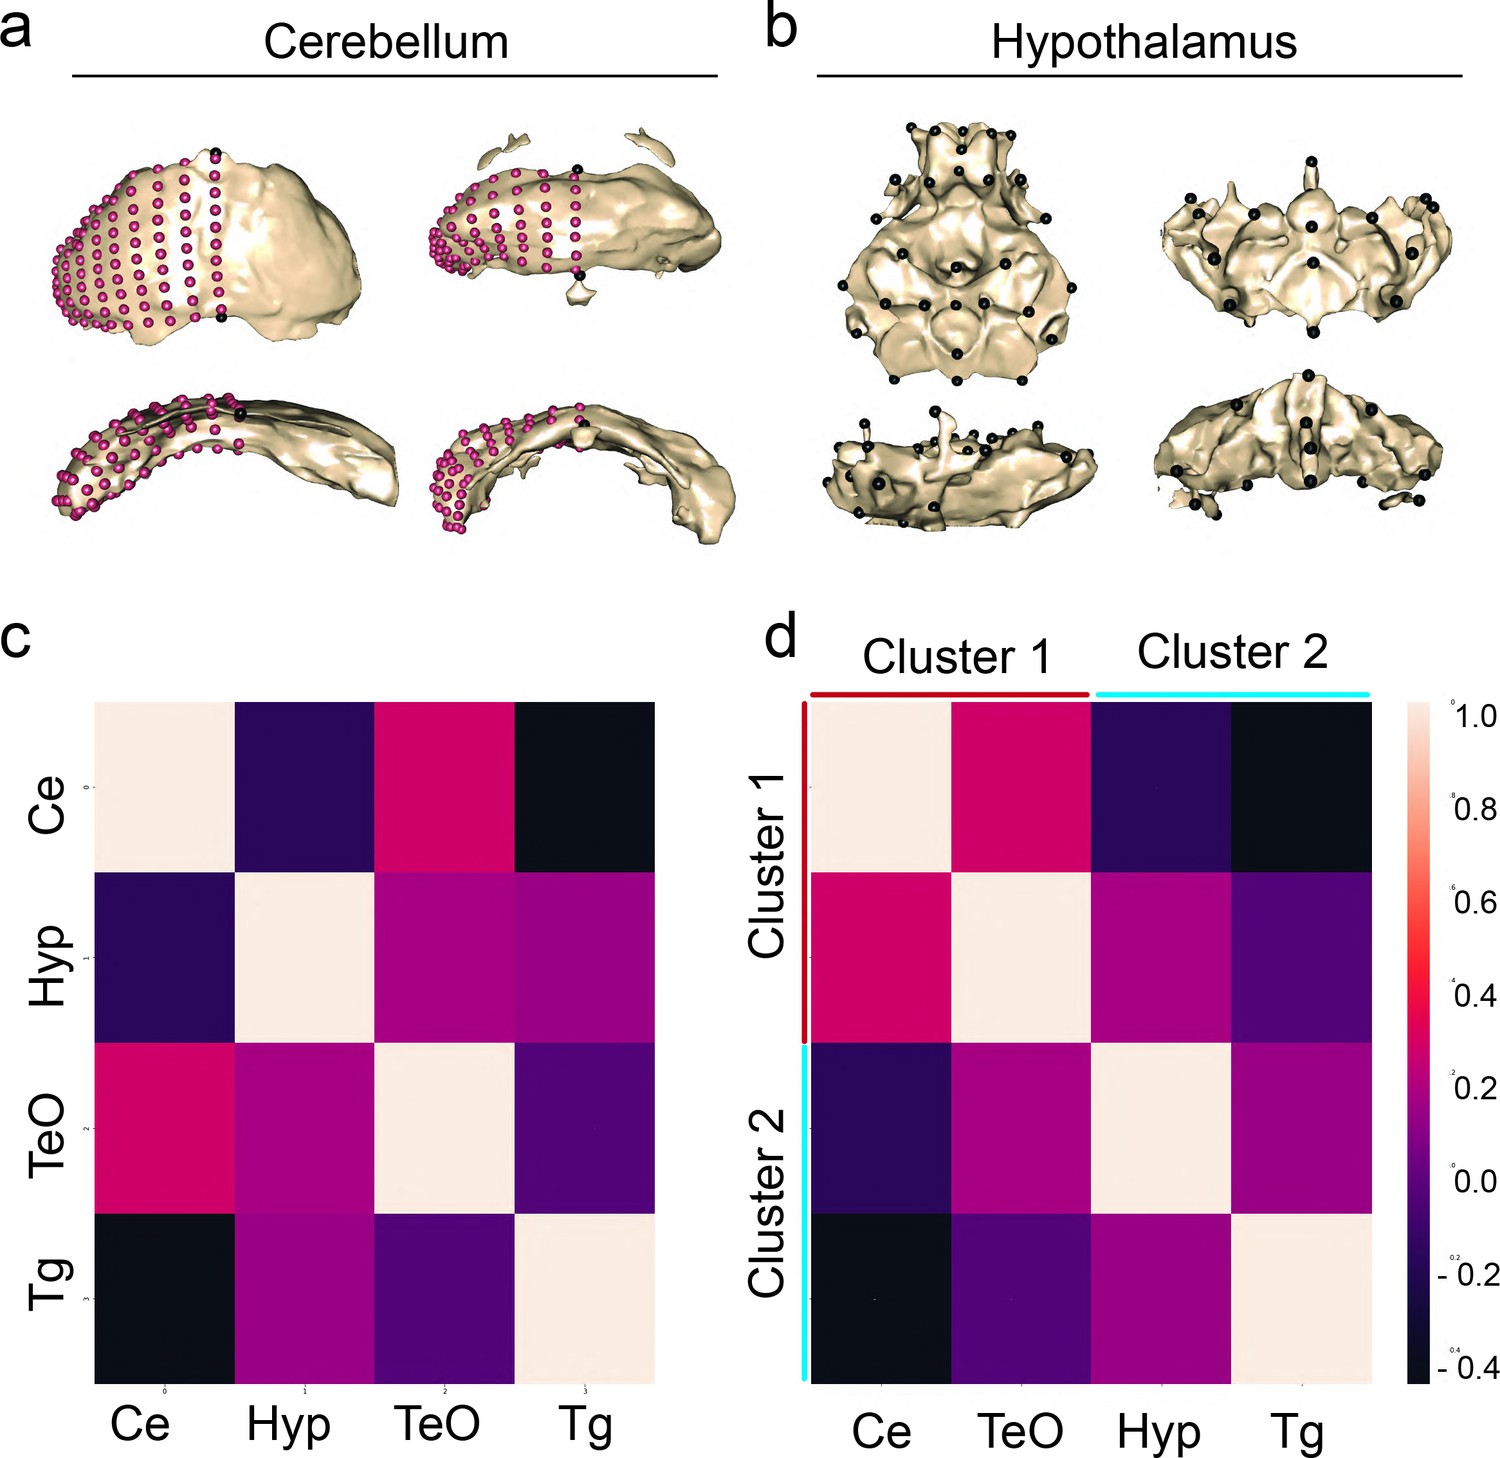
Representatives of shape for the cerebellum and hypothalamus of pure populations (a) principal component 1 (PC1) and (b) principal component 2 (PC2). (c) Correlation matrix comparing the covariation of shape between regions from volumetric covarying cluster 1, cerebellum (Ce) and optic tectum (TeO), and cluster 2, hypothalamus (Hyp) and tegmentum (Tg). Sample size, n=37. (d) A cluster analysis of covariation grouped regions into two clusters as predicted by volumetric covariation. Scale bars = 100 µm. Statistical tables can be found in the Dryad repository associated with this study (Portella et al., 2010).
-
Figure 5—source data 1
Correlation coefficient matrix for 13 brain region atlas shape covariation of surface × Pachón F2 hybrid larvae.
Each individual coefficient represents the relationship between two individual brain regions within the F2 population.
- https://cdn.elifesciences.org/articles/80777/elife-80777-fig5-data1-v2.zip
Figure 5—figure supplement 1
Shape variability of the preoptic region in hybrid larvae display an intermediate phenotype between wildtype populations.
(a) Principal component analysis (PCA) capturing 54% of the variation across surface, cave, and surface × cave F2 hybrids. PC1 describes preoptic width, while PC2 describes length. (b) Illustrations of the median shape for each population. Top row provides an anterior view, bottom row provides a side view. Statistical tables can be found in the Dryad repository associated with this study (Portella et al., 2010).
Figure 5—figure supplement 2
Pineal shape variation in hybrids exhibits a cavefish dominant phenotype.
(a) Principal component analysis (PCA) capturing 50% of the variation across surface, cave, and surface × cave F2 hybrids. PC1 describes pineal length, while PC2 describes pineal width across populations. (b) Illustrations of the median shape for each population. Statistical tables can be found in the Dryad repository associated with this study (Portella et al., 2010).
Figure 5—figure supplement 3
Optic tectum shape variation is characterized by width curvature and thickness.
(a) Principal component analysis (PCA) capturing 52% of the variation across surface × cave F2 hybrid optic tectums. PC1 describes optic tectum curvature and length (b), while PC2 describes optic tectum width (c) across surface × cave F2 hybrid. Statistical tables can be found in the Dryad repository associated with this study (Portella et al., 2010).
Figure 5—figure supplement 4
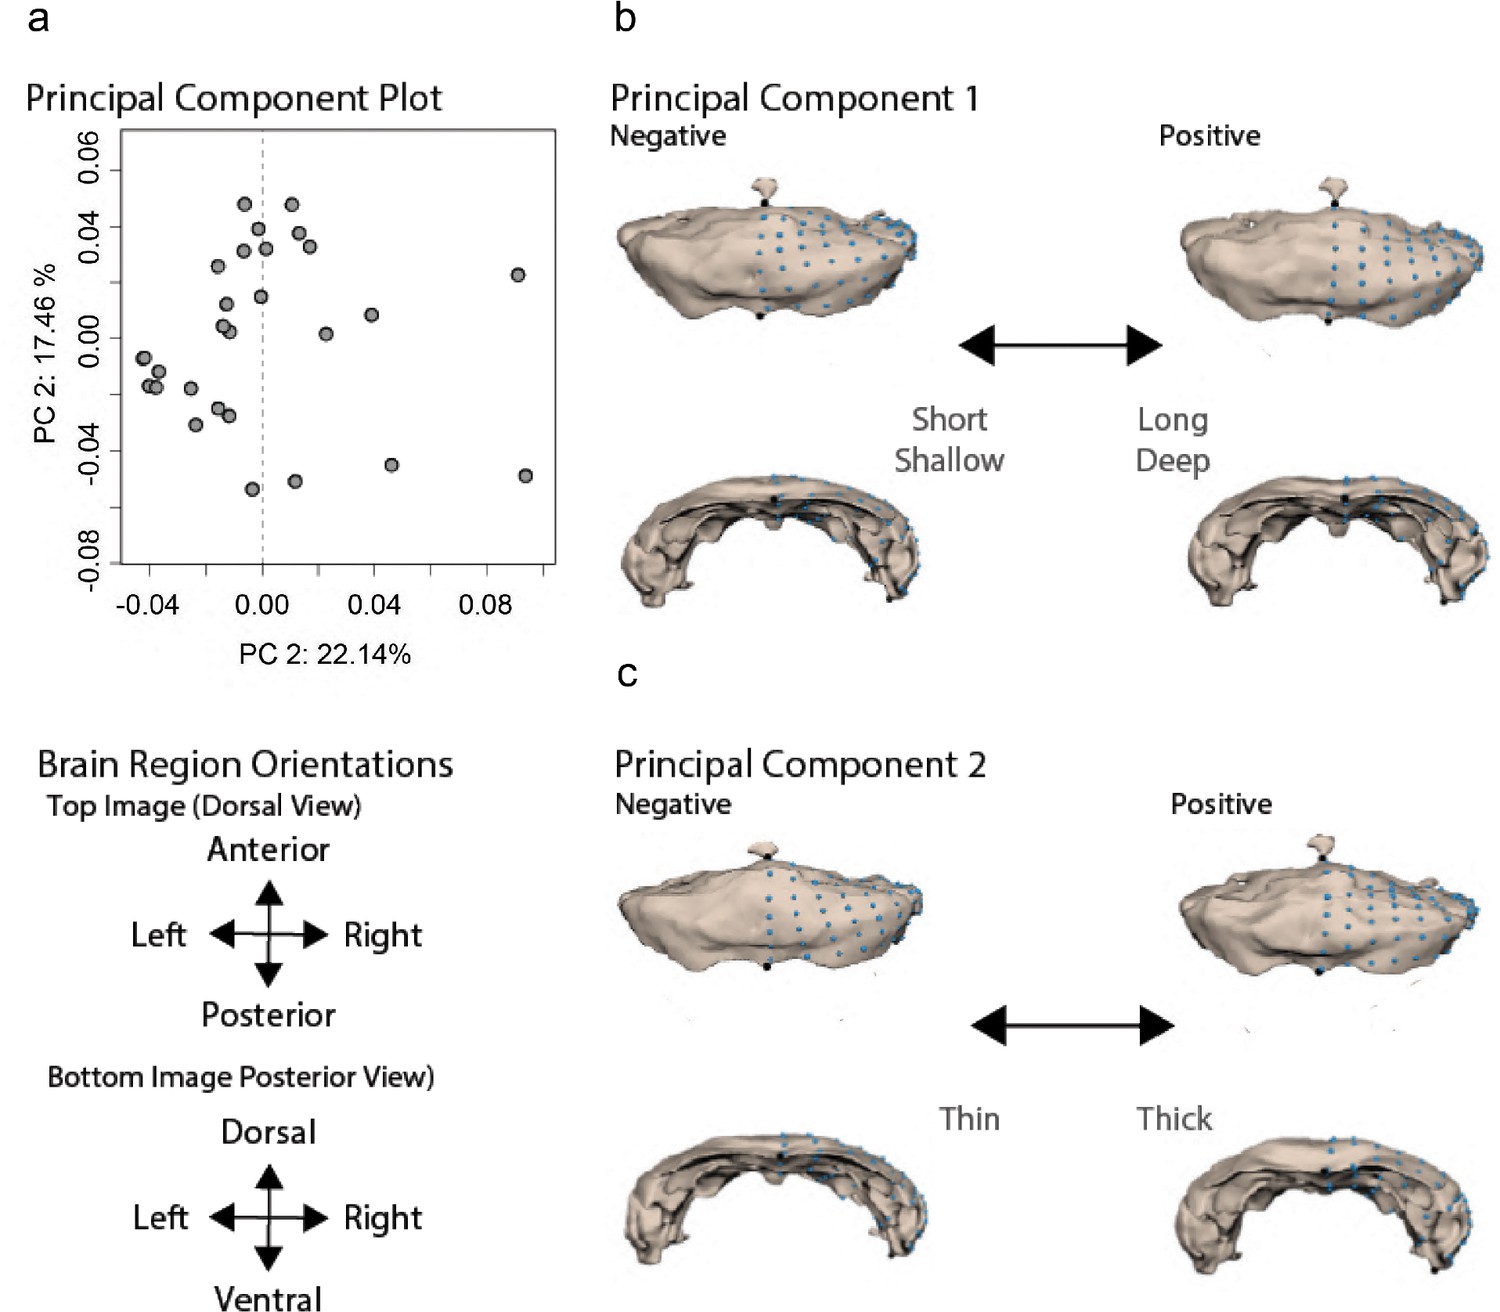
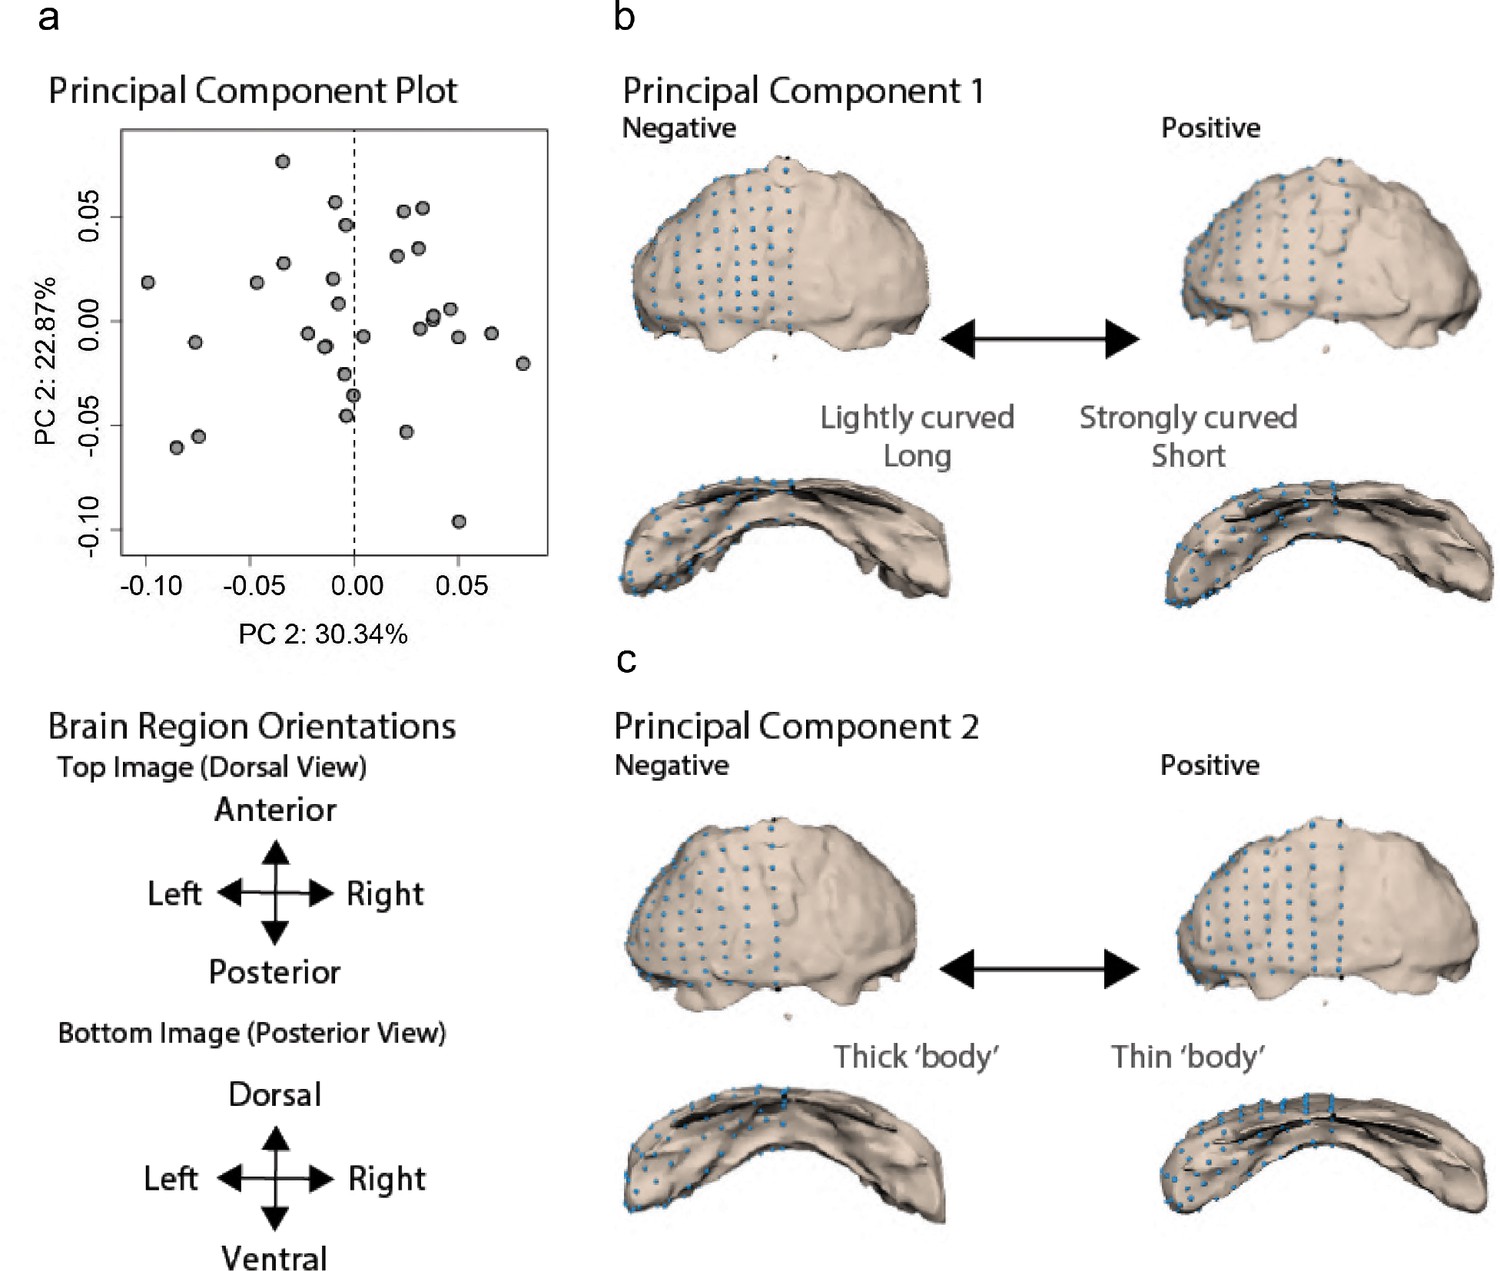
Cerebellar shape variation is characterized by depth of curvature and thickness.
(a) Principal component analysis (PCA) capturing 39% of the variation across surface × cave F2 hybrid cerebellums. PC1 describes cerebellar curvature and length (b), while PC2 describes cerebellar width (c) across surface × cave F2 hybrid. Statistical tables can be found in the Dryad repository associated with this study (Portella et al., 2010).
Figure 5—figure supplement 5

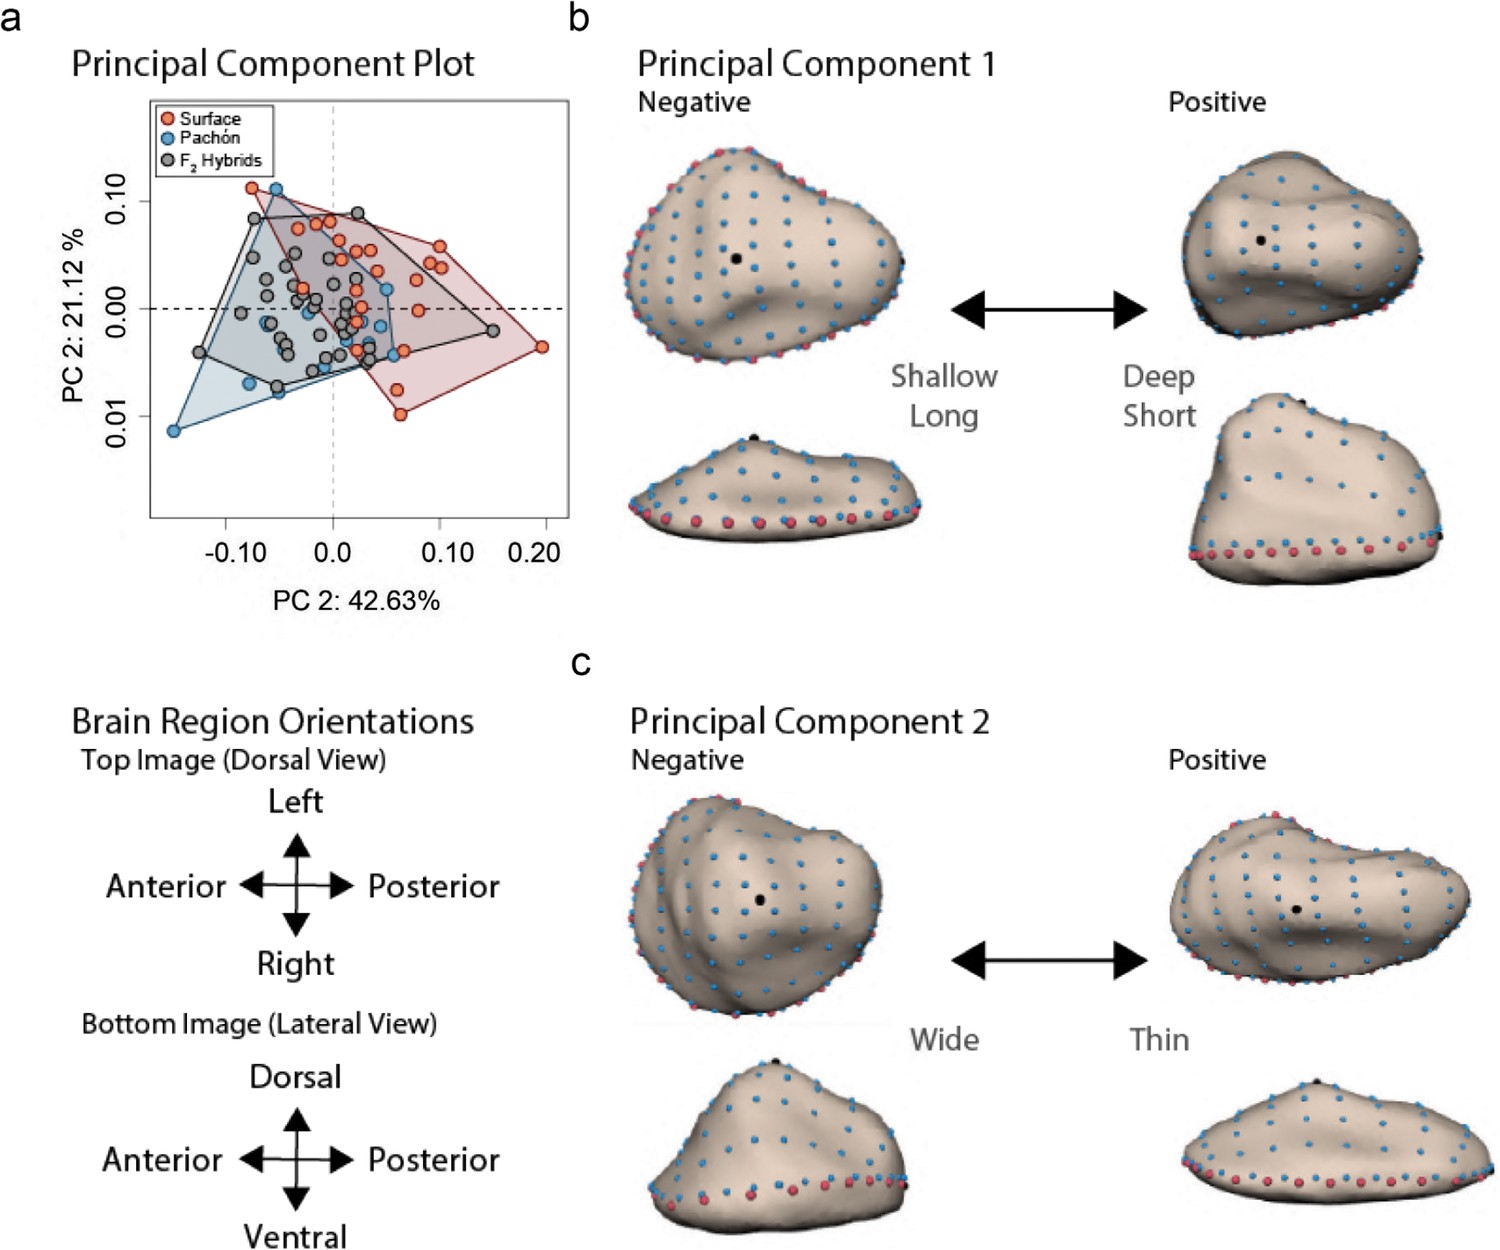
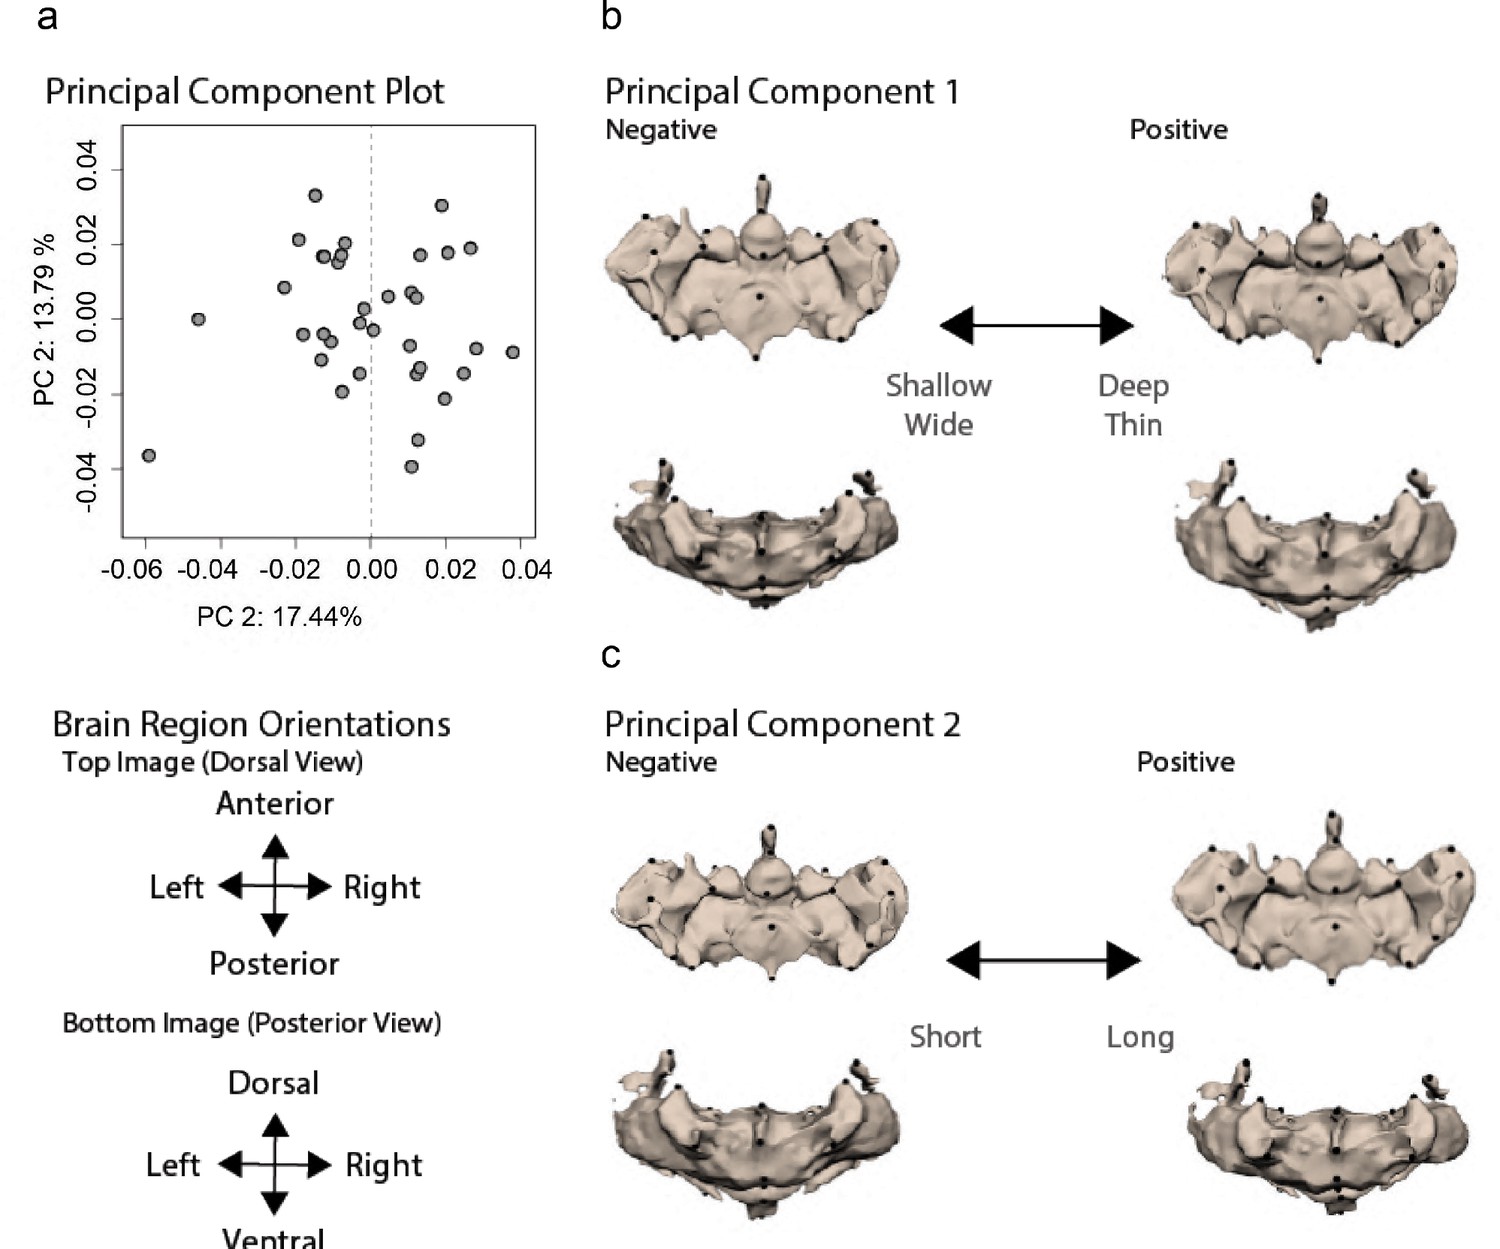
Hypothalamic shape variation is characterized by length, central thickness, and posterior width.
(a) Principal component analysis (PCA) capturing 39% of the variation across surface × cave F2 hybrid hypothalamus. PC1 describes hypothalamic length and center depth (b), while PC2 describes hypothalamic posterior width (c) across surface × cave F2 hybrids. Statistical tables can be found in the Dryad repository associated with this study (Portella et al., 2010).
Figure 5—figure supplement 6
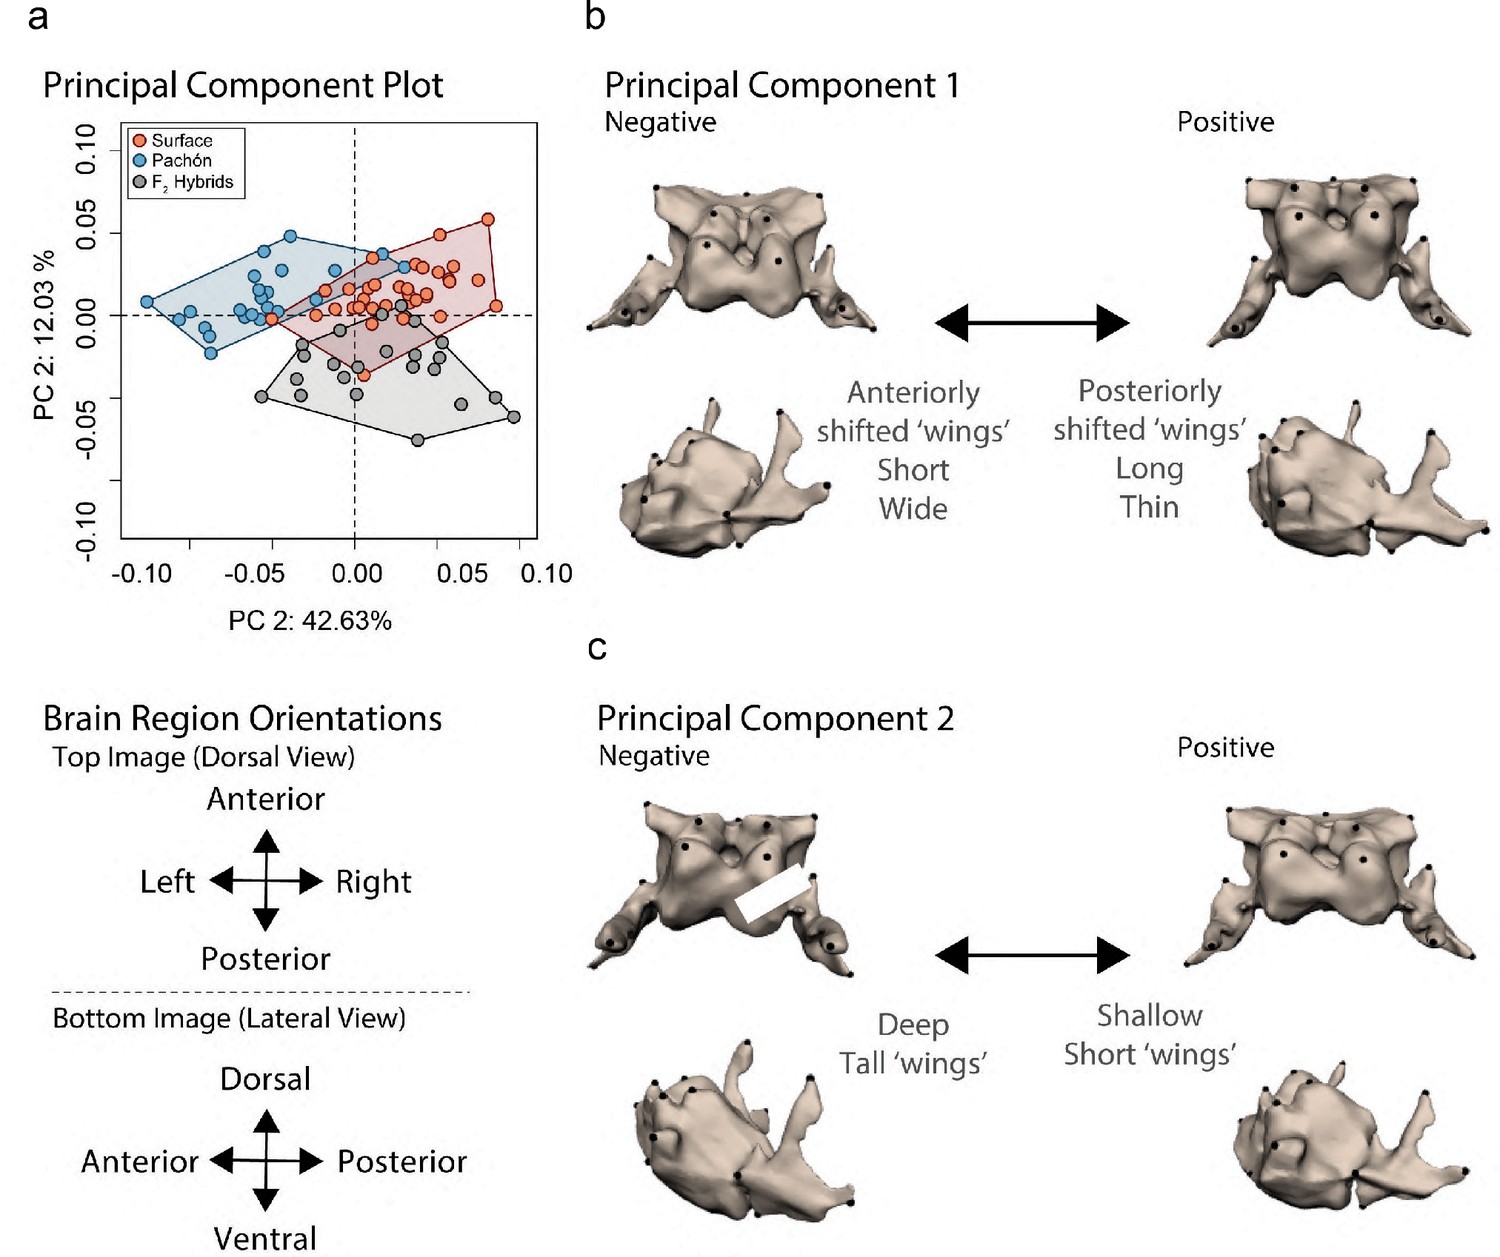
Tegmentum shape variation is characterized by depth and length.
(a) Principal component analysis (PCA) capturing 30% of the variation across surface × cave F2 hybrid tegmentums. PC1 describes tegmental length and center depth (b), while PC2 describes tegmental posterior width (c) across surface × cave F2 hybrids. Statistical tables can be found in the Dryad repository associated with this study (Portella et al., 2010).
Tables
Table 1
Hybridization chain reaction (HCR) in situ hybridization probes.
| Gene | A. mexicanuspopulation | Ensembl ID | Molecular Instruments Lot # |
|---|---|---|---|
| gbx1 | Surface | ENSAMXT00000037099.1 | PRO705 |
| gbx1 | Pachón | ENSAMXT00005023309.1 | PRO706 |
| otx2b | Surface | ENSAMXT00000055482.1 | PRQ451 |
| otx2b | Pachón | ENSAMXT00005060650.1 | PRQ452 |
| oxt | Surface | ENSAMXT00000041101.1 | PRQ449 |
| oxt | Pachón | ENSAMXT00005006990.1 | PRQ450 |
Additional files
-
MDAR checklist
- https://cdn.elifesciences.org/articles/80777/elife-80777-mdarchecklist1-v2.docx
-
Source code 1
README.md file that includes text describing the material in Source code 2, a repository of scripts used in this study.
- https://cdn.elifesciences.org/articles/80777/elife-80777-code1-v2.zip
-
Source code 2
Kozol et al. Code.zip file containing bash (.sh), fiji (.ijm), and matlab (.m) files used for this study.
- https://cdn.elifesciences.org/articles/80777/elife-80777-code2-v2.zip
Download links
A two-part list of links to download the article, or parts of the article, in various formats.
Downloads (link to download the article as PDF)
Open citations (links to open the citations from this article in various online reference manager services)
Cite this article (links to download the citations from this article in formats compatible with various reference manager tools)
A brain-wide analysis maps structural evolution to distinct anatomical module
eLife 12:e80777.
https://doi.org/10.7554/eLife.80777


