Bilateral JNK activation is a hallmark of interface surveillance and promotes elimination of aberrant cells
- Hilde-Mangold-Haus, University of Freiburg, Germany
- Spemann Graduate School of Biology and Medicine (SGBM), University of Freiburg, Germany
- Faculty of Biology, University of Freiburg, Germany
- International Max Planck Research School for Immunobiology, Epigenetics, and Metabolism, Germany
- CIBSS Centre for Integrative Biological Signalling Studies, University of Freiburg, Germany
- BIOSS Centre for Biological Signalling Studies, University of Freiburg, Germany
Figures
Figure 1 with 3 supplements
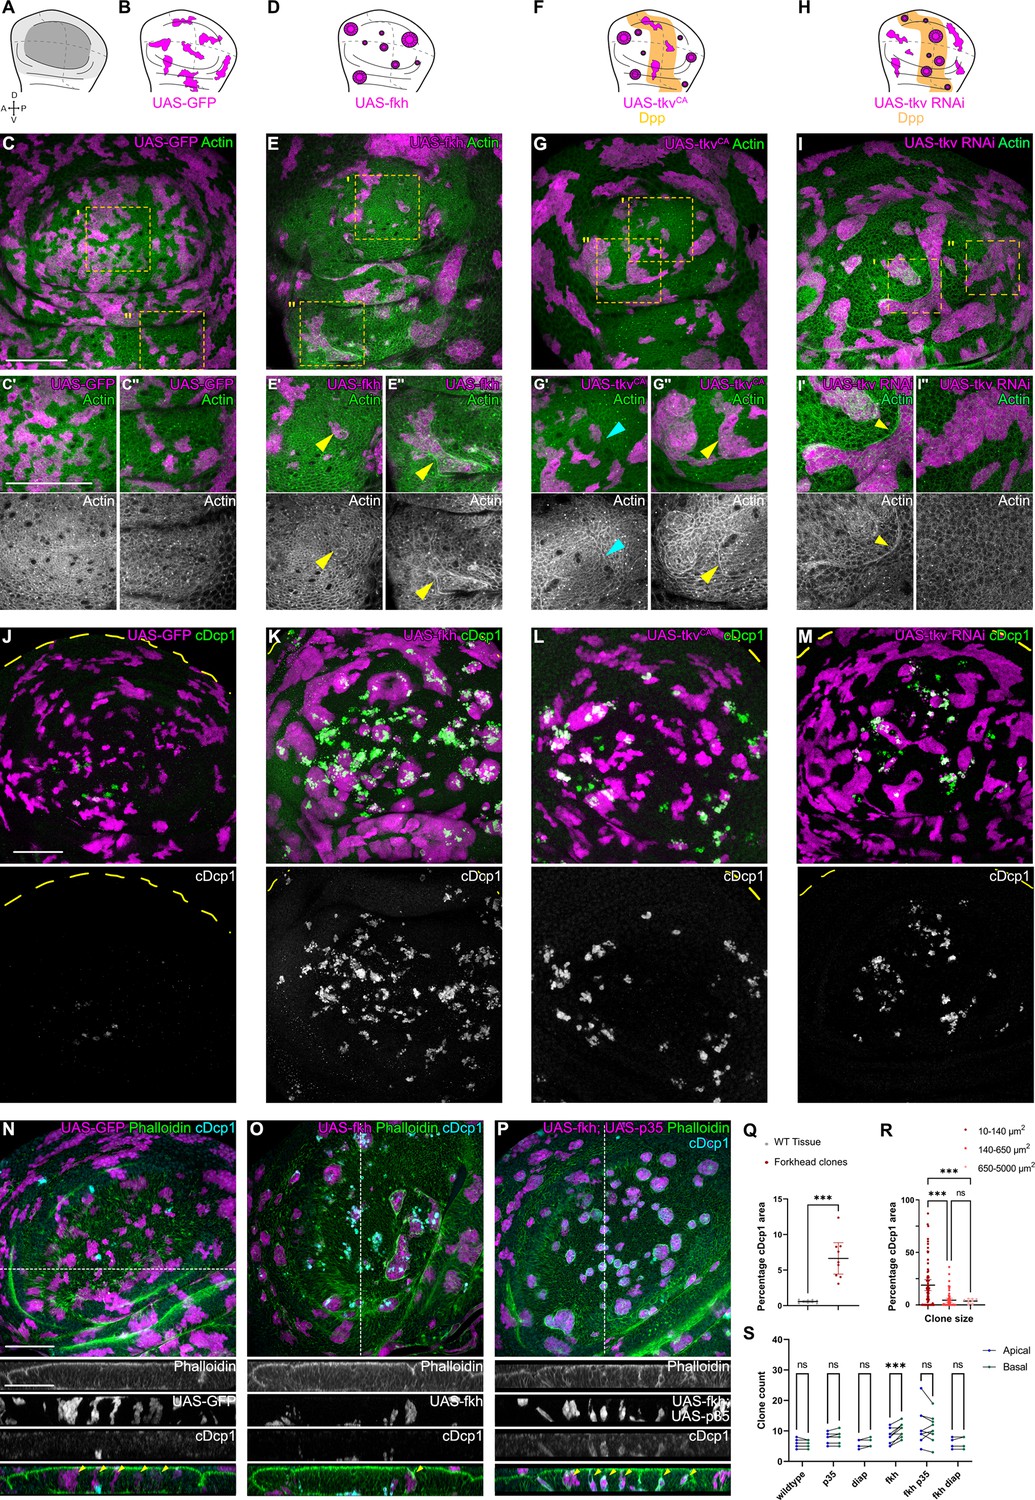
Apoptosis is essential to eliminate cells by interface surveillance.
(A) Wing disc illustration highlighting the pouch (dark gray), hinge (light gray), and notum (white), as well as characteristic folds (continuous lines) and dorso-ventral or anterior-posterior compartment boundaries (dashed lines) (A). (B, D, F, and H) Wing discs schemes illustrating patterns of Dpp-signaling (F and H) (orange represents endogenous expression or activity, white represents lack thereof). Clones (magenta) that only express GFP (B) or whose fate is like that of surrounding cells (magenta clones in orange domains in F, or in white domain in H) do not induce interface surveillance and maintain irregular clone shapes. Clones whose fate is different to that of surrounding cells because of altered cell fate and differentiation programs (magenta clones in white domains in D, F and in orange domains in H) activate interface surveillance and thus experience interface smoothening. In extreme cases clones form cysts, as the apical surface buckles from interface contractility-induced compression. Clones express GFP (B), fkh (D), tkvCA, (F) or tkv-RNAi (H). (C, E, G, and I) Wing disc carrying mosaic clones (magenta) expressing GFP (C), fkh (E), tkvCA (G), or tkv-RNAi (I) stained with phalloidin to visualize Actin (green or gray). Yellow frames mark regions in pouch center (C’, E’, G’, and I’), pouch periphery (G’’ and I’’), and hinge (C’’ and E’’). Note that these frames distinguish domains of high and low endogenous Dpp-activity in F and H, respectively. Cyan arrows point to accumulation of actin normally observed in all third instar wing discs at the A-P compartment boundary (G’). Yellow arrows point to apical enrichment of actin at clone boundaries. (E’) focusses on the apical region of a clone that has undergone buckling. (J–M) Maximum-intensity projections of basal sections of wing discs carrying mosaic clones (magenta) expressing GFP (J), fkh (K), tkvCA (L), and tkv-RNAi (M), stained for cleaved Dcp1 (cDcp1) to visualize apoptosis (green or gray). Please refer to (F and H) for endogenous activation patterns of Dpp signaling in wing discs. (N–P) Maximum-intensity projections of basal sections of wing discs carrying mosaic clones (magenta or gray) expressing GFP (N), fkh (O), or fkh,p35 (P), stained with phalloidin to visualize Actin (green or gray) or stained for cleaved Dcp1 (cDcp1) to visualize apoptosis (cyan or gray). Dashed white lines indicate position of cross-sections shown below. Yellow arrowheads in the cross-section overlays indicate viable clones still integrated in the epithelium. (Q) Quantification of the relative percentage of apoptotic area in fkh-expressing clones, as compared to surrounding wild type tissue. Graph displays mean ± 95% CI. n=9 wing discs each. See Figure 1—source data 1. (R) Quantification of the relative percentage of apoptotic area after binning into different clone sizes. Dark red (small clones, 10–140 µm2, approximately containing 1–6 cells), red (medium clones, 140–650 µm2, approximately containing 7–35 cells), and pink (large clones, 650–5000 µm2, approximately containing above 35 cells) in discs with fkh-expressing clones. n=140 clones from n=6 wing discs. See Figure 1—source data 2. (S) Quantification of the number of clones detected apically (blue) or basally (green) in the wing disc pouch, where clones express either GFP; p35; Diap1; fkh; fkh, p35, or fkh, Diap1. The numbers of wing discs analyzed per genotype include GFP (9); p35 (9); Diap1(5), fkh (9); fkh, p35 (9); and fkh, Diap1 (4). See Figure 1—source data 3. (Q, R, and S) Paired Student’s t-tests (Q) and one-way ANOVA tests (R and S) were performed to test for statistical significance, ns = not significant, ***p≤0.001. Scale bars = 50 µm.
-
Figure 1—source data 1
for Figure 1Q.
- https://cdn.elifesciences.org/articles/80809/elife-80809-fig1-data1-v3.xlsx
-
Figure 1—source data 2
for Figure 1R.
- https://cdn.elifesciences.org/articles/80809/elife-80809-fig1-data2-v3.xlsx
-
Figure 1—source data 3
for Figure 1S.
- https://cdn.elifesciences.org/articles/80809/elife-80809-fig1-data3-v3.xlsx
Figure 1—figure supplement 1
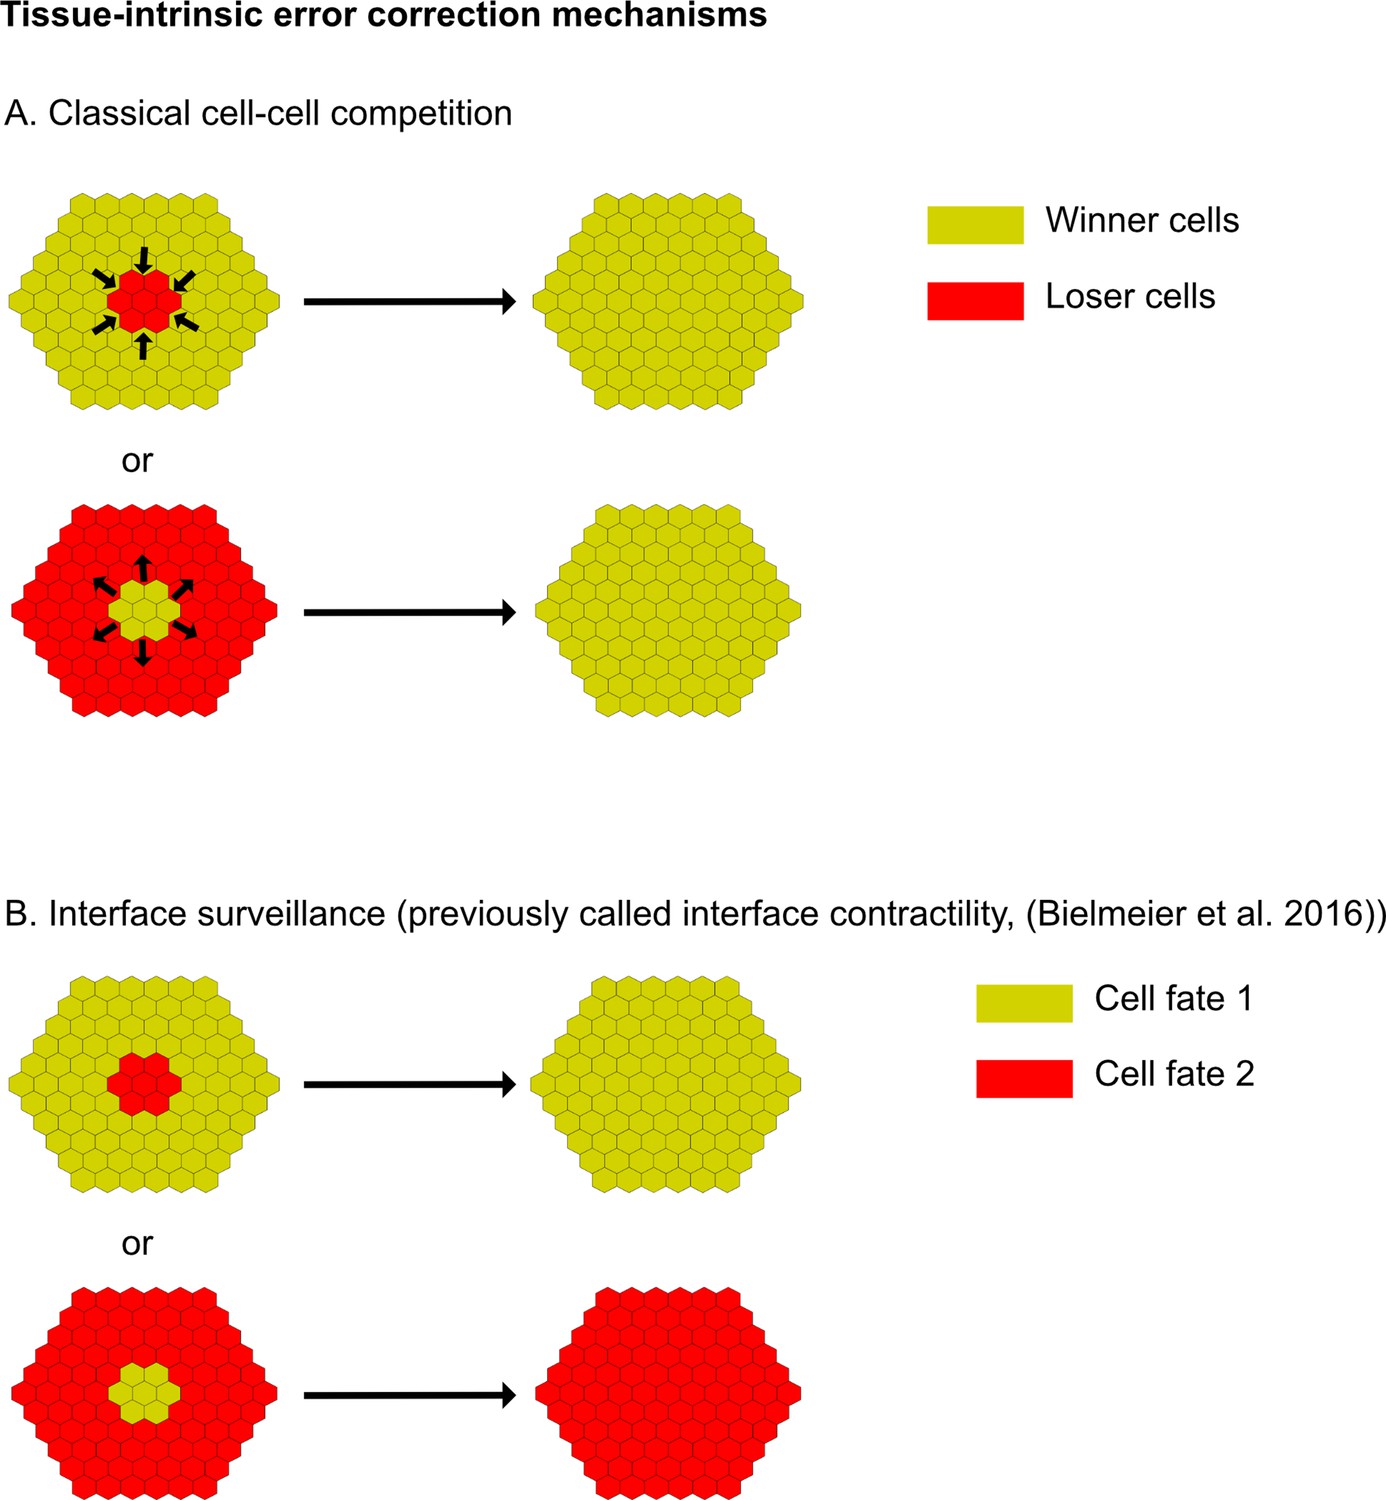
Apoptosis is essential to eliminate cells by interface surveillance.
(A and B) Schemes illustrating the key difference between the outcomes of two different tissue-intrinsic error correction mechanisms, namely classical cell-cell competition (A) and interface surveillance (B). Please note that in classical cell-cell competition, cell elimination is always linked to genotype, but in interface surveillance, cell elimination is linked to topology.
Figure 1—figure supplement 2
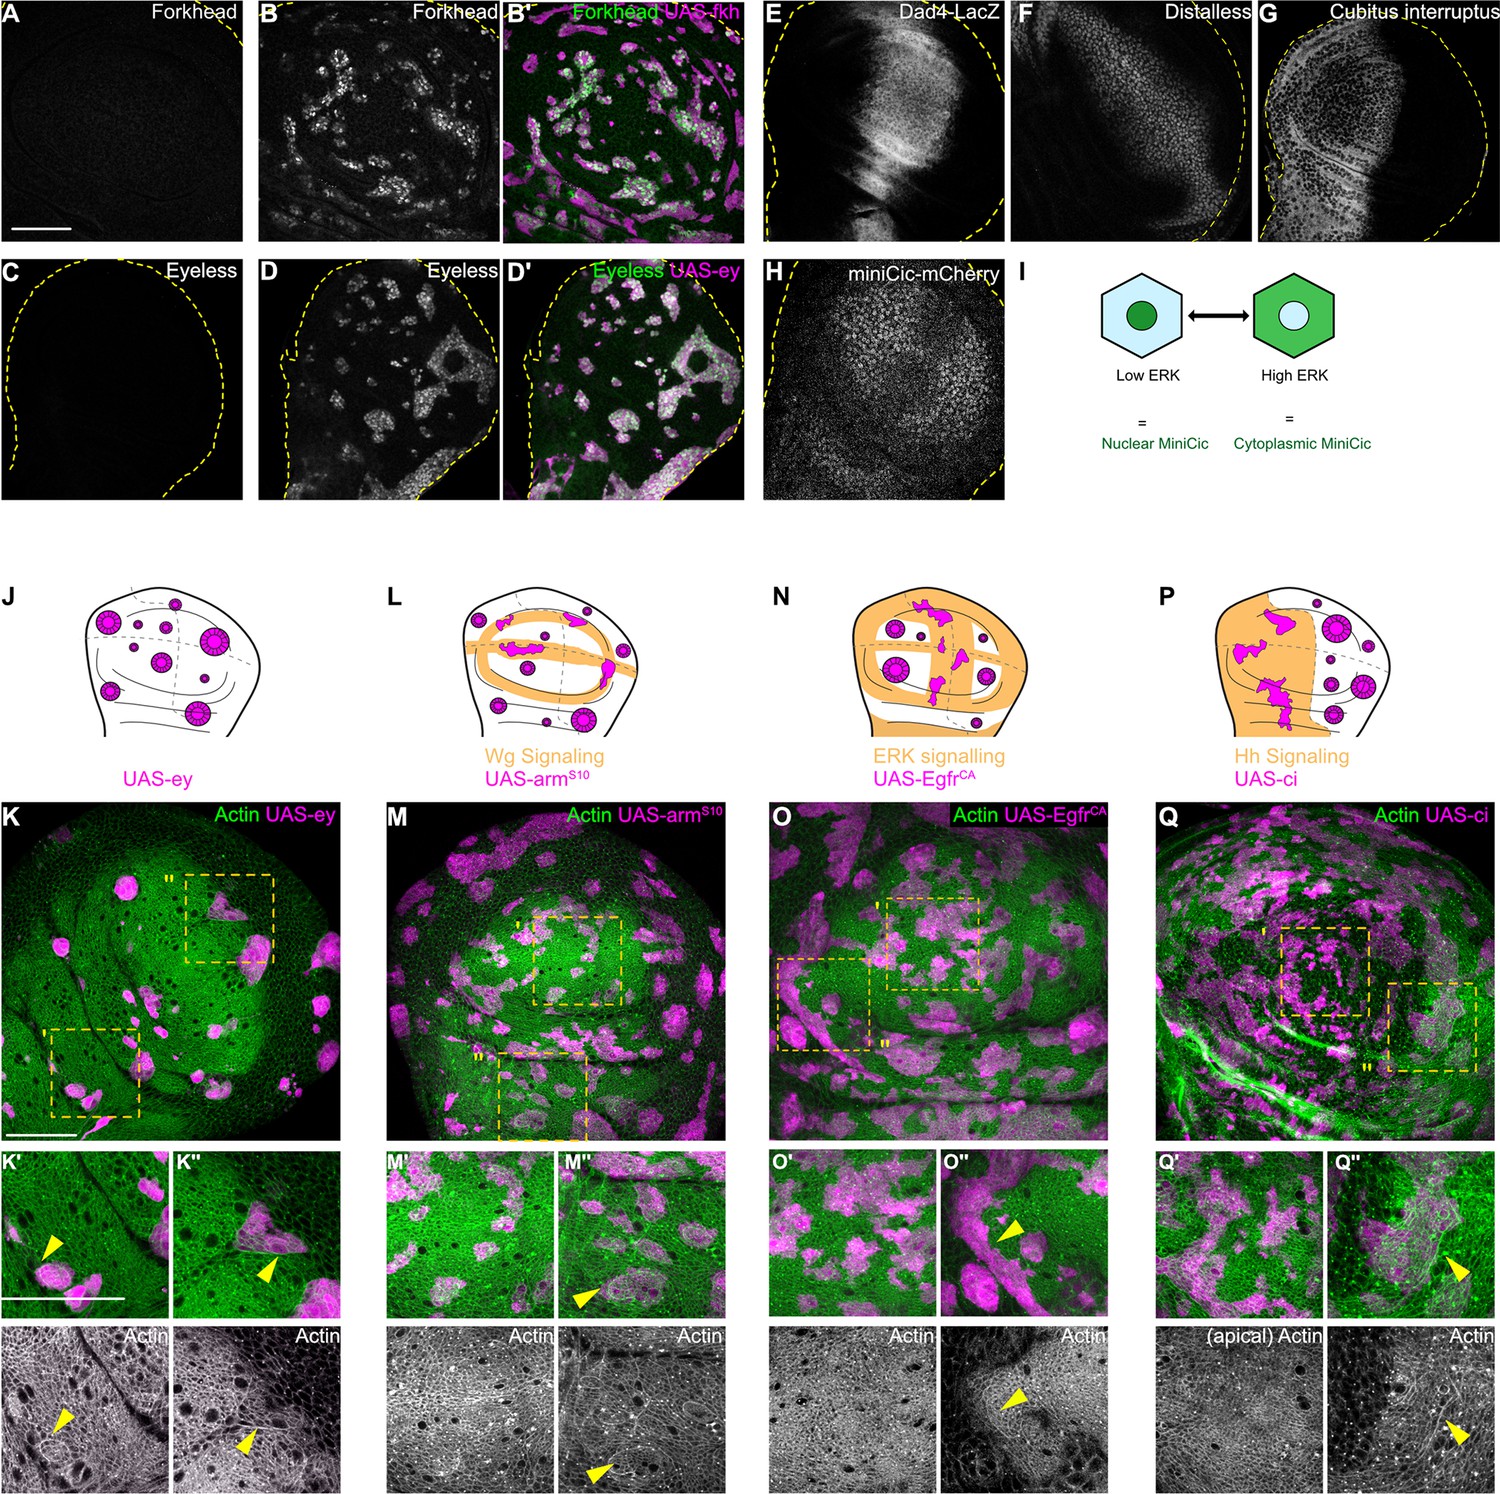
Apoptosis is essential to eliminate cells by interface surveillance.
(A, C, E, F, G, and H) Wing discs stained to visualize endogenous patterns of Forkhead (Fkh) (A) and Eyeless (Ey) expression (C), Dpp-signaling (Dad4-LacZ, a Dpp target gene) (E), Wg-signaling (Distalless, the Wg target gene) (F) and Hedgehog (Hh)-signaling (Cubitus interruptus, the main Hh-effector) (G), or ERK signaling (tub-miniCic-mCherry, an ERK-activity reporter) (H). Yellow dashed lines represent wing disc outlines. (B and D) Wing discs carrying mosaic clones (magenta) expressing fkh (A) or ey (B) were stained for Fkh (A) and Ey (B) proteins, respectively, to validate anti-Fkh and anti-Ey antibodies used in (A and C). Dashed yellow lines demarcate wing disc boundaries. (I) Scheme illustrating how the ERK-activity reporter mini-Cic works. Nuclear localization of the miniCic reporter indicates low-ERK signaling, and cytoplasmic localization indicates high-ERK signaling. (J, L, N, and P) Wing discs schemes illustrating endogenous patterns (orange) of Ey expression (J), Wg-signaling (L), ERK-signaling (N), or Hh-signaling (P). Clones that express GFP or whose fate is like that of surrounding cells (magenta clones in orange domains in L, N, and P) do not induce interface surveillance and maintain irregular clone shapes. Clones whose fate is different to that of surrounding cells because of altered cell fate and differentiation programs (magenta clones in white domains in J, L, N, and P) activate interface surveillance and thus experience interface smoothening. In extreme cases clones form cysts, as the apical surface buckles from interface contractility-induced compression. Clones express ey (J), armS10 (L), EgfrCA (N), or Ci (P), activating Ey-, Wg-, ERK-, or Hh-dependent cell fate programs, respectively. (K, M, O, and Q) Wing disc carrying mosaic clones (magenta) that express ey (K), armS10 (M), Ci (O), or EgfrCA (Q) were stained with phalloidin to visualize Actin (gray or green). Yellow frames mark regions in pouch center (K’, M’, O’, and Q’ panels), pouch periphery (Q”), hinge (K” and M”), anterior compartment (O’), and posterior compartment (O’’). Please compare position of ‘ and ‘’ panels to domains of endogenous signaling activity illustrated in (J, L, N, and P). Note that images in O’ are from a section more apical to the one shown in O. This was done in order to properly view the apical phalloidin network in the anterior compartment. Scale bar = 50 µm.
Figure 1—figure supplement 3
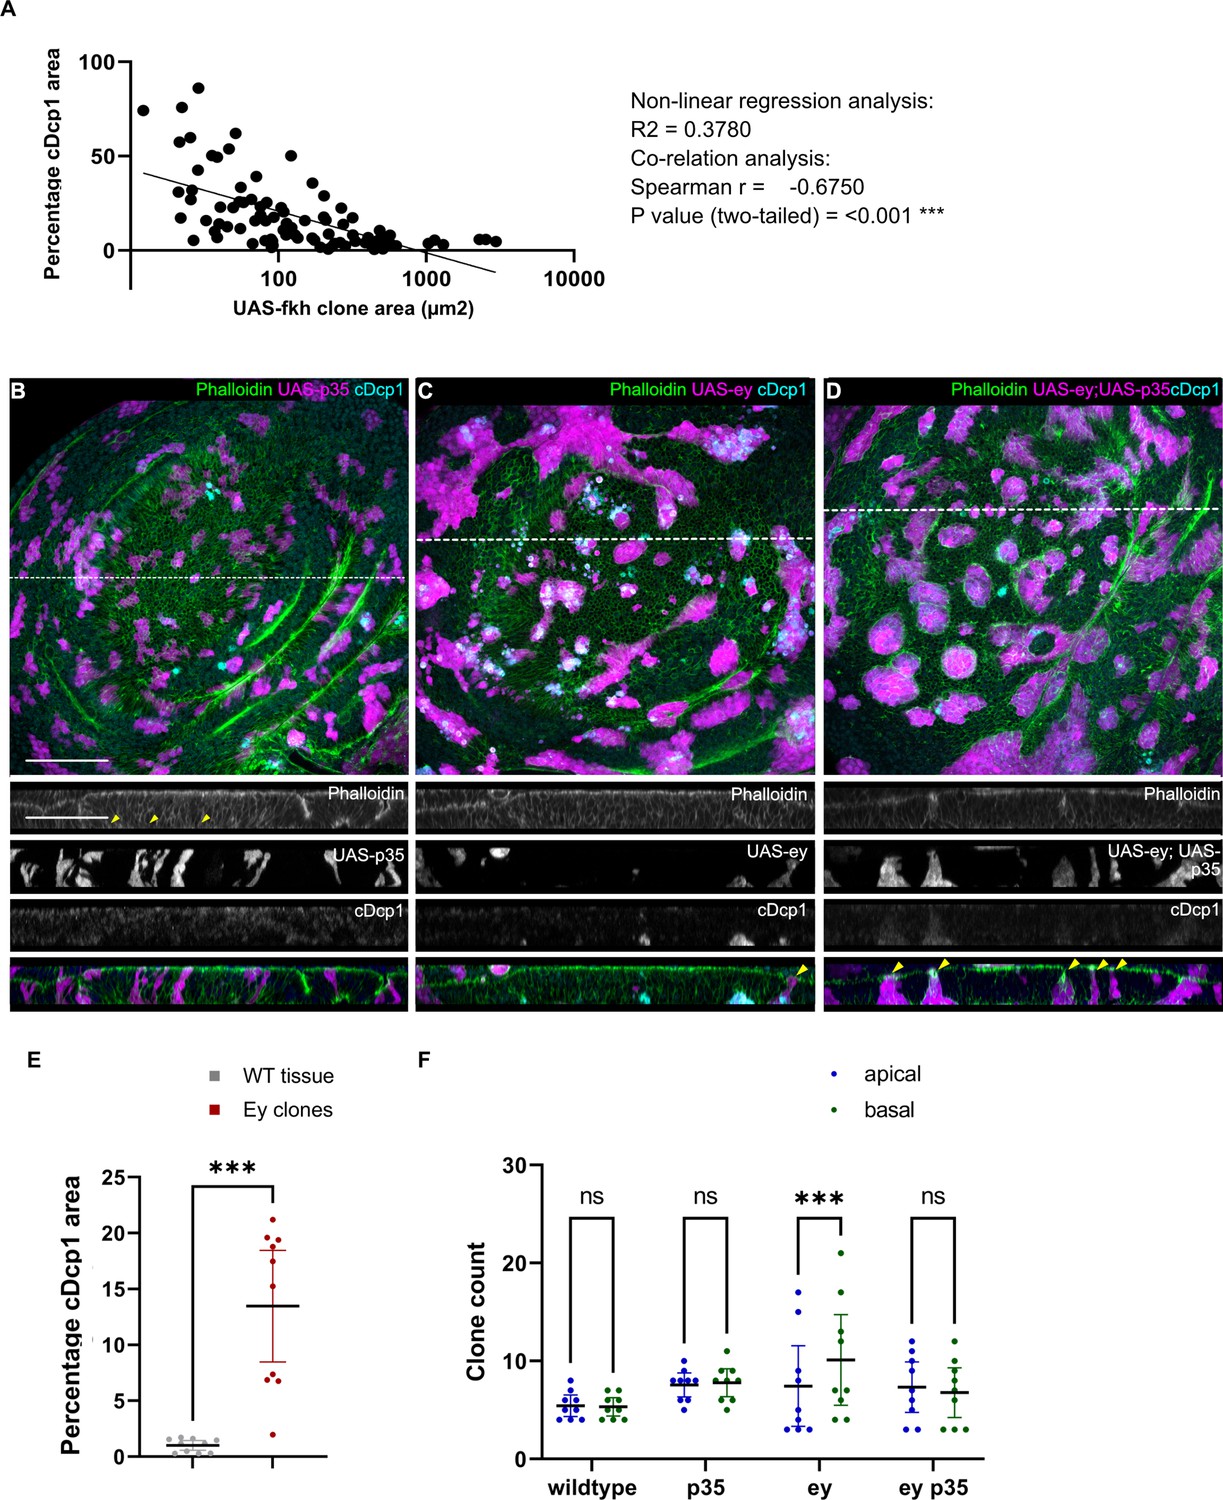
Apoptosis is essential to eliminate cells by interface surveillance.
(A) Distribution of the relative percentage of apoptotic area in individual fkh-expressing clones plotted against clone size. A non-linear regression analysis and a correlation analysis using Spearman coefficient were performed. n=6 wing discs. See Figure 1—figure supplement 3—source data 1. (B, C, and D) Maximum-intensity projections of basal sections of wing discs carrying clones (magenta) expressing p35 (B), ey (C), or ey,p35 (D) were stained with phalloidin to visualize Actin (gray or green) and for cleaved Dcp1 (cDcp1) to visualize apoptosis (gray or cyan). Dashed white lines indicate position of cross-sections shown in panels below. Yellow arrowheads in the cross-section overlays indicate viable clones still integrated in the epithelium. (E) Quantification of the relative percentage of apoptotic area in ey-expressing clones, as compared to the surrounding wild type tissue. A paired Student’s t-tests was performed to test for statistical significance. Graph displays mean ± 95% CI. *** p≤0.001. n=9 wing discs. See Figure 1—figure supplement 3—source data 2. (F) Quantification of the number of clones detected apically (blue) or basally (green) in the wing disc pouch, where clones either express GFP; p35; ey or ey,p35. A one-way ANOVA test was performed to test for statistical significance. ns = not significant, *** p≤0.001. n=9 wing discs per genotype. See Figure 1—figure supplement 3—source data 3. Scale bar = 50 µm.
-
Figure 1—figure supplement 3—source data 1
- https://cdn.elifesciences.org/articles/80809/elife-80809-fig1-figsupp3-data1-v3.xlsx
-
Figure 1—figure supplement 3—source data 2
- https://cdn.elifesciences.org/articles/80809/elife-80809-fig1-figsupp3-data2-v3.xlsx
-
Figure 1—figure supplement 3—source data 3
- https://cdn.elifesciences.org/articles/80809/elife-80809-fig1-figsupp3-data3-v3.xlsx
Figure 2 with 2 supplements
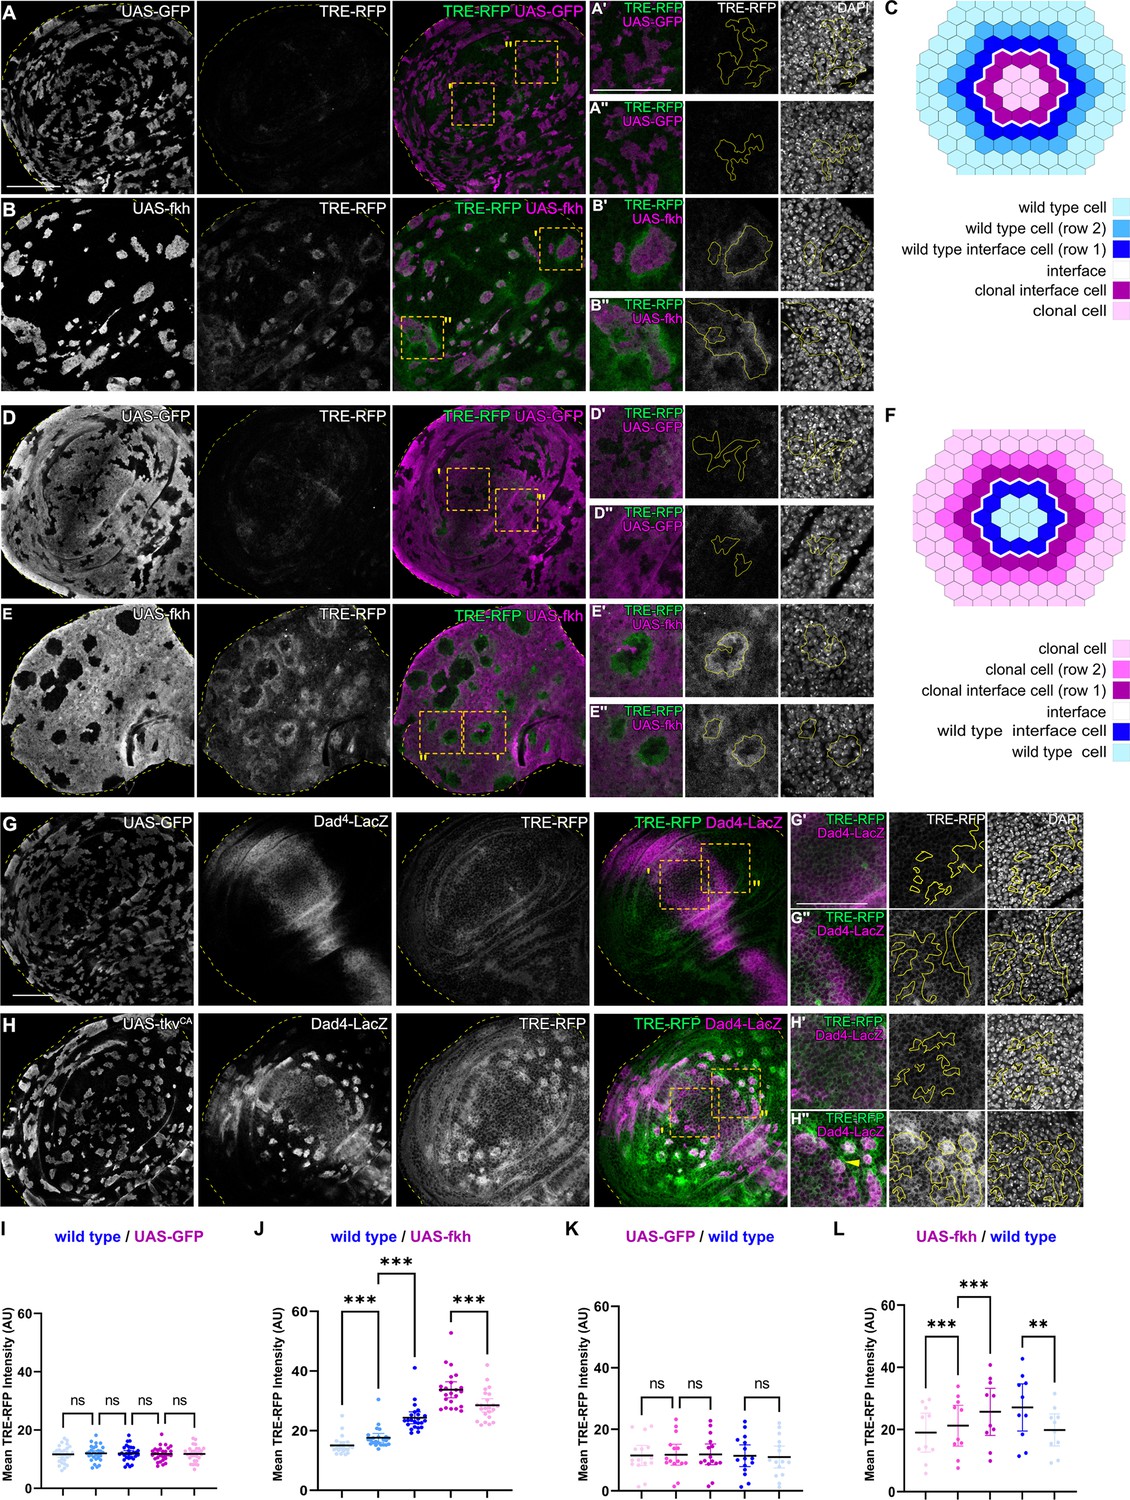
Interface surveillance activates bilateral JNK interface signaling.
(A, B, D, and E) Wing discs carrying mosaic clones (magenta or gray) expressing GFP (A and B) or fkh (D and E), as well as the JNK reporter TRE-RFP (green or gray). Discs were stained with DAPI to visualize nuclei (gray). Dotted yellow lines mark wing disc boundaries. Yellow frames mark regions shown in (A’, A’’, B’, B’’, D’, D’’, E’, and E’’). Continuous yellow line in (‘ and ‘’) panels marks clone boundaries (i.e. ‘interface’). Different length of heat shock induction allows scaling of clone sizes from minority into majority topologies. (C and F) Schemes depicting specific zones in and around clones that were quantified. Cell rows (row 1, row 2, and interface cells) were approximated as 4 µm bands (see Materials and methods and Figure 5—figure supplement 1A for details). The interface is the cell contact between both genotypes. Due to spatial limitations, ‘row 2’ cells could only be analyzed in the majority/surrounding genotype. (G and H) Wing disc carrying mosaic clones (gray) expressing GFP (G) or tkvCA (H) and the Dpp reporter Dad4-LacZ (gray or magenta) and the JNK reporter TRE-RFP (gray or green). Discs were stained with DAPI to visualize nuclei (gray). Dotted yellow lines mark wing disc boundaries. Yellow frames mark regions shown in (G’, G’’, H’, and H’’). Dad-LacZ is induced by tkvCA-expression, revealing where tkvCA-expressing clones are like their surroundings and where they are not. Continuous yellow line in (‘ and ‘’) panels marks clone boundaries. Yellow arrow highlights TRE-RFP activation by tkvCA-expressing clones right at the boundary of endogenous Dpp-signaling. (I, J, K, and L) Quantifications of TRE-RFP intensities for experiments shown in (A–E) within specific zones of clones expressing GFP (I and K) or fkh (J and L). Note that in (K and L) GFP-negative wild-type clones are amidst GFP-expressing wild-type cells (K) or amidst fkh-expressing cells (L). Please refer to (B) as legend for (I and J) and refer to (E) as legend for (K and L). Graphs display mean ± 95% CI. One-way ANOVA tests were performed to test for statistical significance, ns = not significant, ***p≤0.001. Wing discs analyzed in each genotype include n=30 (I), n=23 (J), n=15 (K), and n=10 (L). See Figure 2—source data 1; Figure 2—source data 2; Figure 2—source data 3; Figure 2—source data 4. Scale bars = 50 µm.
-
Figure 2—source data 1
for Figure 2I.
- https://cdn.elifesciences.org/articles/80809/elife-80809-fig2-data1-v3.xlsx
-
Figure 2—source data 2
for Figure 2J.
- https://cdn.elifesciences.org/articles/80809/elife-80809-fig2-data2-v3.xlsx
-
Figure 2—source data 3
for Figure 2K.
- https://cdn.elifesciences.org/articles/80809/elife-80809-fig2-data3-v3.xlsx
-
Figure 2—source data 4
for Figure 2L.
- https://cdn.elifesciences.org/articles/80809/elife-80809-fig2-data4-v3.xlsx
Figure 2—figure supplement 1
JNK interface signaling is a robust hallmark of interface surveillance responses.
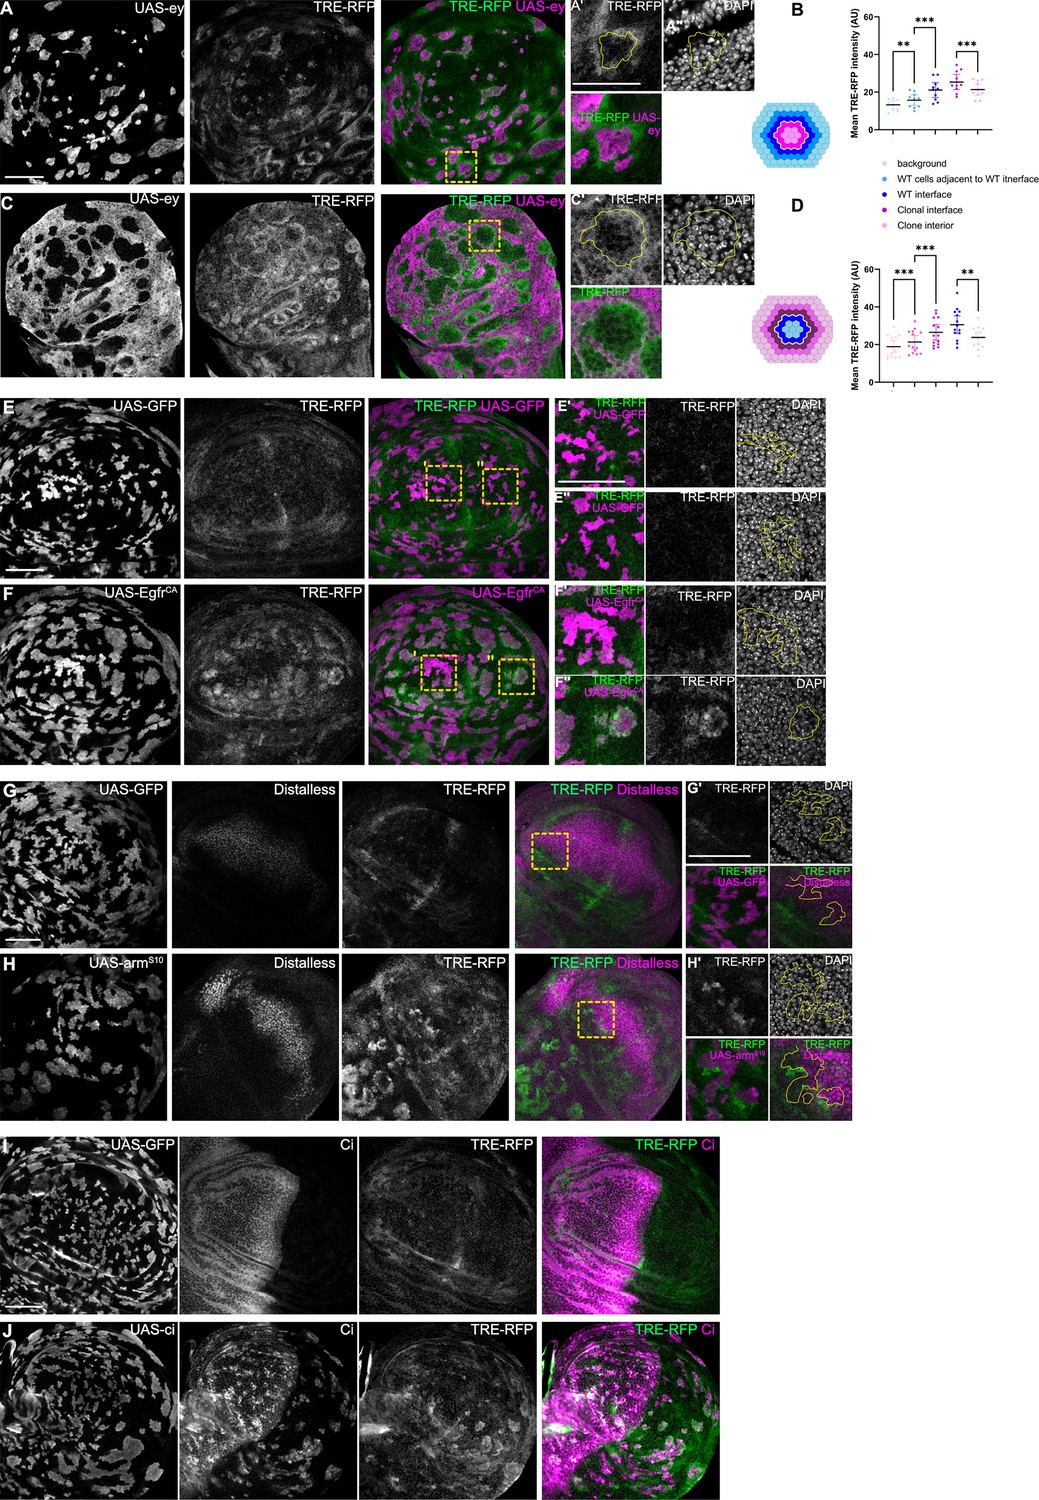
(A and C) Lateral section of a wing disc expressing the TRE-RFP reporter (gray or green) and carrying mosaic clones expressing ey (gray or magenta) in minority topology (A) where clones are surrounded by wild-type cells or in majority topology (C) where wild-type cells are surrounded by ey-expressing cells. Discs were stained with DAPI to visualize nuclei (gray). Different length of heat shock induction allows scaling of clone sizes from minority into majority topologies. Yellow frames mark regions shown in (‘) panels. Yellow lines in (‘) panels demarcate clone boundaries. See Figure 2—figure supplement 1—source data 1. (B and D) Quantifications of TRE-RFP intensities in specific zones of ey-expressing clones, if they represent the minority (B, see experiment in A) or majority (D, see experiment in C) of cells in the disc. Schemes depicting specific zones in and around clones that were quantified. Cell rows (row 1, row 2, and interface cells) were approximated as 4 µm bands (see Materials and methods). The interface is the cell contact between both genotypes. Due to spatial limitations, ‘row 2’ cells could only be analyzed in the majority/surrounding genotype. One-way ANOVA tests were performed to test for statistical significance. ** p≤0.01 and *** p≤0.001. n=10 wing discs (B) and n=14 wing discs (D). See Figure 2—figure supplement 1—source data 2. (E and F) Lateral section of a wing disc expressing the TRE-RFP reporter (gray or green) and carrying mosaic clones (magenta) expressing GFP (E) or EgfrCA (F). Discs were stained with DAPI to visualize nuclei (gray). Yellow frames mark regions shown in (‘ and “) panels. Yellow lines in (‘ and “) panels demarcate clone boundaries. Please compare JNK-activation pattern to pattern of endogenous ERK-activity in Figure 1—figure supplement 2H, thus panel F’’ is highlighting a domain with low endogenous ERK-activity. (G and H) Lateral section of a wing disc expressing the TRE-RFP reporter (gray or green) and carrying mosaic clones (magenta) expressing GFP (G) or armS10 (H). Discs were stained for Distalless to visualize activation of a Wg-signaling target gene. Panel in (H’) visualizes clones at the boundary of Distalless expression domain. Discs were stained with DAPI to visualize nuclei (gray). Yellow frames mark regions shown in (‘) panels. Yellow lines in (‘) panels demarcate clone boundaries. (I and J) Lateral section of a wing disc expressing the TRE-RFP reporter (gray or green) and carrying mosaic clones (magenta) expressing GFP (I), or Ci (J). Discs were stained for Ci to visualize relative Ci-expression and thus domains where Hedgehog (Hh) can activate Hh-signaling. Please note that the relative difference in cell fate between Ci-expressing clones and the surrounding wild-type cells is larger in the posterior compartment (to the right). In addition, the posterior compartment expresses Hh. Scale bar = 50 µm.
-
Figure 2—figure supplement 1—source data 1
- https://cdn.elifesciences.org/articles/80809/elife-80809-fig2-figsupp1-data1-v3.xlsx
-
Figure 2—figure supplement 1—source data 2
- https://cdn.elifesciences.org/articles/80809/elife-80809-fig2-figsupp1-data2-v3.xlsx
Figure 2—figure supplement 2
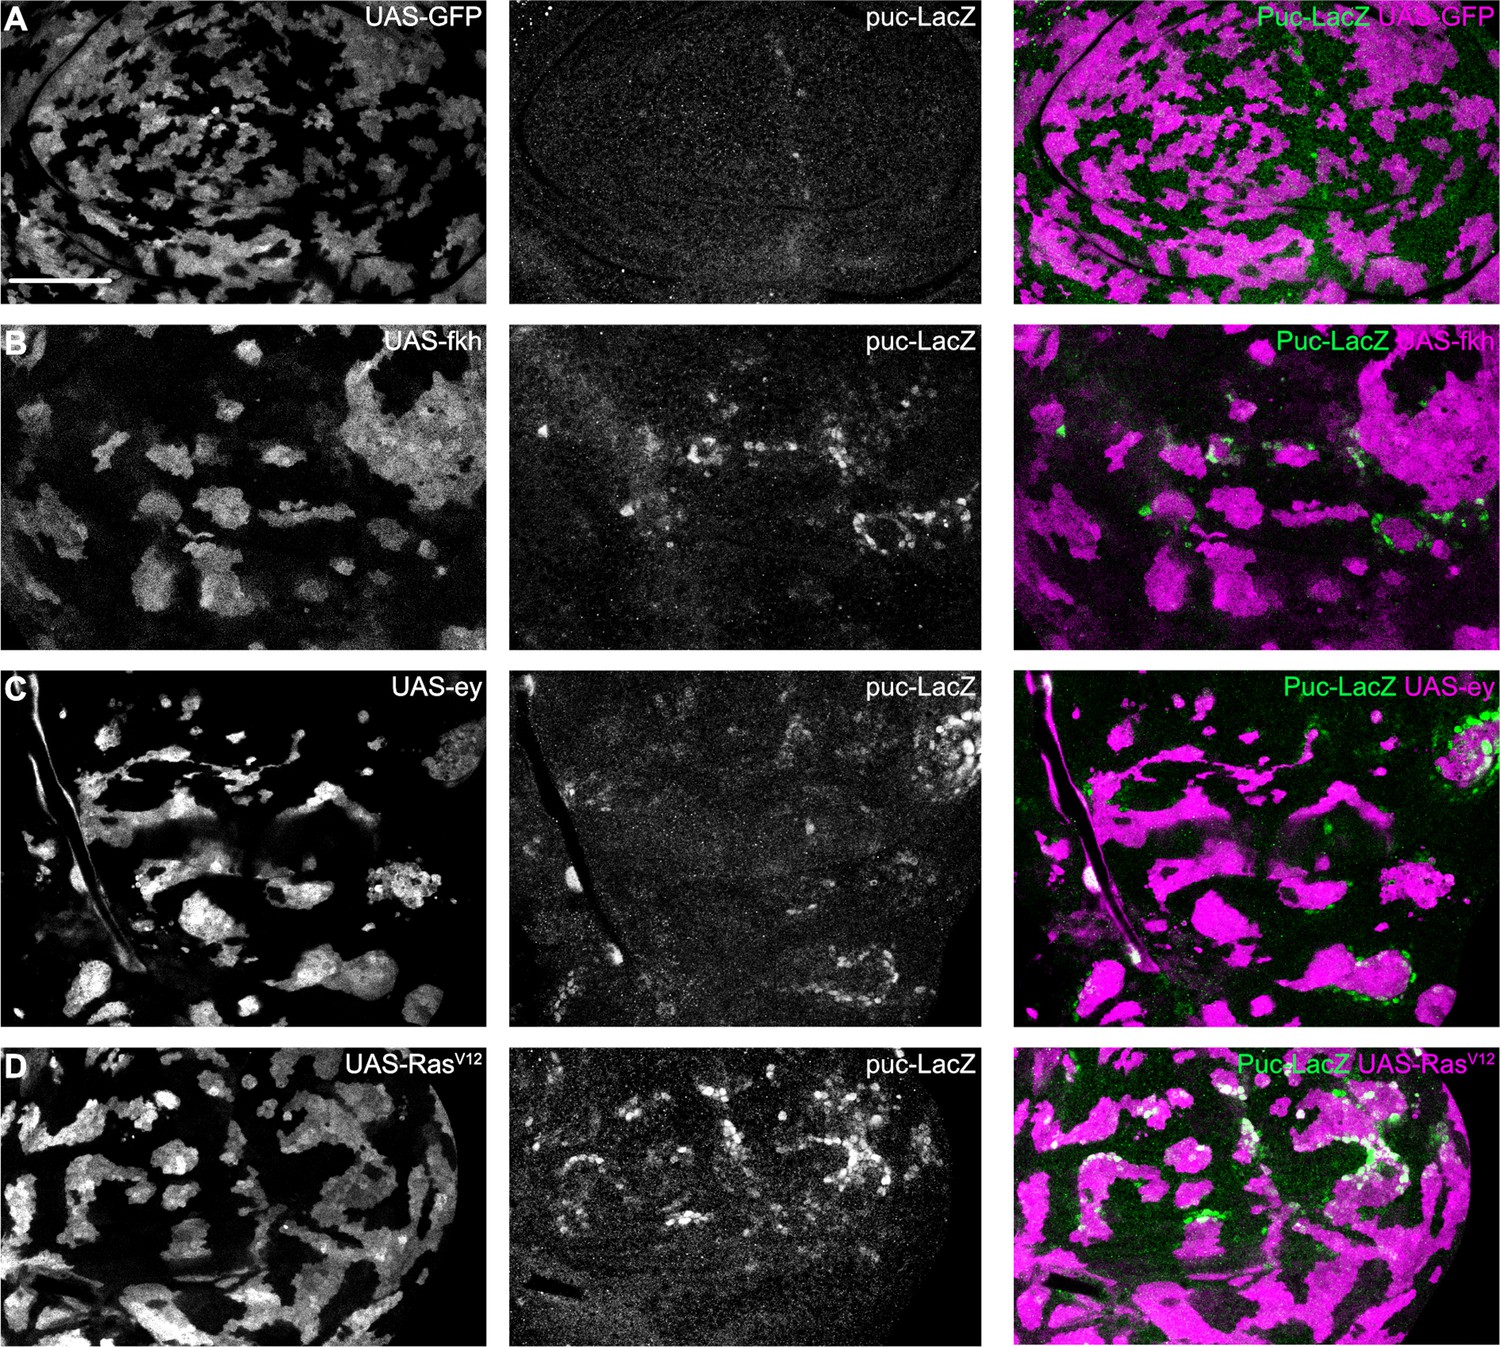
Interface JNK signaling can be detected using the puc-LacZ reporter.
(A–D) Lateral section of wing discs expressing the alternative JNK-reporter puc-LacZ (gray or green) and carrying mosaic clones (gray or magenta) expressing GFP (A), fkh (B), ey (C), or RasV12 (D). Please note activation of puc-LacZ in interface cells. Scale bar = 50 µm.
Figure 3 with 1 supplement
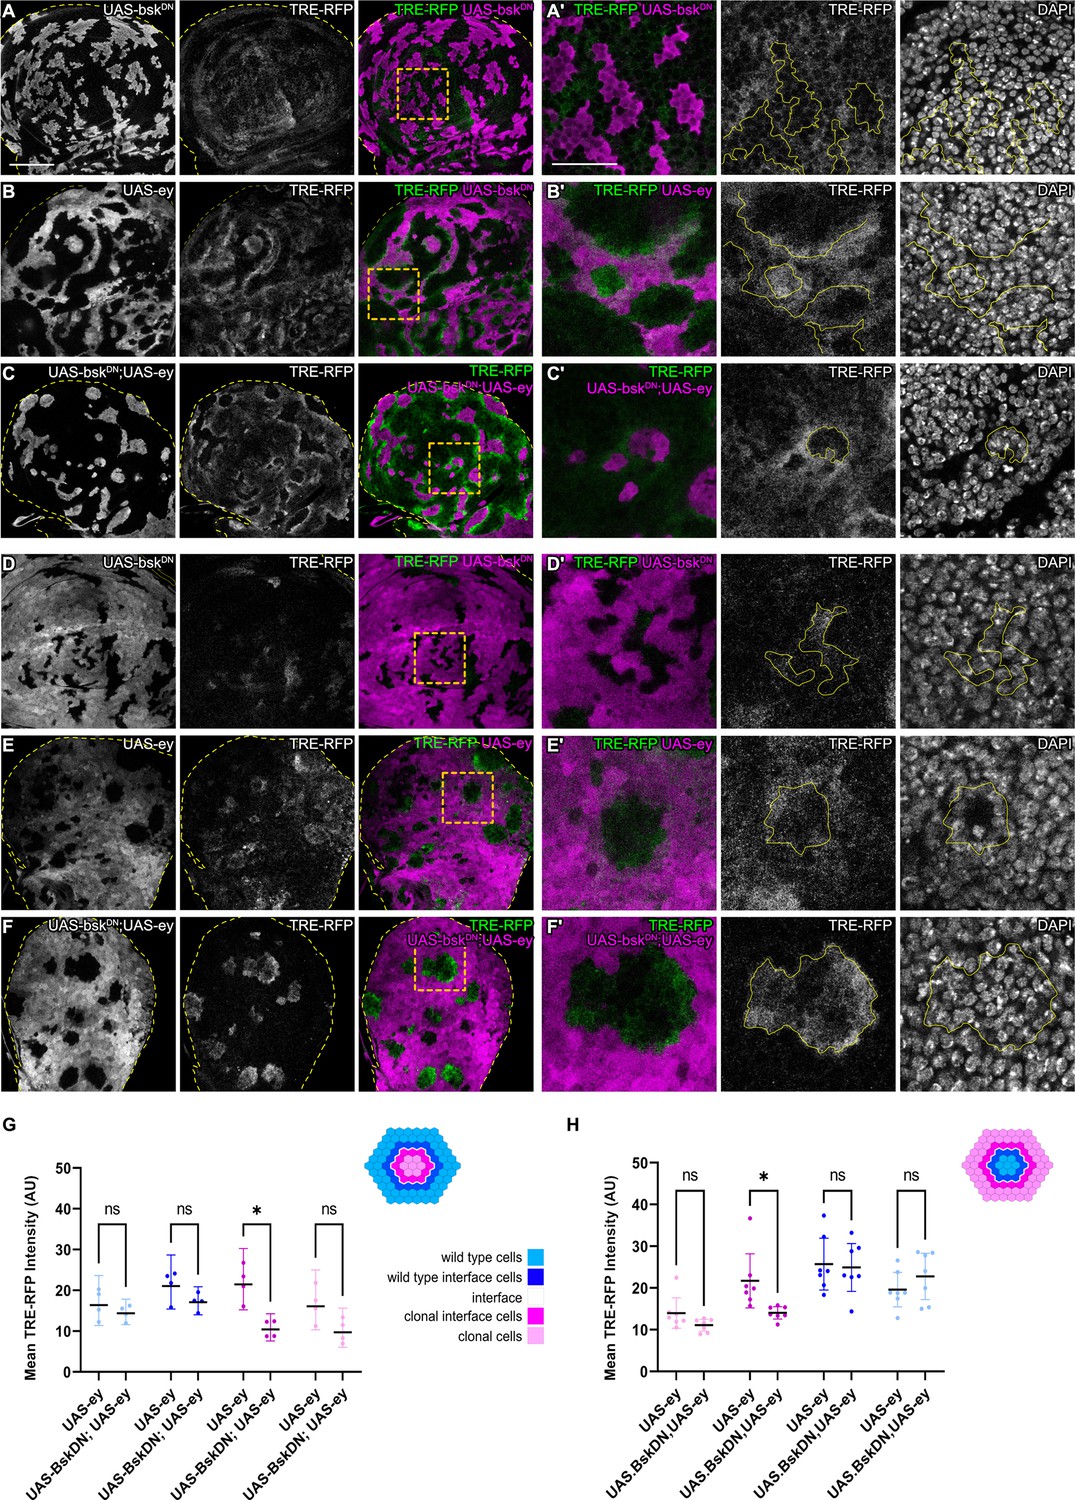
JNK activation is not dependent on JNK activation in the adjacent interface cell.
(A–F) Wing discs carrying mosaic clones (magenta or gray) expressing BskDN (A and D), Ey (B and E), or BskDN, Ey (C and F) and expressing the JNK reporter TRE-RFP (gray or green). Discs were stained with DAPI to visualize individual nuclei (gray). Yellow dashed lines in (A–F) demarcate the wing disc outline. Yellow frames mark regions shown in (‘) panels. Continuous yellow lines in (‘) panels demarcates clone boundaries (i.e. interface). (G and H) Quantifications comparing the TRE-RFP intensities in specific zones of clones expressing Ey or BskDN, Ey (G and H). Graph in (G) represent experiments shown in (A–C) where clones are surrounded by wild-type cells and graph in (H) represent experiments shown in (D–F) wild-type cells are surrounded by cells with Ey or BskDN, Ey genotypes. (H) Graphs display mean ± 95% CI. Two-way ANOVA tests were performed to test for statistical significance, ns = not significant, *p≤0.05. n=4 wing discs per genotype in (G), and n=7 wing discs per genotype in (H). See Figure 3—source data 1; Figure 3—source data 2. Scale bar = 50 µm.
-
Figure 3—source data 1
for Figure 3G.
- https://cdn.elifesciences.org/articles/80809/elife-80809-fig3-data1-v3.xlsx
-
Figure 3—source data 2
for Figure 3H.
- https://cdn.elifesciences.org/articles/80809/elife-80809-fig3-data2-v3.xlsx
Figure 3—figure supplement 1
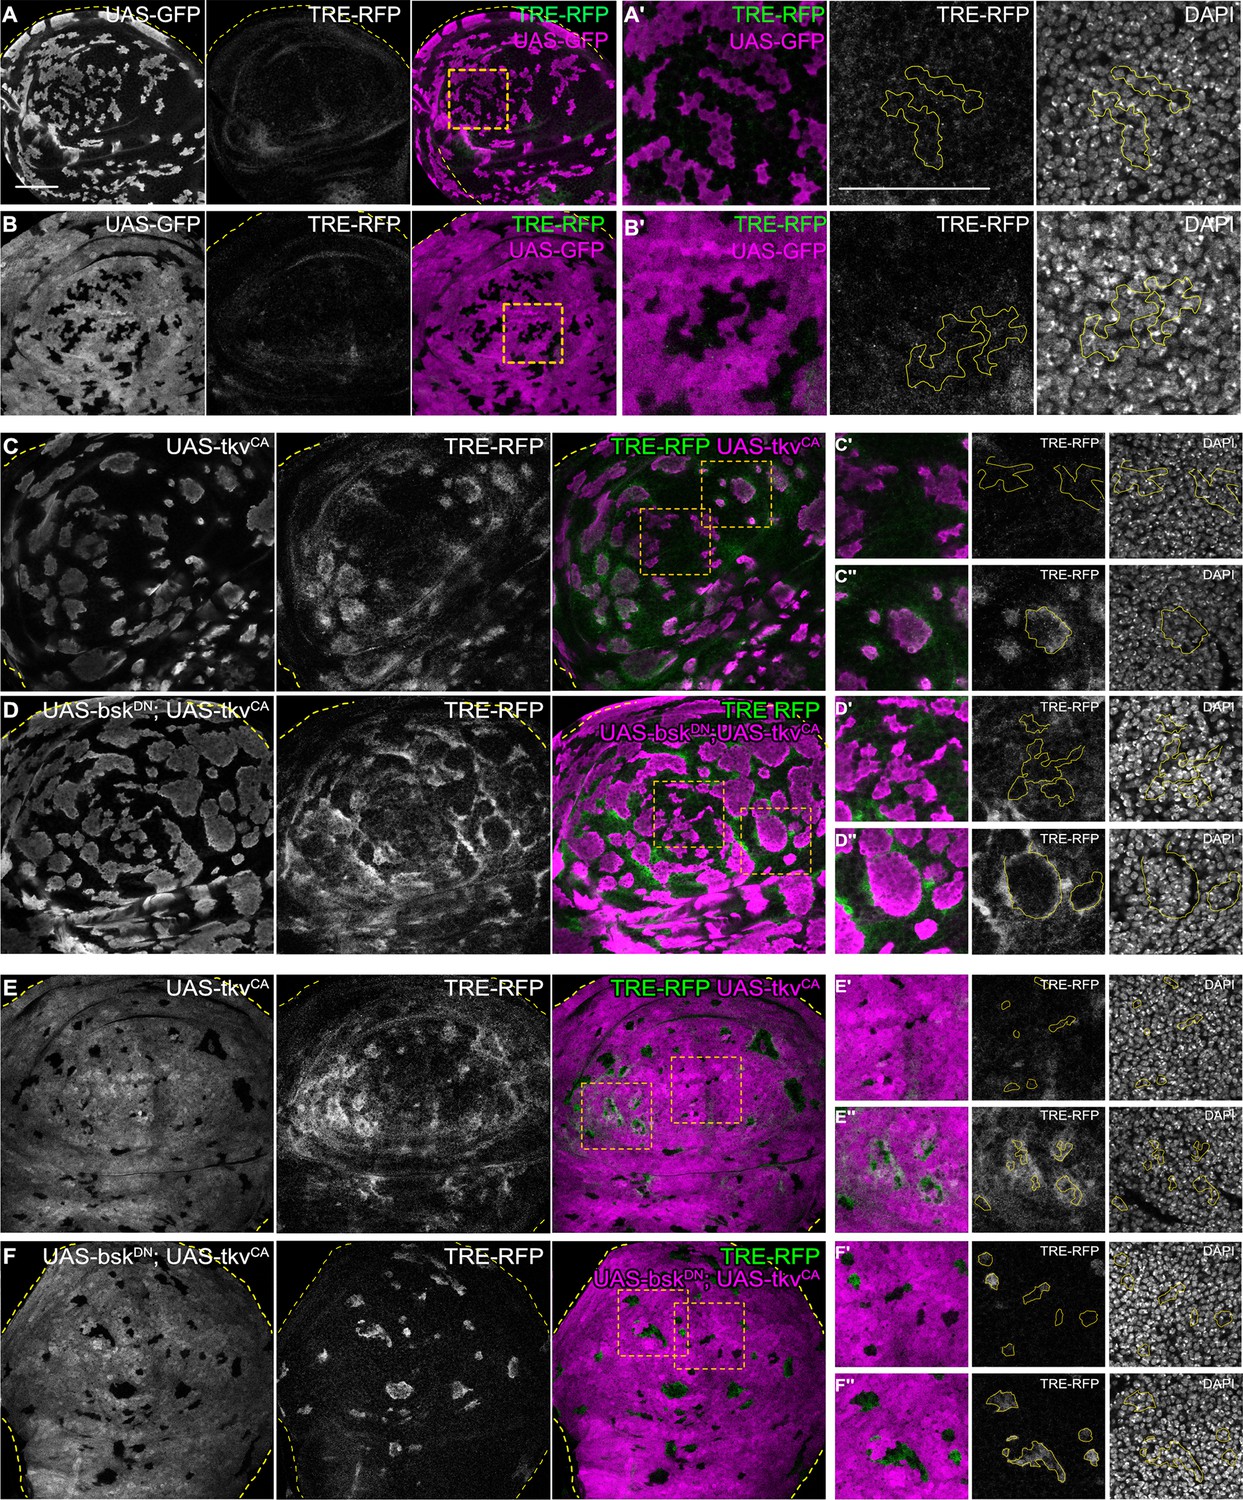
JNK activation is not dependent on JNK activation in the adjacent interface cell.
(A and B) Wing discs carrying mosaic control clones (magenta or gray) expressing GFP and also expressing the JNK-reporter TRE-RFP (gray or green). Discs were stained with DAPI to visualize individual nuclei (gray). Yellow dashed lines in (A–F) demarcate the wing disc outline. Yellow frames mark regions shown in (‘) panels. Continuous yellow line in (‘) panels marks clone boundaries. Different length of heat shock induction allows scaling of clone sizes from minority into majority topologies. (C–F) Lateral sections of wing discs expressing the TRE-RFP reporter (gray or green) and carrying mosaic clones (gray or magenta) expressing tkvCA (C and E) or BskDN, tkvCA (D and F). Discs were stained with DAPI to visualize nuclei (gray or magenta) in (“ and “”) panels. Dashed yellow lines demarcate wing disc boundaries. Yellow frames mark regions shown in (‘-’’’’) panels. Yellow lines in (‘-’’’’) panels demarcate clone boundaries. Different length of heat shock induction allows scaling of clone sizes from minority into majority topologies. Scale bar = 50 µm.
Figure 4 with 2 supplements
JNK interface signaling is unique to interface surveillance and is not activated by cell competition.
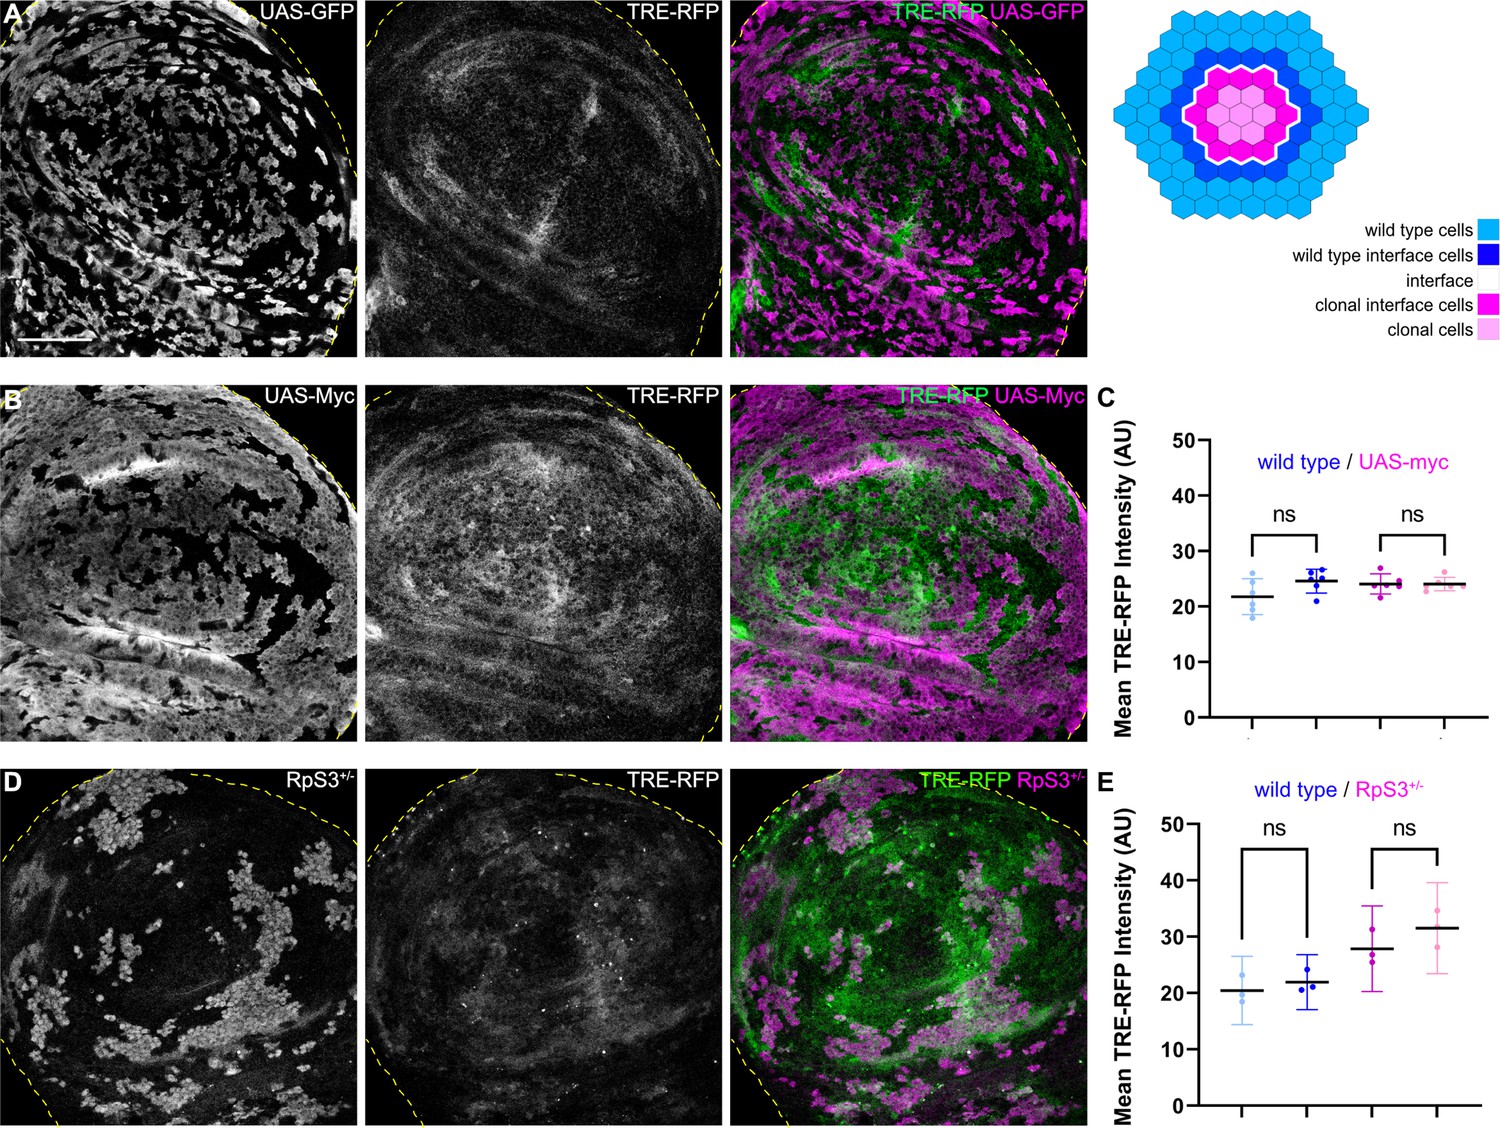
(A, B, and D) Wing disc carrying mosaic clones (gray or magenta) expressing GFP (A), Myc (B, winner), or GFP-labeled clones heterozygous mutant for RpS3 (D, loser). Discs express the JNK reporter TRE-RFP (gray or green). Yellow dashed lines demarcate the wing disc outline. (C and E) Quantifications of TRE-RFP intensities in specific zones of clones expressing Myc (C), or in clones heterozygous mutant for RpS3 (E). See illustration above for color code of individual zones. Please note that in (E) wild type cells are only represented by an 4 µm band next to interface cells. This reduces the effect of highly variable and unpatterned activation of JNK in RpS3 mosaic discs and distinguishes activation by a local interface mechanism from general JNK activity in wild-type cell row 2 distal to the interface. Graphs display mean ± 95% CI. One-way ANOVA tests were performed to test for statistical significance, ns = not significant. n=6 wing discs (C), n=3 wing discs (E). See Figure 4—source data 1; Figure 4—source data 2. Scale bars = 50 µm.
-
Figure 4—source data 1
for Figure 4C.
- https://cdn.elifesciences.org/articles/80809/elife-80809-fig4-data1-v3.xlsx
-
Figure 4—source data 2
for Figure 4E.
- https://cdn.elifesciences.org/articles/80809/elife-80809-fig4-data2-v3.xlsx
Figure 4—figure supplement 1
JNK interface signaling is not activated by cell competition.
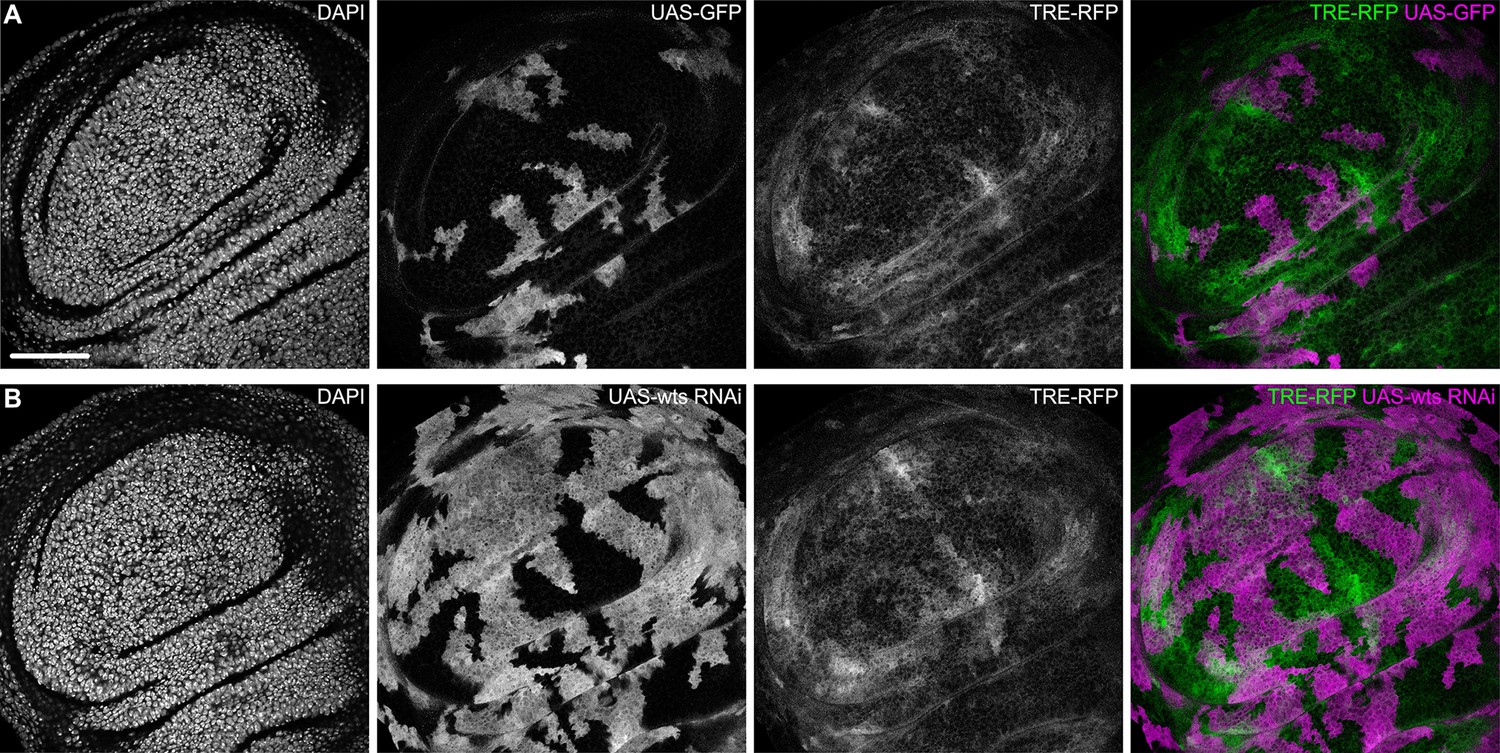
(A and B) Lateral sections of wing discs expressing the TRE-RFP reporter (gray or green) and carrying mosaic clones (gray or magenta) expressing GFP (A), or a wts-RNAi construct (B). Scale bar = 50 µm.
Figure 4—figure supplement 2
JNK signaling is not required for actomyosin enrichment at clonal interfaces.
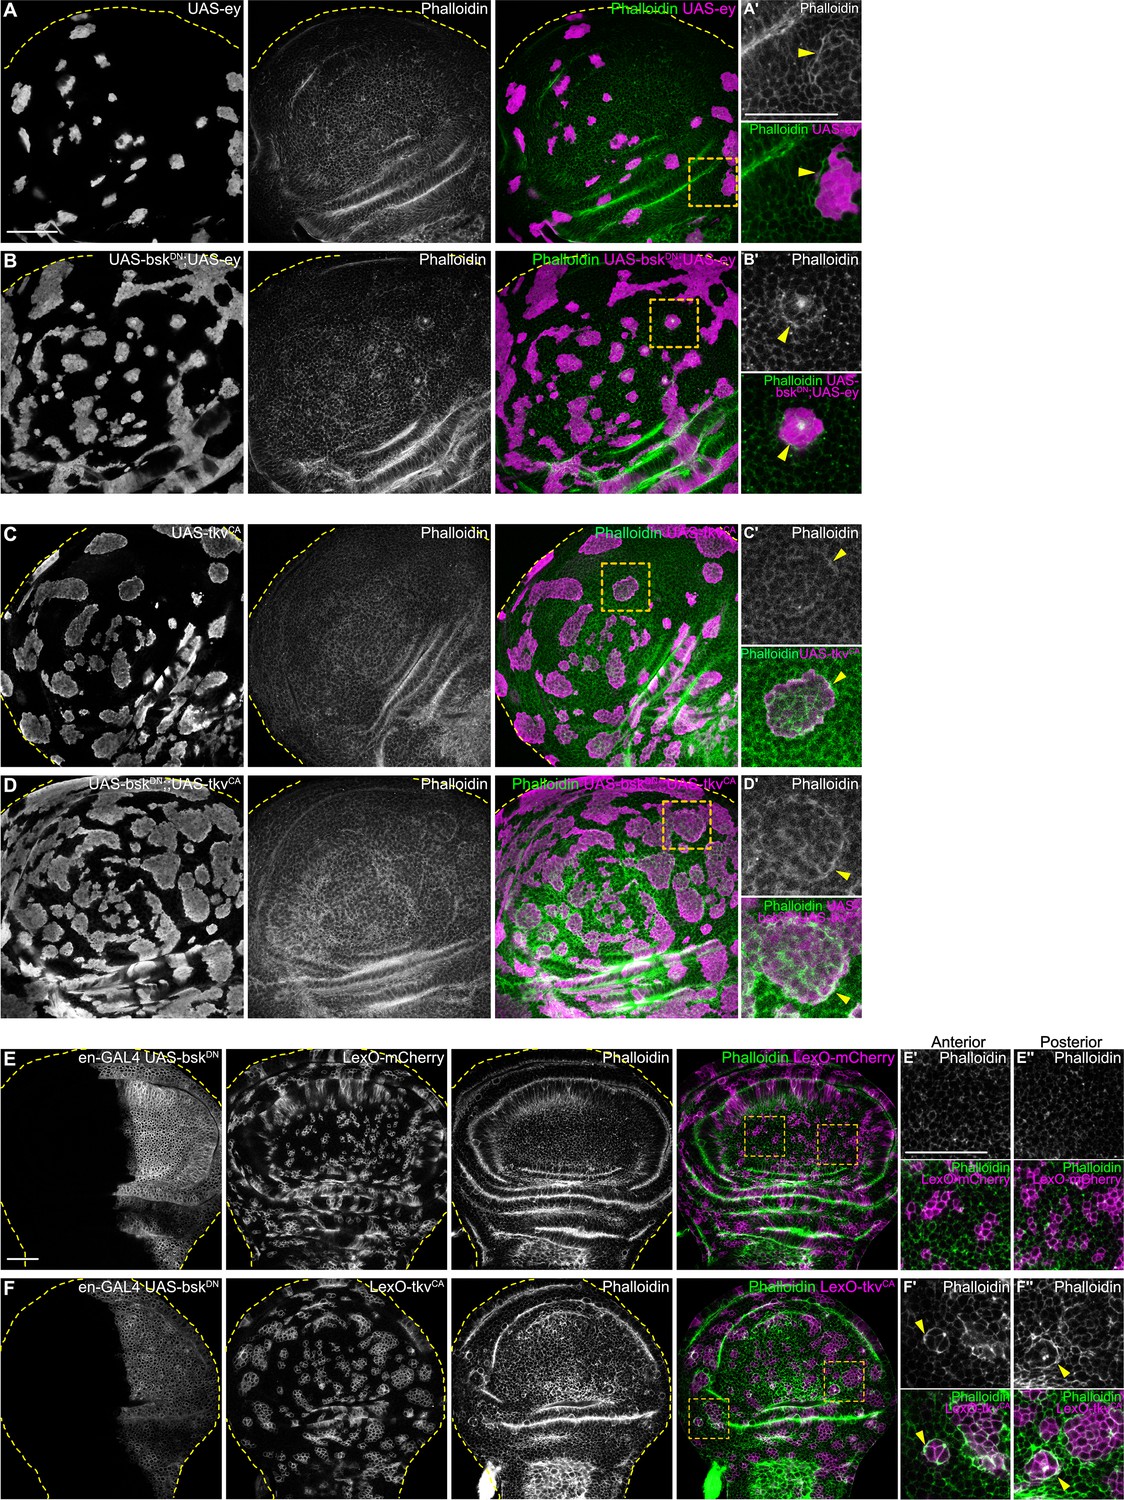
(A, B, C, and D) Lateral sections of wing discs carrying mosaic clones (gray or magenta) expressing ey (A), tkvCA (C) or BskDN, ey (B), BskDN, tkvCA (D). Discs were stained with Phalloidin to visualize Actin (gray or green). Dashed yellow lines demarcate wing disc boundaries. Yellow frames mark regions shown in A’ and B’. Yellow arrow heads highlight actin enrichment at the clone boundary (A’ and B’). Note that clone shapes remain round in (B and D). (E and F) Lateral sections of wing discs where the posterior compartment expresses BskDN under the control of en-GAL4 (gray E and F), and carrying mosaic clones (gray or magenta) expressing LexO-mCherry (E’ and E’’) and LexO-tkvCA (F’ and F’’) under the control of a LexA ‘flip-out’ system. Please see Figure 5K for further explanation of this genotype. Discs were stained with phalloidin to visualize Actin (gray or green). Dashed yellow lines demarcate wing disc boundaries. Yellow frames mark regions shown in the anterior (E’ and F’) and posterior (E’’ and F’’) compartment. Yellow arrow heads in (‘ and “) panels point to actin enrichment at the clone boundary. Note that clone shapes remain smooth and round in the posterior compartment. Scale bar = 50 µm.
Figure 5 with 1 supplement
Cell elimination at clonal interfaces is mediated by JNK.
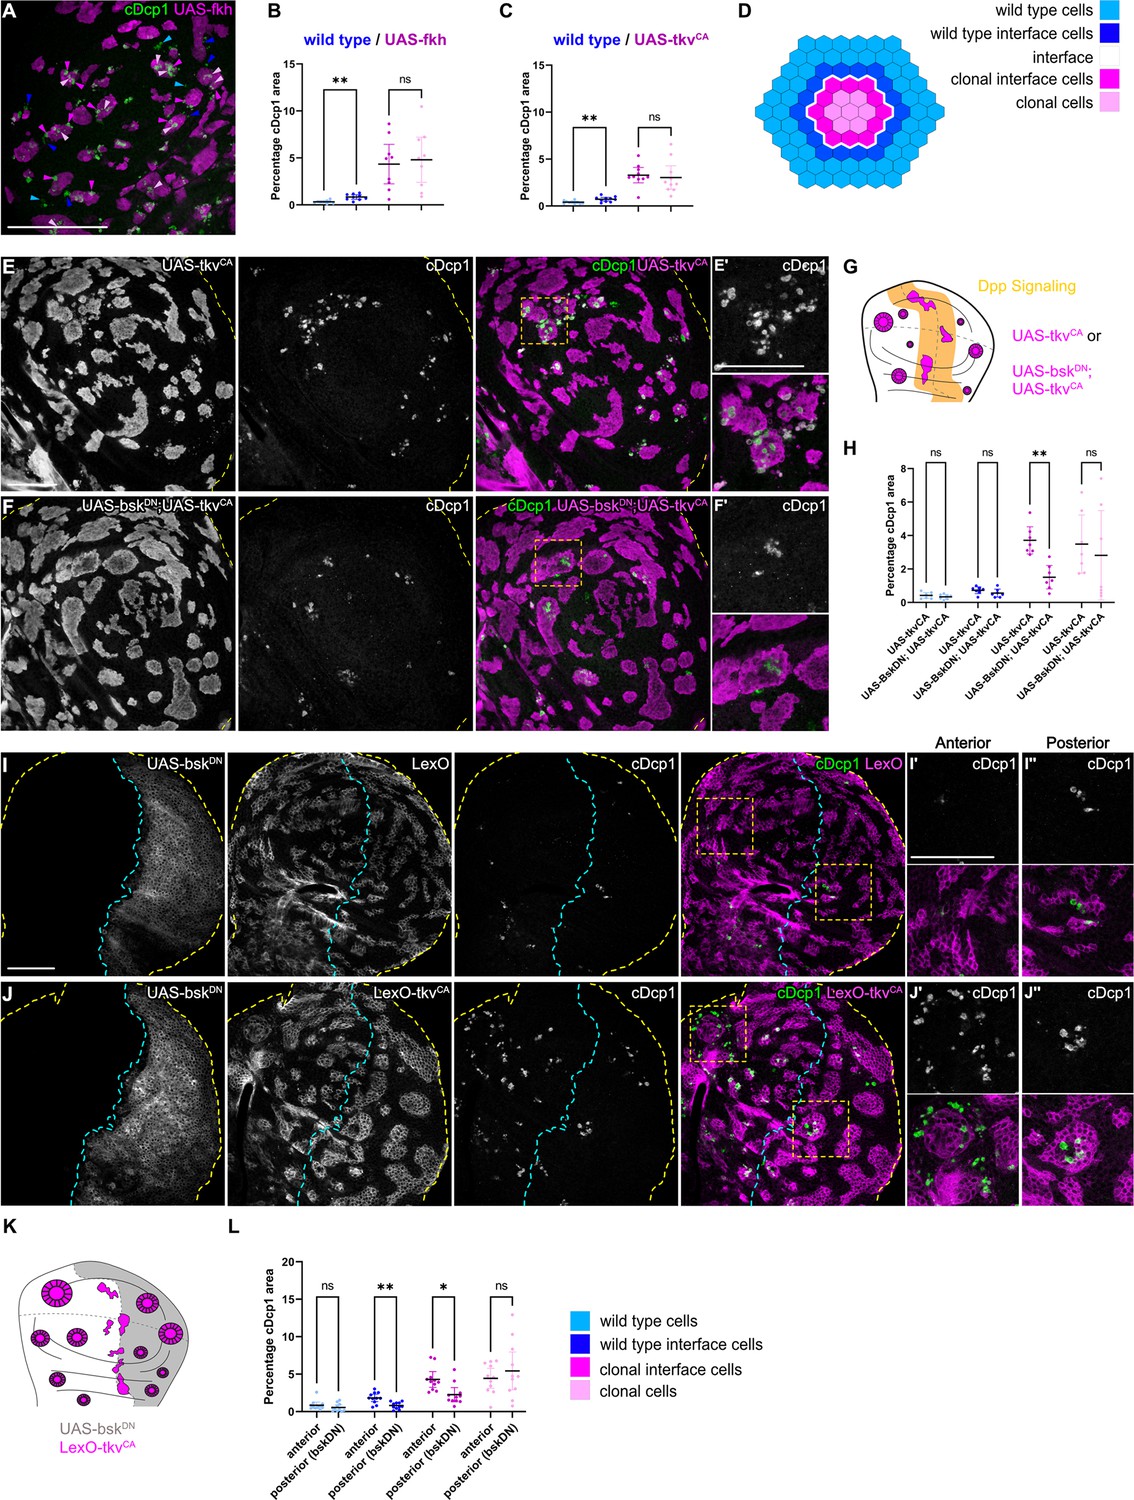
(A) Maximum-intensity projection of basal sections from a wing imaginal disc carrying clones (magenta) expressing fkh and stained for cleaved Dcp1 (cDcp1) to visualize apoptosis (green). Colored arrows show apoptosis in different zones that were used for quantification: light blue (wild type cells), dark blue (wild type interface cells), magenta (clonal cells at interface), and light pink (clonal cells). Please see Figure 5—figure supplement 1A for zone segmentation. (B–D) Quantifications of relative percentage of apoptotic areas in selected zones around clones expressing UAS-fkh (B) or UAS-tkvCA (C). See (D) for color code of individual zones. Only large clones with a distinct interior zone of clonal cells were quantified. Graphs display mean ± 95% CI. One-way ANOVA tests were performed to test for statistical significance, ns = not significant, ** p≤0.01. n=9 wing discs (B) and n=10 wing discs (C). See Figure 5—source data 1. (E–G) Maximum-intensity projections of basal sections of wing imaginal discs carrying clones (gray or magenta) expressing tkvCA (E), or BskDN,tkvCA (F) stained for cDcp1 to visualize apoptosis (gray or green). Yellow dashed lines demarcate the wing disc outline. Yellow frames mark regions shown in (E’ and F’). Scheme (G) illustrates endogenous patterns of Dpp signaling (orange) and expected clone shape of tkvCA and tkvCA, BskDN expressing clones (magenta) in areas where Dpp signaling is normally low (white). (H) Quantifications of relative percentage of apoptotic areas in selected zones around clones expressing expressing tkvCA or BskDN,tkvCA. See legend for color code. Only large clones with a distinct interior zone of clonal cells were quantified (see A). Graphs display mean ± 95% CI. Two-way ANOVA tests were performed to test for statistical significance, ns = not significant, * p≤0.05, ** p≤0.01. n=7 wing discs per genotype. See Figure 5—source data 2. (I–K): Maximum intensity projection of basal section of wing discs, where the posterior compartment expresses BskDN (gray) under the control of en-GAL4, and where clones (gray or magenta) express LexO-mCherry (E) or LexO-tkvCA (F) under the control of a LexA ‘flip-out’ system. Discs were stained for cDcp1 to visualize apoptosis (gray or green). Scheme in (K) illustrates the expected expression of BskDN in the posterior compartment and the response of tkvCA-expressing clones (magenta). Yellow dashed lines demarcate the wing disc outline. Yellow frames mark regions selected in anterior (I’ and I’) and posterior (J’’ and J’’) compartments. Dashed cyan line highlights the anterior-posterior compartment boundary. (L) Quantifications of relative percentage of apoptotic areas in selected zones around clones expressing LexO-tkvCA either in the anterior control compartment or in the posterior compartment expressing BskDN. Only large clones with a distinct interior zone of clonal cells were quantified. Graphs display mean ± 95% CI. Two-way ANOVA tests were performed to test for statistical significance, ns = not significant, * p≤0.05, ** p≤0.01. n=11 wing discs. See Figure 5—source data 3. Scale bar = 50 µm.
-
Figure 5—source data 1
for Figure 5B.
- https://cdn.elifesciences.org/articles/80809/elife-80809-fig5-data1-v3.xlsx
-
Figure 5—source data 2
for Figure 5H.
- https://cdn.elifesciences.org/articles/80809/elife-80809-fig5-data2-v3.xlsx
-
Figure 5—source data 3
for Figure 5L.
- https://cdn.elifesciences.org/articles/80809/elife-80809-fig5-data3-v3.xlsx
Figure 5—figure supplement 1
Apoptosis can be observed at the buckling points of fkh expressing clones.
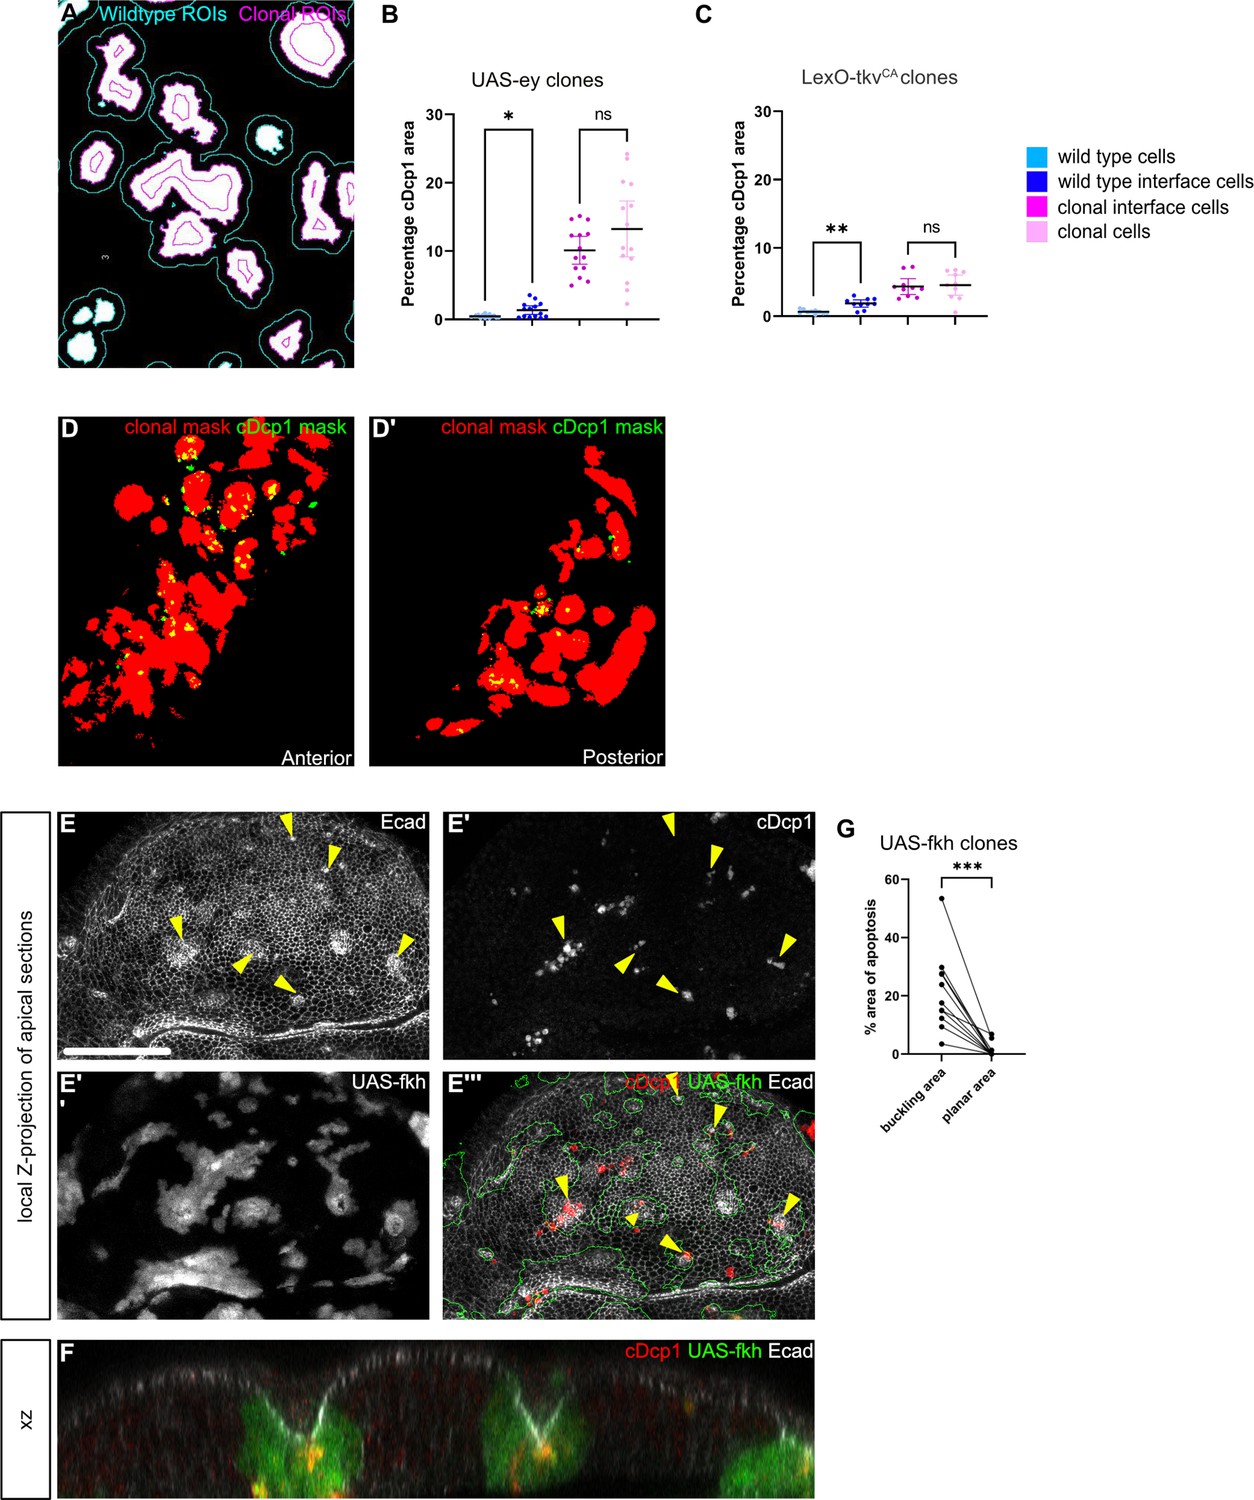
(A) Example of a segmentation mask based on clone areas (white), and ROIs (regions of interest) corresponding to wild-type interface cells (cyan boundary) and clonal interface cells (magenta boundary). (B and C) Quantifications of relative percentage of apoptotic areas in selected zones around clones expressing UAS-ey (B) or LexO-tkvCA (C). Only large clones with distinct interior zones were quantified for clone interior and clonal interface zones. Note apoptotic activity in clone interior zones. Graphs display mean ± 95% CI. One-way ANOVA tests were performed to test for statistical significance, ns = not significant, * p≤0.05, ** p≤0.01. n=12 wing discs (B) and n=10 wing discs (C). See Figure 5—figure supplement 1—source data 1; Figure 5—figure supplement 1—source data 2. (D) Overlay of segmentation mask for LexO-tkvCA clones (red) and for cDcp1 (green) in anterior (D) and posterior (D’) compartments in a wing disc where the entire posterior compartment expressed UAS-BskDN. (E) Local z-projection of apical sections of a wing disc carrying mosaic clones (gray or green outline) expressing fkh. Discs were stained for cleaved Dcp1 to visualize apoptosis (gray or red) and for E-cadherin to visualize the apical junctional network (gray). Yellow arrows point to positions of apical deformations arising from buckling and cystic invagination. (F) XZ cross-section through a wing disc carrying mosaic clones expressing fkh (green). The disc was stained for cleaved Dcp1 to visualize apoptosis (red) and for E-cadherin to visualize the apical junctional network (gray). (G) Quantification of the relative percentage of apoptotic area (cDcp1) found in domains with buckling points versus planar regions within fkh-expressing clones. A paired Student‘s t-test was performed to test for statistical significance, *** p≤0.001. n=11 buckling and n=11 planar regions, each pair within the same clone, in three wing discs. Scale bar = 50 µm.
-
Figure 5—figure supplement 1—source data 1
- https://cdn.elifesciences.org/articles/80809/elife-80809-fig5-figsupp1-data1-v3.xlsx
-
Figure 5—figure supplement 1—source data 2
- https://cdn.elifesciences.org/articles/80809/elife-80809-fig5-figsupp1-data2-v3.xlsx
Figure 6 with 1 supplement
Bilateral JNK-signaling and apoptosis scale with clone size.
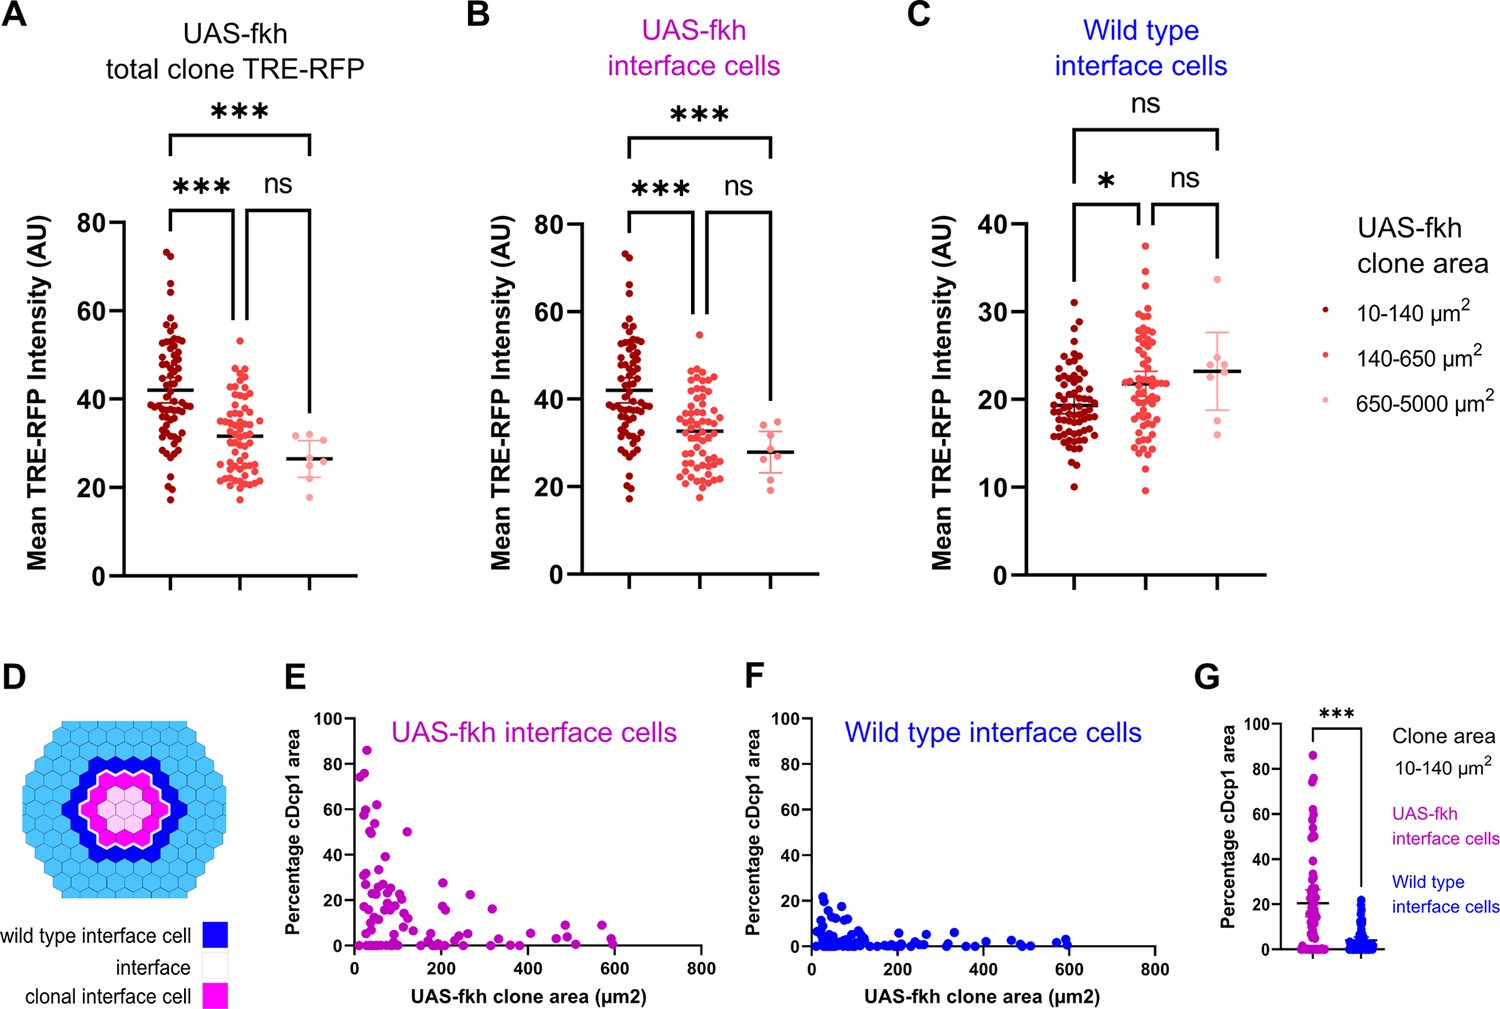
(A–C) Quantification of TRE-RFP intensity within the entire clone area (A), only within clonal interface cells (B) and only within wild-type interface cells (C) in mosaic discs with fkh-expressing clones. Clones have been binned based on size: dark red (small clones, 10–140 µm2, approximately containing 1–6 cells), red (medium clones, 140–650 µm2, approximately containing 7–35 cells), and pink (large clones, 650–5000 µm2, any clone above approximately 35 cells). A one-way ANOVA test was performed to test for statistical significance. n=140 clones from n=6 wing discs. Please note that JNK-activity within clonal interface cells decreases with clones size but increases with clones size within wild-type interface cells. This is consistent with expected changes in cell contact topology for clonal interface and wild-type interface cells when clone size increase (see Figure 6—figure supplement 1A, Figure 6—source data 1; Figure 6—source data 2; Figure 6—source data 3). (D–G) Scheme (D) depicting clonal interface and wild-type interface zones that were quantified in (E–G). Graph in (E) depicts distribution of the relative percentage of apoptotic area in clonal interface zones (E) and in wild-type interface zones (F) in different sizes of fkh-eypressing clones. Note that wild-type interface cells are less apoptotic than clonal interface cells. This is consistent with lower levels of JNK-activity (compare B and C) arising from cell contact topologies for wild type and fkh-eypressing cells (see Figure 6—figure supplement 1A). Graph in (G) depicts the quantification of the relative percentage of apoptotic area in clonal interface zones (magenta) and in wild-type interface zones (blue) of small fkh-expressing clones (10–140 µm2) in the pouch of wing discs shown in (E and F). A one-way ANOVA test was performed to test for statistical significance. n=6 wing discs. See Figure 6—source data 4; Figure 6—source data 5; Figure 6—source data 6.
-
Figure 6—source data 1
for Figure 6A.
- https://cdn.elifesciences.org/articles/80809/elife-80809-fig6-data1-v3.xlsx
-
Figure 6—source data 2
for Figure 6B.
- https://cdn.elifesciences.org/articles/80809/elife-80809-fig6-data2-v3.xlsx
-
Figure 6—source data 3
for Figure 6C.
- https://cdn.elifesciences.org/articles/80809/elife-80809-fig6-data3-v3.xlsx
-
Figure 6—source data 4
for Figure 6E.
- https://cdn.elifesciences.org/articles/80809/elife-80809-fig6-data4-v3.xlsx
-
Figure 6—source data 5
for Figure 6F.
- https://cdn.elifesciences.org/articles/80809/elife-80809-fig6-data5-v3.xlsx
-
Figure 6—source data 6
for Figure 6G.
- https://cdn.elifesciences.org/articles/80809/elife-80809-fig6-data6-v3.xlsx
Figure 6—figure supplement 1
Bilateral JNK-activity scales with clone size.
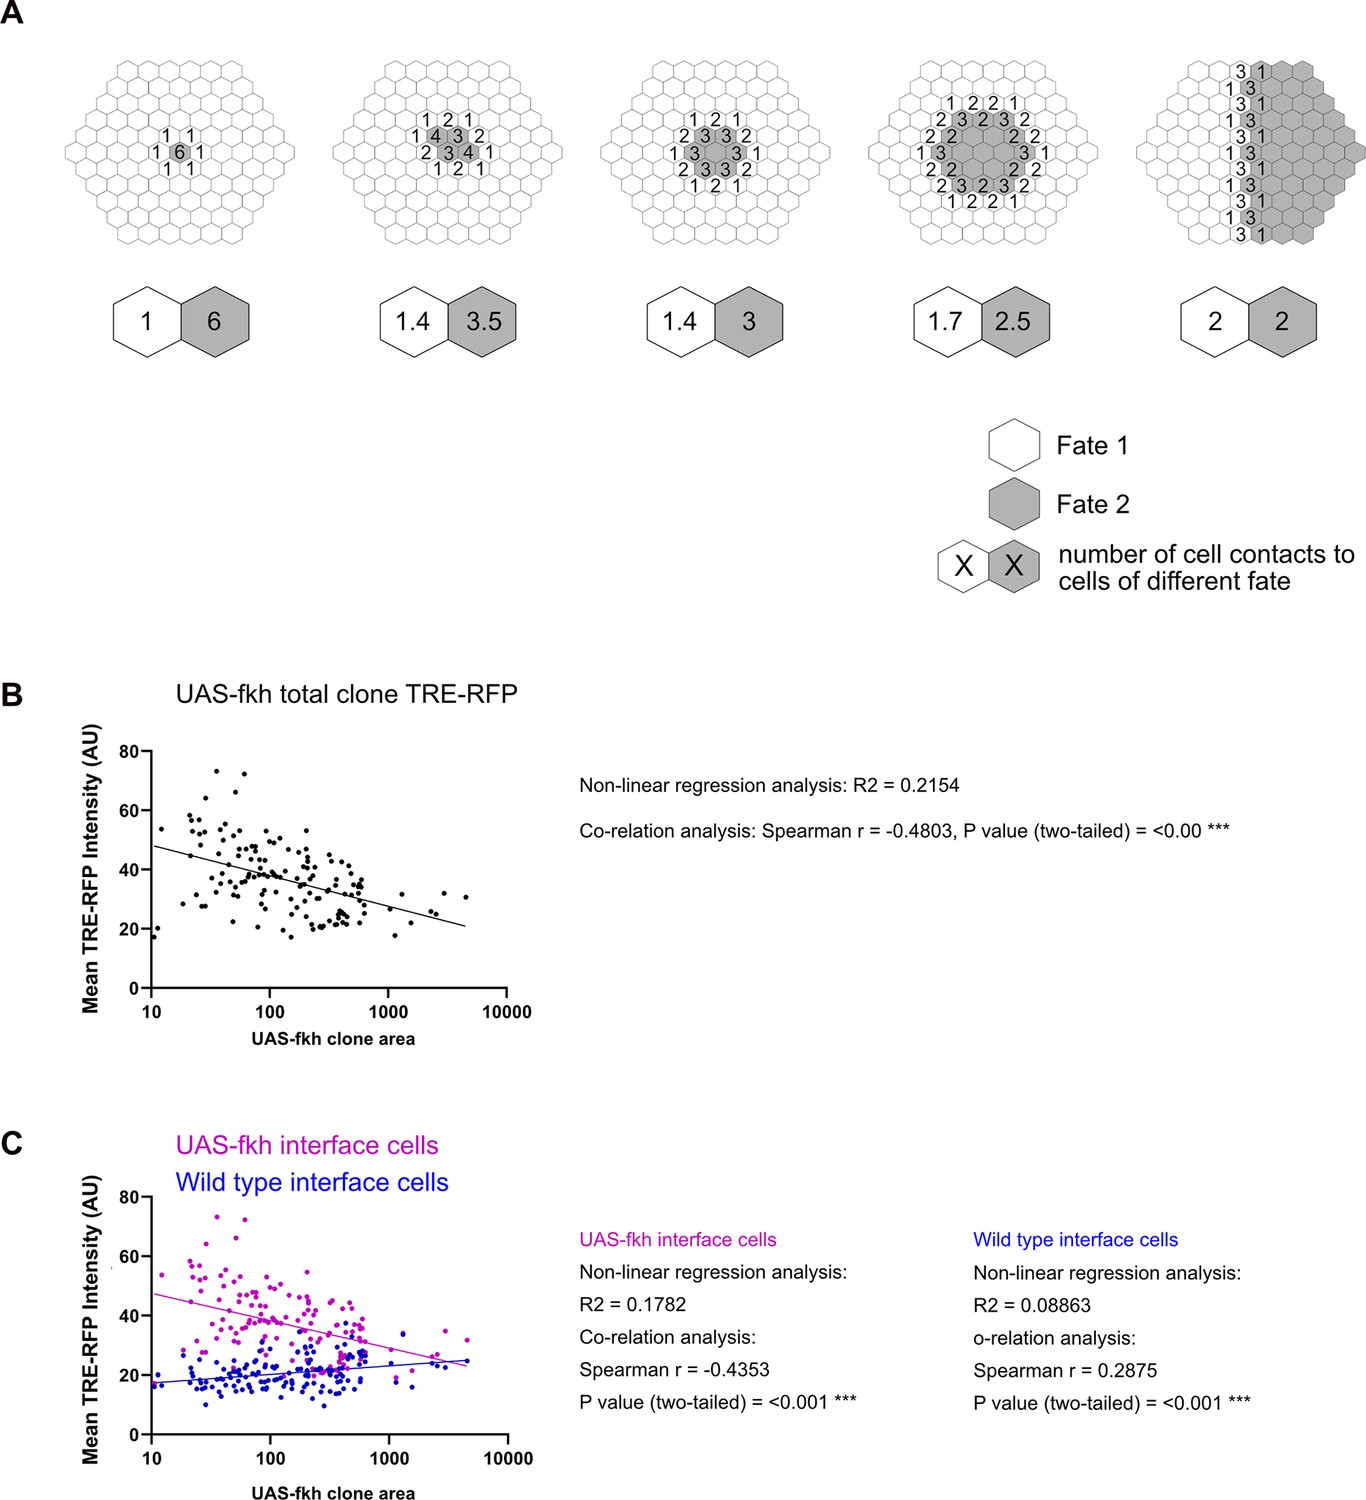
(A) Topology of interface contacts depending on size of ‘clones’ (i.e. Fate 2). Numbers denote the number of contacts with cells of the other genotype. The ratio of cell contacts changes with increasing clone size but does so most strongly for the ‘enclosed clone’ (from an average of 6–2 contacts in examples here). Note that the effect for the surrounding cell population is inverse/opposite and also less pronounced (from 1 to 2). Note that Fate 1 and 2 can represent either wild type of clonal cells and the model applies to different (minority and majority) topologies. In this model, the number of cell contacts with a different fate directly determines the strength of JNK signaling (and thus pro-apopototic signaling) in this cell. (B and C) Distribution of TRE-RFP intensity in the entire area of individual fkh-expressing clones (B) and within clonal interface zones (magenta, C) and wild-type interface zones (blue, C) of the fkh-expressing clones analyses in (B). Please note the opposite trends and their different slopes, which are consistent with the model shown in (A). A non-linear regression analysis using a semi-log line and a correlation analysis using the Spearman coefficient were performed. n=140 clones in n=6 wing discs. See Figure 6—figure supplement 1—source data 1 and Figure 6—figure supplement 1—source data 2.
-
Figure 6—figure supplement 1—source data 1
- https://cdn.elifesciences.org/articles/80809/elife-80809-fig6-figsupp1-data1-v3.xlsx
-
Figure 6—figure supplement 1—source data 2
- https://cdn.elifesciences.org/articles/80809/elife-80809-fig6-figsupp1-data2-v3.xlsx
Figure 7 with 2 supplements
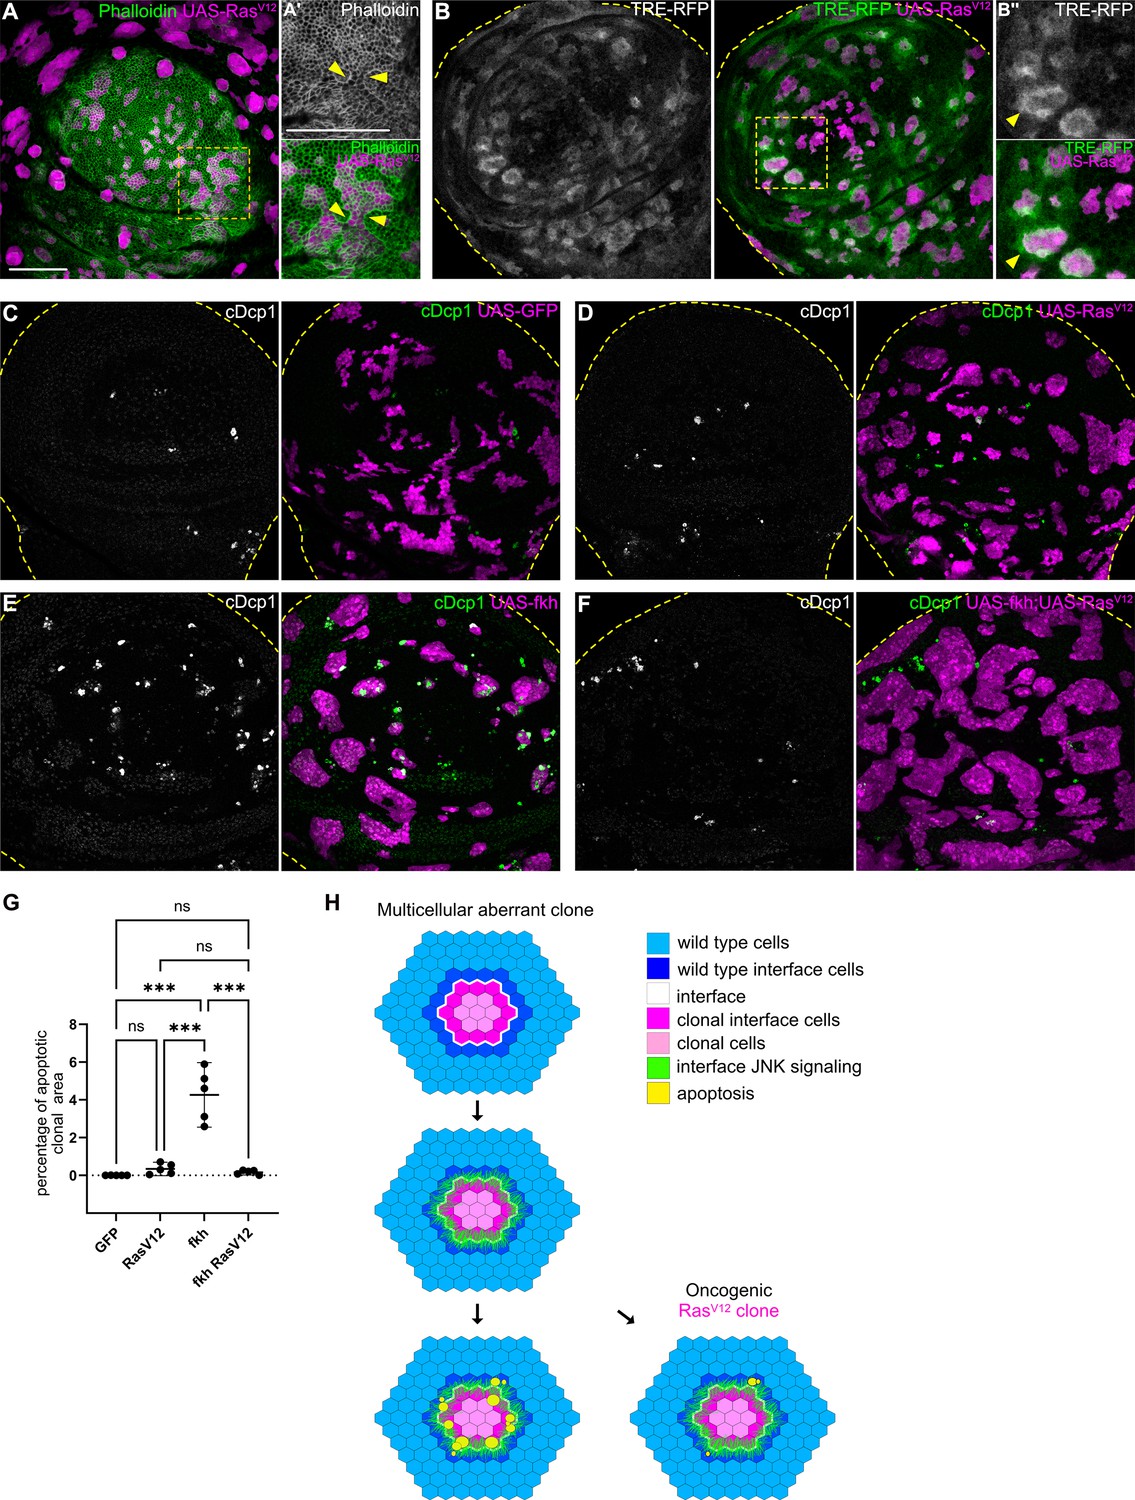
Cell elimination by interface surveillance is suppressed by oncogenic RasV12.
(A) Wing disc carrying mosaic clones (magenta) expressing RasV12 were stained with phalloidin to visualize Actin (gray or green). Yellow frames mark regions shown in (A’). Yellow arrows point to actin enrichment at clone boundaries. (B) Wing disc carrying mosaic clones (magenta) expressing RasV12 and TRE-RFP (gray or green). Yellow dashed lines demarcate the wing disc outline. Yellow frames mark regions shown in (B’). Yellow arrows highlight TRE-RFP activation. Please compare JNK-activation pattern to pattern of endogenous EGF-activity in (Figure 1—figure supplement 2H). (C, D, E, and F) Maximum intensity projection of basal sections of wing discs carrying clones (magenta) expressing GFP (C) RasV12 (D), fkh (E), or fkh, RasV12 (F) was stained for cleaved Dcp1 (cDcp1) to visualize apoptosis (gray or green). Yellow dashed lines demarcate the wing disc outline. (G) Quantifications of the relative percentage of apoptotic area in clones expressing GFP only, RasV12; fkh, or fkh,RasV12. Graphs display mean ± 95% CI. One-way ANOVA tests were performed to test for statistical significance, ns = not significant, *** p≤0.001. n=5 wing discs per genotype. See Figure 7—source data 1. (H) Model of bilateral JNK activation and cell elimination by interface surveillance. Oncogenic mutations evade apoptosis. Scale bar = 50 µm.
Figure 7—figure supplement 1
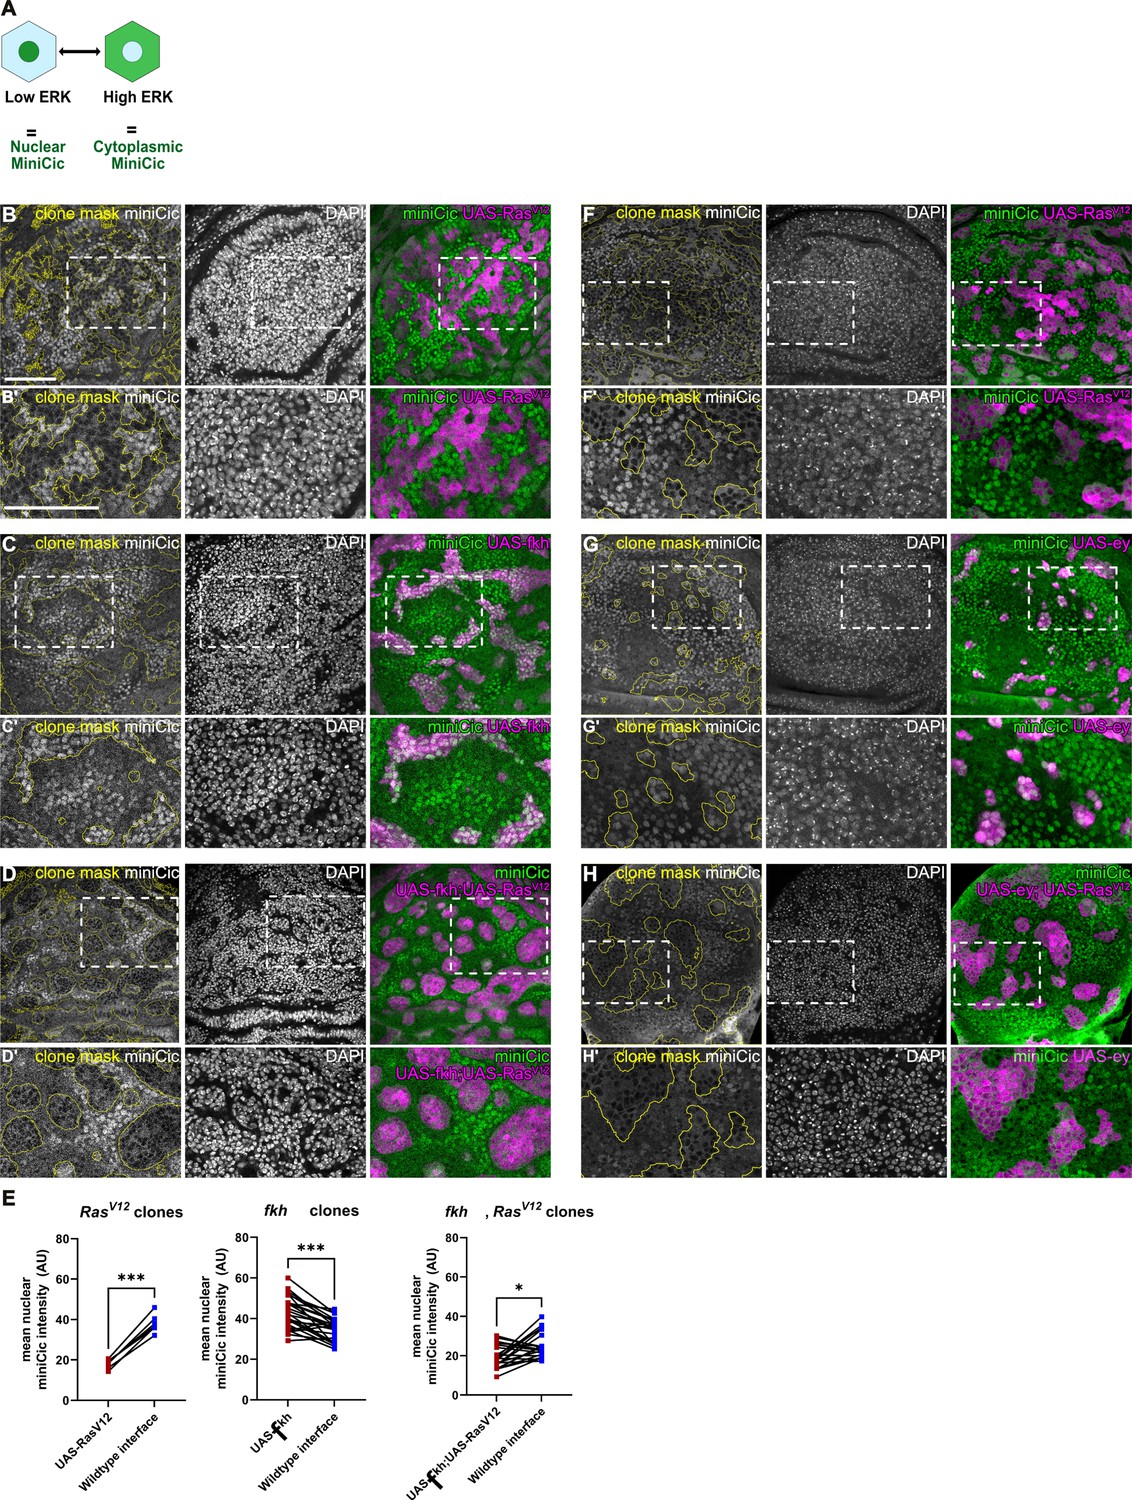
RasV12 dominantly induces high-ERK signaling in fkh- and Ey-expressing clones.
(A) Scheme illustrating how the miniCic ERK-reporter works. Nuclear localization of the miniCic reporter indicates low-ERK signaling, and cytoplasmic localization indicates high-ERK signaling. (B–D and F–H) Lateral section of wing discs expressing the ERK-reporter miniCic-mScarlett or miniCic-mCherry (gray or green) and carrying mosaic clones (yellow outline or magenta) expressing RasV12 (A and F), fkh (B), fkh,RasV12 (C), ey (G), and ey,RasV12 (H). Discs were stained with DAPI to visualize nuclei (gray). White frames mark regions shown in B’–D’ and F’–H’. (E) Quantifications of nuclear miniCic intensity (AU) in clones expressing RasV12 or fkh or fkh, RasV12 (dark red) versus nuclear miniCic intensity (AU) in corresponding wild type interface cells (blue). Paired Student’s t-tests were performed to test for statistical significance, * p≤0.05, *** p≤0.001. See Figure 7—figure supplement 1—source data 1; Figure 7—figure supplement 1—source data 2; Figure 7—figure supplement 1—source data 3. Scale bar = 50 µm.
-
Figure 7—figure supplement 1—source data 1
for Figure 7—figure supplement 1E fkh.
- https://cdn.elifesciences.org/articles/80809/elife-80809-fig7-figsupp1-data1-v3.xlsx
-
Figure 7—figure supplement 1—source data 2
for Figure 7—figure supplement 1E–R as-fkh.
- https://cdn.elifesciences.org/articles/80809/elife-80809-fig7-figsupp1-data2-v3.xlsx
-
Figure 7—figure supplement 1—source data 3
for Figure 7—figure supplement 1E–R as.
- https://cdn.elifesciences.org/articles/80809/elife-80809-fig7-figsupp1-data3-v3.xlsx
Figure 7—figure supplement 2

RasV12 rescues ey-expressing clones from apoptosis.
(A–C) Maximum intensity projection of basal sections of wing discs carrying mosaic clones (magenta) expressing RasV12 (A) or ey (B) or ey,RasV12 (C). Discs were stained for cDcp1 (gray or green) to visualize apoptosis. Dashed yellow lines demarcate wing disc boundaries. Please not lack of intraclonal apoptosis in (C). Scale bar = 50 µm.
Additional files
-
Supplementary file 1
Fly strains.
Table listing fly strains used in this study.
- https://cdn.elifesciences.org/articles/80809/elife-80809-supp1-v3.docx
-
Supplementary file 2
Detailed genotypes.
Table listing detailed genotypes per figure panels
- https://cdn.elifesciences.org/articles/80809/elife-80809-supp2-v3.docx
-
MDAR checklist
- https://cdn.elifesciences.org/articles/80809/elife-80809-mdarchecklist1-v3.pdf
Download links
A two-part list of links to download the article, or parts of the article, in various formats.
Downloads (link to download the article as PDF)
Open citations (links to open the citations from this article in various online reference manager services)
Cite this article (links to download the citations from this article in formats compatible with various reference manager tools)
Bilateral JNK activation is a hallmark of interface surveillance and promotes elimination of aberrant cells
eLife 12:e80809.
https://doi.org/10.7554/eLife.80809


