Mountain gorillas maintain strong affiliative biases for maternal siblings despite high male reproductive skew and extensive exposure to paternal kin
- Department of Anthropology, University of Michigan-Ann Arbor, United States
- The Dian Fossey Gorilla Fund International, United States
- Department of Primatology, Max Planck Institute for Evolutionary Anthropology, Germany
Figures
Figure 1 with 2 supplements
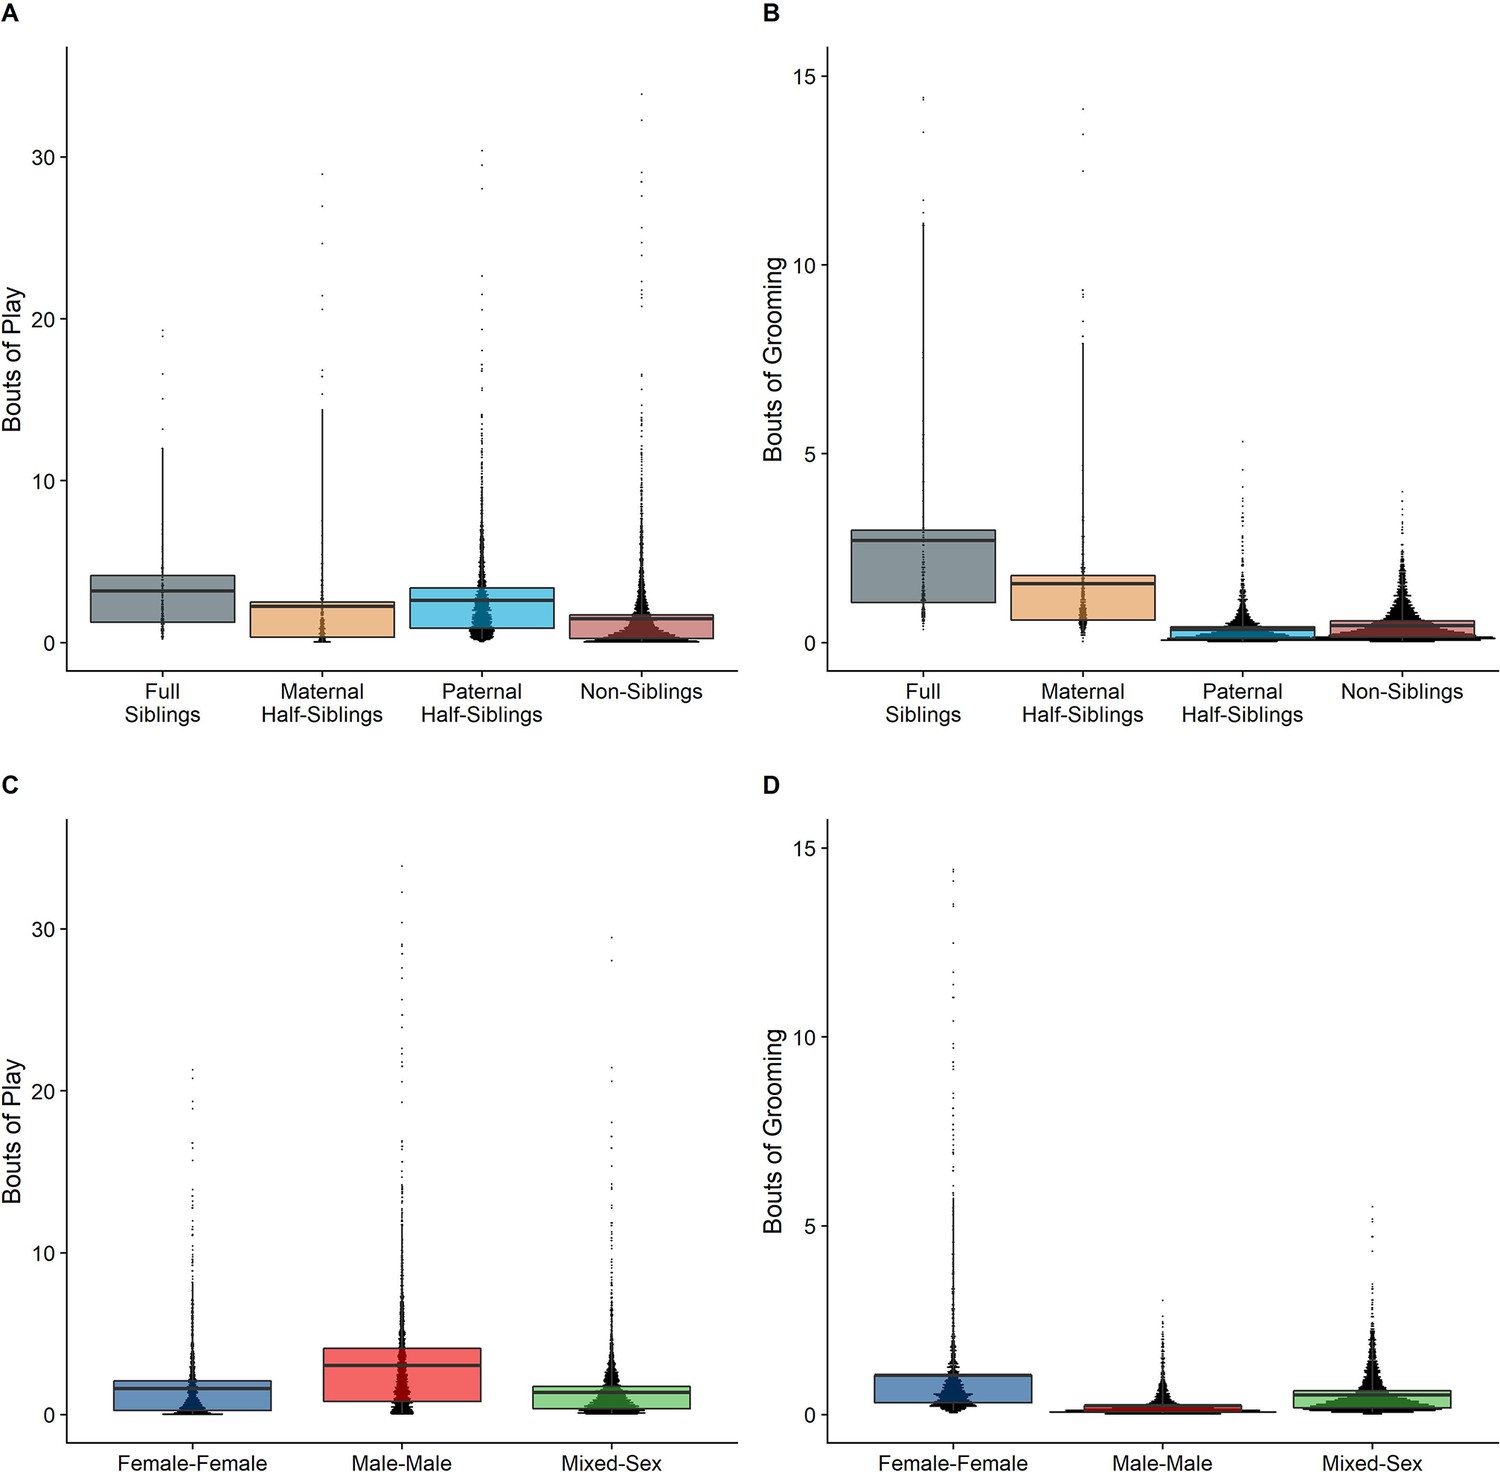
Box and dot plots comparing relatedness categories (A, B) and sex categories (C, D) for play rates (left) and grooming rates (right).
Figure 1—figure supplement 1
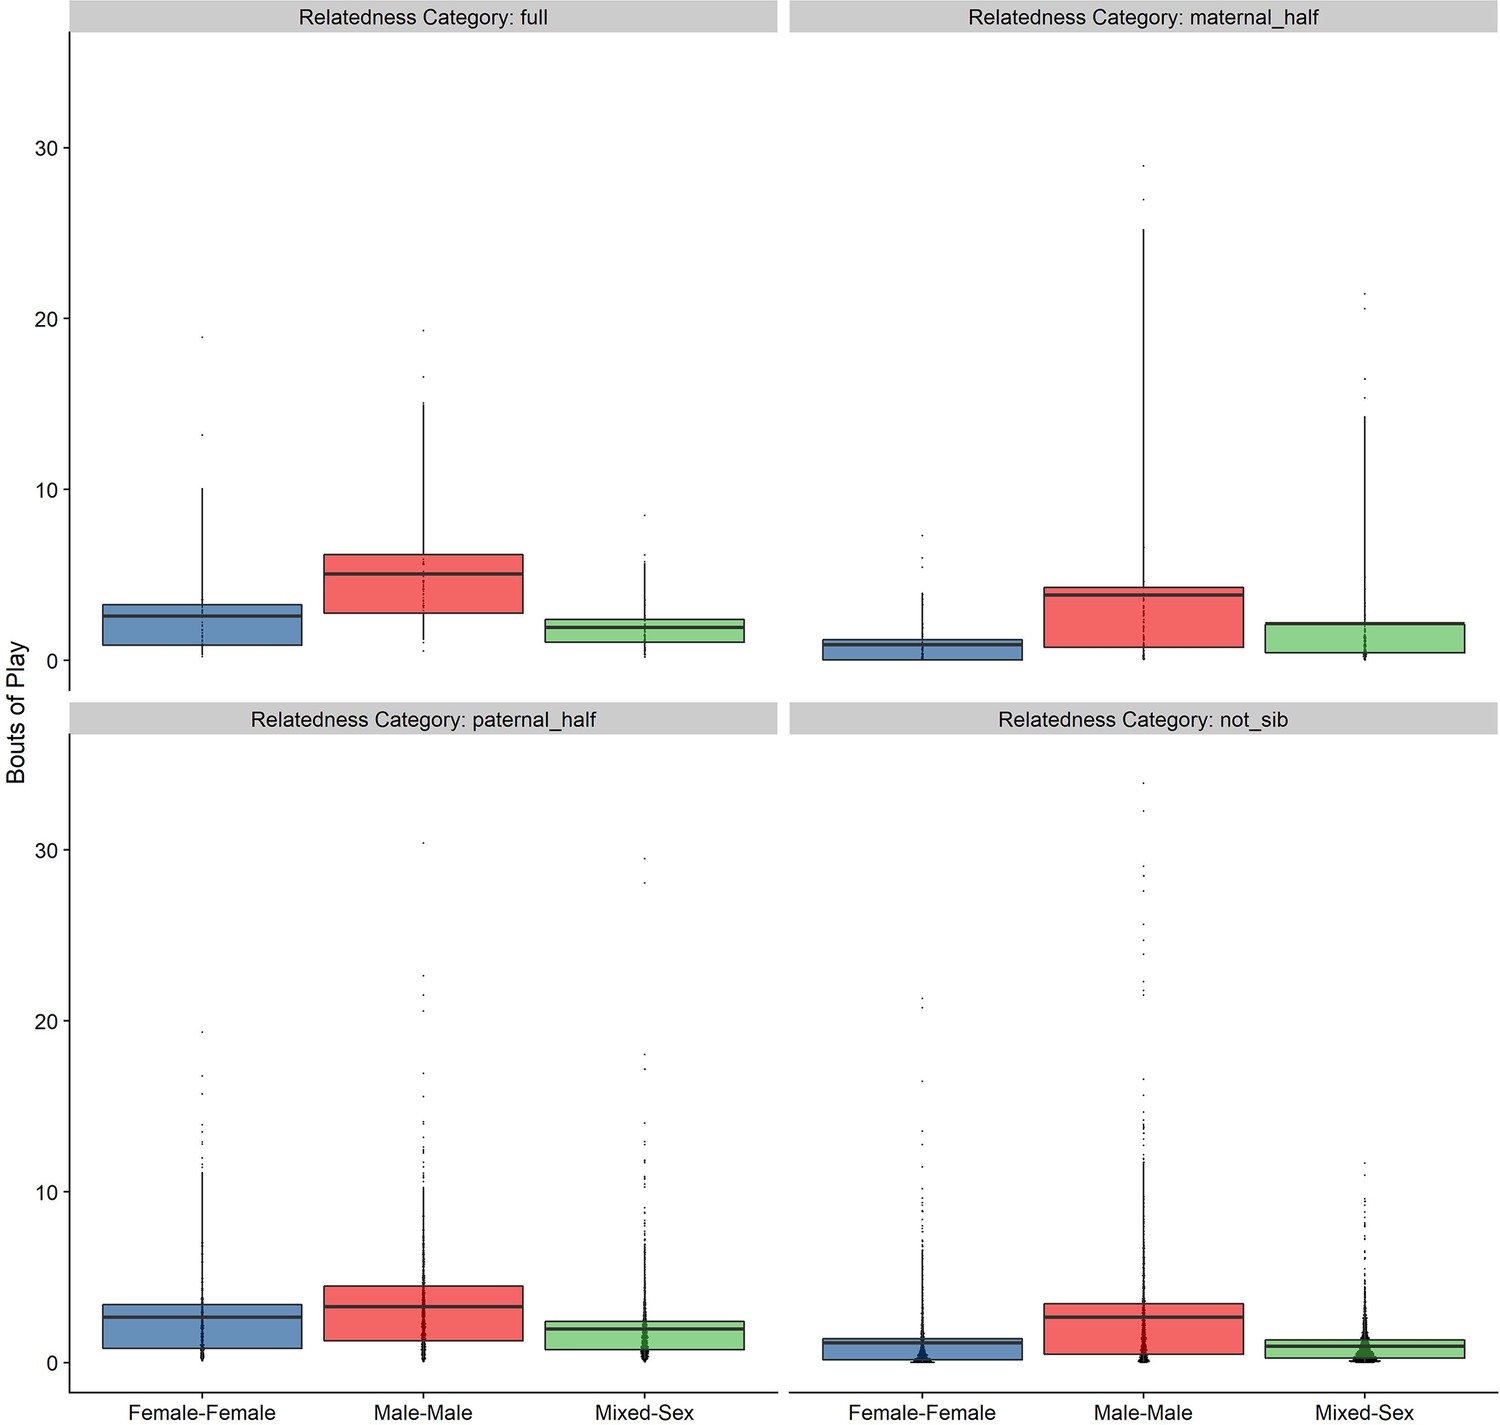
Box and dot plots for play within gorilla dyads that have ‘early life familiarity’ only (n=6724), separated by relatedness and sex category.
Figure 1—figure supplement 2
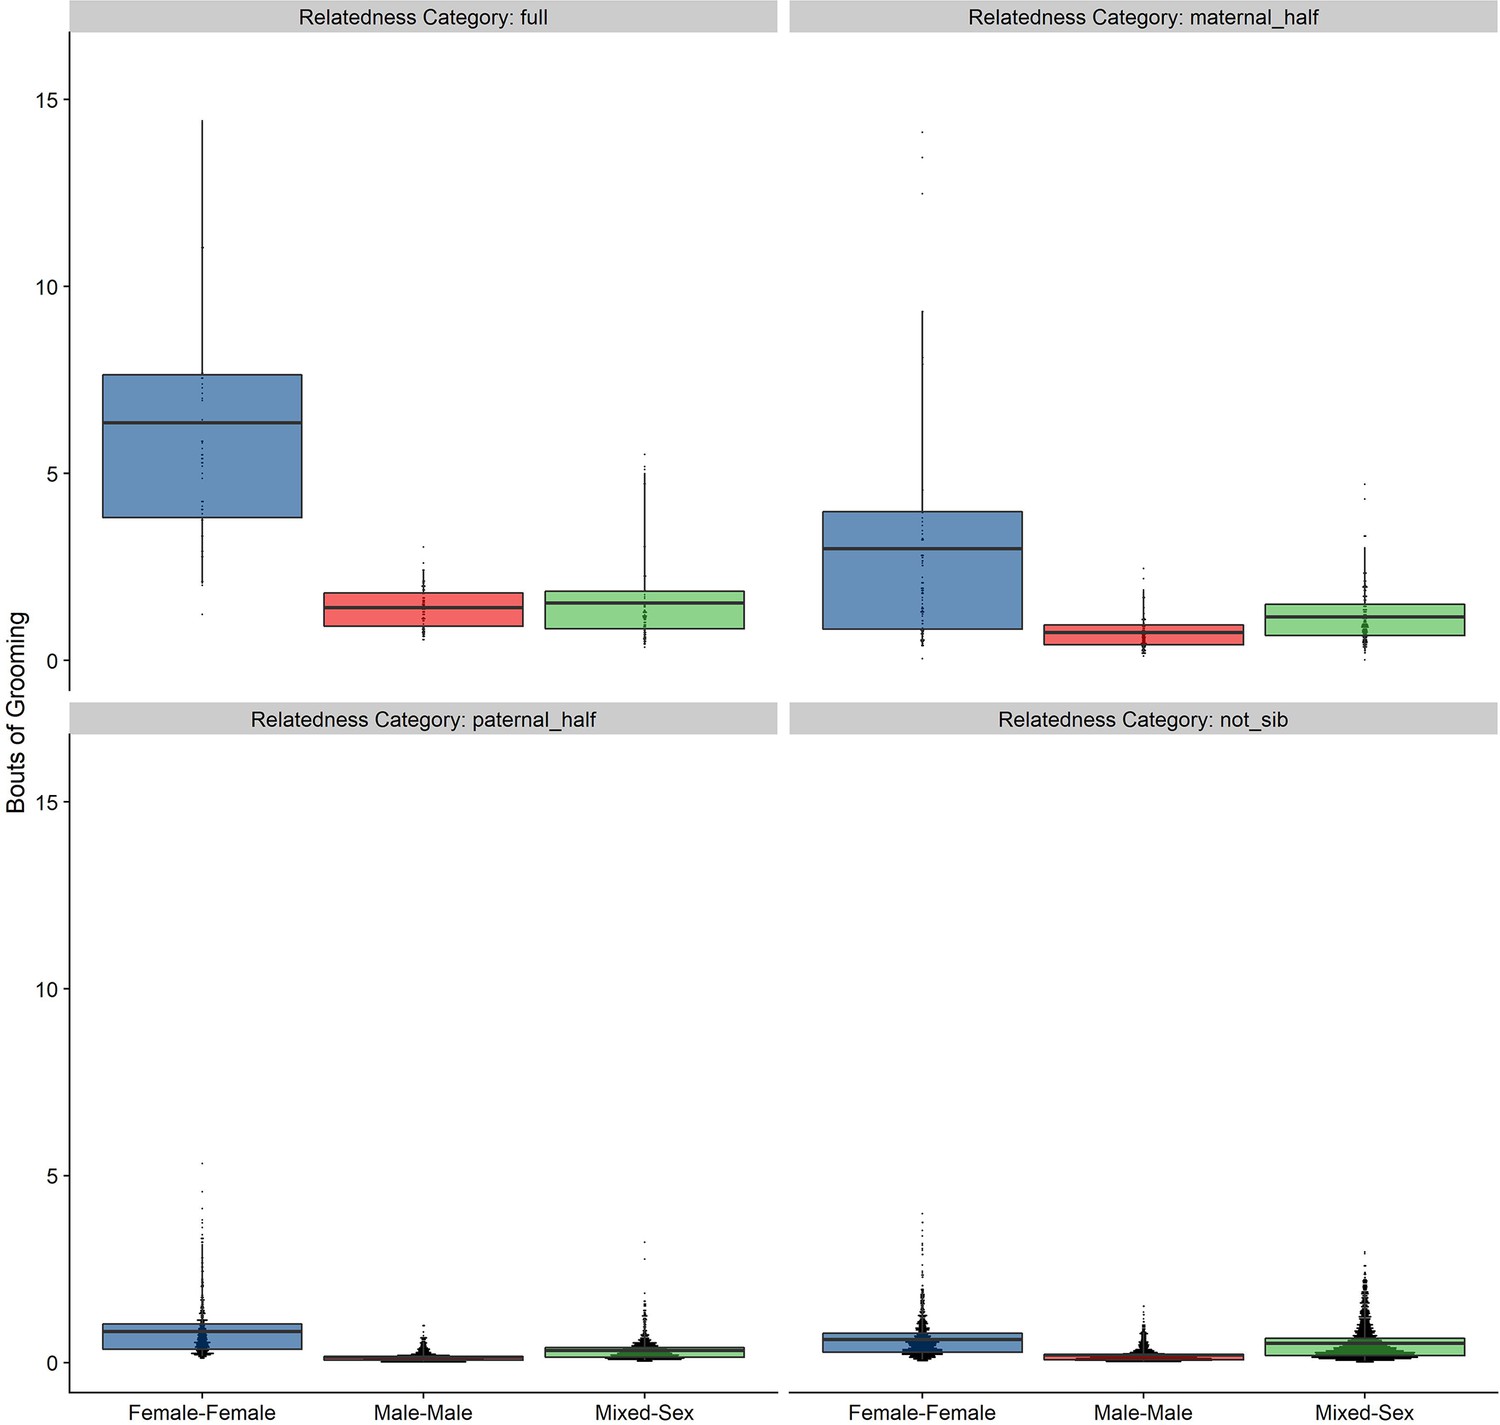
Box and dot plots for grooming within gorilla dyads that have ‘early life familiarity’ only (n=6724), separated by relatedness and sex category.
Figure 2
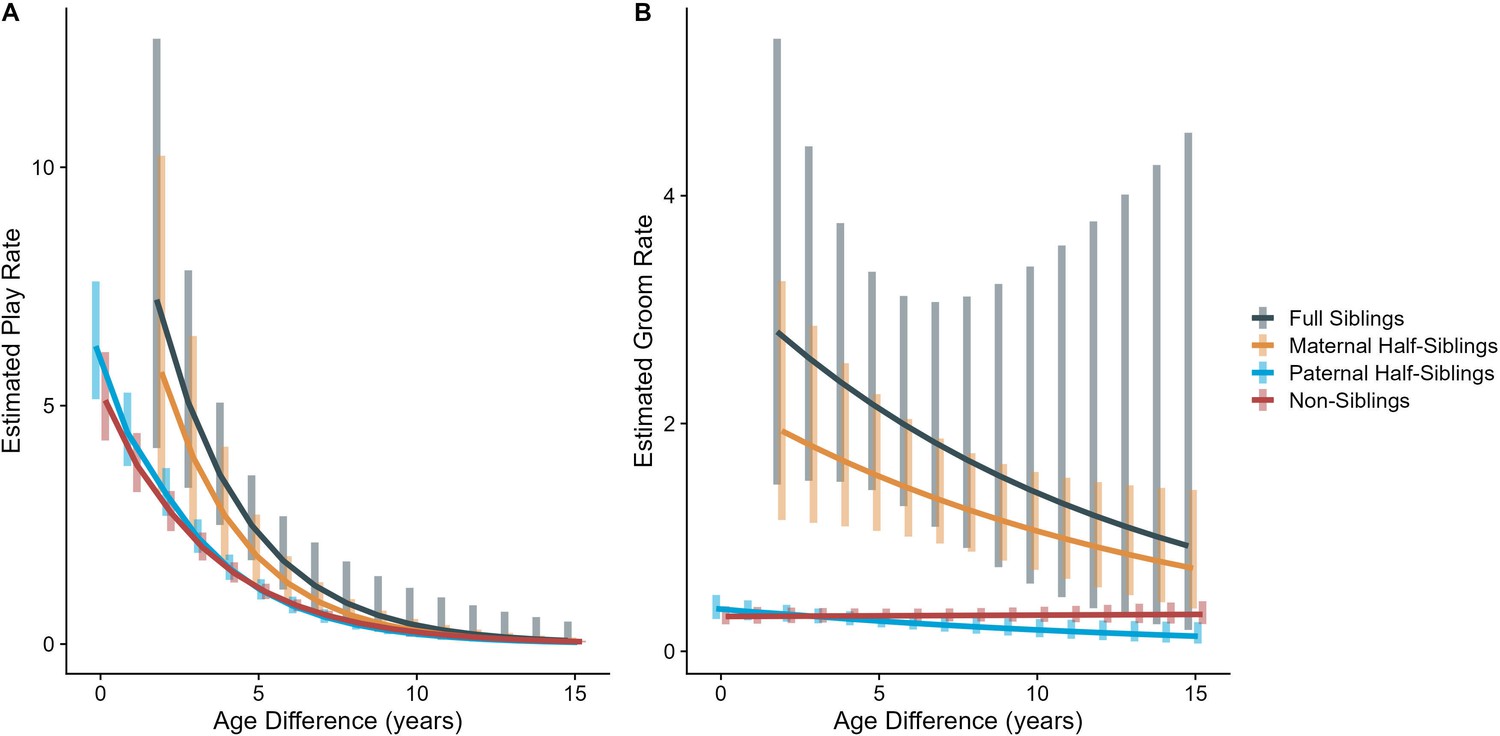
Estimated rates of play (A) and grooming (B) across a range of age differences, separated by relatedness category.
Bars represent 95% CI for rates of behavior at a given age difference.
Figure 3
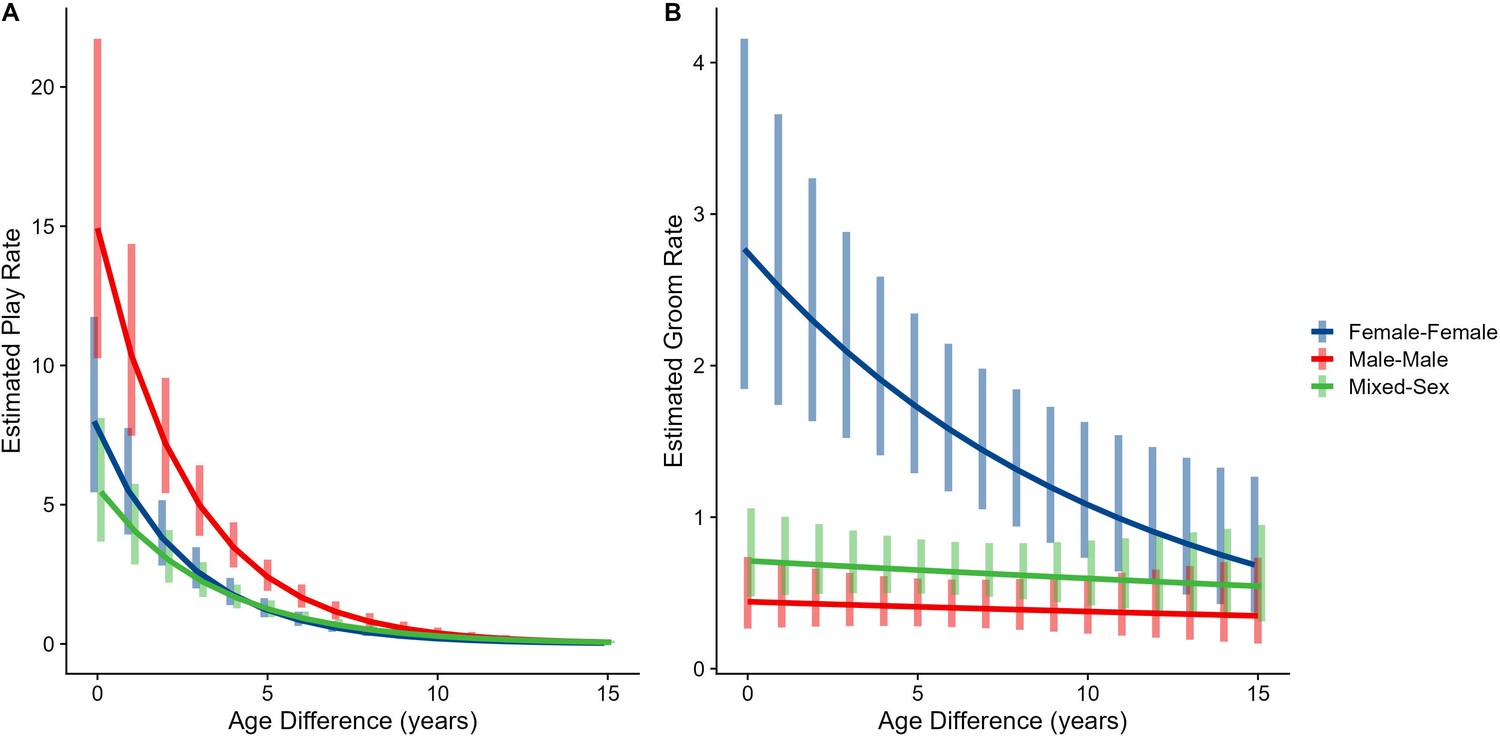
Estimated rates of play (A) and grooming (B) across a range of age differences, separated by sex category.
Bars represent 95% CI for rates of behavior at a given age difference.
Figure 4
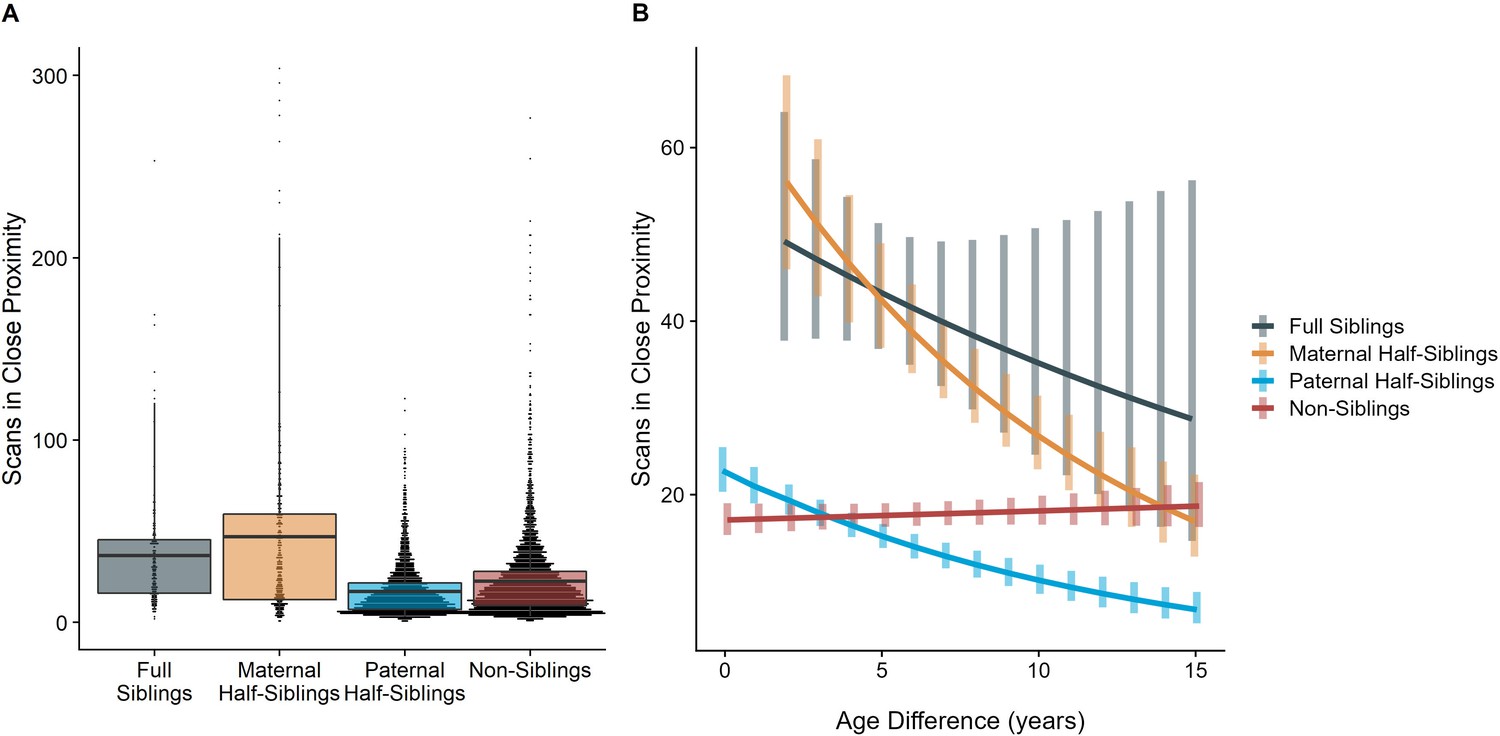
Box and dot plots (A) and estimated trends across a range of age differences (B) for the time gorilla dyads spent in close proximity, separated by relatedness category.
Bars in (B) represent 95% CI for rates of proximity at a given age difference.
Figure 5 with 1 supplement
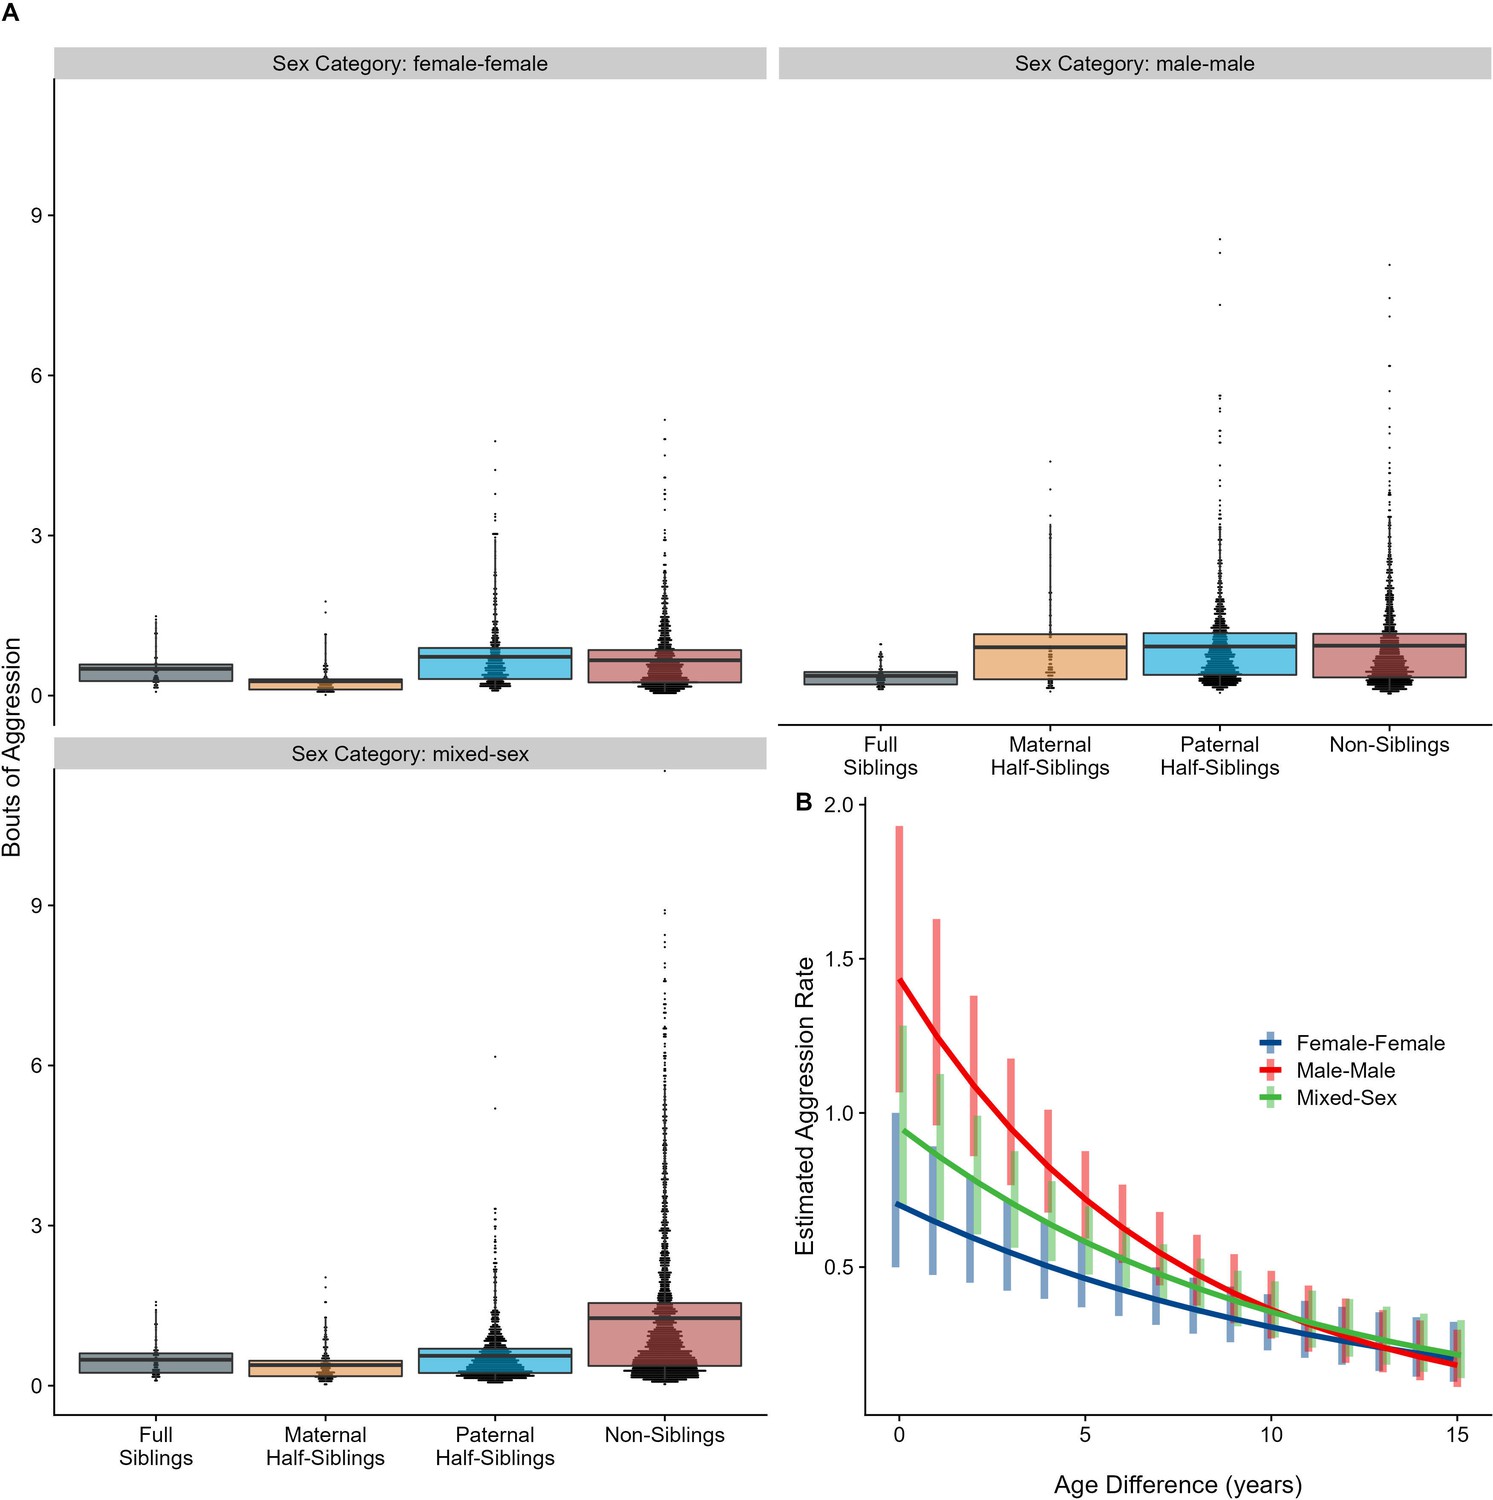
Box and dot plots (A) and estimated trends across a range of age differences (B) for aggression within gorilla dyads, separated by relatedness and sex category.
Bars in (B) represent 95% CI for rates of aggression at a given age difference.
Figure 5—figure supplement 1
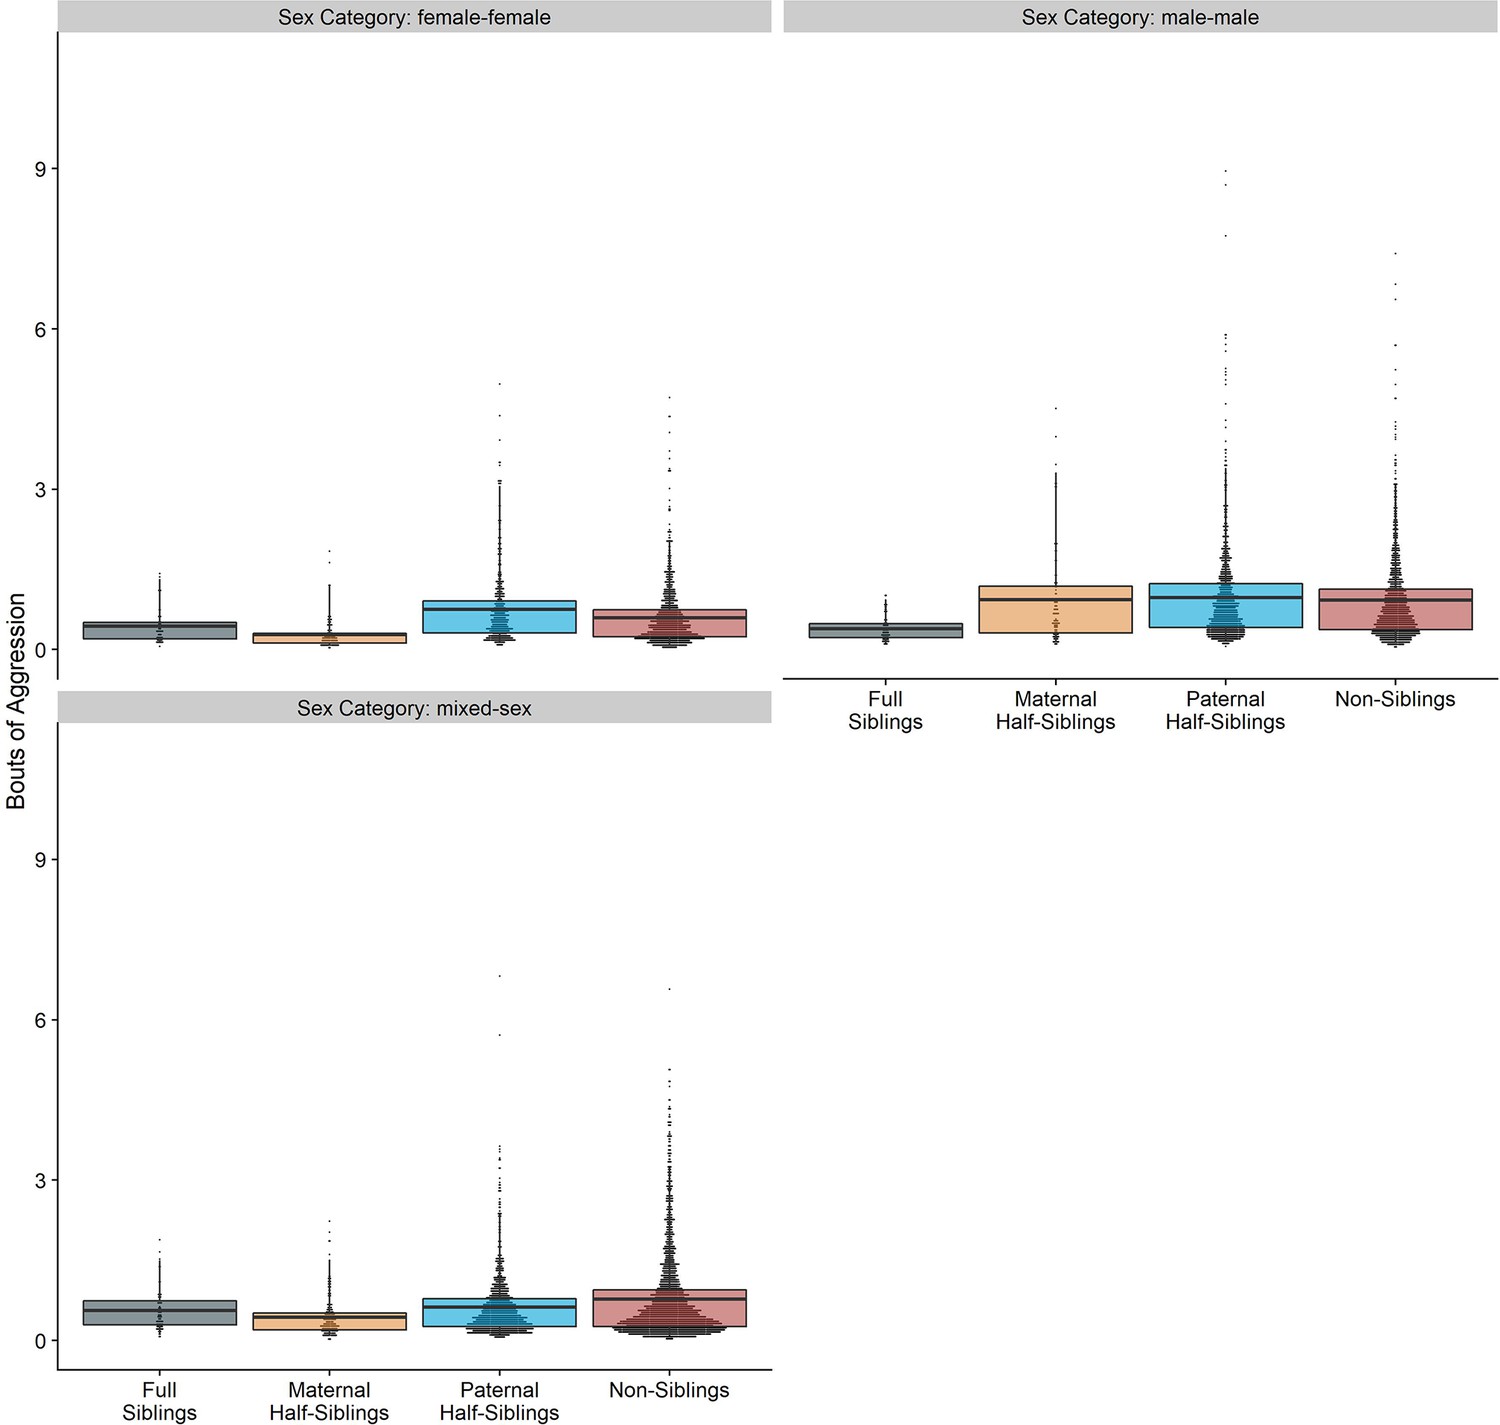
Box and dot plots for aggression within gorilla dyads that have ‘early life familiarity’ only (n=6724), separated by relatedness and sex category.
Appendix 3—figure 1
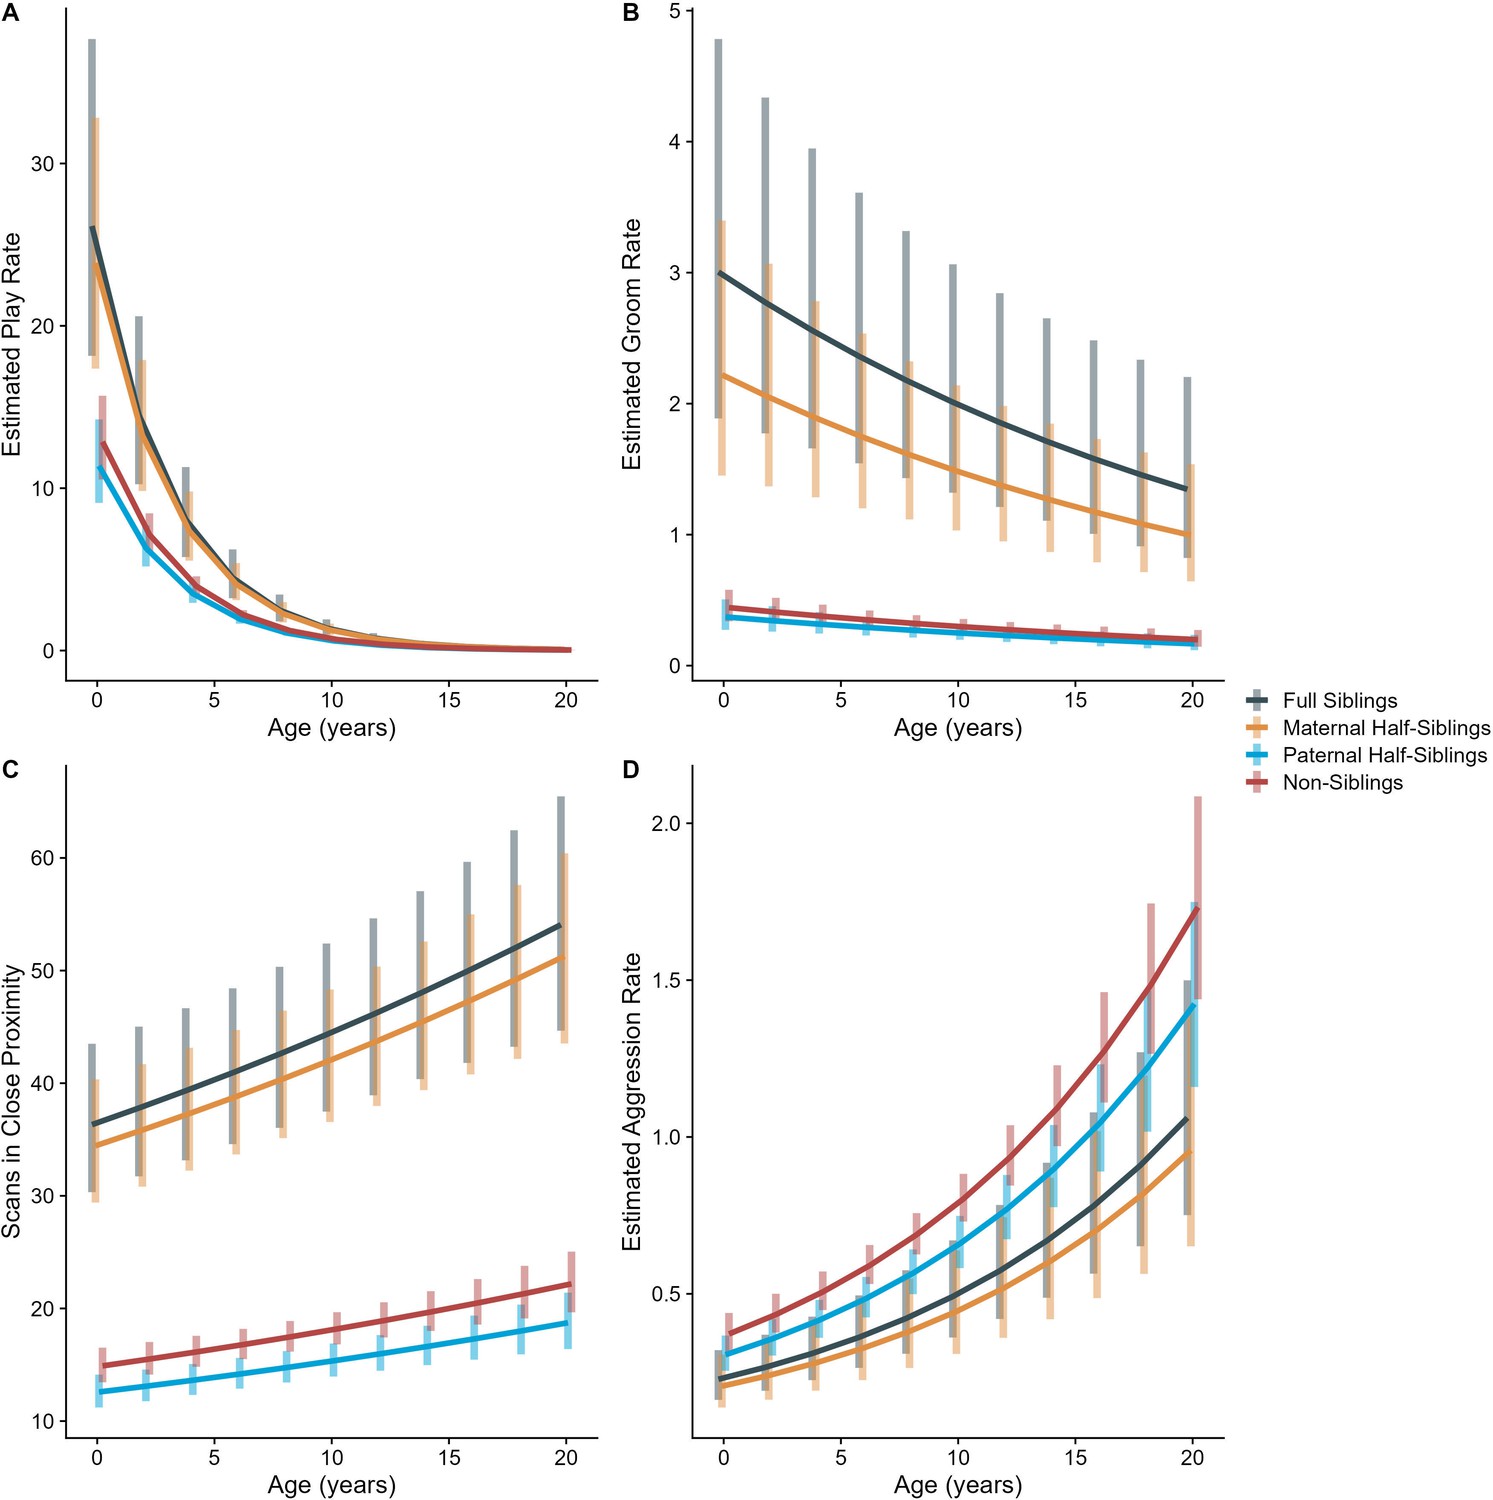
Estimated trends of (A) play, (B) grooming, (C) close proximity, and (D) aggression across average age of gorilla dyads.
Trends adjusted for all parameters listed in Appendix 3—table 1. Bars represent 95% CI for rates of behavior at a given age .
Appendix 4—figure 1
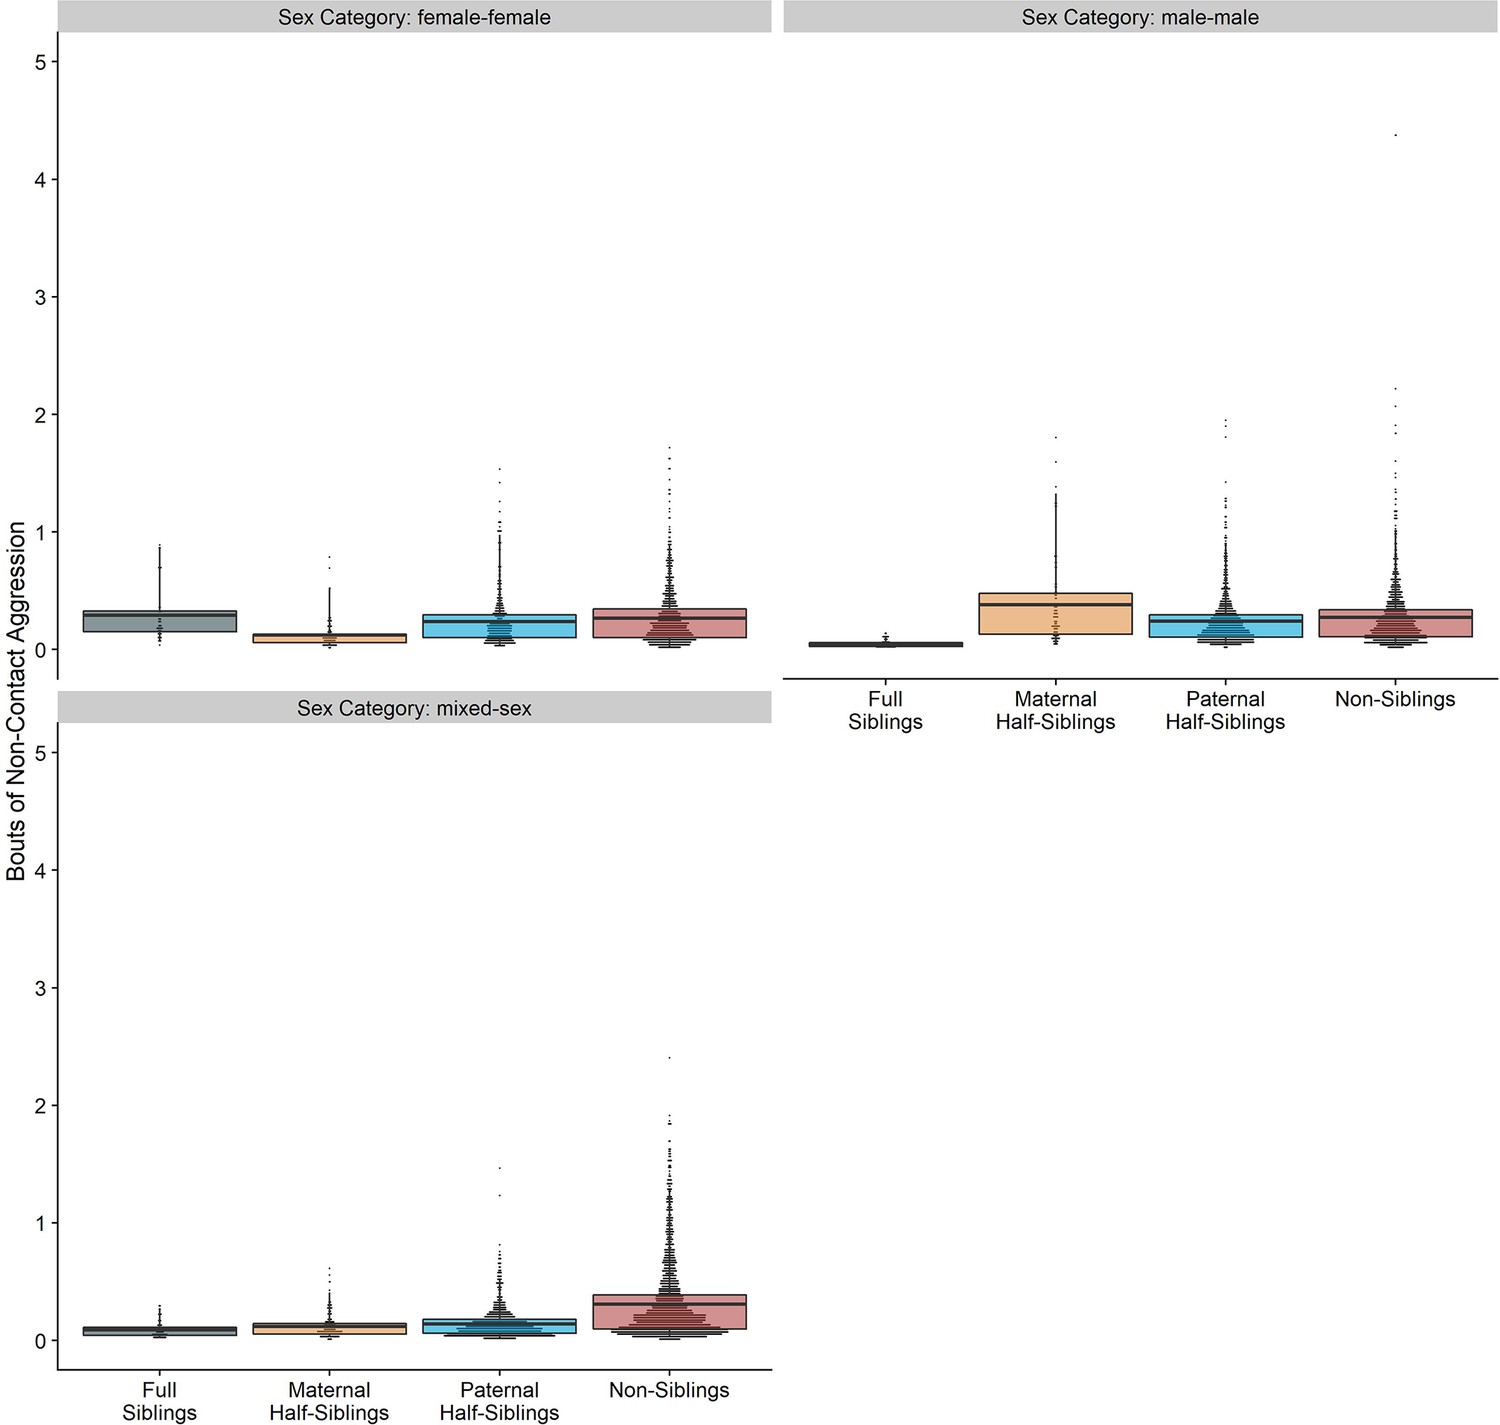
Box and dot plots showing estimated non-contact aggression within gorilla dyads, separated by relatedness and sex category.
Appendix 4—figure 2
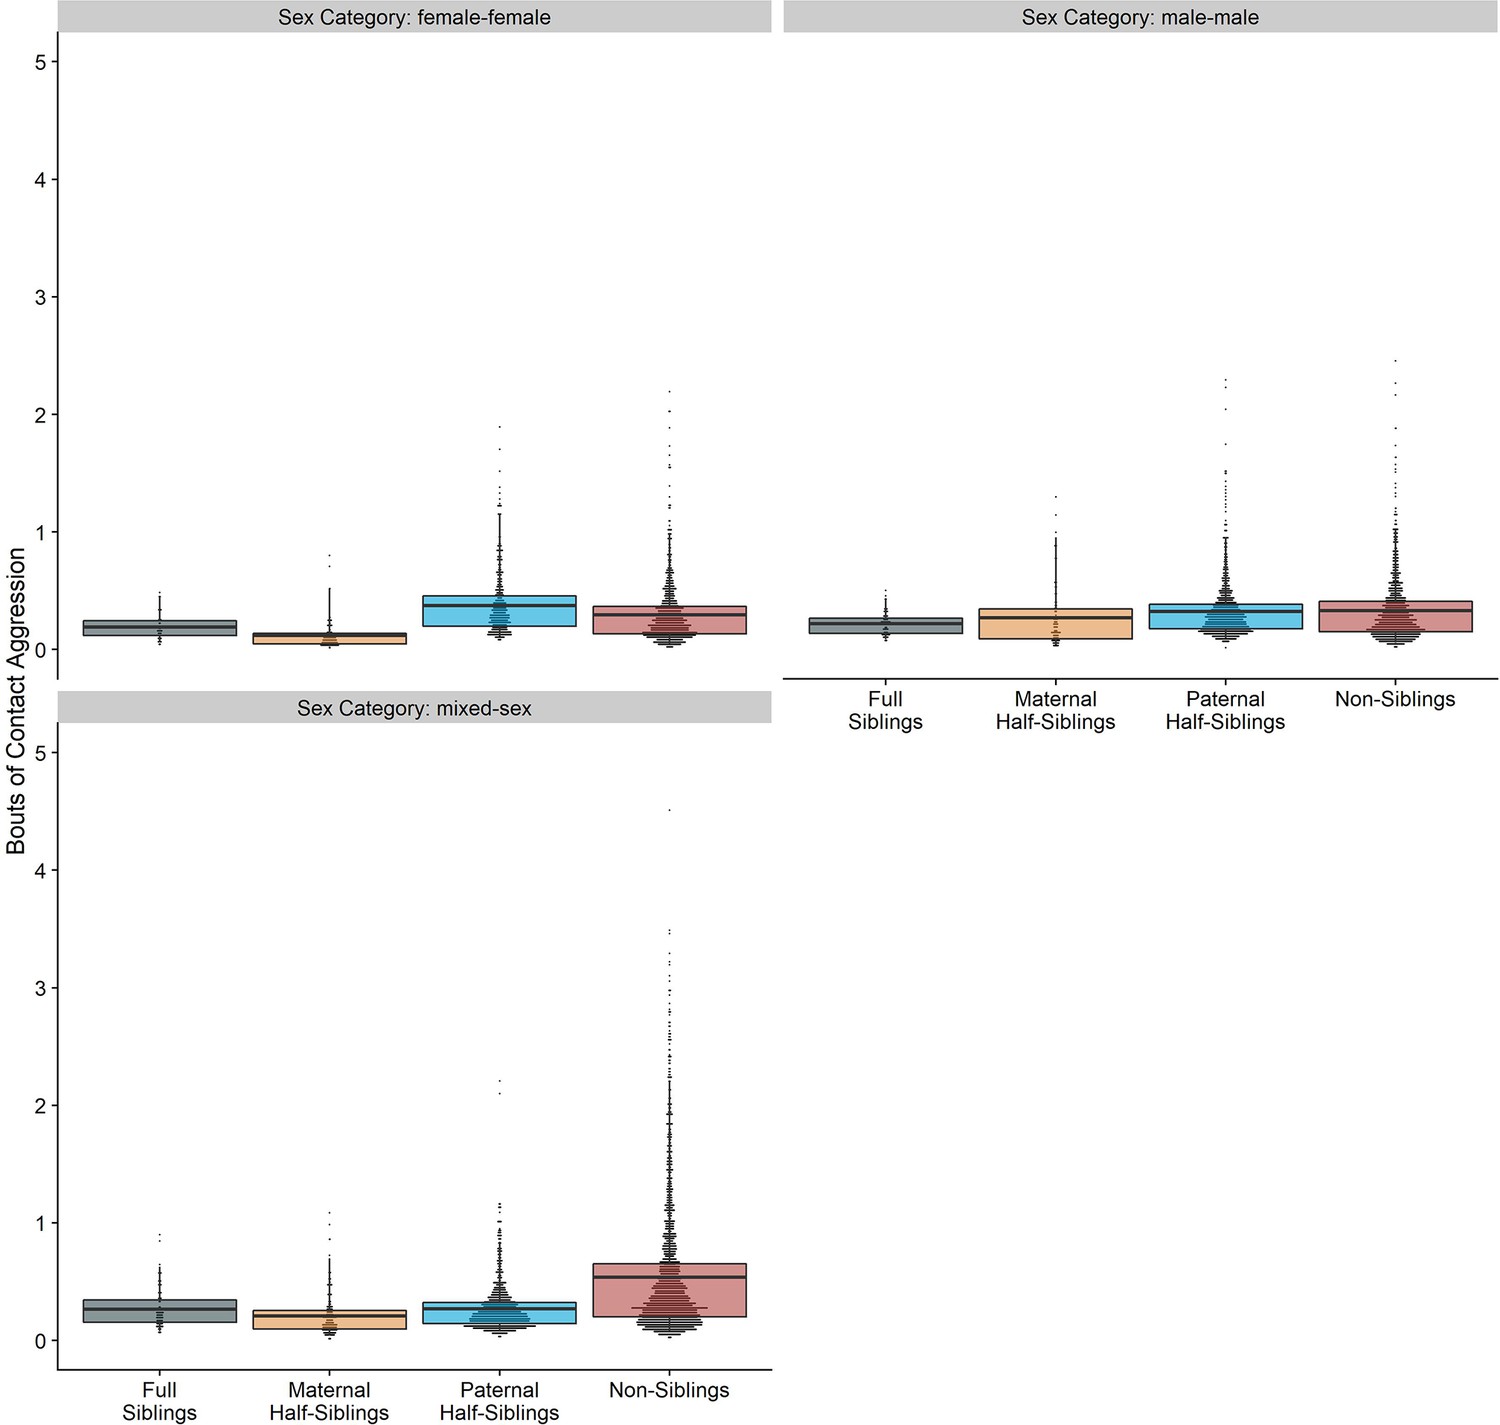
Box and dot plots showing estimated contact aggression within gorilla dyads, separated by relatedness, and sex category.
Tables
Appendix 1—table 1
Omnibus statistics for target parameters.
Effects p<0.05 bolded.
| Effect (early life familiarity only) | ||||||
|---|---|---|---|---|---|---|
| Relatedness | Sex category | Age differences | Rel×sex category | Rel×age diff | Sex ×age diff | |
| Play | F(3, 6682) = 1.61, p = 0.184 | F(2, 6682) = 5.79, p = 0.003 | F(1, 6682) = 167.31, p < 0.001 | F(6, 6682) = 1.06, p = 0.387 | F(3, 6682) = 0.10, p = 0.963 | F(2, 6682) = 3.47, p = 0.031 |
| Grooming | F(3, 6682) = 24.15, p < 0.001 | F(2, 6682) = 3.83, p = 0.022 | F(1, 6682) = 5.28, p = 0.022 | F(6, 6682) = 1.12, p = 0.347 | F(3, 6682) = 0.94, p = 0.419 | F(2, 6682) = 9.56, p < 0.001 |
| Proximity | F(3, 6682) = 43.90, p < 0.001 | F(2, 6682) = 3.58, p = 0.028 | F(1, 6682) = 23.33, p < 0.001 | F(6, 6682) = 0.36, p = 0.904 | F(3, 6682) = 11.56, p < 0.001 | F(2, 6682) = 0.26, p = 0.771 |
| Aggression | F(3, 6682) = 0.18, p = 0.910 | F(2, 6682) = 0.67, p = 0.510 | F(1, 6682) = 34.49, p < 0.001 | F(6, 6682) = 0.97, p = 0.444 | F(3, 6682) = 0.59, p = 0.621 | F(2, 6682) = 4.46, p = 0.012 |
Appendix 1—table 2
Estimated marginal means and standard errors across relatedness and sex categories.
| Relatedness | Sex Category | ||||||
|---|---|---|---|---|---|---|---|
| Full siblings | Maternal half | Paternal half | Non-siblings | Female-female | Male-male | Mixed-sex | |
| Play | 2.35 (0.40) | 1.72 (0.33) | 0.99 (0.09) | 1.33 (0.10) | 1.16 (0.16) | 2.23 (0.26) | 1.36 (0.15) |
| Grooming | 1.94 (0.43) | 1.44 (0.27) | 0.22 (0.03) | 0.27 (0.03) | 1.57 (0.19) | 0.30 (0.05) | 0.56 (0.07) |
| Proximity | 42.5 (3.6) | 41.4 (2.9) | 14.2 (0.7) | 15.5 (0.6) | 30.4 (1.7) | 22.8 (1.4) | 22.4 (1.2) |
| Aggression | 0.41 (0.07) | 0.44 (0.08) | 0.55 (0.03) | 0.59 (0.03) | 0.39 (0.05) | 0.62 (0.06) | 0.48 (0.04) |
Appendix 2—table 1
Omnibus statistics for target parameters.
Effects p<0.05 bolded.
| Effect (strict relatedness categories) | ||||||
|---|---|---|---|---|---|---|
| Relatedness | Sex category | Age differences | Rel×sex category | Rel×age diff | Sex ×age diff | |
| Play | F(3, 7586) = 1.23, p = 0.296 | F(2, 7596) = 2.65,p = 0.071 | F(1, 7586) = 121.42, p < 0.001 | F(6, 7596) = 2.60, p = 0.016 | F(3, 7586) = 1.01, p = 0.387 | F(2, 7596) = 5.66, p = 0.003 |
| Grooming | F(3, 7586) = 15.28, p < 0.001 | F(2, 7596) = 2.82, p = 0.060 | F(1, 7586) = 3.74, p = 0.053 | F(6, 7596) = 1.36, p = 0.229 | F(3, 7586) = 2.73, p = 0.043 | F(2, 7596) = 8.26, p < 0.001 |
| Proximity | F(3, 7586) = 31.67, p < 0.001 | F(2, 7596) = 2.34, p = 0.097 | F(1, 7596) = 16.75, p < 0.001 | F(6, 7596) = 1.30, p = 0.255 | F(3, 7586) = 18.83, p < 0.001 | F(2, 7596) = 0.25, p = 0.778 |
| Aggression | F(3, 7586) = 0.14, p = 0.936 | F(2, 7596) = 0.19, p = 0.825 | F(1, 7596) = 21.96, p < 0.001 | F(6, 7596) = 2.17, p = 0.043 | F(3, 7586) = 0.16, p = 0.927 | F(2, 7596) = 5.21, p = 0.006 |
Appendix 2—table 2
Estimated marginal means and standard errors across relatedness and sex categories.
| Relatedness | Sex category | ||||||
|---|---|---|---|---|---|---|---|
| Full siblings | Maternal half | Paternal half | Non-siblings | Female-female | Male-male | Mixed-sex | |
| Play | 2.35 (0.43) | 2.16 (0.43) | 1.08 (0.11) | 1.04 (0.08) | 1.23 (0.17) | 2.45 (0.31) | 1.22 (0.16) |
| Grooming | 2.19 (0.46) | 1.67 (0.41) | 0.26 (0.03) | 0.31 (0.03) | 1.55 (0.19) | 0.39 (0.08) | 0.68 (0.09) |
| Proximity | 43.4 (3.7) | 42.1 (4.0) | 15.1 (0.7) | 17.7 (0.7) | 31.4 (1.8) | 23.5 (1.6) | 25.0 (1.5) |
| Aggression | 0.47 (0.08) | 0.62 (0.14) | 0.61 (0.04) | 0.75 (0.04) | 0.53 (0.07) | 0.70 (0.09) | 0.60 (0.06) |
Appendix 3—table 1
Omnibus statistics for target parameters.
Effects p<0.05 bolded.
| Effect (average age adjusted) | |||||||
|---|---|---|---|---|---|---|---|
| Relatedness | Sex category | Age differences | Average age | Rel.×sex category | Rel.×age diff. | Sex ×age diff. | |
| Play | F(3, 7782) = 5.92, p < 0.001 | F(2, 7782) = 6.86, p = 0.001 | (1, 7782) = 105.95, p < 0.001 | F(1, 7782) = 859.52, p < 0.001 | F(6, 7782) = 1.22, p = 0.294 | F(3, 7782) = 1.94, p = 0.121 | F(2, 7782) = 8.99, p < 0.001 |
| Grooming | F(3, 7782) = 23.14, p < 0.001 | F(2, 7782) = 5.74, p = 0.003 | F(1, 7782) = 3.20, p = 0.074 | F(1, 7782) = 11.83, p < 0.001 | F(6, 7782) = 2.16, p = 0.044 | F(3, 7782) = 3.31, p = 0.019 | F(2, 7782) = 6.68, p = 0.001 |
| Proximity | F(3, 7782) = 39.59, p < 0.001 | F(2, 7782) = 3.79, p = 0.023 | F(1, 7782) = 31.58, p < 0.001 | F(1, 7782) = 23.46, p < 0.001 | F(6, 7782) = 1.14, p = 0.339 | F(3, 7782) = 25.41, p < 0.001 | F(2, 7782) = 0.10, p = 0.907 |
| Aggression | F(3, 7782) = 0.24, p = 0.871 | F(2, 7782) = 0.35, p = 0.703 | F(1, 7782) = 40.38, p < 0.001 | F(1, 7782) = 103.42, p < 0.001 | F(6, 7782) = 1.55, p = 0.158 | F(3, 7782) = 0.11, p = 0.957 | F(2, 7782) = 4.73, p = 0.009 |
Appendix 3—table 2
Estimated marginal means and standard errors across relatedness and sex categories, adjusting for average age.
| Relatedness | Sex category | ||||||
|---|---|---|---|---|---|---|---|
| Full siblings | Maternal half | Paternal half | Non-siblings | Female-female | Male-male | Mixed-sex | |
| Play | 1.77 (0.29) | 1.61 (0.22) | 0.77 (0.06) | 0.87 (0.05) | 0.74 (0.08) | 2.20 (0.21) | 1.00 (0.10 ) |
| Grooming | 2.08 (0.45) | 1.54 (0.29) | 0.26 (0.03) | 0.31 (0.03) | 1.61 (0.19) | 0.36 (0.06) | 0.62 (0.08) |
| Proximity | 44.6 (4.3) | 41.3 (2.9) | 15.1 (0.7) | 17.9 (0.7) | 31.6 (1.7) | 24.1 (1.5) | 24.2 (1.4) |
| Aggression | 0.46 (0.07) | 0.42 (0.08) | 0.62 (0.04) | 0.75 (0.04) | 0.45 (0.05) | 0.66 (0.07) | 0.55 (0.05) |
Appendix 4—table 1
Omnibus statistics for target parameters.
Effects p<0.05 bolded.
| Effect (separate aggression categories) | ||||||
|---|---|---|---|---|---|---|
| Relatedness | Sex category | Age differences | Rel.×sex category | Rel.×age diff. | Sex ×age diff. | |
| Contact aggression | F(3, 7783) = 2.72, p = 0.042 | F(2, 7596) = 1.02, p = 0.359 | F(1, 7596) = 14.29, p < 0.001 | F(6, 7596) = 2.11, p = 0.049 | F(3, 7586) = 0.72, p = 0.541 | F(2, 7596) = 2.19, p = 0.113 |
| Non-contact aggression | F(3, 7783) = 0.28, p = 0.834 | F(2, 7596) = 2.71, p = 0.067 | F(1, 7596) = 7.11, p = 0.008 | F(6, 7596) = 2.09, p = 0.052 | F(3, 7586) = 0.11, p = 0.955 | F(2, 7596) = 1.33, p = 0.264 |
Appendix 4—table 2
Estimated marginal means and standard errors across relatedness and sex categories.
| Relatedness | Sex Category | ||||||
|---|---|---|---|---|---|---|---|
| Full siblings | Maternal half | Paternal half | Non-siblings | Female - female | Male - male | Mixed - sex | |
| Contact aggression | 0.25 (0.04) | 0.19 (0.05) | 0.31 (0.02) | 0.35 (0.02) | 0.22 (0.03) | 0.29 (0.04) | 0.30 (0.03) |
| Non-contact aggression | 0.12 (0.04) | 0.18 (0.05) | 0.18 (0.02) | 0.23 (0.02) | 0.21 (0.03) | 0.18 (0.03) | 0.14 (0.02) |
Additional files
Download links
A two-part list of links to download the article, or parts of the article, in various formats.
Downloads (link to download the article as PDF)
Open citations (links to open the citations from this article in various online reference manager services)
Cite this article (links to download the citations from this article in formats compatible with various reference manager tools)
Mountain gorillas maintain strong affiliative biases for maternal siblings despite high male reproductive skew and extensive exposure to paternal kin
eLife 11:e80820.
https://doi.org/10.7554/eLife.80820


