eRNA profiling uncovers the enhancer landscape of oesophageal adenocarcinoma and reveals new deregulated pathways
- School of Biological Sciences, Faculty of Biology, Medicine and Health, University of Manchester, United Kingdom
Figures
Figure 1 with 1 supplement
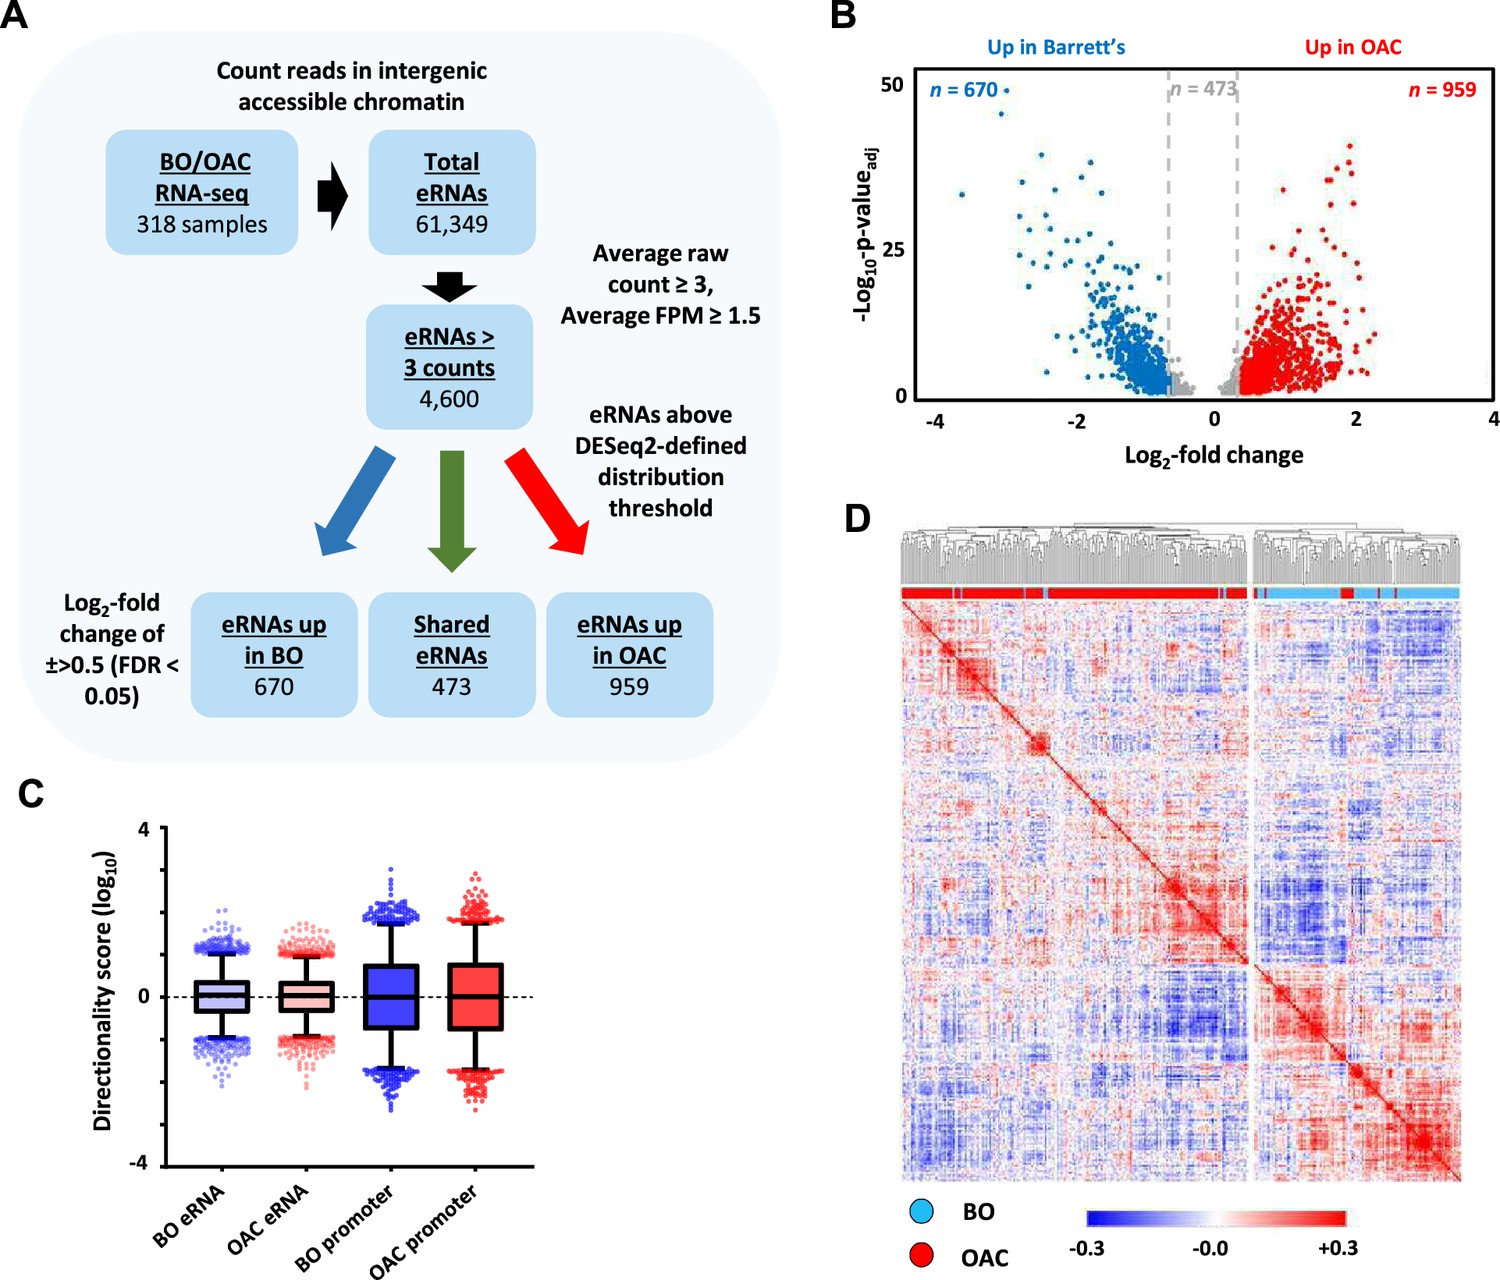
Identification of enhancer transcription in oesophageal adenocarcinoma (OAC) and Barrett’s patients.
(A) Enhancer RNA (eRNA) identification strategy. The numbers of putative eRNAs identified at each stage are indicated. (B) Volcano plot displaying the differentially expressed (±Log2FC 0.5,<padj = 0.05) eRNAs (n = 2102). (C) Directionality scores for Barrett’s oesophagus (BO)- or OAC-specific eRNAs compared to promoters. (D) Pearson’s correlation and hierarchical clustering of BO (n = 108) and OAC (n = 210) patient tissue total RNA-seq samples according to row z-score normalised expression levels in the 4600 eRNA regions. See also Figure 1—figure supplement 1.
Figure 1—figure supplement 1

Identification of enhancer transcription in Barrett’s oesophagus (BO) and oesophageal adenocarcinoma (OAC) patients.
(A) Diagram of the sites of transcription considered for enhancer RNA (eRNA) analysis (bracketed). Total RNA-seq reads were integrated with intergenic regions of accessible chromatin (highlighted) at least 500 bp downstream/2 kb upstream of genes. (B) RNA-seq signal in BO (n = 108) and OAC (n = 210) patient tissue total RNA-seq samples plotted in a strand-specific manner across a 1 kb region centred on the 2102 eRNA containing regions (left) or a 2 kb region centred on 3030 promoter regions (right). Data are normalised for total number of reads. (C) Pearson’s correlation and hierarchical clustering of BO (n = 108) and OAC (n = 210) patient tissue total RNA-seq samples (OCCAMs) according to row z-score normalised gene expression levels. (D) Pearson’s correlation and hierarchical clustering of BO (n = 13) and OAC (n = 13) patient tissue total RNA-seq samples (Maag et al., 2017) according to row z-score normalised expression levels in the 4600 eRNA regions.
Figure 2 with 3 supplements
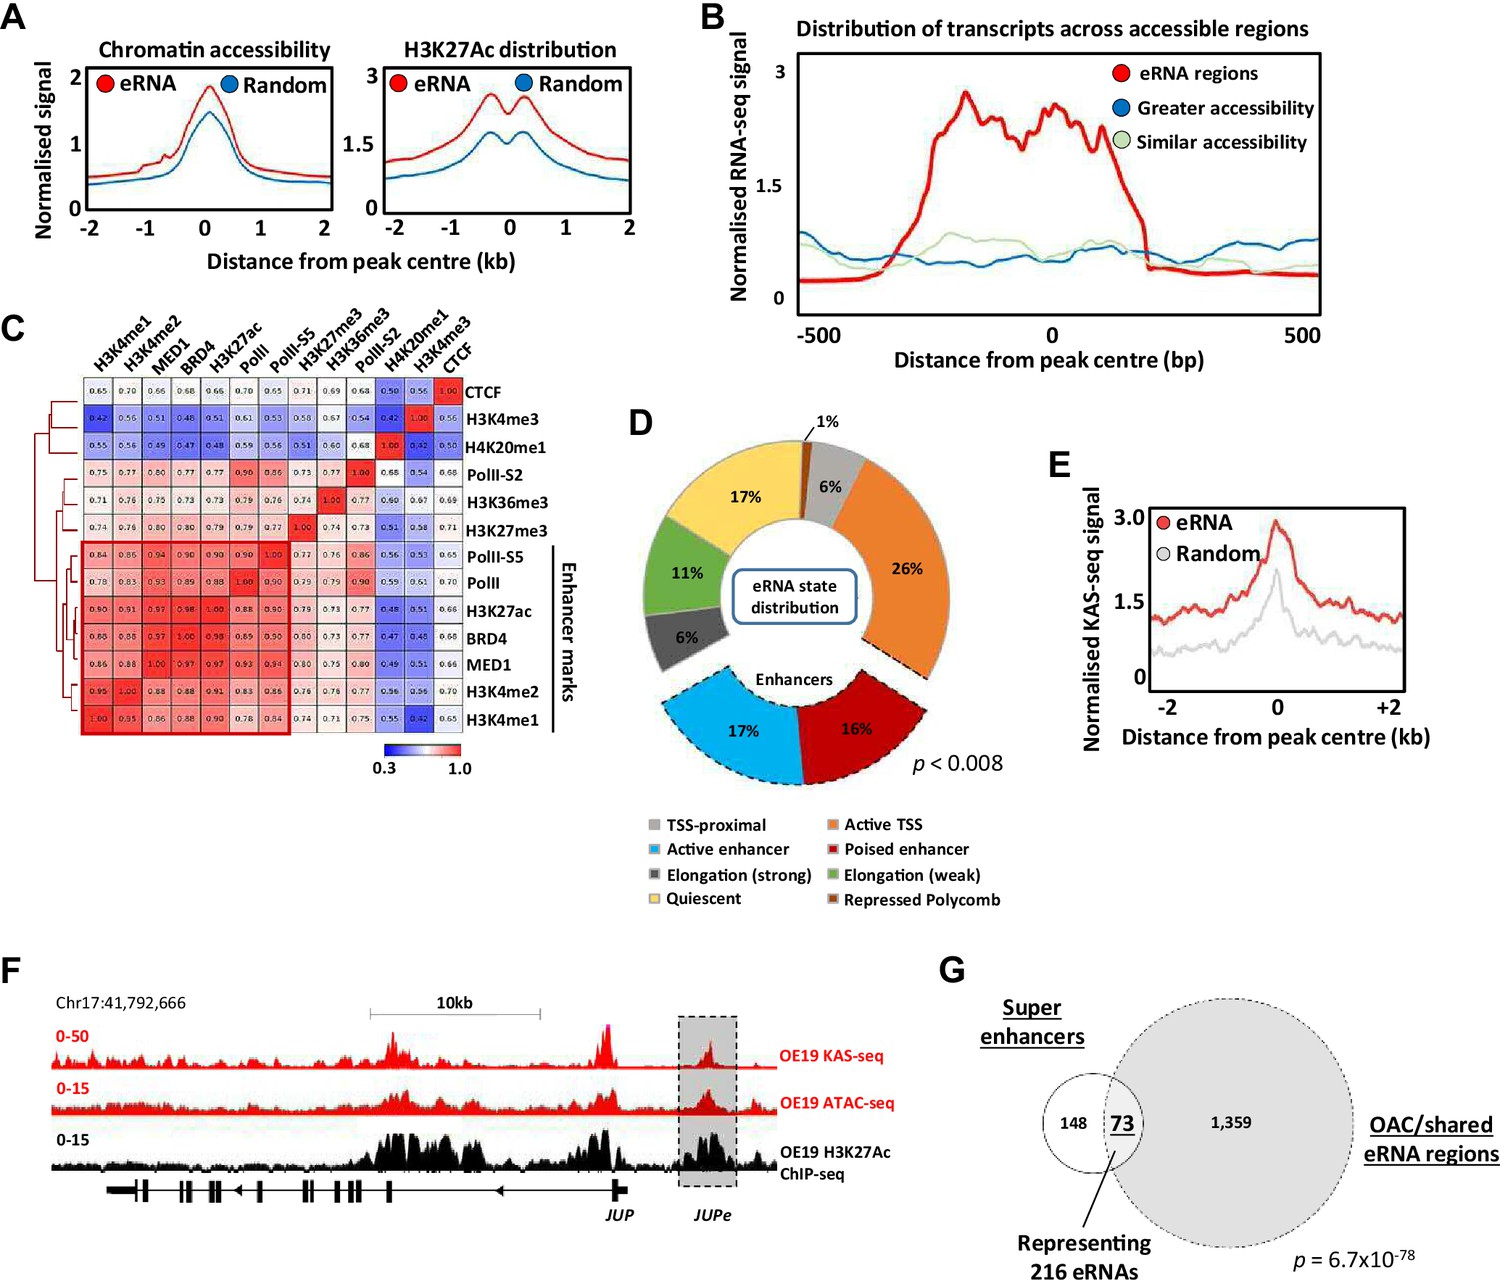
Putative enhancer RNAs (eRNAs) are associated with enhancer-like genomic regions.
(A) Metaplots of patient tissue chromatin accessibility (left) and OE19 cell H3K27ac ChIP-seq signal (right) at all 4600 eRNA regions compared to 4600 random regions of accessible chromatin. (B) Distribution of transcription at 4600 eRNA regions compared to 4600 randomly selected regions of similar or greater chromatin accessibility (regions shown as peak centre ±0.5 kb). (C) Pearson’s correlation and hierarchical clustering of CUT&Tag signal at 4600 eRNA regions for various chromatin-associated factors. (D) Distribution of ChromHMM emission states for 4600 eRNA regions. (E) Metaplots of KAS-seq signal in OE19 cells at 4600 eRNA regions compared to 4600 random regions of accessible chromatin. (F) Genome browser view of OE19 KAS-seq, OE19 ATAC-seq data, and OE19 H3K27ac ChIP-seq at the JUP locus with the JUPe eRNA highlighted. (G) Venn diagram of overlap between 221 high-confidence intergenic super enhancers and 1432 eRNAs (specific to oesophageal adenocarcinoma [OAC] or shared with Barrett’s oesophagus (BO) eRNA; p-value is shown; hypergeometric test). See also Figure 2—figure supplements 1–3.
Figure 2—figure supplement 1
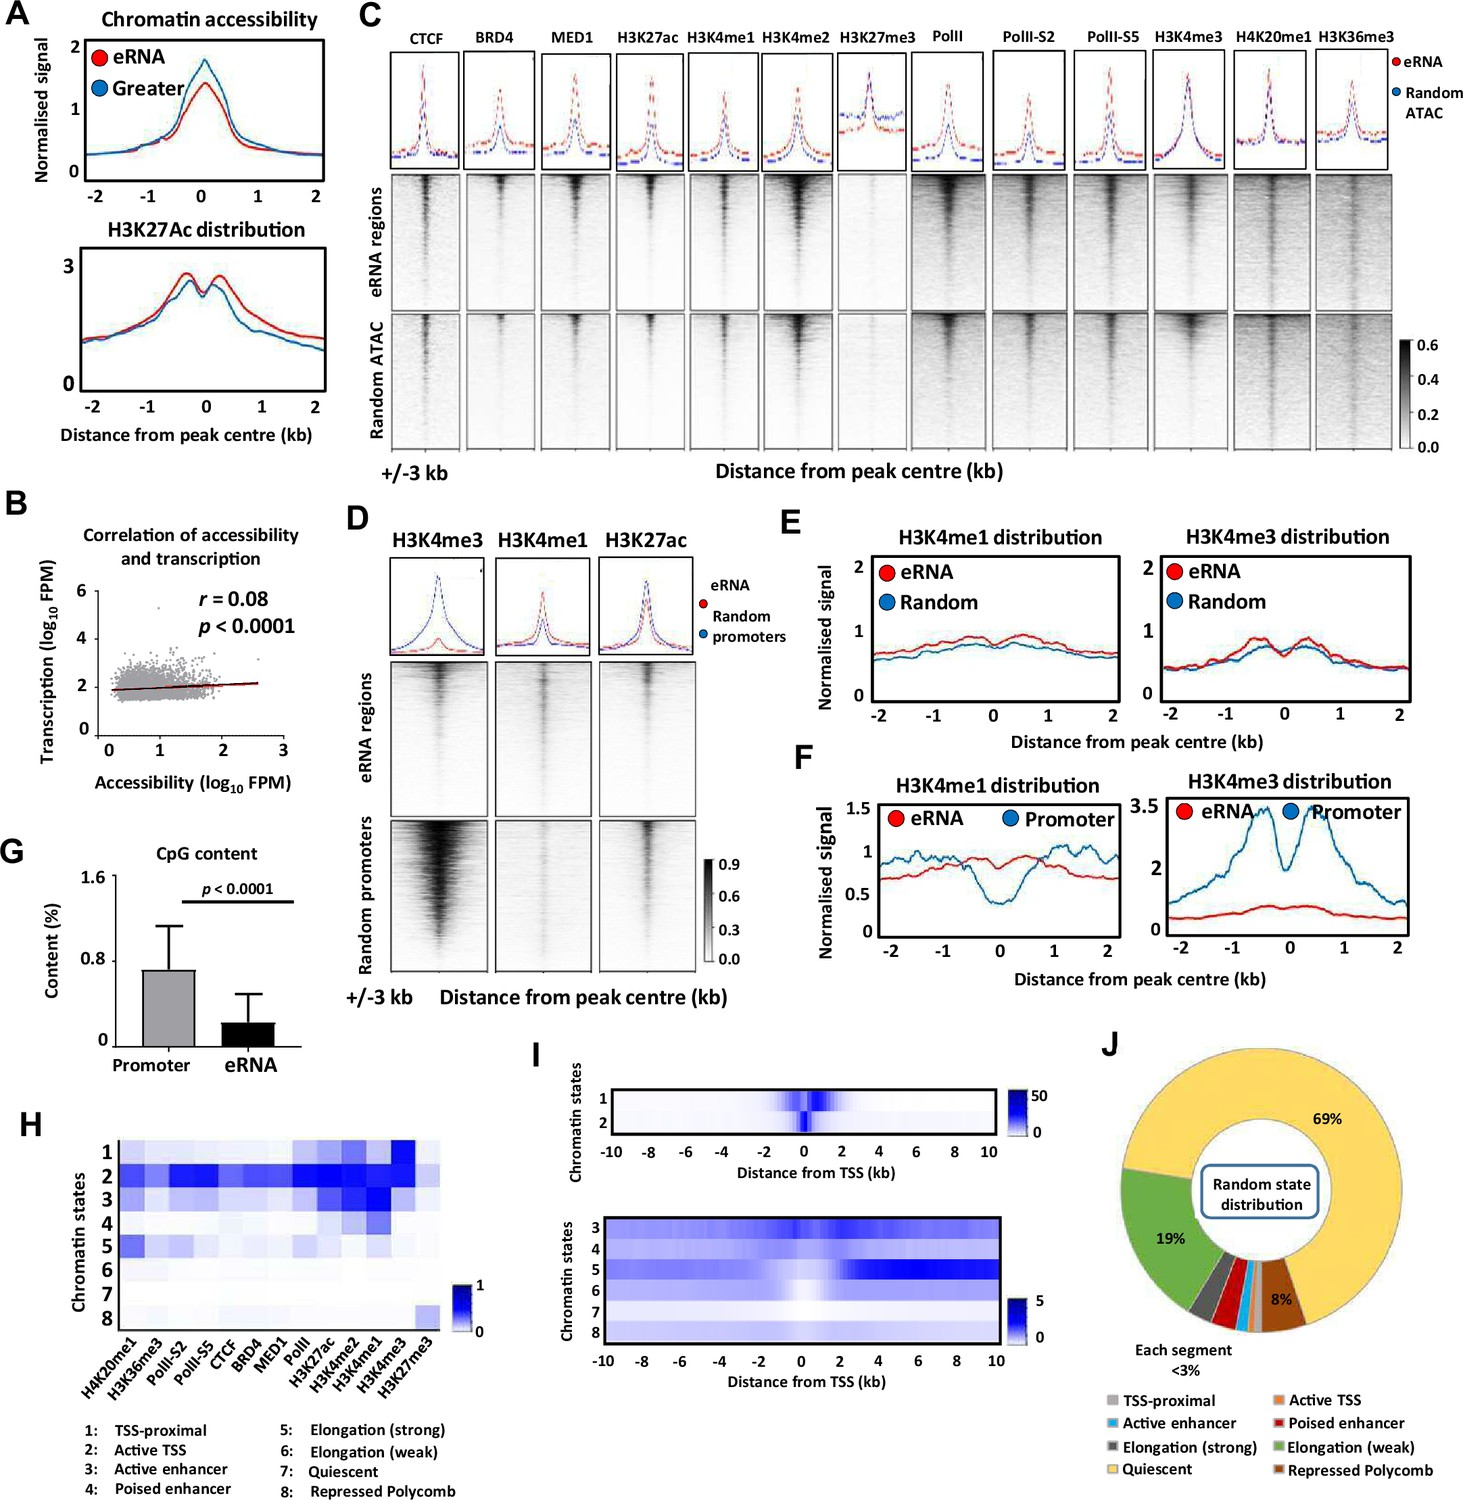
Putative enhancer RNAs (eRNAs) are associated with enhancer-like genomic regions.
(A) Metaplots of patient tissue chromatin accessibility and OE19 cell H3K27ac ChIP-seq signal at 4600 eRNA regions, compared to 4600 random regions of accessible chromatin of greater accessibility level. (B) Correlation of accessibility and transcription at 4600 eRNA regions in Barrett’s oesophagus (BO, n = 4) and oesophageal adenocarcinoma (OAC, n = 14) patient tissue ATAC-seq samples and BO (n = 108) and OAC (n = 210) patient tissue total RNA-seq samples (Spearman’s r and p-value are shown; Spearman’s rank correlation test). (C) Metaplots (top panels) and heatmaps showing CUT&TAG signal for the indicated marks in OE19 cells at 4600 eRNA regions (middle panels) compared against 4600 randomly selected regions of accessible chromatin (bottom panels). (D) Metaplots (top panels) and heatmaps showing CUT&TAG signal in OE19 cells at 4600 eRNA regions (middle panels) compared against 4600 randomly selected accessible promoters (bottom panels). Heatmaps for H3K4me3, H3K4me1, and H3K27ac are shown. (All regions are shown as peak centre ±3 kb.) (E) Metaplots of H3K4me1 (left) and H3K4me3 (right) gastric adenocarcinoma (GAC) patient tissue ChIP-seq signal at 4600 eRNA regions compared to 4600 randomly selected region of accessible chromatin (regions shown as peak centre ±2 kb). (F) Metaplots of H3K4me1 (left) and H3K4me3 (right) GAC patient tissue ChIP-seq signal at all 4600 eRNA regions compared to 4600 randomly selected accessible promoters (all regions shown as peak centre ±2 kb). (G) Bar graph displaying CpG content at eRNAs versus randomly selected accessible promoters (p-value is shown; Kolmogorov–Smirnov test). (H) Heatmap of chromatin states generated from CUT&TAG data using ChromHMM. (I) Heatmaps displaying distance from transcriptional start site (TSS) for chromatin states 1 and 2 (top), and 3–8 (bottom). (J) Distribution of ChromHMM chromatin states for 4600 random regions of the genome.
Figure 2—figure supplement 2
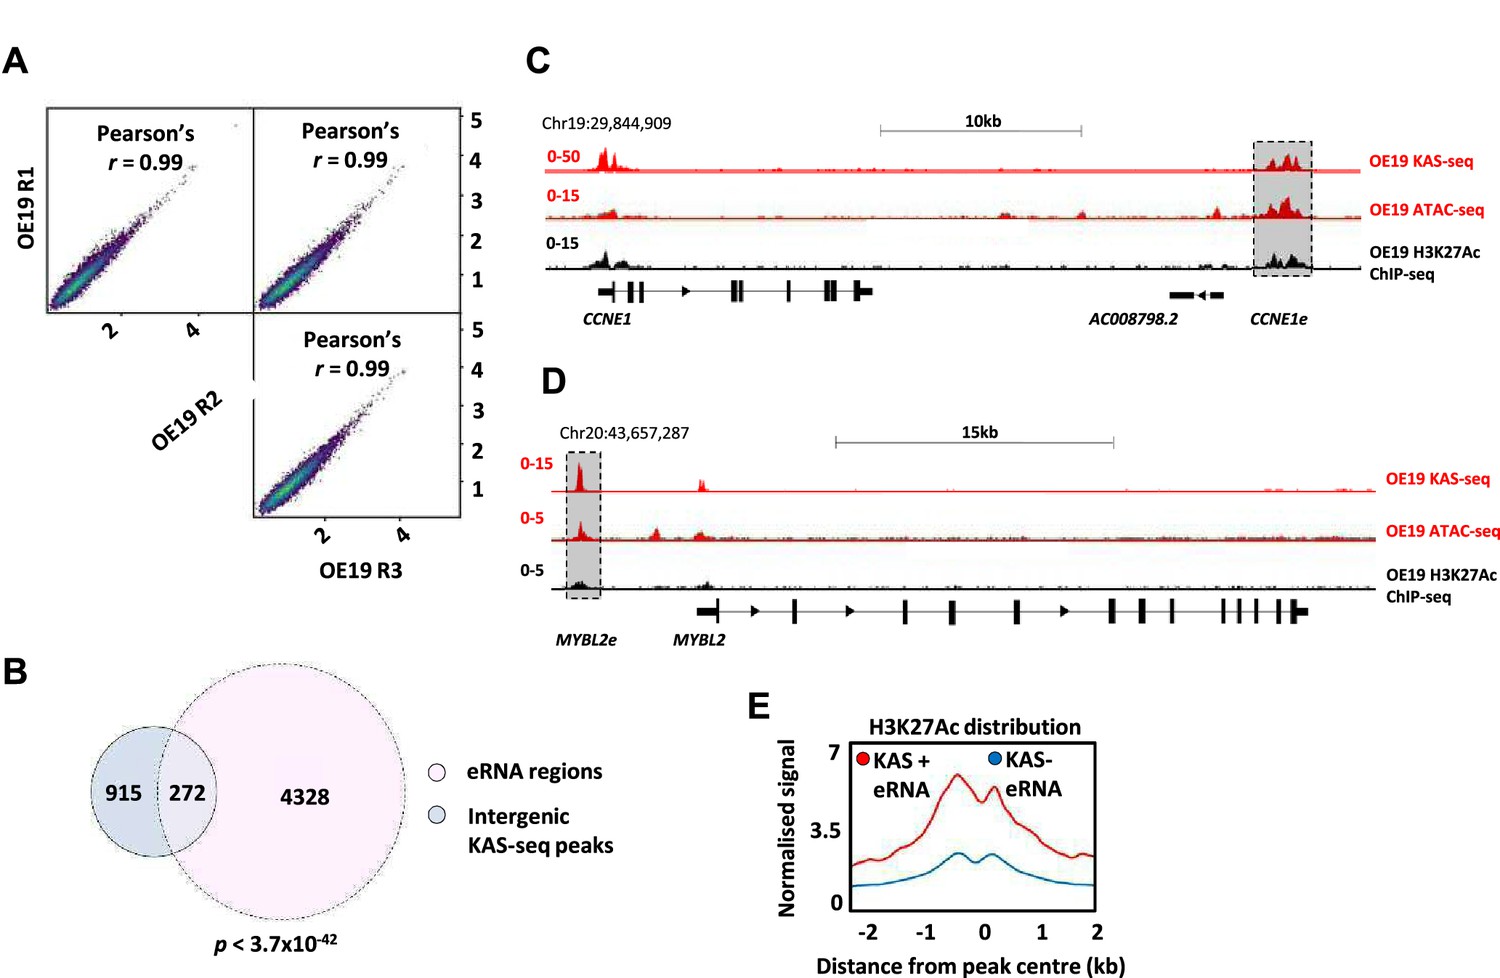
KAS-seq reveals active transcription at enhancer RNA (eRNA) regions.
(A) Scatter plots displaying correlation of OE19 KAS-seq biological replicates (Pearson’s r is shown). (B) Venn diagram of overlap between 4600 eRNA regions and intergenic OE19 KAS-seq peaks (p-value is shown; hypergeometric test). Genome browser views of OE19 KAS- and ATAC-seq data, and OE19 H3K27ac ChIP-seq at the CCNE1 (C) and MYBL2 (D) loci with the CCNE1e and MYBL2 eRNAs highlighted. (E) Metaplots of H3K27ac ChIP-seq signal in OE19 cells at 272 KAS + eRNA regions compared to 4328 KAS − eRNA regions.
Figure 2—figure supplement 3

Enhancer RNAs (eRNAs) are associated with super enhancers.
(A) Scatter plots displaying super enhancer stitching on OE19 H3K27Ac ChIP-seq (left) and OE19 ATAC-seq (right) using HOMER. (B) Venn diagram of overlap between super enhancers identified in OE19 ATAC-seq and OE19 H3K27Ac ChIP-seq. (C) Genome browser view of KAS-seq, ATAC-seq data, and H3K27ac ChIP-seq in OE19 cells and eRNAs detected in oesophageal adenocarcinoma (OAC) patient samples at the ELF3 locus, with the ELF3 super enhancer highlighted. Putative enhancer regions defined by eRNA expression in OAC patient tissue are shaded. (D) Gene ontology (GO)-term analysis of genes annotated to high-confidence super enhancers associated with eRNAs.
Figure 3 with 1 supplement
Association of enhancer RNA (eRNA) regions with transcriptional regulators.
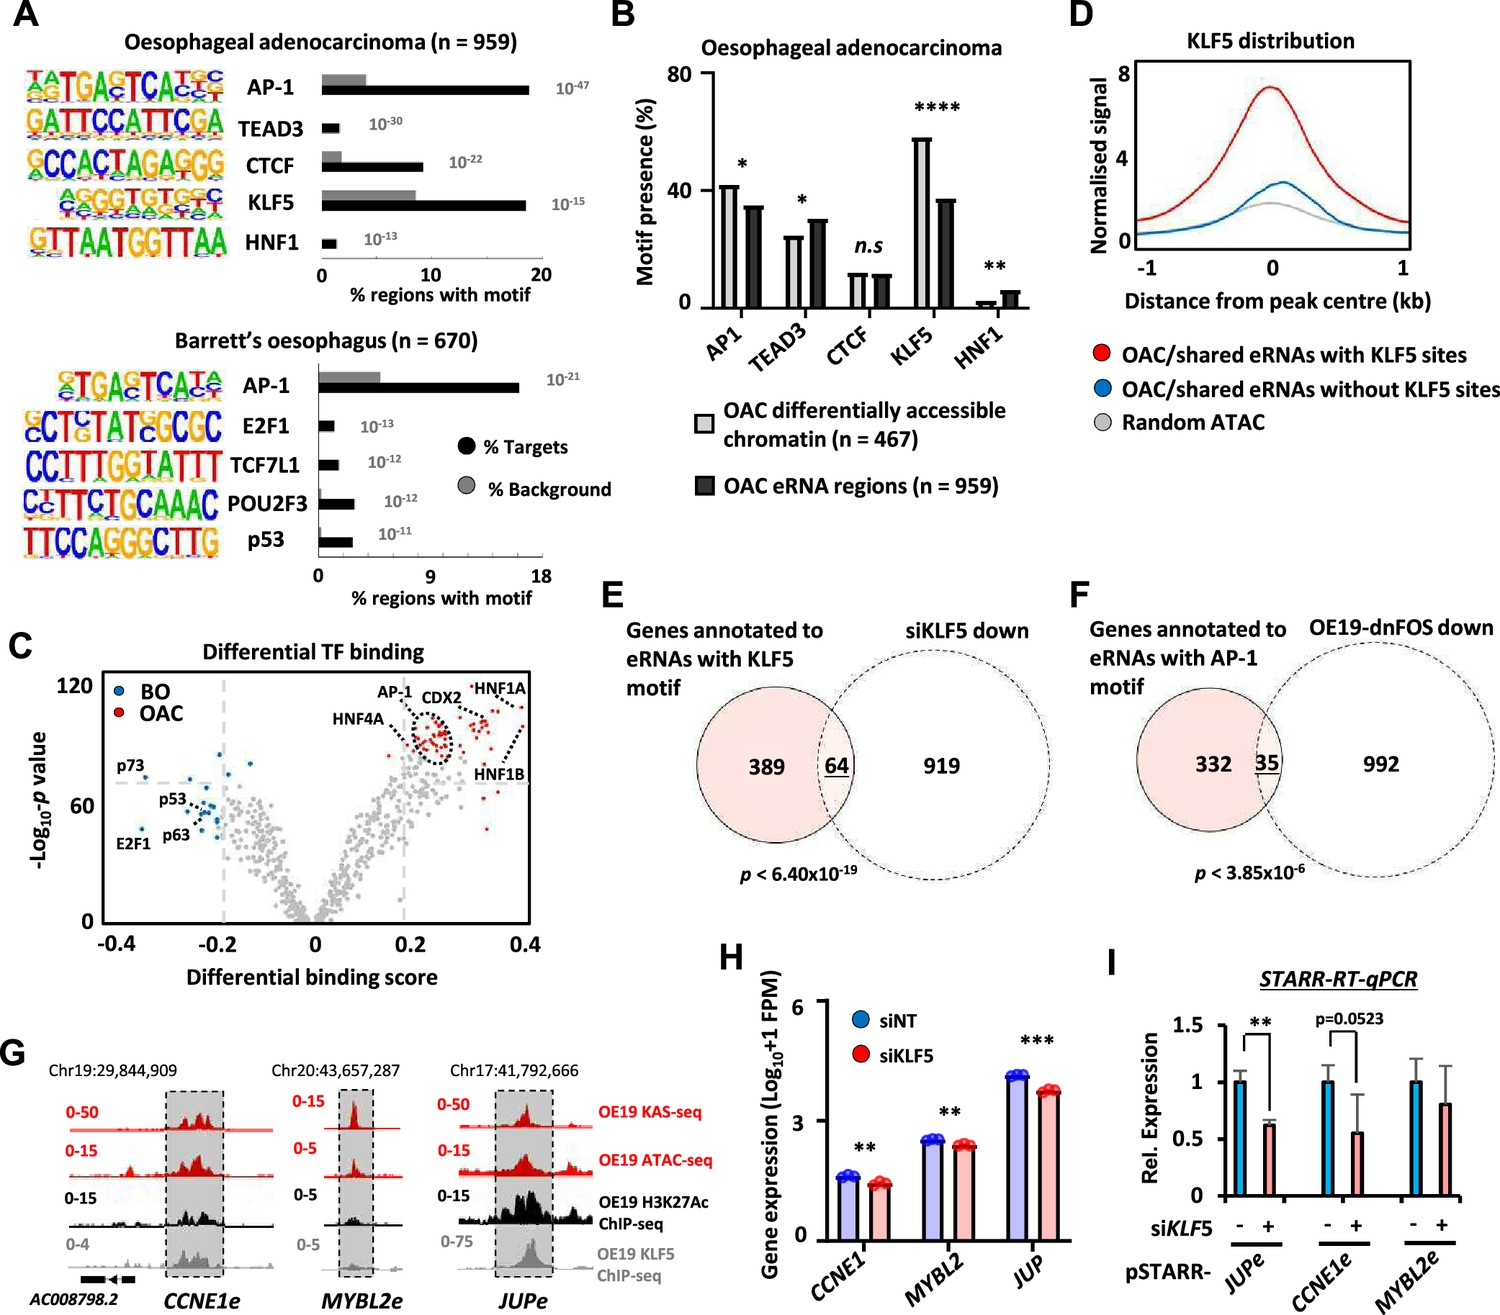
(A) Transcription factor de novo motif enrichment using HOMER, at eRNAs differentially expressed in oesophageal adenocarcinoma (OAC) (top; n = 959) and Barrett’s (bottom; n = 670) (p values are shown). (B) Bar graphs displaying the frequency of motif prevalence of the top 5 enriched motifs at eRNA regions differentially expressed in OAC ( n = 959) compared to differentially accessible intergenic chromatin (****p < 0.0001; **p < 0.01; *p < 0.05; N-1 Chi-squared test). (C) Volcano plot showing differential TF binding (±0.2 differential binding score or ≥−log10 padj 70) at 4600 eRNAs regions using TOBIAS (Bentsen et al., 2020). (D) Metaplots of KLF5 ChIP-seq signal from OE19 cells at eRNAs (specific to OAC or shared with Barrett’s oesophagus [BO] eRNA) containing a KLF5 motif, lacking a KLF5 motif or randomly selected open chromatin regions. (E) Venn diagram displaying overlap between genes annotated to KLF5 motif containing eRNAs (specific to OAC or shared with BO eRNA) with genes downregulated upon siKLF5 treatment (Log2FC ≥1.0, <padj = 0.05) in OE19 cells (p-value is shown; Fisher’s exact test). (F) Venn diagram displaying overlap between genes annotated to AP-1 motif containing eRNAs (specific to OAC or shared with BO eRNA) with genes downregulated upon dominant-negative FOS (dnFOS) induction (Log2FC ≥0.5, ≤padj = 0.05) in OE19 cells (p-value is shown; Fisher’s exact test). (G) Genome browser view of KAS-seq, ATAC-seq data, H3K27ac ChIP-seq, and KLF5 ChIP-seq in OE19 cells at the CCNE1 (left), MYBL2 (middle), and JUP (right) enhancer loci, with corresponding eRNA regions highlighted (5 kb window shown). (H) Bar graphs displaying the expression from RNA-seq analysis of CCNE1, MYBL2, and JUP genes in OE19 cells treated with siRNA targeting KLF5 (n = 3; ***p < 0.001; **p < 0.01; Welch’s t-test). (I) Reverse-transcription quantitative real-time PCR (RT-qPCR) analysis of enhancer activity from the indicated pSTARR-enhancer vectors upon siKLF5 depletion in OE19 cells (n = 3; **p < 0.01; t-test). See also Figure 3—figure supplement 1.
Figure 3—figure supplement 1
Association of enhancer RNA (eRNA) regions with potential regulatory transcription factors.
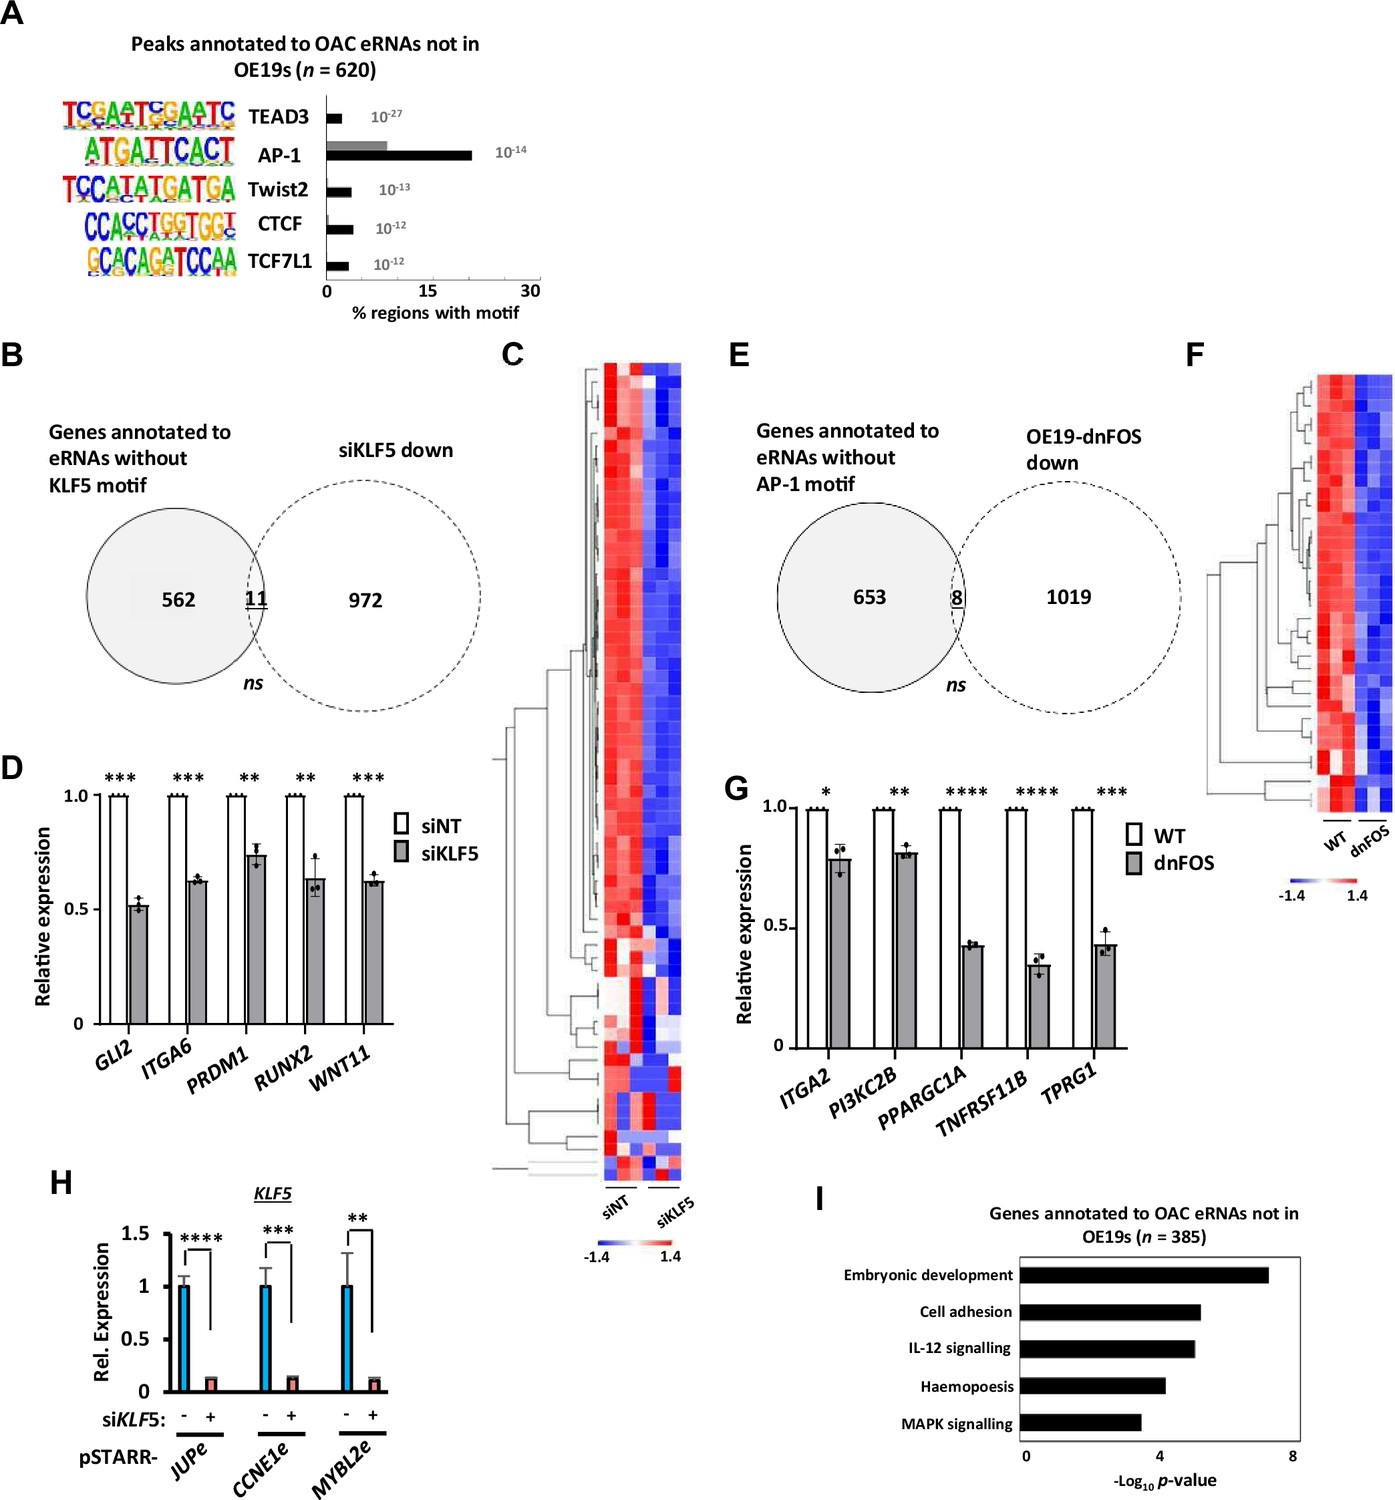
(A) Transcription factor de novo motif enrichment using HOMER, at oesophageal adenocarcinoma (OAC) eRNA containing regions not present in OE19s (n = 620; p values are shown). (B) Venn diagram displaying overlap between genes annotated to KLF5 motif lacking eRNAs with genes downregulated upon siKLF5 treatment (Log2FC ≥1.0,<padj = 0.05) in OE19 cells (p-value is non-significant [ns]; Fisher’s exact test). (C) Heatmap and hierarchical clustering of siNT (n = 3) and siKLF5 (n = 3) RNA-seq samples according to row z-score normalised expression of KLF5 eRNA-associated genes which are downregulated upon siKLF5 (n = 64). (D) Bar graphs displaying difference in expression of five KLF5 eRNA-associated genes which are downregulated upon siKLF5 (n = 3; ***p < 0.001; **p < 0.01; Welch’s t-test). (E) Venn diagram displaying overlap between genes annotated to AP-1 motif lacking eRNAs with genes downregulated upon dominant-negative FOS (dnFOS) induction (Log2FC ≥0.5,<padj = 0.05) in OE19 cells (p-value is non-significant [ns]; Fisher’s exact test). (F) Heatmap and hierarchical clustering of wild-type (n = 3) and OE19-dnFOS (n = 3) RNA-seq samples according to row z-score normalised expression of AP-1 eRNA-associated genes which are downregulated upon dnFOS (n = 35). (G) Bar graphs displaying difference in expression of five AP-1 eRNA-associated genes which are downregulated upon dnFOS (n = 3; ****p < 0.0001; ***p < 0.001; **p < 0.01; *p < 0.05; Welch’s t-test). (H) RT-qPCR analysis of KLF5 expression upon siKLF5 depletion in OE19 cells co-transfected with the indicated pSTARR-enhancer vectors (n = 3, ****p < 0.0001; ***p < 0.001; **p < 0.01; t-test). (I) Gene ontology (GO)-term analysis of genes annotated to OAC eRNAs not present in OE19 cells.
Figure 4 with 1 supplement
Association of enhancer RNA (eRNA) regions with transcriptional regulators and potential target genes.
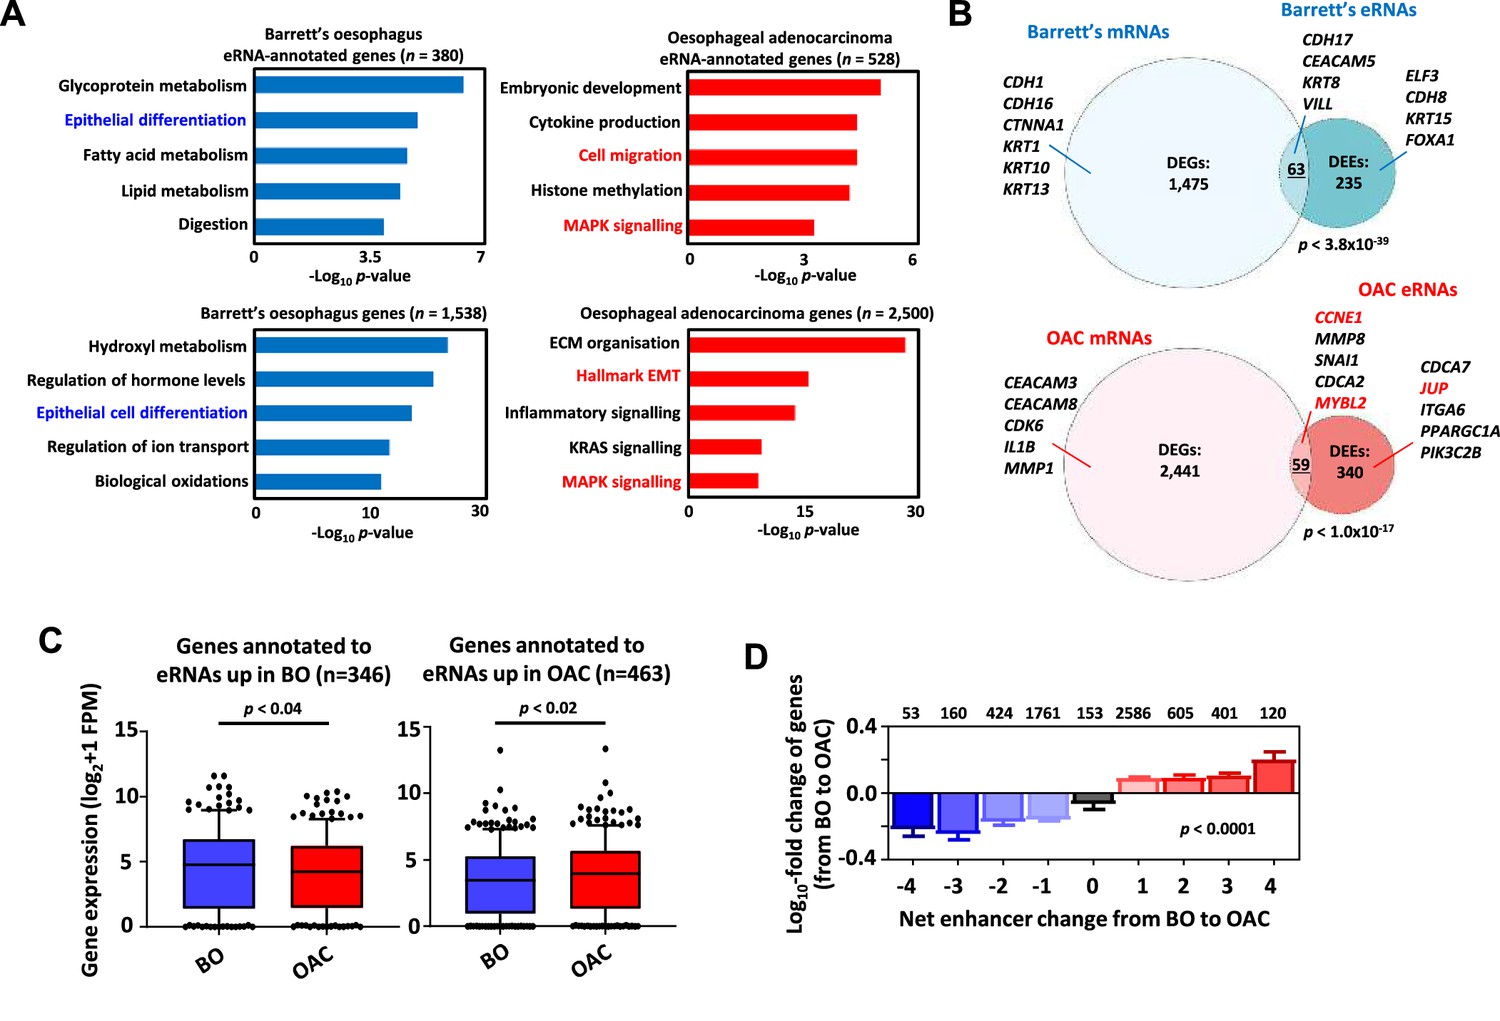
(A) Gene ontology (GO)-term analysis of differentially expressed eRNA region-associated genes (top-left/right) and differentially expressed genes (bottom-left/right) in Barrett’s (left) (>Log2FC 0.9, <padj = 0.05) and oesophageal adenocarcinoma (OAC, right) (>Log2FC 1.1, <padj = 0.05). eRNAs were annotated to genes by the nearest gene model using HOMER (Heinz et al., 2010). (B) Venn diagram displaying overlap between differentially expressed genes and unique protein-coding genes annotated to differentially expressed eRNAs in Barrett’s oesophagus (BO, top) and OAC (bottom) (p-value is shown; Fisher’s exact test). (C) Box plots comparing the expression of genes annotated to eRNAs differentially expressed in BO (left) or OAC (right) in BO and OAC patient tissue total RNA-seq samples from the OCCAMS dataset (p-value is shown; Welch’s t-test). (D) Genome-wide analysis of the effect of changing eRNA expression on gene expression within 200 kb chromosomal bins. Numbers above bars represent total genes associated with respective net-enhancer change (p-value is shown; Kruskal–Wallis test). See also Figure 4—figure supplement 1.
Figure 4—figure supplement 1
Association of enhancer RNA (eRNA) regions with potential target genes.
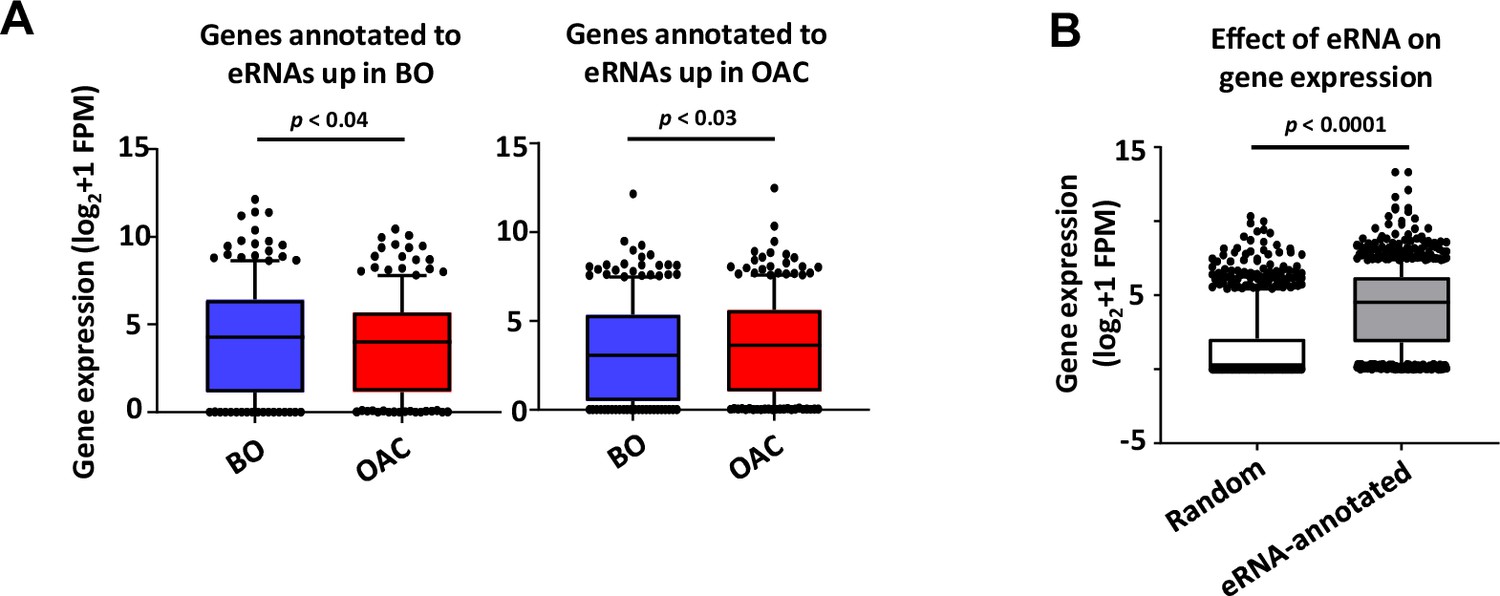
(A) Box plots comparing the expression of genes annotated to eRNAs differentially expressed in Barrett’s oesophagus (BO, left) or oesophageal adenocarcinoma (OAC, right) in BO and OAC patient tissue total RNA-seq samples from the Maag dataset (Maag et al., 2017) (p-value is shown; Welch’s t-test). (B) Box plots comparing gene expression of 1000 randomly selected genes against genes annotated to eRNAs in the OCCAMs dataset (n = 973; p-value is shown; Welch’s t-test).
Figure 5 with 1 supplement
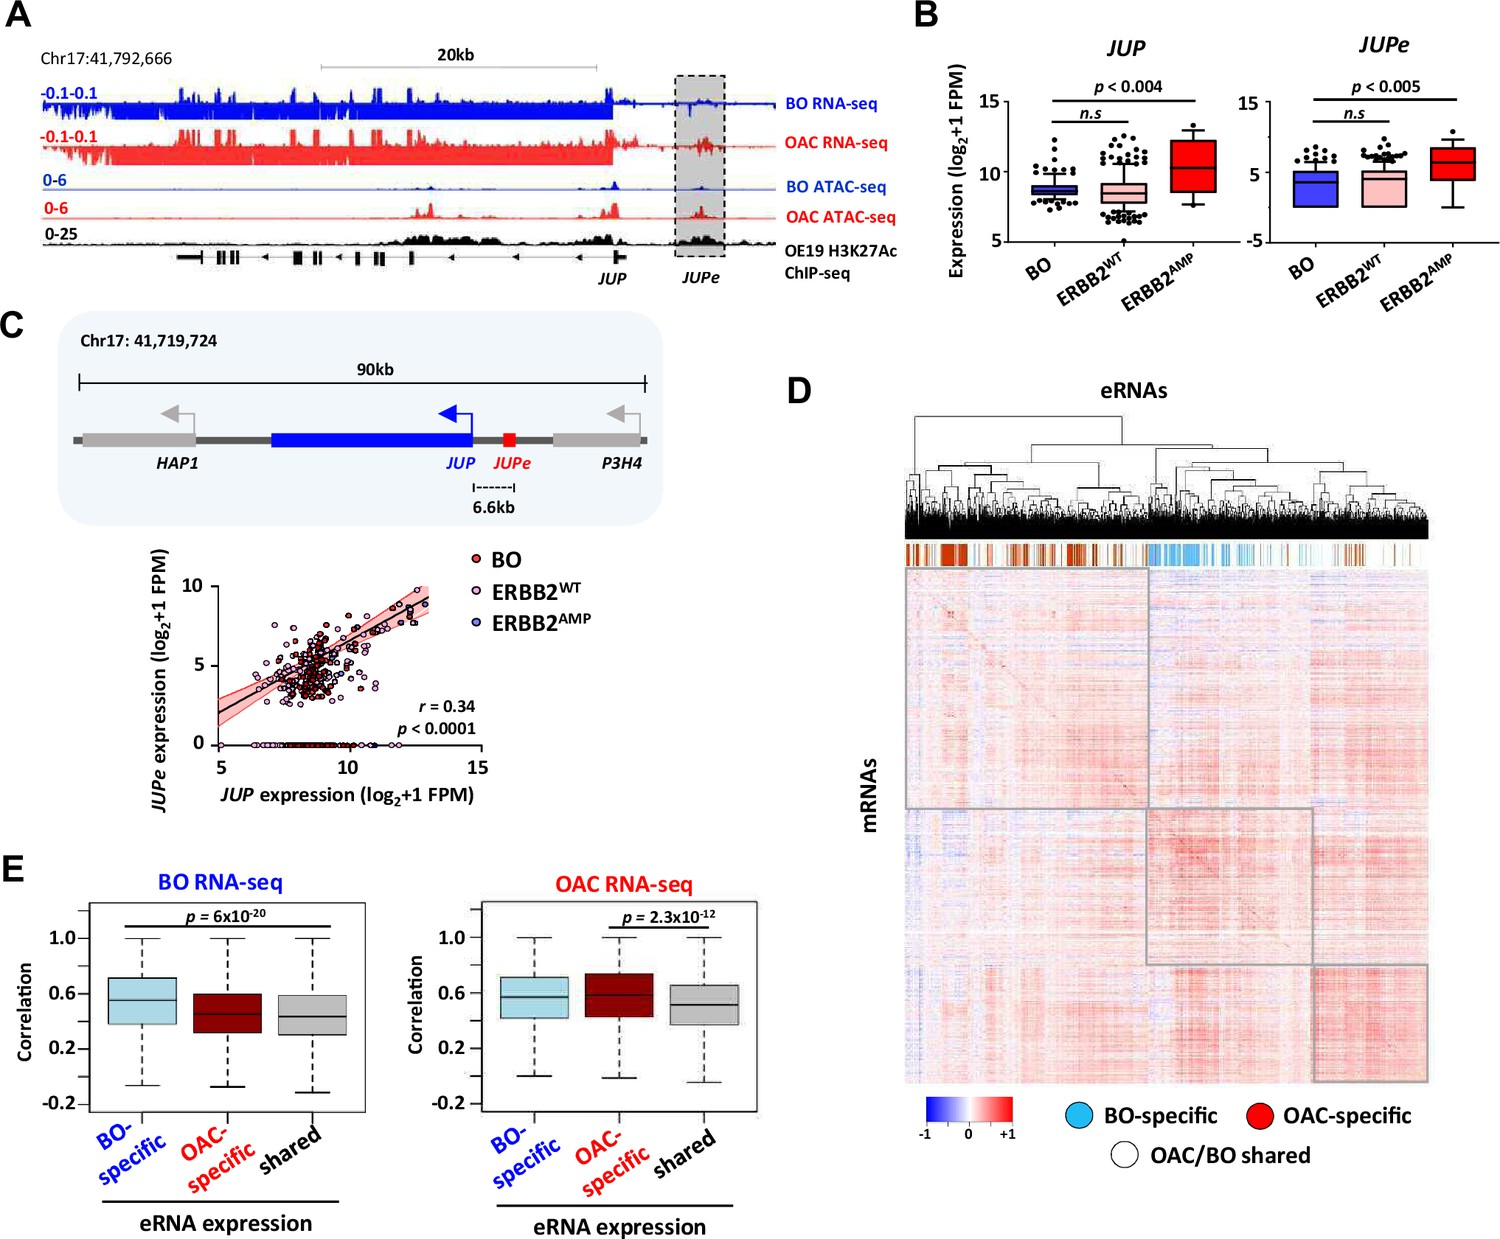
Enhancer RNA (eRNA) regions identify JUP as a candidate target gene.
(A) Genome browser view of Barrett’s oesophagus (BO) and oesophageal adenocarcinoma (OAC) patient tissue ATAC- and total RNA-seq data, and H3K27ac ChIP-seq in OE19 cells, at the JUP locus with the JUPe eRNA highlighted. (B) Box plots comparing the expression of JUP (left) and JUPe (right) in BO (n = 108), ERBB2WT (n = 193), and ERBB2AMP (n = 17) OAC patient tissue total RNA-seq samples (p-value is shown; Welch’s t-test). (C) Schematic displaying relative locations of putative eRNA region target genes and nearest neighbours (top) and correlation of JUPe with JUP expression across BO (n = 108), ERBB2WT (n = 193), and ERBB2AMP (n = 17) OAC patient tissue total RNA-seq samples (bottom) (Spearman’s r and p-value are shown; Spearman’s rank correlation test). (D, E) Global analysis of correlations of eRNA expression with the expression of the most correlated gene within a 200 kb window flanking the eRNA region. eRNAs are defined as tissue-specific according to Figure 1A, and the rest of the eRNAs are designated as shared. (D) Heatmap showing the correlation coefficients between all 4600 eRNAs and the most highly associated mRNAs in the RNA-seq datasets. Samples are clustered based on these correlation coefficients. OAC-specific eRNAs (red), BO-specific eRNAs (blue), and shared eRNAs (white) are indicated across the top. (E) Box plots showing the correlations with BO gene expression datasets (left) or OAC gene expression datasets (right). Significance values (t-test) are shown between the indicated groups. See also Figure 5—figure supplement 1.
Figure 5—figure supplement 1
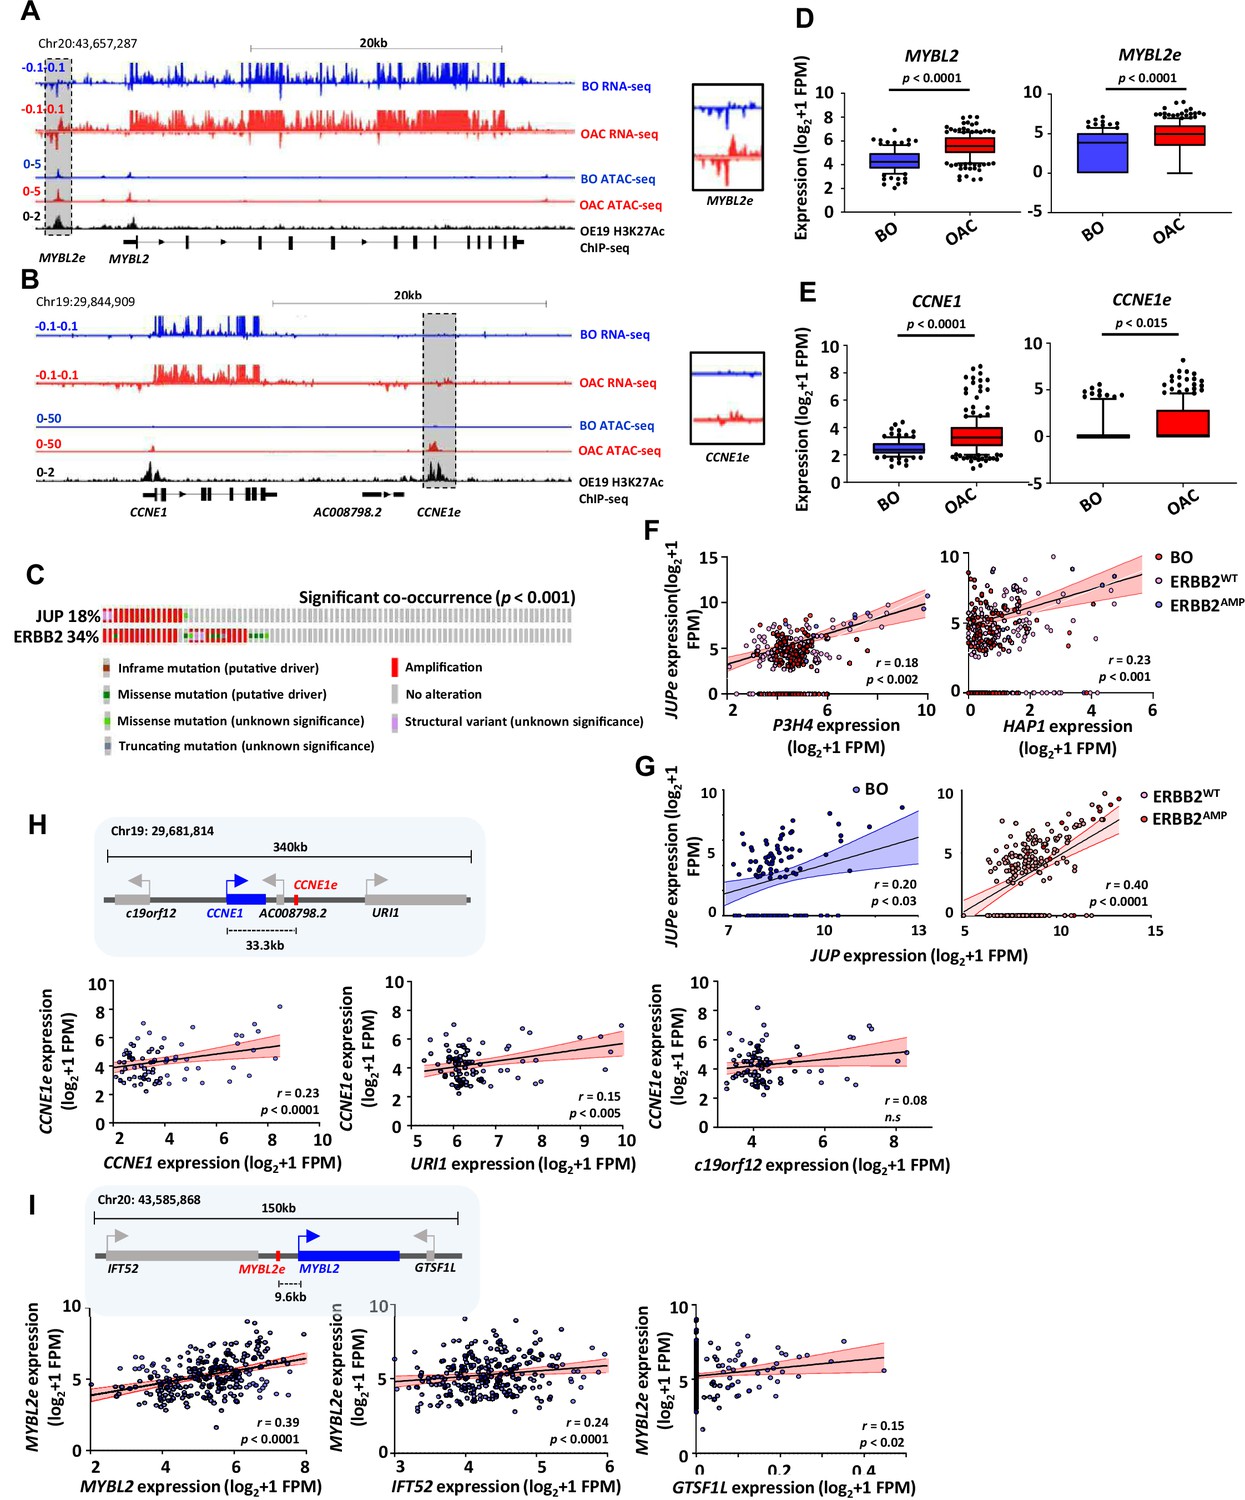
Enhancer RNA (eRNA) regions identify JUP, CCNE1, and MYBL2 as a candidate target genes.
Genome browser views of Barrett’s oesophagus (BO) and oesophageal adenocarcinoma (OAC) patient tissue ATAC- and total RNA-seq data, and H3K27ac ChIP-seq in OE19 cells, at the MYBL2 (A) and CCNE1 (B) loci with the MYBL2e and CCNE1e eRNAs highlighted and inset. (C) Oncoprint displaying mutational status of JUP and ERBB2 for OAC patients in the TCGA PanCancer Atlas dataset (p-value is shown; one-sided Fisher’s exact test). Box plots comparing the expression of (D) MYBL2 (left) and MYBL2e (right) or (E) CCNE1 (left) and CCNE1e (right) in BO (n = 108) and OAC (n = 210) patient tissue total RNA-seq samples (p-value is shown; Welch’s t-test). (F) Correlation of JUPe and P3H4 (left) or HAP1 (right) expression across BO (n = 108), ERBB2WT (n = 193), and ERBB2AMP (n = 17) OAC patient tissue total RNA-seq samples (Spearman’s r and p-value are shown; Spearman’s rank correlation test). (G) Correlation of JUPe and JUP expression in BO (left) or OAC (right) patient total RNA-seq data. Correlation of eRNAs and transcripts for (H) CCNE1e and CCNE1 (left), URI1 (middle), and c19orf12 (right) expression and (I) MYBL2e and MYBL2 (left), IFT52 (middle), and GTSF1L (right) expression BO (n = 108) and OAC (n = 210) patient tissue total RNA-seq samples (Spearman’s r and p-value are shown; Spearman’s rank correlation test). Schematics display the relative locations of putative eRNA region target genes and nearest neighbours (top).
Figure 6 with 2 supplements
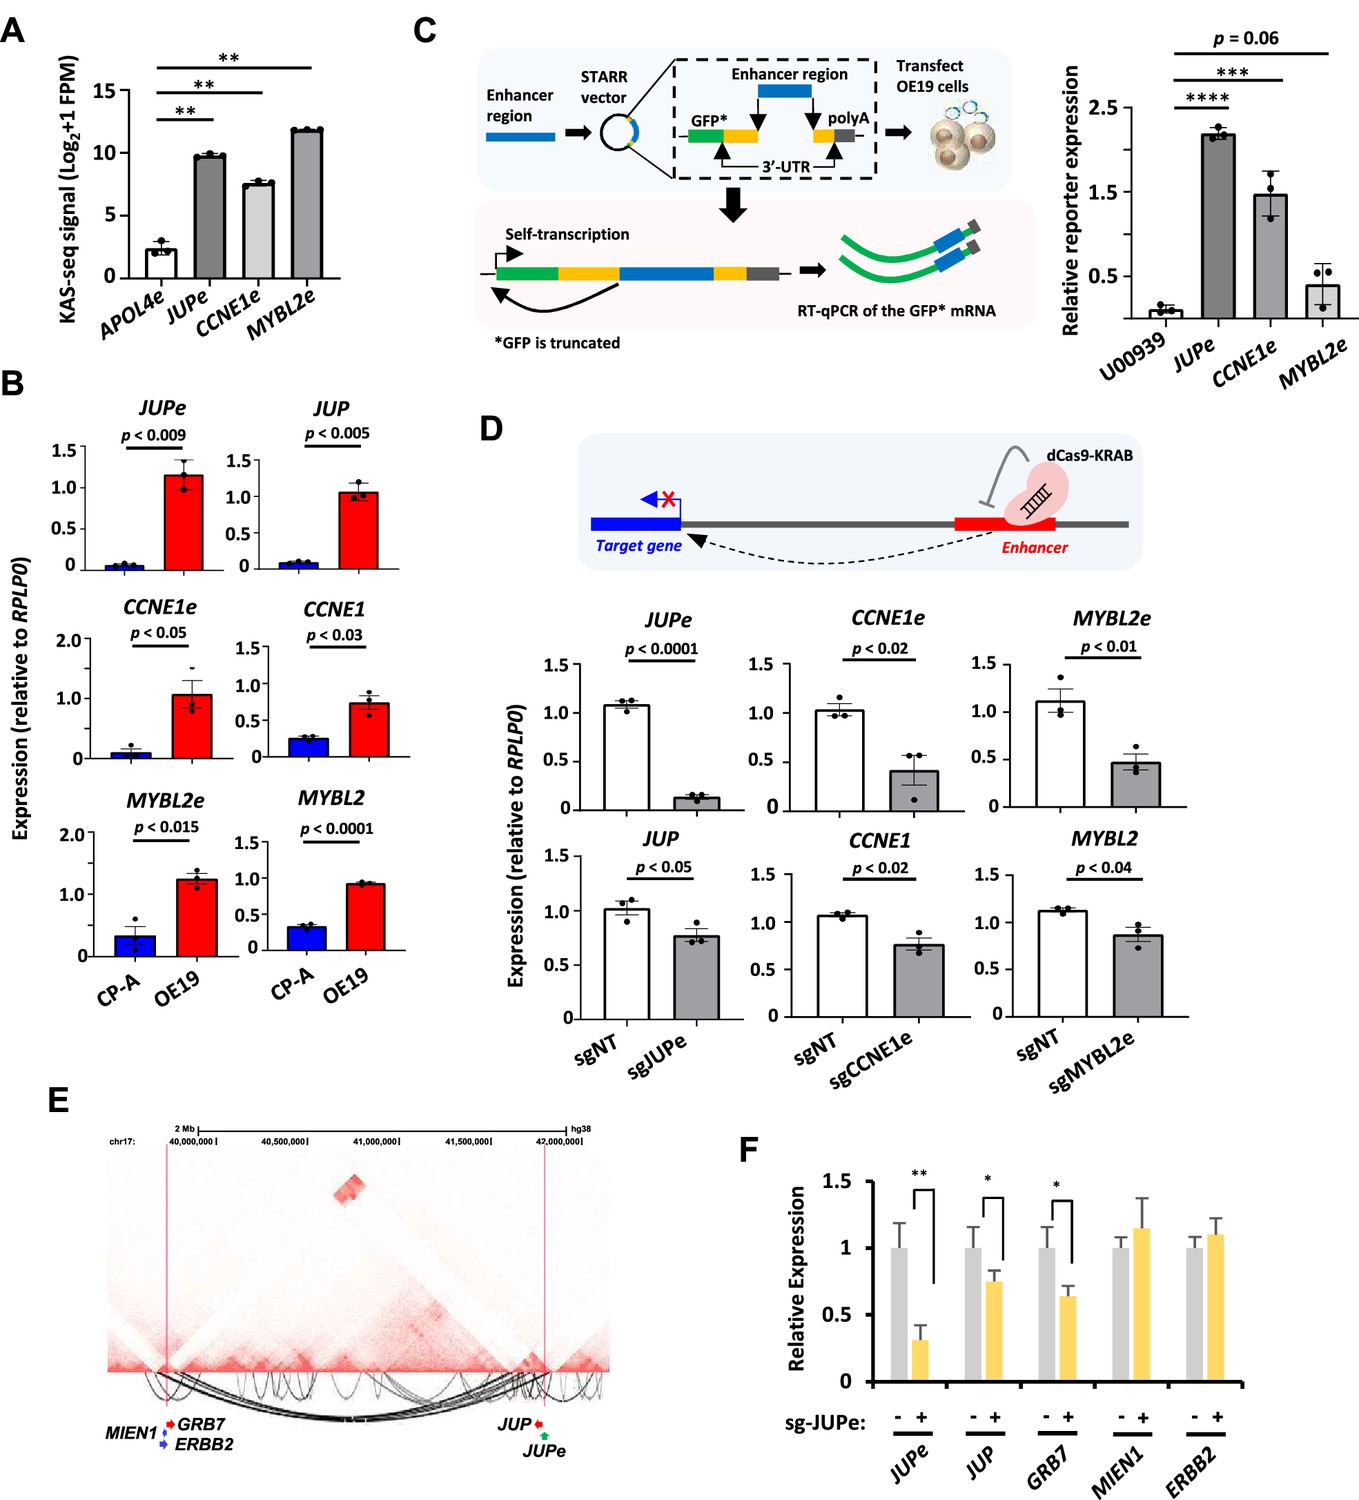
In vitro interrogation of enhancer RNA (eRNA) regions confirms production and association with cancer-associated processes.
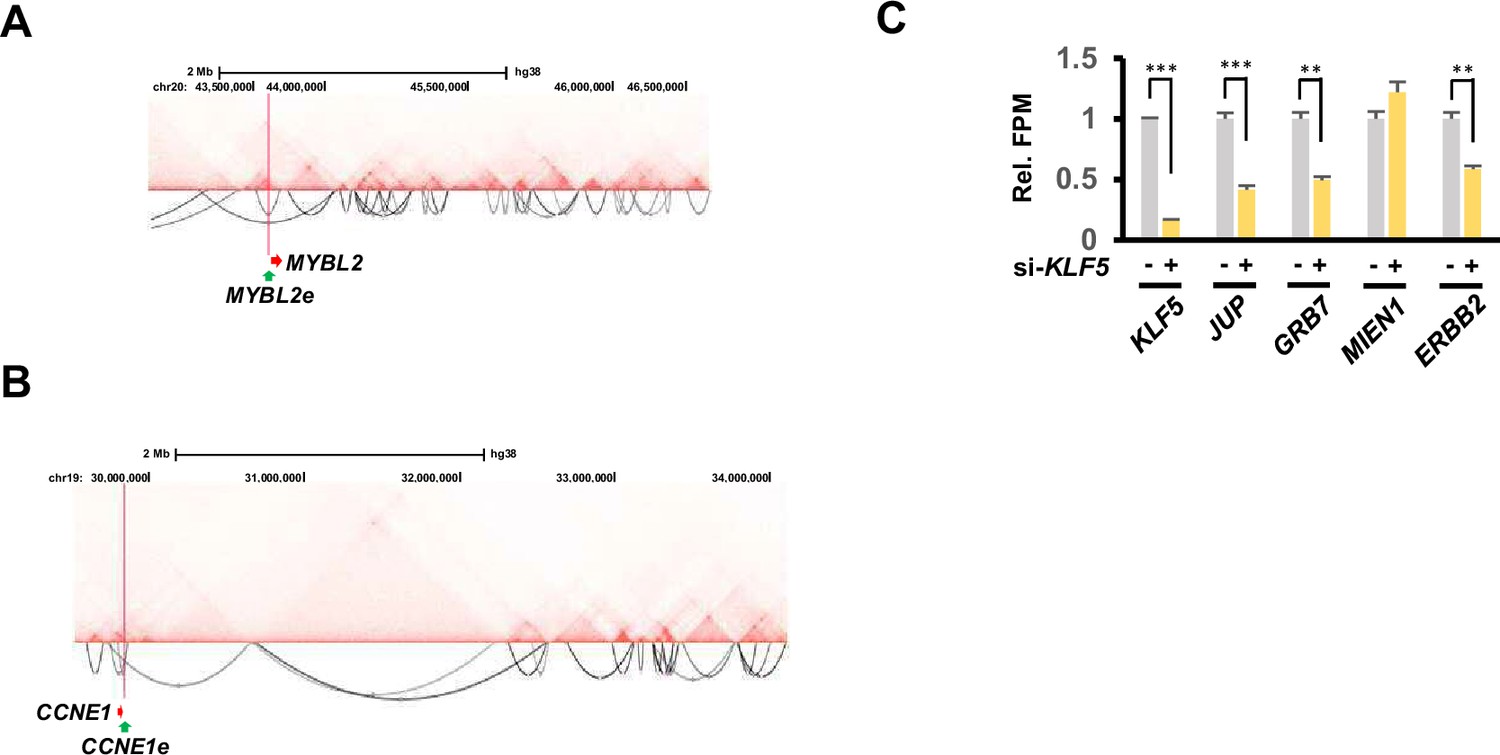
(A) Bar graphs displaying KAS-seq signal at the APOL4e, JUPe, CCNE1e, and MYBL2e regions in OE19 cells (n = 3; **p < 0.01; Welch’s t-test). (B) Bar graphs displaying difference in expression of JUP, CCNE1, MYBL2 and JUPe, CCNE1e, and MYBL2e between CP-A and OE19 cells using RT-qPCR (n = 3; p-value is shown; Welch’s t-test; *GFP is truncated). (C) Schematic of STARR-RT-qPCR assay (left) and bar graph displaying the difference in STARR reporter activity between JUPe, CCNE1e, and MYBL2e, compared to U00930 tRNA-negative control (right) (n = 3; ****p < 0.0001; ***p < 0.001; one-way analysis of variance (ANOVA) with Bonferroni’s correction). (D) Bar graphs displaying the expression of JUPe, CCNE1e, and MYBL2e eRNAs (top) and JUP, CCNE1, and MYBL2 mRNAs (bottom) in OE19-dCas9-KRAB cells using real time RT-qPCR, upon treatment with the indicated targeting or non-targeting (NT) sgRNA (n = 3; p-value is shown; Welch’s t-test). A schematic of dCas9-KRAB targeting of eRNA regions is shown. (E) Genome browser view of Hi-C data surrounding the JUP locus. Significant intrachromosomal interactions are shown below the tracks. The start (at JUPe) and end (near ERBB2) of long range loops are highlighted with red lines. (F) RT-qPCR analysis of expression of the indicated genes or JUPe eRNAs following dKAS9-KRAB-mediated repression of JUPe activity (n = 3; **p < 0.01, *p< 0.05; Welch's t-test). See also Figure 6—figure supplements 1 and 2.
Figure 6—figure supplement 1
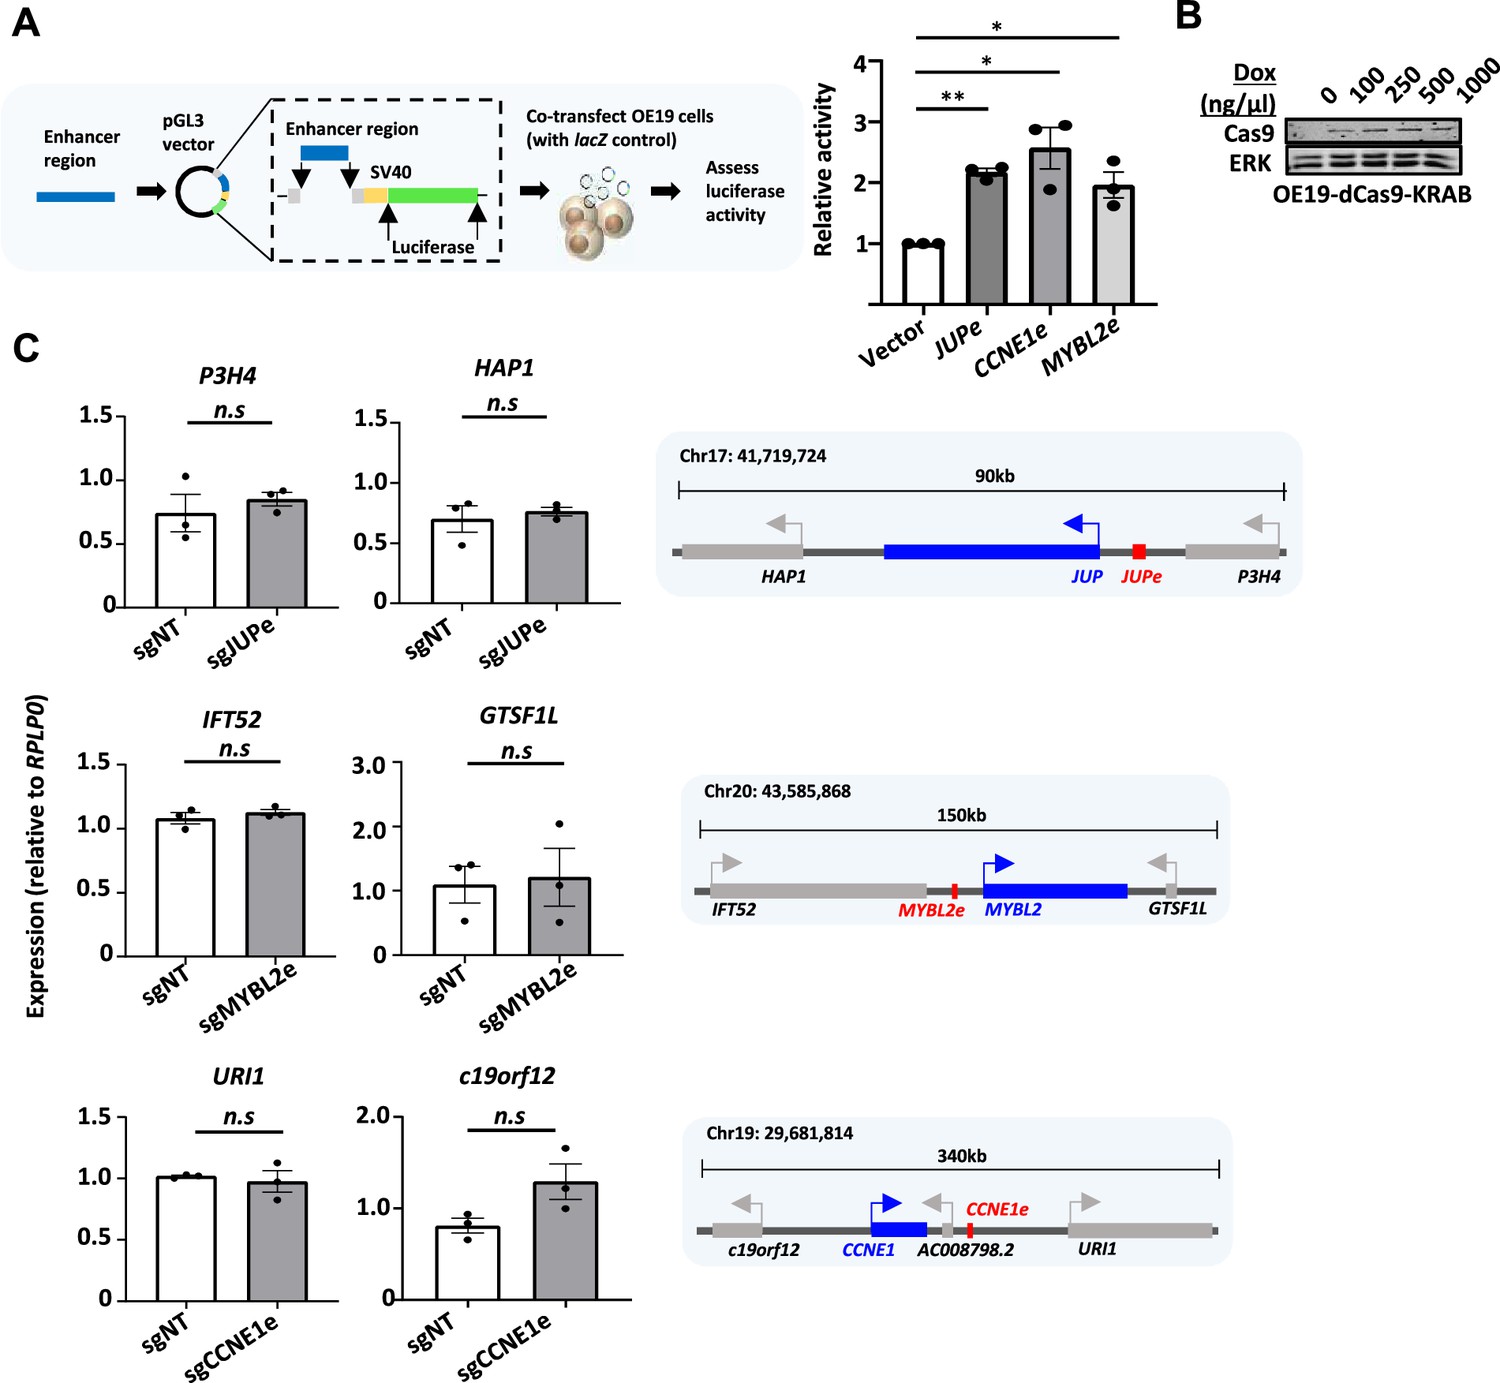
In vitro interrogation of enhancer RNA (eRNA) regions confirms production and association with cancer-associated processes.
(A) Schematic of luciferase assay (left) and bar graph displaying the luciferase reporter activity between JUPe, CCNE1e, and MYBL2e, compared relative to vector only negative control (right) (n = 3; **p < 0.01; *p < 0.05; one-way analysis of variance (ANOVA) with Bonferroni’s correction). (B) Western blot showing induction of Cas9 in OE19-dCas9-KRAB cells upon doxycycline treatment. (C) Bar graphs displaying difference in expression of (top) P3H4 and HAP1 upon sgJUPe treatment, (middle) IFT52 and GTSF1L upon sgMYBL2e treatment, and (bottom) URI1 and c19orf12 upon sgCCN1E treatment, in OE19-dCas9-KRAB cells using RT-qPCR (n = 3; p-value is shown; Welch’s t-test). A diagrammatic representation of the genomic region surrounding each enhancer is shown on the right.
-
Figure 6—figure supplement 1—source data 1
Raw unedited images of Western blots.
Membranes have been probed for ERK1/2 as a loading control and Cas9. The regions used for creating the final figure are boxed. Molecular weight marker sizes (kDa) are shown on the right.
- https://cdn.elifesciences.org/articles/80840/elife-80840-fig6-figsupp1-data1-v2.zip
-
Figure 6—figure supplement 1—source data 2
Original TIFF files used to create Figure 8, Figure 6—figure supplement 1b.
- https://cdn.elifesciences.org/articles/80840/elife-80840-fig6-figsupp1-data2-v2.zip
Figure 6—figure supplement 2
HiC analysis of OE19 cells.
Genome browser views of Hi-C data surrounding the MYBL2 (A) and CCNE1 (B) loci (genes depicted as red arrows). Significant intrachromosomal interactions are shown below the tracks. The positions of the MYBL2e- and CCNE1e-defined enhancers are indicated. (C) RNA-seq analysis of expression of the indicated genes or JUPe enhancer RNAs (eRNAs) following siRNA-mediated depletion of KLF5 (n = 3; ***p< 0.001, **p < 0.01; t-test).
Figure 7 with 1 supplement
Biological and clinical relevance of enhancer RNAs (eRNAs) and their target genes.
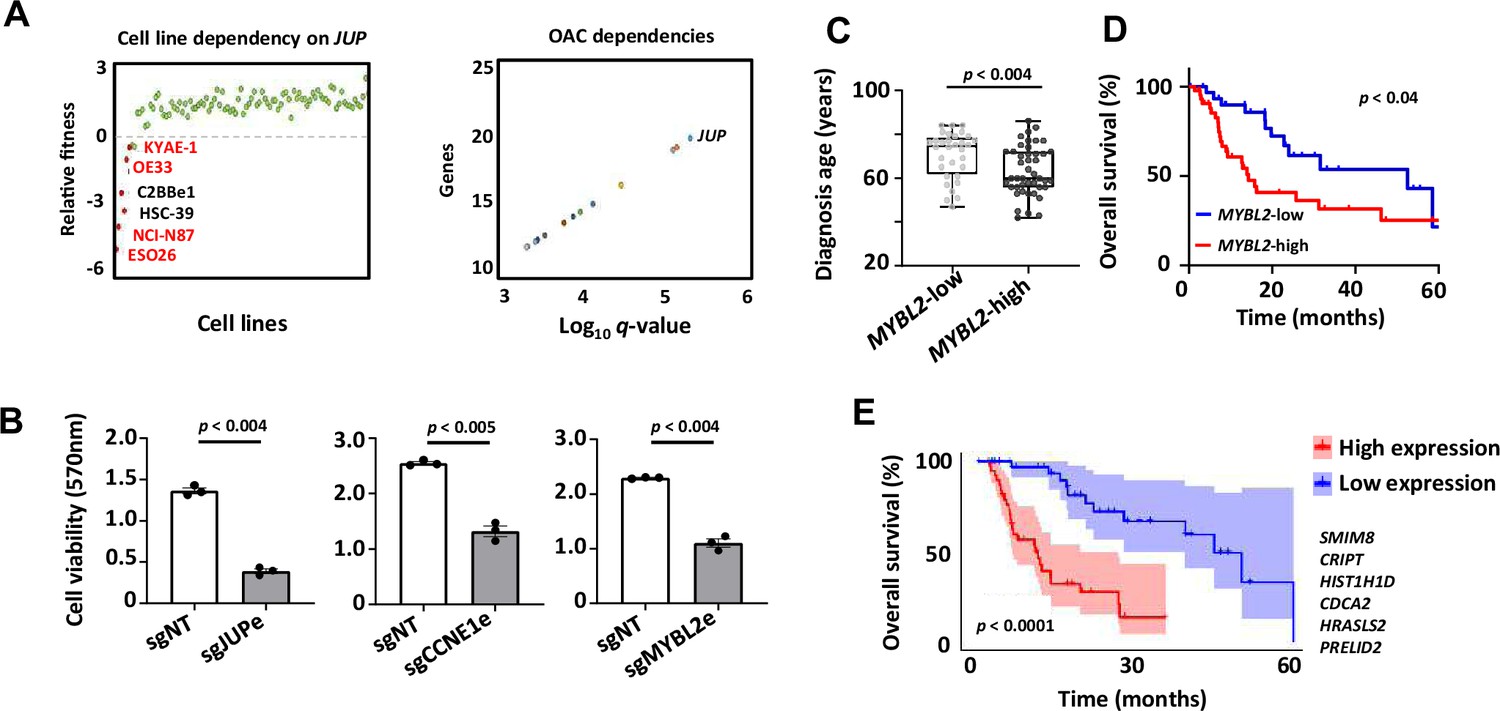
(A) Scatter plots displaying data from the Sanger DepMap Project Score (Tsherniak et al., 2017; Behan et al., 2019) highlighting cell line dependency on JUP (left) (gastroesophageal cell lines are marked in red) and top genetic dependencies in oesophageal adenocarcinoma (OAC, right). (B) Bar graph displaying the difference in cell viability in OE19-dCas9-KRAB cells upon sgRNA treatment, assessed by crystal violet assay (n = 3; p-value is shown; Welch’s t-test). (C) Box plots comparing diagnosis age for OAC patients with low and high MYBL2 expression in the TCGA PanCancer Atlas dataset (p-value is shown; Welch’s t-test). (D) Kaplan–Meier plot comparing overall survival between OAC patients with low and high MYBL2 expression in the TCGA PanCancer Atlas dataset (Log rank p-value is shown). (E) Kaplan–Meier plot comparing overall survival between OAC patients with low and high signature eRNA target expression in the TCGA PanCancer Atlas dataset (Log rank p-value is shown; signature genes are shown). See also Figure 7—figure supplement 1.
Figure 7—figure supplement 1
Biological and clinical relevance of enhancer RNAs (eRNAs) and their target genes.
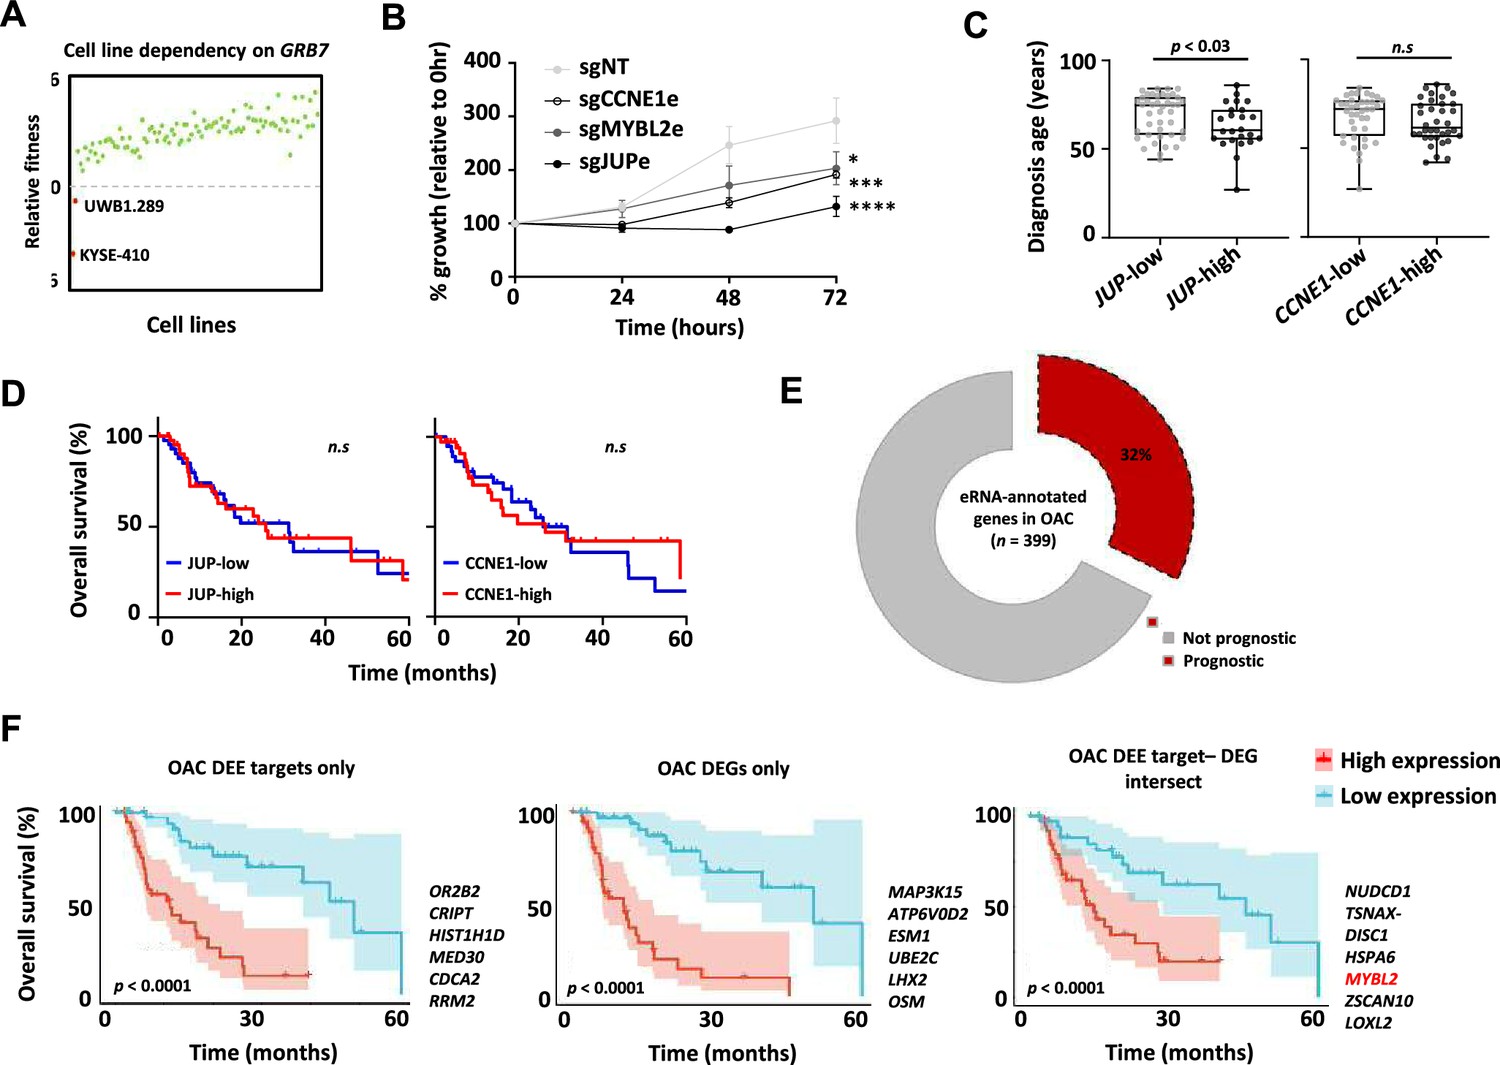
(A) Scatter plots displaying data from the Sanger DepMap Project Score (Tsherniak et al., 2017; Behan et al., 2019) highlighting cell line dependency on GRB7. KYSE-410 is squamous oesophageal and UWB1.289 is ovarian cancer in origin. (B) Growth curves comparing difference in growth in OE19-dCas9-KRAB cells upon indicated sgRNA treatment, assessed by crystal violet assay (*p < 0.05, ***p < 0.001, ****p < 0.0001; two-way analysis of variance [ANOVA]). (C) Box plots comparing diagnosis age for oesophageal adenocarcinoma (OAC) patients with low and high JUP (left) and CCNE1 (right) in the TCGA PanCancer Atlas dataset (p-value is shown; Welch’s t-test). (D) Kaplan–Meier plots comparing overall survival between OAC patients with low and high JUP expression (left) and CCNE1 expression (right) in the TCGA PanCancer Atlas dataset (Log rank p-value is shown). (E) Number of OAC eRNA-annotated genes that are prognostic for patient survival in the TCGA PanCancer Atlas dataset (Log rank p-value <0.05). (F) Kaplan–Meier plots comparing overall survival between OAC patients with low and high expression of six-gene signatures drawn from the genesets in each sector of Figure 4B; OAC DEE target genes (left), OAC-specific differentially expressed genes (DEGs, middle), or OAC DEE target/OAC DEG intersect (right) in the TCGA PanCancer Atlas dataset (log rank p-value and signature genes are shown).
Tables
Appendix 1—key resources table
| Reagent type (species) or resource | Designation | Source or reference | Identifiers | Additional information |
|---|---|---|---|---|
| Cell line (H. sapiens) | OE19 | ACACC | 96071721 | |
| Cell line (H. sapiens) | CP-A | ATCC | KR-42421 | |
| Cell line (H. sapiens) | OE19-dCas9-KRAB | Rogerson et al., 2020 | OE19 transfected with vector to express dCas9-KRAB under doxycycline control | |
| Antibody | Rabbit monoclonal anti-Erk1/2 antibody | Cell Signalling Technology | 4695S | (1:1000) |
| Antibody | Donkey polyclonal anti-mouse secondary antibody (800CW) | Licor | 925–32,212 | (1:10,000) |
| Antibody | Donkey polyclonal anti-rabbit secondary antibody (700CW) | Licor | 925–32,213 | (1:10,000) |
| Antibody | Mouse monoclonal anti-Cas9 | Diagenode | C15200229 | (1:10,000) |
| Antibody | Rabbit monoclonal anti-BRD4 | Abcam | ab128874 | 0.5 µg/2–4 × 105 cells |
| Antibody | Rabbit polyclonal anti-CTCF | Merck-Millipore | 07-729 | 0.5 µg/2–4 × 105 cells |
| Antibody | Rabbit polyclonal anti-H3K27ac | Abcam | ab4729 | 0.5 µg/2–4 × 105 cells |
| Antibody | Mouse polyclonal anti-H3K27me3 | Merck-Millipore | 07-449 | 0.5 µg/2–4 × 105 cells |
| Antibody | Rabbit polyclonal anti-H3K4me1 | Abcam | ab8895 | 0.5 µg/2–4 × 105 cells |
| Antibody | Rabbit polyclonal anti-H3K4me2 | Diagenode | pAb-035-010 | 0.5 µg/2–4 × 105 cells |
| Antibody | Rabbit poylclonal anti-H3K4me3 | Abcam | ab8580 | 0.5 µg/2–4 × 105 cells |
| Antibody | Rabbit poylclonal anti-H3K36me3 | Diagenode | pAb-058-010 | 0.5 µg/2–4 × 105 cells |
| Antibody | Mouse monoclonal anti-H4K20me1 | Diagenode | mAb-147-010 | 0.5 µg/2–4 × 105 cells |
| Antibody | Mouse monoclonal anti-PolII | Abcam | ab817 | 0.5 µg/2–4 × 105 cells |
| Antibody | Rabbit polyclonal anti-PolII-S2 | Abcam | ab5095 | 0.5 µg/2–4 × 105 cells |
| Antibody | Rabbit polyclonal anti-PolII-S5 | Abcam | ab5131 | 0.5 µg/2–4 × 105 cells |
| Antibody | Rabbit polyclonal anti-Med1 | https://www.antibodies.com/ | A98044/10 UG | 0.5 µg/2–4 × 105 cells |
| Recombinant DNA reagent | pGL3 reporter vector | Promega | E1761 | |
| Recombinant DNA reagent | hSTARR_ORI vector | Addgene | 99296 | |
| Recombinant DNA reagent | pINDUCER20-GFP-AFOS | Britton et al., 2017 | ADS5006 | |
| Recombinant DNA reagent | pCH110 | Amersham | ||
| Recombinant DNA reagent | pMD2.G | Addgene | 12259 | |
| Recombinant DNA reagent | psPAX2 | Addgene | 12260 | |
| Sequence-based reagent | Primers | This study | Primers for amplification through PCR (See supplementary file). Primers can be ordered through any commercial vendor. | |
| Commercial assay or kit | Lipofectamine RNAiMAX | Thermo Fisher | 13778150 | |
| Commercial assay or kit | Cell Line NucleofectorTM Kit V | Lonza | VCA-1003 | Used on Amaxa Nucleofector II with program T-020 |
| Commercial assay or kit | Dual-Light Luciferase & β-Galactosidase Reporter System | Thermo Fisher | T1003 | |
| Commercial assay or kit | SuperScript VILO Master Mix | Thermo Fisher | 11755250 | |
| Commercial assay or kit | PureLink Genomic DNA Mini kit | Thermo Fisher | K182001 | |
| Commercial assay or kit | HiFi assemly | NEB | E5520S | |
| Commercial assay or kit | QuantiTect SYBR Green RT-PCR Kit | Qiagen | 204243 | |
| Commercial assay or kit | RNeasy Plus Mini Kit | Qiagen | 74134 | |
| Commercial assay or kit | RNase-free DNase set | Qiagen | 79254 | |
| Commercial assay or kit | Ampure XP beads | Beckman Coulter Agencourt | A63881 | |
| Commercial assay or kit | TruSeq stranded RNA library kit v2 | Illumina | RS-122-2001 | |
| Commercial assay or kit | Nextera DNA library prep kit | Illumina | FC-121-1031 | |
| Commercial assay or kit | Nextera Index kit | Illumina | FC-121-1012 | |
| Commercial assay or kit | NEBNext high fidelity 2x PCR master mix | NEB | M0541 | |
| Commercial assay or kit | DNA Clean and Concentrator | Zymo | D4013 | |
| Commercial assay or kit | Polyfect | Qiagen | 301107 | |
| Commercial assay or kit | PEG-it | System Biosciences | LV810A-1 | |
| Commercial assay or kit | Polybrene | EMD Millipore | TR-1003 | |
| Chemical compound, drug | Doxycycline | Sigma-Aldrich | D3447 | Used at final concentration of 100 ng/ml |
| Chemical compound, drug | N3-kethoxal | Gift from Chuan He | Used at 5 mM | |
| Peptide, recombinant protein | RNase | Sigma | R4642 | Used at 100 μg/ml |
| Peptide, recombinant protein | pA-Tn5 | Epicypher | 15-1017 | |
| Peptide, recombinant protein | EGF | Thermo Fisher | 10450-013 | 5 μg/l |
| Peptide, recombinant protein | Bovine pituitary extract | Thermo Fisher | 1E+07 | Used at 50 mg/l |
| Software, algorithm | Trimmomatic | Bolger et al., 2014 | V0.34 | http://www.usadellab.org/cms/?page=trimmomatic |
| Software, algorithm | ChromHMM | Ernst and Kellis, 2012 | ||
| Software, algorithm | Bowtie2 | Langmead and Salzberg, 2012 | v2.3.0 | http://bowtie-bio.sourceforge.net/bowtie2/index.shtml |
| Software, algorithm | STAR | Dobin et al., 2013 | V2.5.4 | https://github.com/alexdobin/STAR |
| Software, algorithm | Macs2 | Zhang et al., 2008 | v2.1.1 | https://github.com/taoliu/MACS |
| Software, algorithm | DEseq2 | Love et al., 2014 | V1.22.2 | https://bioconductor.org/packages/release/bioc/html/DESeq2.html |
| Software, algorithm | TOBIAS | Bentsen et al., 2020 | v0.5.1 | https://github.com/loosolab/TOBIAS |
| Software, algorithm | featureCounts | Liao et al., 2014 | V1.6.2 | http://subread.sourceforge.net |
| Software, algorithm | FastQC | v0.11.4 | https://www.bioinformatics.babraham.ac.uk/projects/fastqc/ | |
| Software, algorithm | bedtools | Quinlan and Hall, 2010 | v2.26.0 | https://bedtools.readthedocs.io/en/latest/ |
| Software, algorithm | DeepTools | Ramírez et al., 2016 | V2.5.0 | https://deeptools.readthedocs.io/en/develop/ |
| Software, algorithm | Metascape | Zhou et al., 2019 | https://metascape.org/gp/index.html | |
| Software, algorithm | Homer | Heinz et al., 2010 | v4.9 | http://homer.ucsd.edu/homer/ |
| Software, algorithm | R | R Development Core Team, 2018 | v3.5.1 | https://www.r-project.org/ |
| Software, algorithm | GraphPad Prism | V8.0 | https://www.graphpad.com/ | |
| Software, algorithm | Morpheus | Broad Institute | https://software.broadinstitute.org/morpheus/ | |
| Other | Crystal violet | Sigma-Aldrich | HT90132 | Histological DNA stain. Used at concentration of 0.1% |
| Other | Gibco RPMI 1640 | Thermo Fisher | 52400 | Cell culture medium for OE19s. |
| Other | Gibco fetal bovine serum | Thermo Fisher | 10270 | Cell culture supplement. |
| Other | Gibco penicillin/streptomycin | Thermo Fisher | 15140122 | Cell culture supplement |
| Other | Keratinocyte SFM (1×) | Thermo Fisher | 17005042 | Cell culture medium for CP-As. |
Additional files
-
Supplementary file 1
All expressed eRNAs identified in Barrett’s and OAC samples.
- https://cdn.elifesciences.org/articles/80840/elife-80840-supp1-v2.xlsx
-
Supplementary file 2
eRNAs upregulated in OAC.
- https://cdn.elifesciences.org/articles/80840/elife-80840-supp2-v2.xlsx
-
Supplementary file 3
eRNAs upregulated in Barrett’s.
- https://cdn.elifesciences.org/articles/80840/elife-80840-supp3-v2.xlsx
-
Supplementary file 4
KAS-seq peaks in OE19 cells.
- https://cdn.elifesciences.org/articles/80840/elife-80840-supp4-v2.xlsx
-
Supplementary file 5
Super enhancers.
- https://cdn.elifesciences.org/articles/80840/elife-80840-supp5-v2.xlsx
-
Supplementary file 6
Motif enrichment.
- https://cdn.elifesciences.org/articles/80840/elife-80840-supp6-v2.xlsx
-
Supplementary file 7
BINDetect scores.
- https://cdn.elifesciences.org/articles/80840/elife-80840-supp7-v2.xlsx
-
Supplementary file 8
Genes upregulated in OAC.
- https://cdn.elifesciences.org/articles/80840/elife-80840-supp8-v2.xlsx
-
Supplementary file 9
Genes upregulated in Barrett’s.
- https://cdn.elifesciences.org/articles/80840/elife-80840-supp9-v2.xlsx
-
Supplementary file 10
Genes associated with eRNA regions.
- https://cdn.elifesciences.org/articles/80840/elife-80840-supp10-v2.xlsx
-
Supplementary file 11
PCR primer and sgRNA sequences.
- https://cdn.elifesciences.org/articles/80840/elife-80840-supp11-v2.xlsx
-
Supplementary file 12
CUT&Tag FRIP scores.
- https://cdn.elifesciences.org/articles/80840/elife-80840-supp12-v2.xlsx
-
MDAR checklist
- https://cdn.elifesciences.org/articles/80840/elife-80840-mdarchecklist1-v2.docx
Download links
A two-part list of links to download the article, or parts of the article, in various formats.
Downloads (link to download the article as PDF)
Open citations (links to open the citations from this article in various online reference manager services)
Cite this article (links to download the citations from this article in formats compatible with various reference manager tools)
eRNA profiling uncovers the enhancer landscape of oesophageal adenocarcinoma and reveals new deregulated pathways
eLife 12:e80840.
https://doi.org/10.7554/eLife.80840


