Desiccation resistance differences in Drosophila species can be largely explained by variations in cuticular hydrocarbons
- Department of Entomology, Michigan State University, United States
- Ecology, Evolution, and Behavior Program, Michigan State University, United States
- Institute for Genome Sciences, University of Maryland, United States
- College of Agriculture, Sichuan Agricultural University, China
- Department of Biostatistics, University of Florida, United States
Figures
Figure 1 with 2 supplements
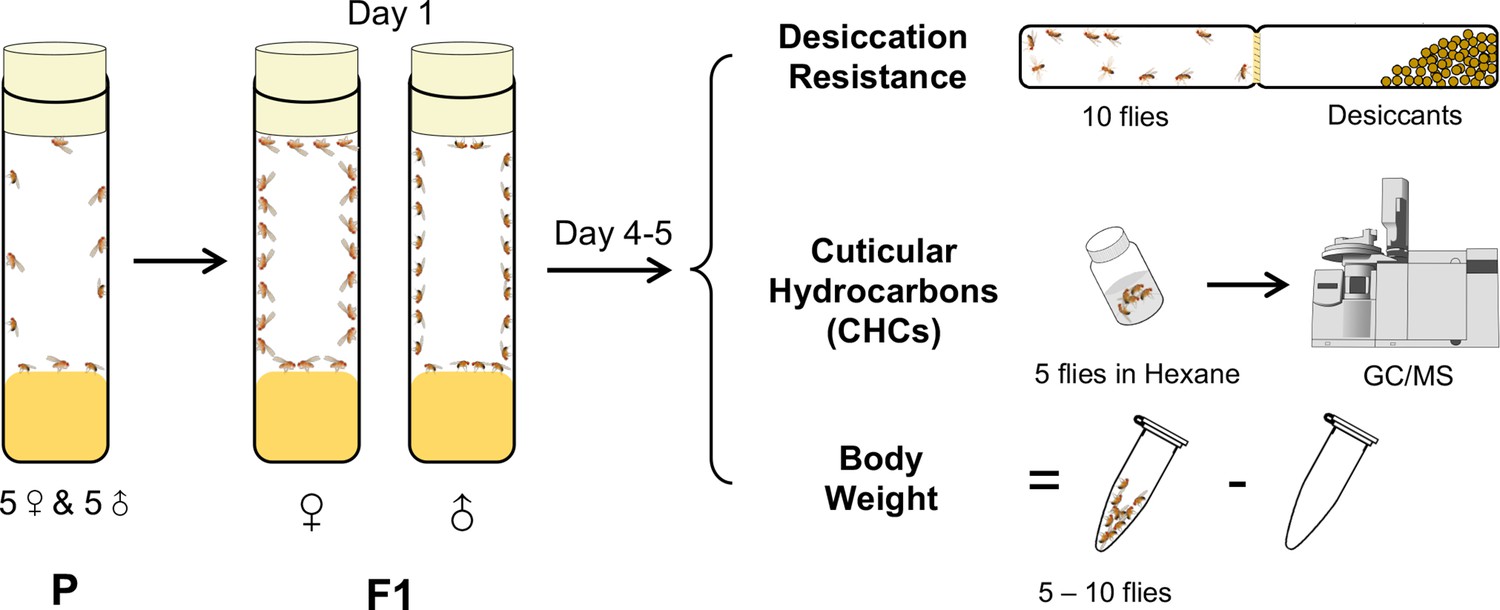
A cohort-based experimental design.
A cohort-based experimental design can facilitate determining the correlation between desiccation resistance, cuticular hydrocarbons (CHCs), and body weight. Five to six cohorts of each species were established.
Figure 1—figure supplement 1
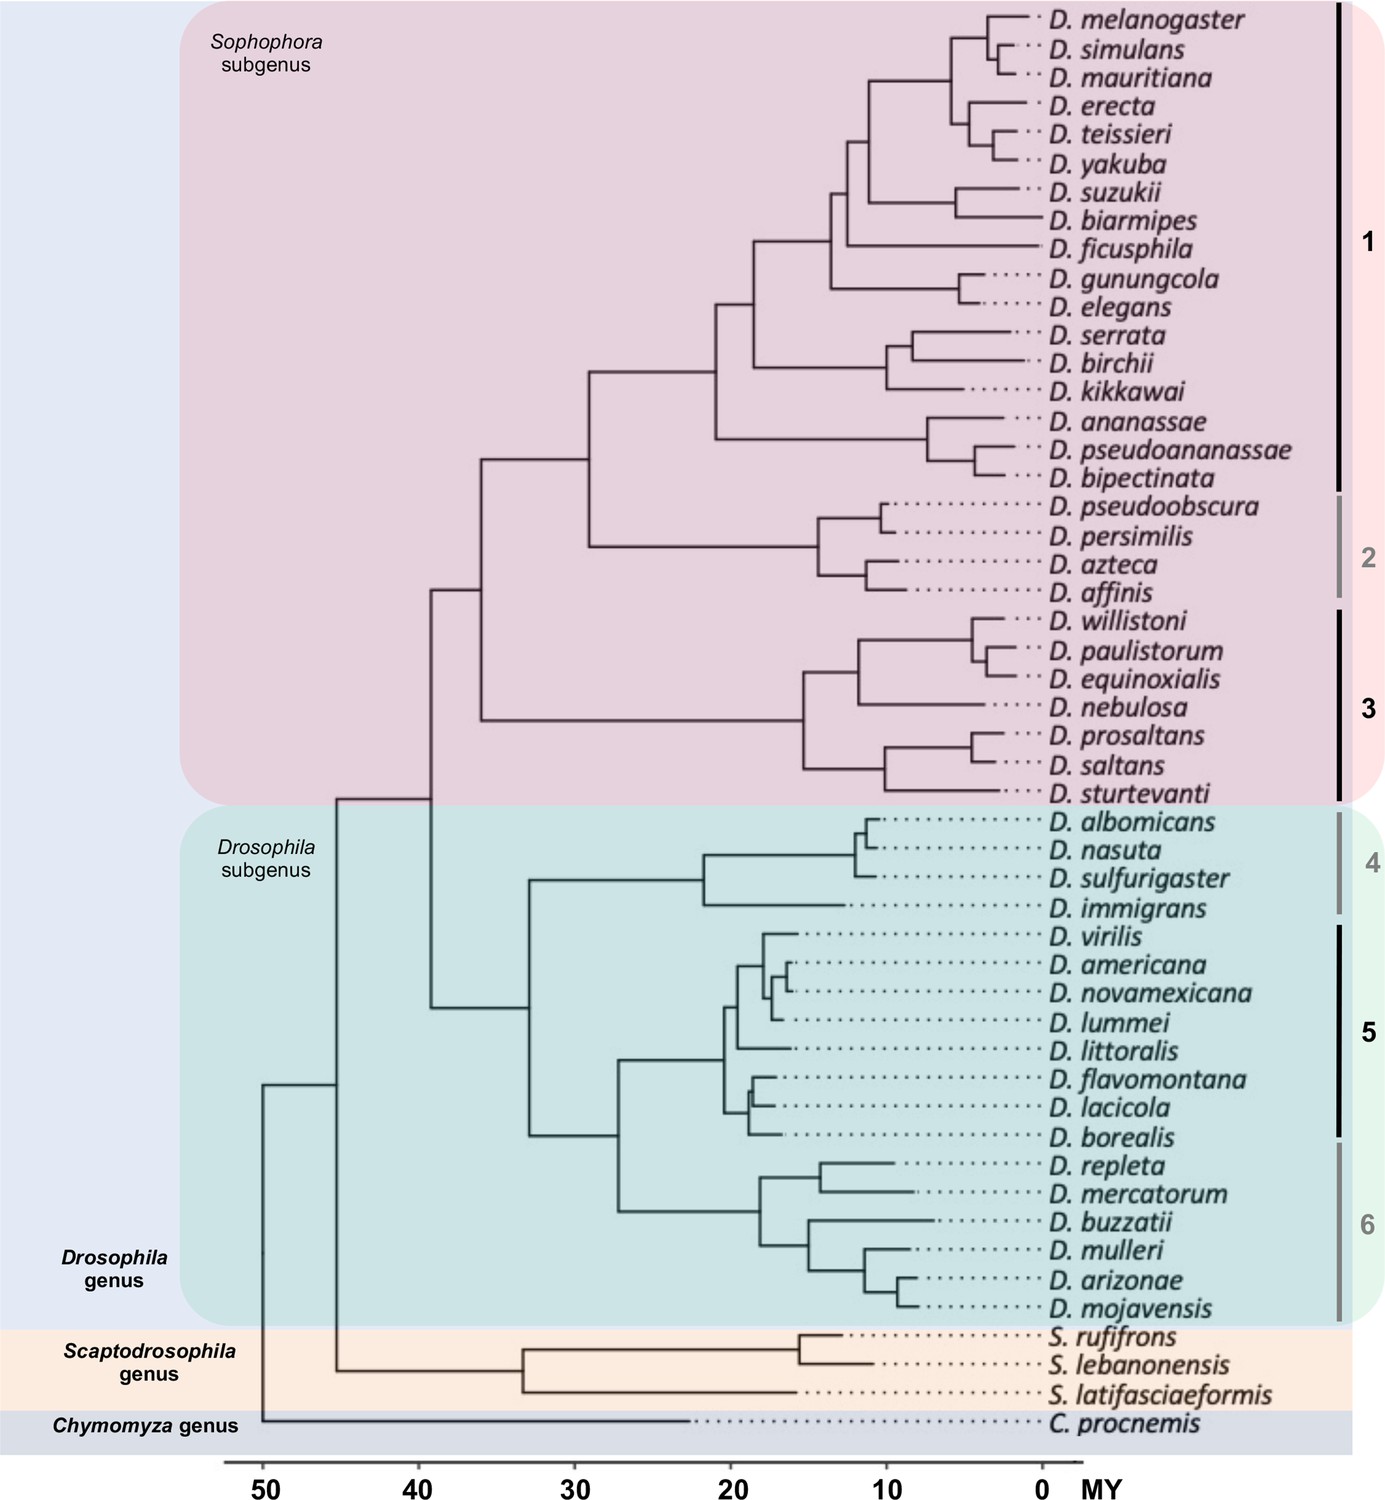
The phylogeny of 50 Drosophila and related species used in this study.
Fifty species representing 46 Drosophila species (18 from Drosophila subgenus, 28 from Sophophora subgenus) and 4 species (3 Scaptodrosophila species and 1 Chymomyza species) as outgroup were used in our study. The 46 Drosophila species represent some of the main groups in the Drosophila genus: (1) melanogaster group, (2) obscura group, (3) willistoni group, (4) nasuta group, (5) virilis group, and (6) repleta group.
Figure 1—figure supplement 2
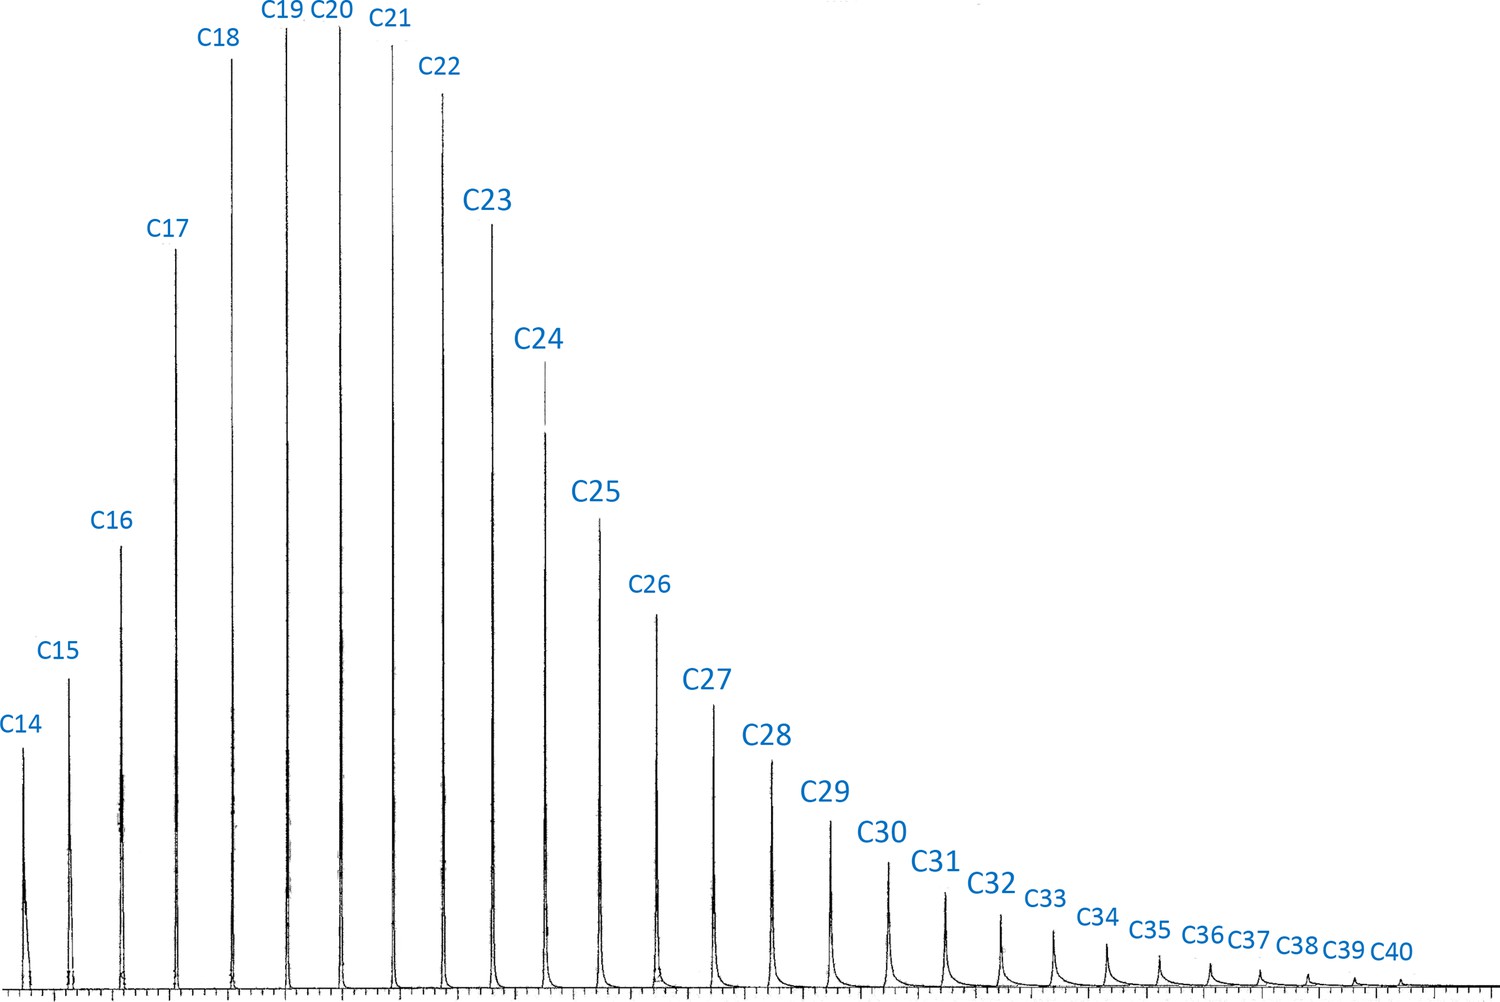
Chromatogram of the authentic standard n-alkane mixture which contains 34 n-alkanes from C7 to C40 at the same concentration.
The authentic standard n-alkane mixture (C7–C40; Supelco 49,452U) was obtained from Sigma-Aldrich (St. Louis, MO). C7–C14 were excluded in the chromatogram due to the solvent delay in the gas chromatography–mass spectrometry (GC–MS) program. The integration of peak areas on longer cuticular hydrocarbons (CHCs) is biased to have lower values. To address this issue, we corrected the peak areas of CHCs based on the carbon-chain lengths using the integration from this standard n-alkane mixture.
Figure 2 with 2 supplements
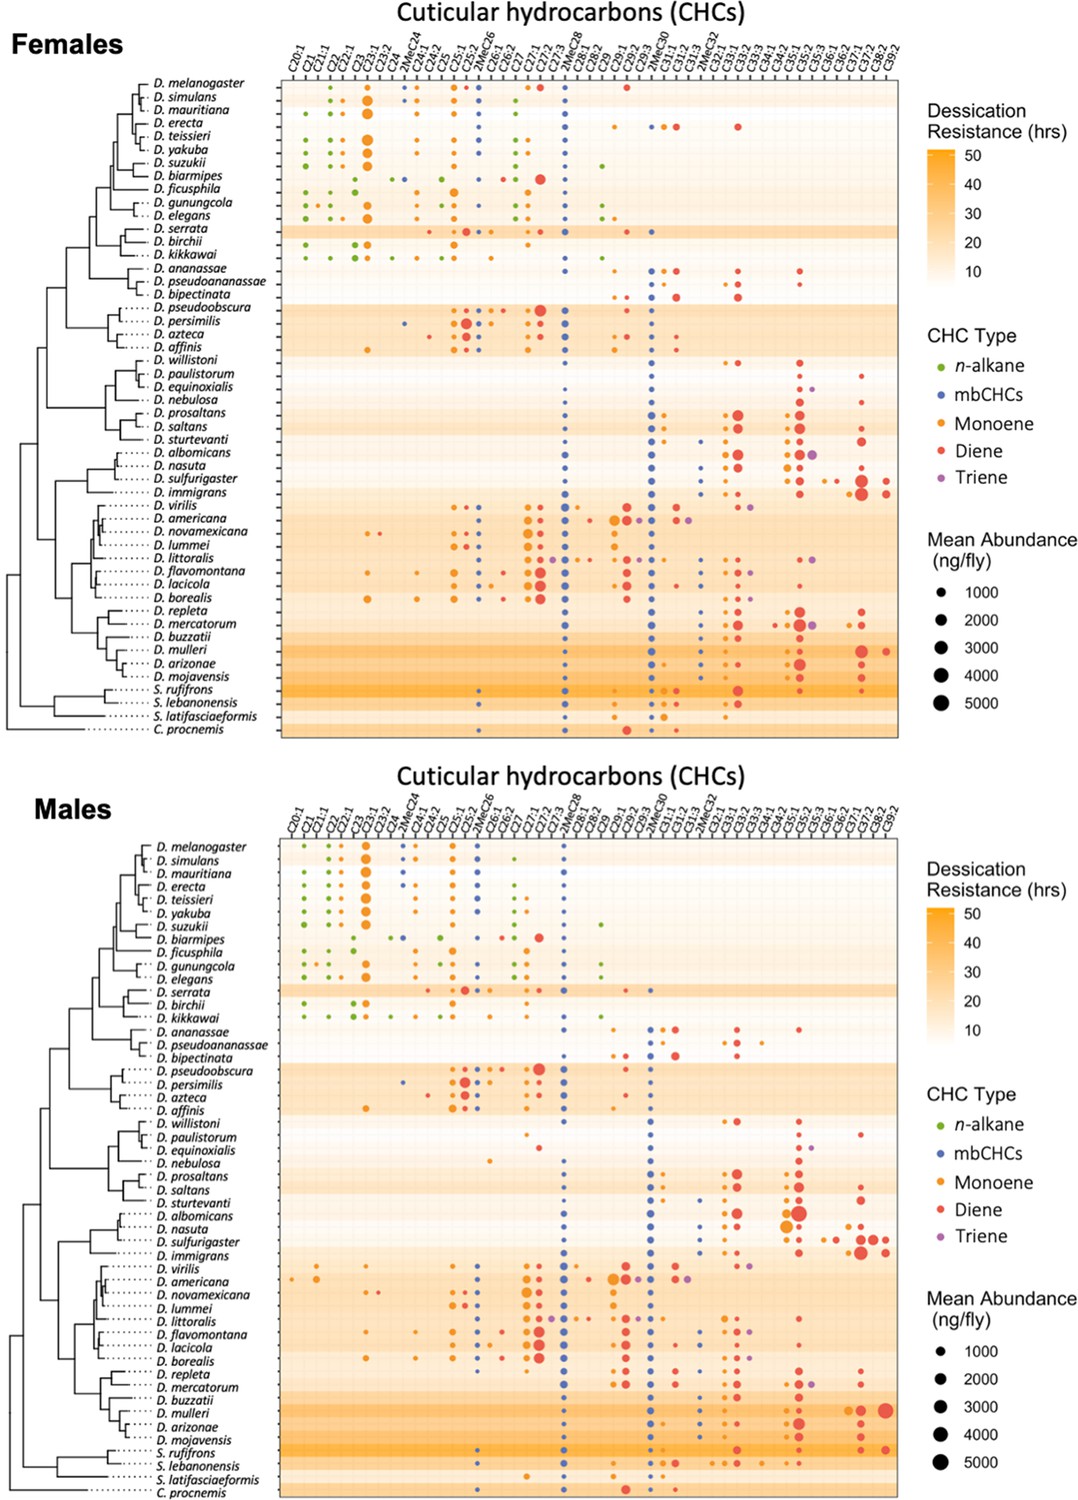
Desiccation resistance and cuticular hydrocarbon (CHC) composition in 46 Drosophila species and 4 outgroup species.
Desiccation resistance and CHC composition of each species were plotted together. Males and females are shown separately. The shading intensity of each species represents the number of hours of desiccation resistance, while the size and color of each circle represent the type of CHC and its quantity. n-Alkanes are only present in some species from the melanogaster group.
Figure 2—figure supplement 1
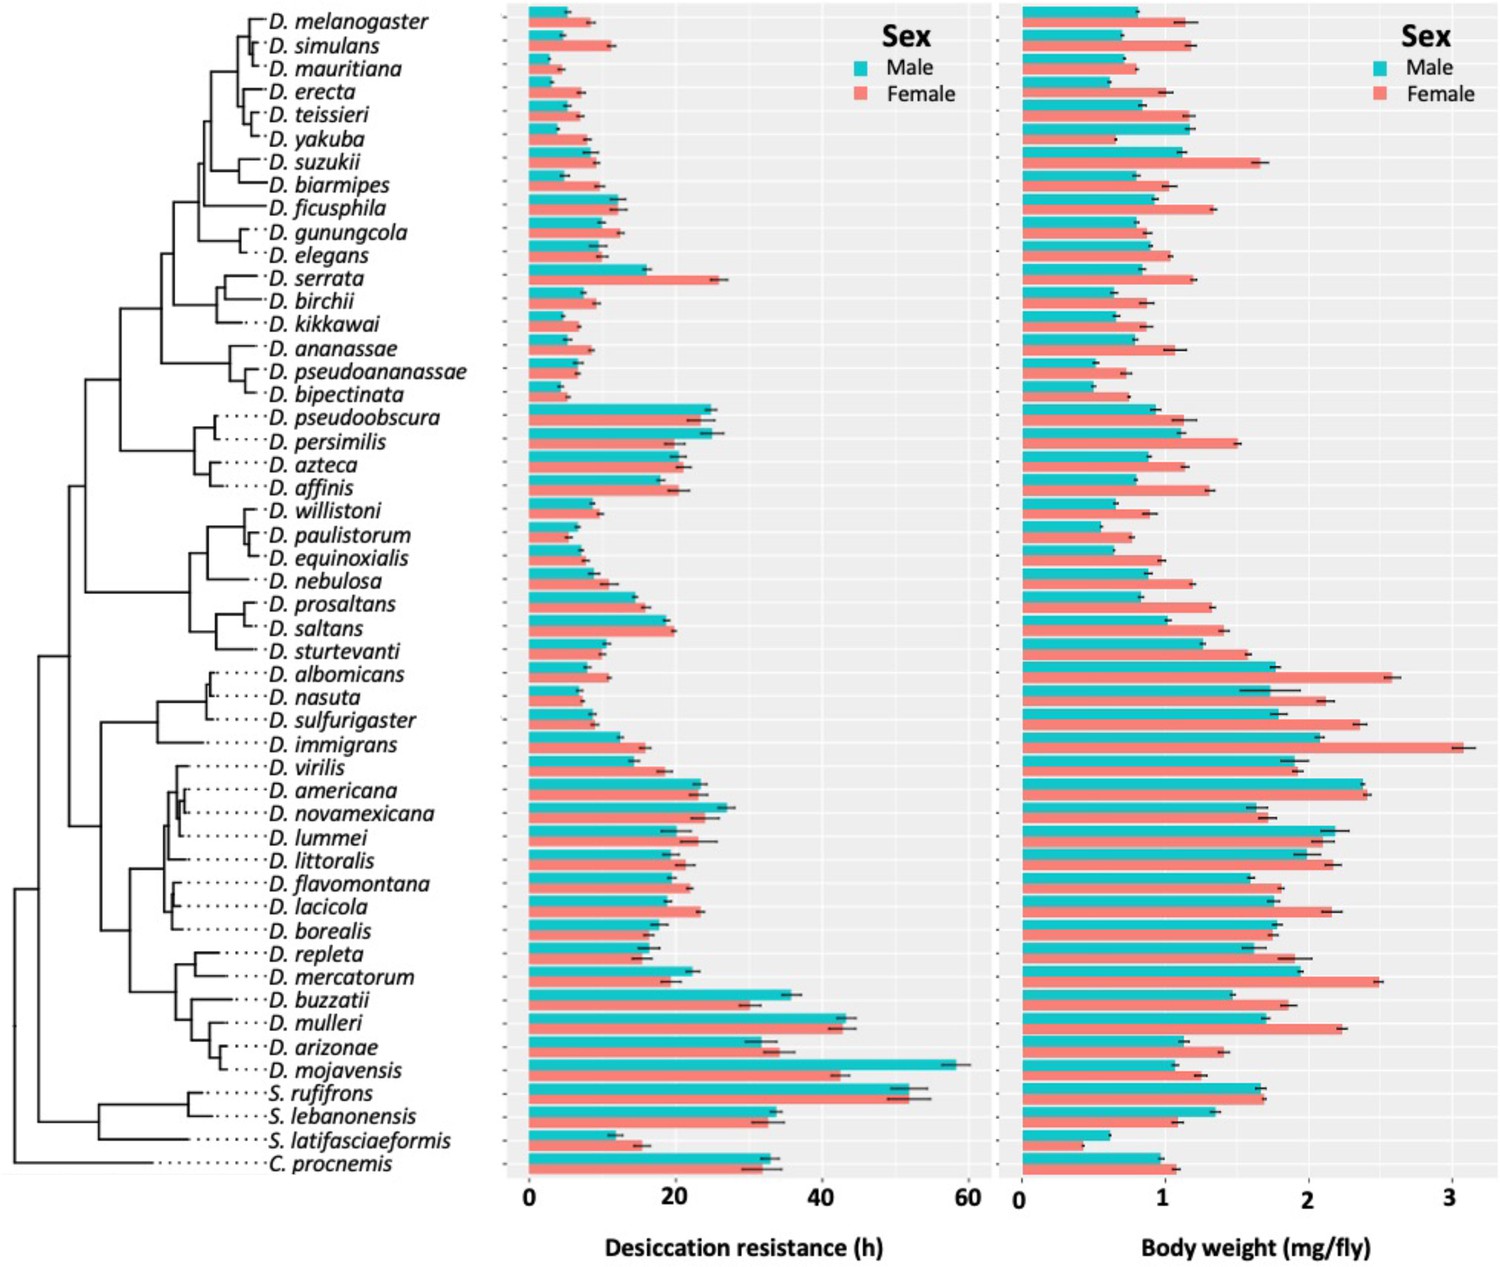
Desiccation resistance and body weight in 46 Drosophila species and 4 outgroup species.
Desiccation resistance and body weight are shown in separate graphs.
Figure 2—figure supplement 2
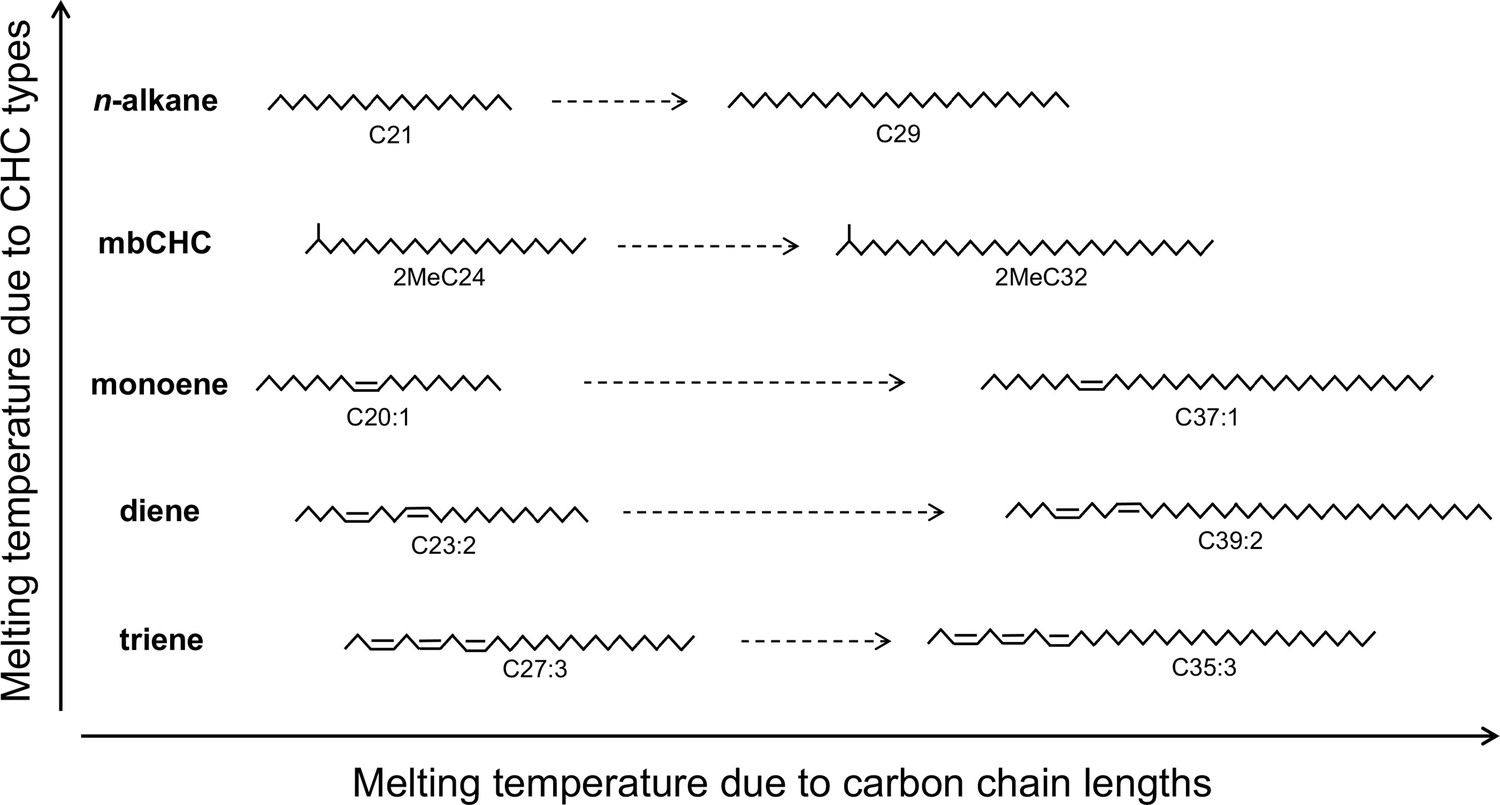
The melting temperature of cuticular hydrocarbons (CHCs) is determined by methyl group, double bonds, and carbon-chain length.
Five types of CHCs are detected in this study. Due to their chemical structures, n-alkanes have the highest melting temperatures followed by mbCHCs, monoenes, dienes, and trienes. Increasing length of the carbon-chain can also increase melting temperature. The positions of double bonds in this figure are for illustrative purposes and were not determined in this study.
Figure 3 with 1 supplement
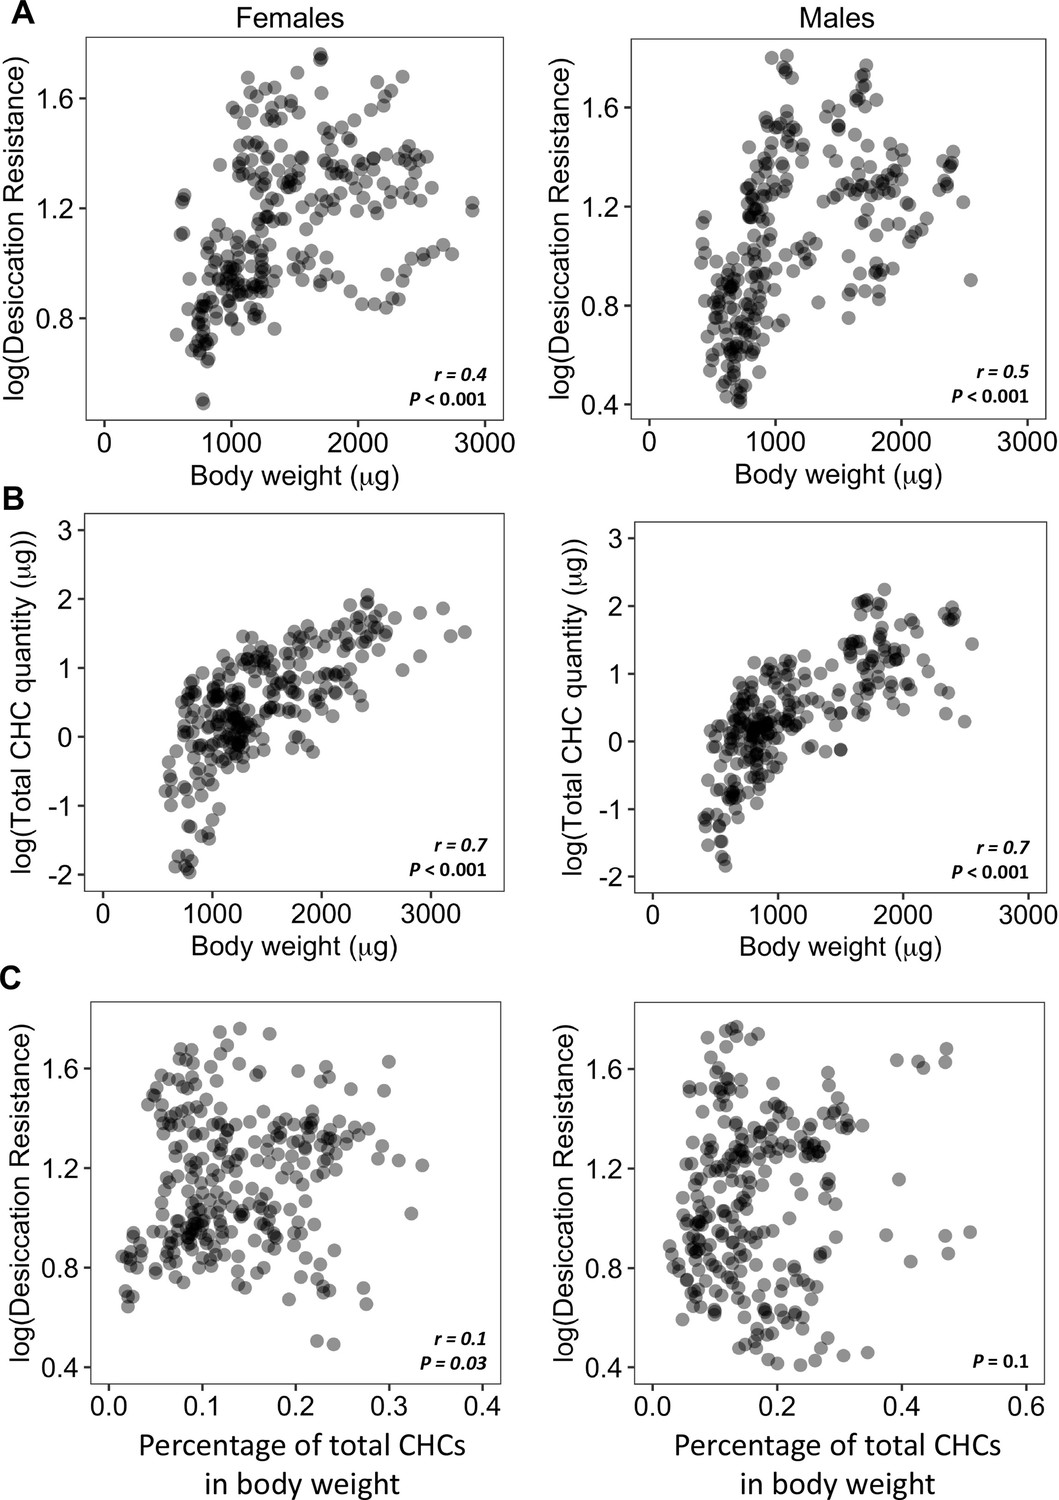
Higher amounts of cuticular hydrocarbons (CHCs) do not contribute to higher desiccation resistance.
(A) Body weight is positively correlated with desiccation resistance (Females: r = 0.4, p < 0.001, Males: r = 0.5, p < 0.001). (B) Total amount of CHCs is correlated with having higher body weight (Females: r = 0.7, p < 0.001, Males: r = 0.7, p < 0.001). (C) A weak positive correlation between desiccation resistance and CHCs as a percentage of body weight in females, while no correlation in males (Females: r = 0.1, p = 0.03, Males: p = 0.1). All correlation analyses were conducted using Pearson’s method.
Figure 3—figure supplement 1
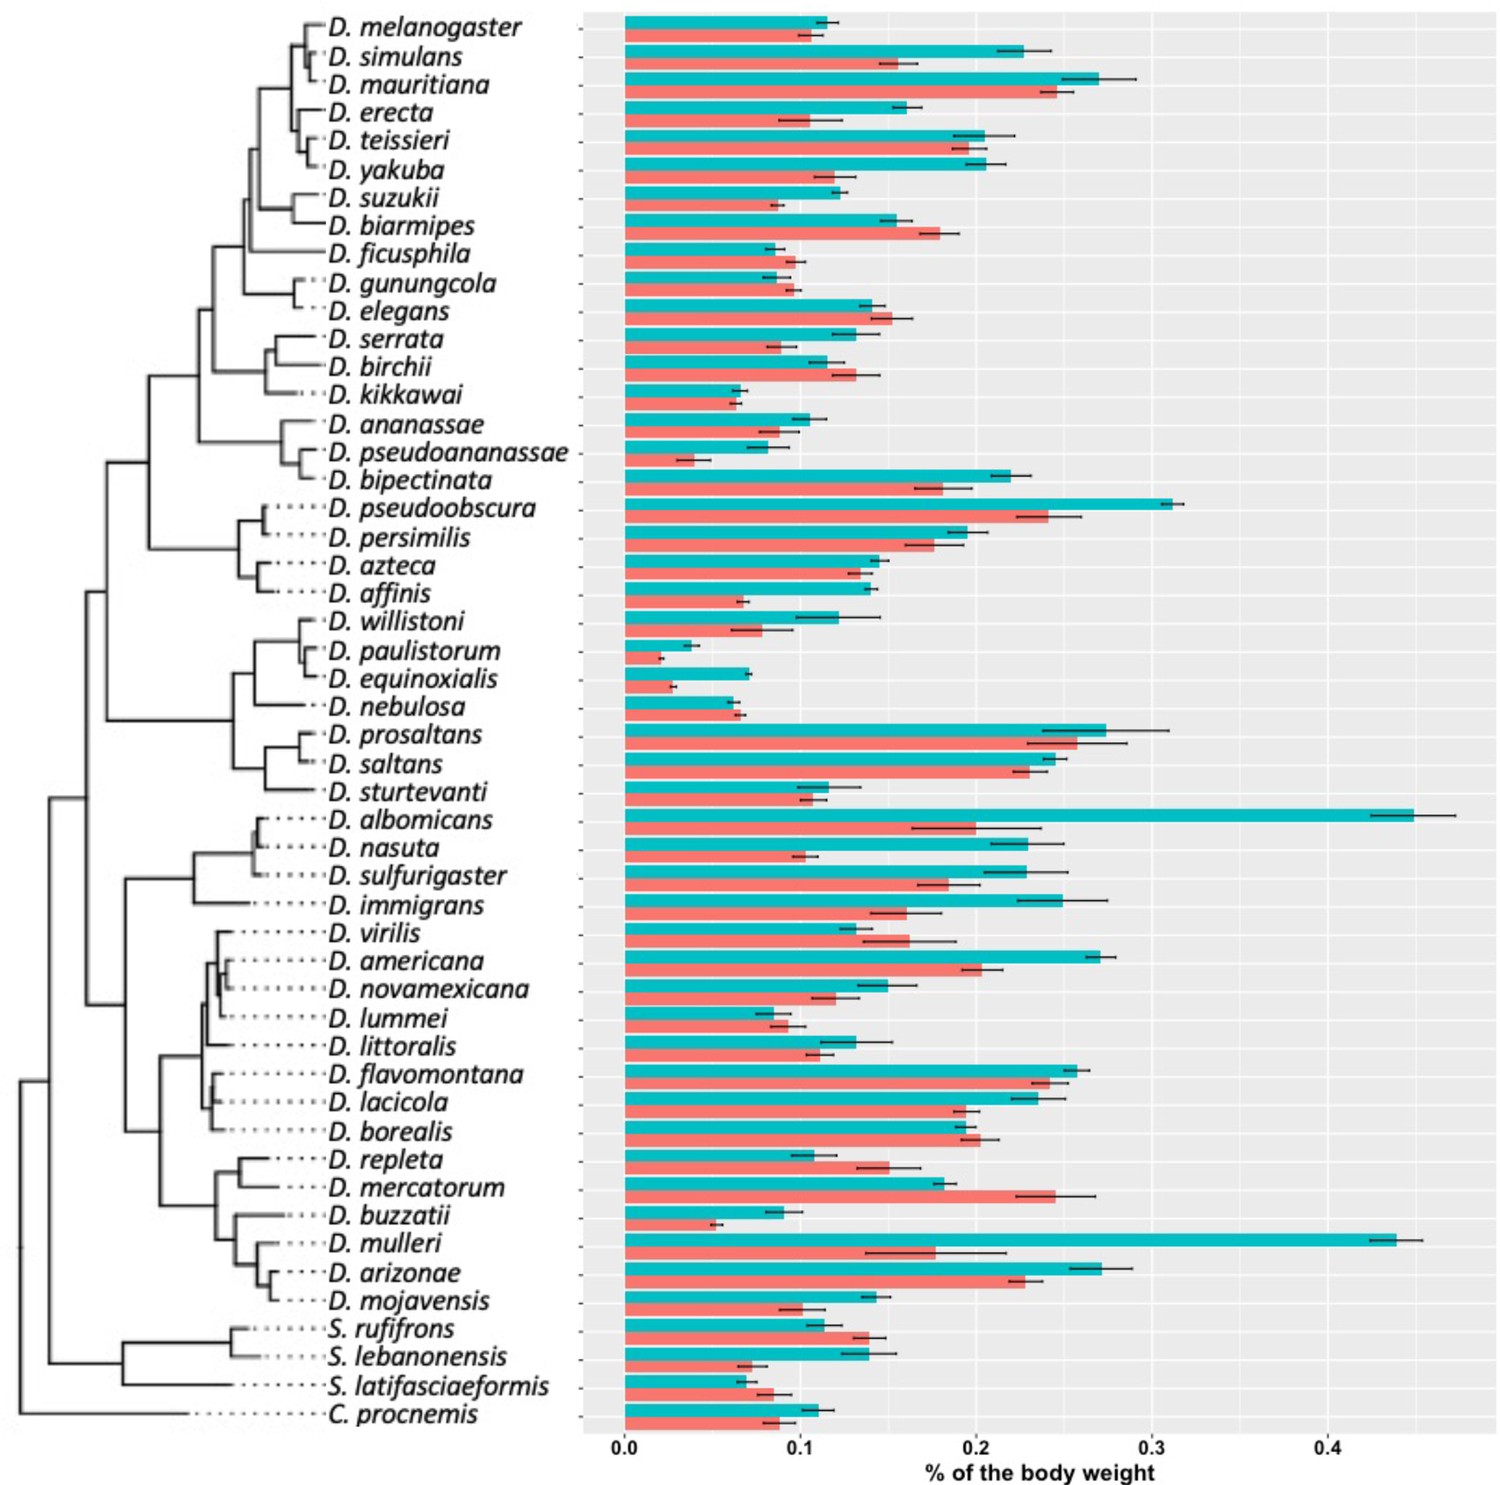
Cuticular hydrocarbon (CHC) quantity as a percentage of body weight.
As Drosophila species largely vary in size, we normalized the total CHCs as a percentage of body weight. CHCs account from 0.02% to 0.5% of the total body weight of different species.
Figure 4 with 2 supplements
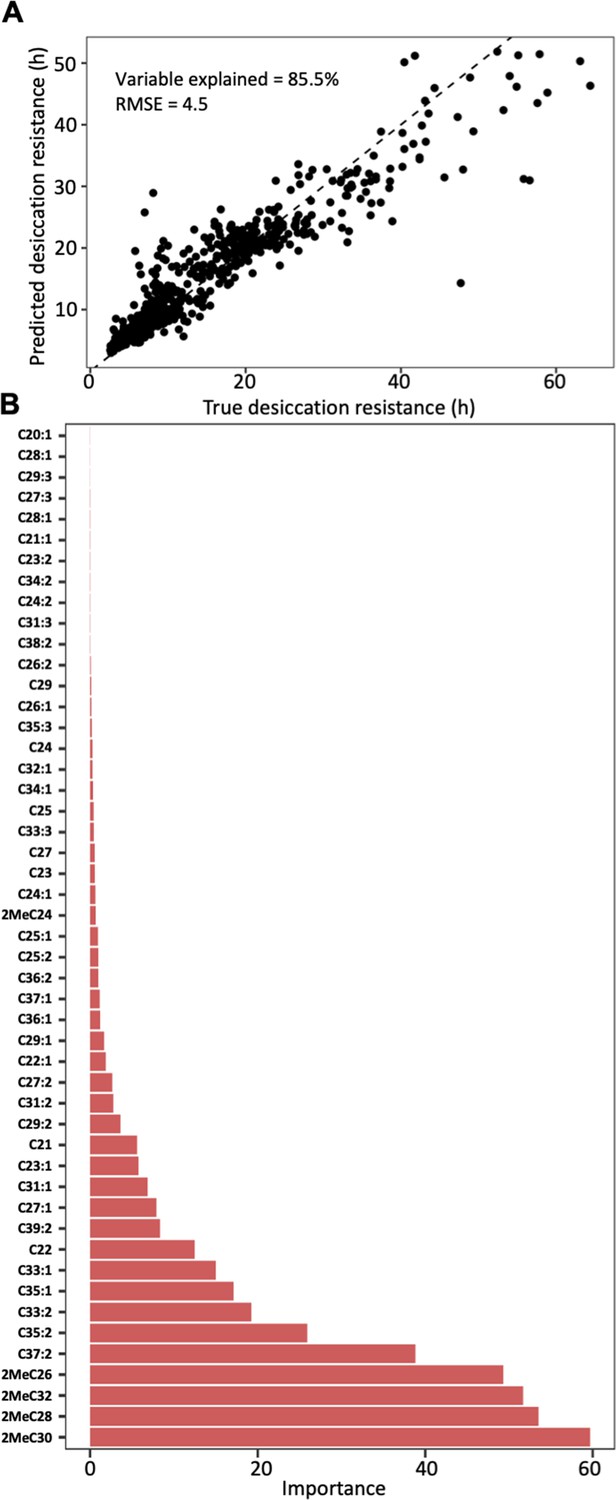
Cuticular hydrocarbon (CHC) composition can be used to predict desiccation resistance.
(A) Random Forest regression modeling of CHC abundance was able to explain 85.5% of the variation in time to desiccation with a root mean square error (RMSE) of 4.5. (B) The abundance of four mbCHCs, 2MeC30, 2MeC28, 2MeC32, and 2MeC26, has the highest importance to the desiccation resistance in the random forest regression model, while most of CHCs have less contribution to the accuracy of the model for desiccation resistance.
Figure 4—figure supplement 1
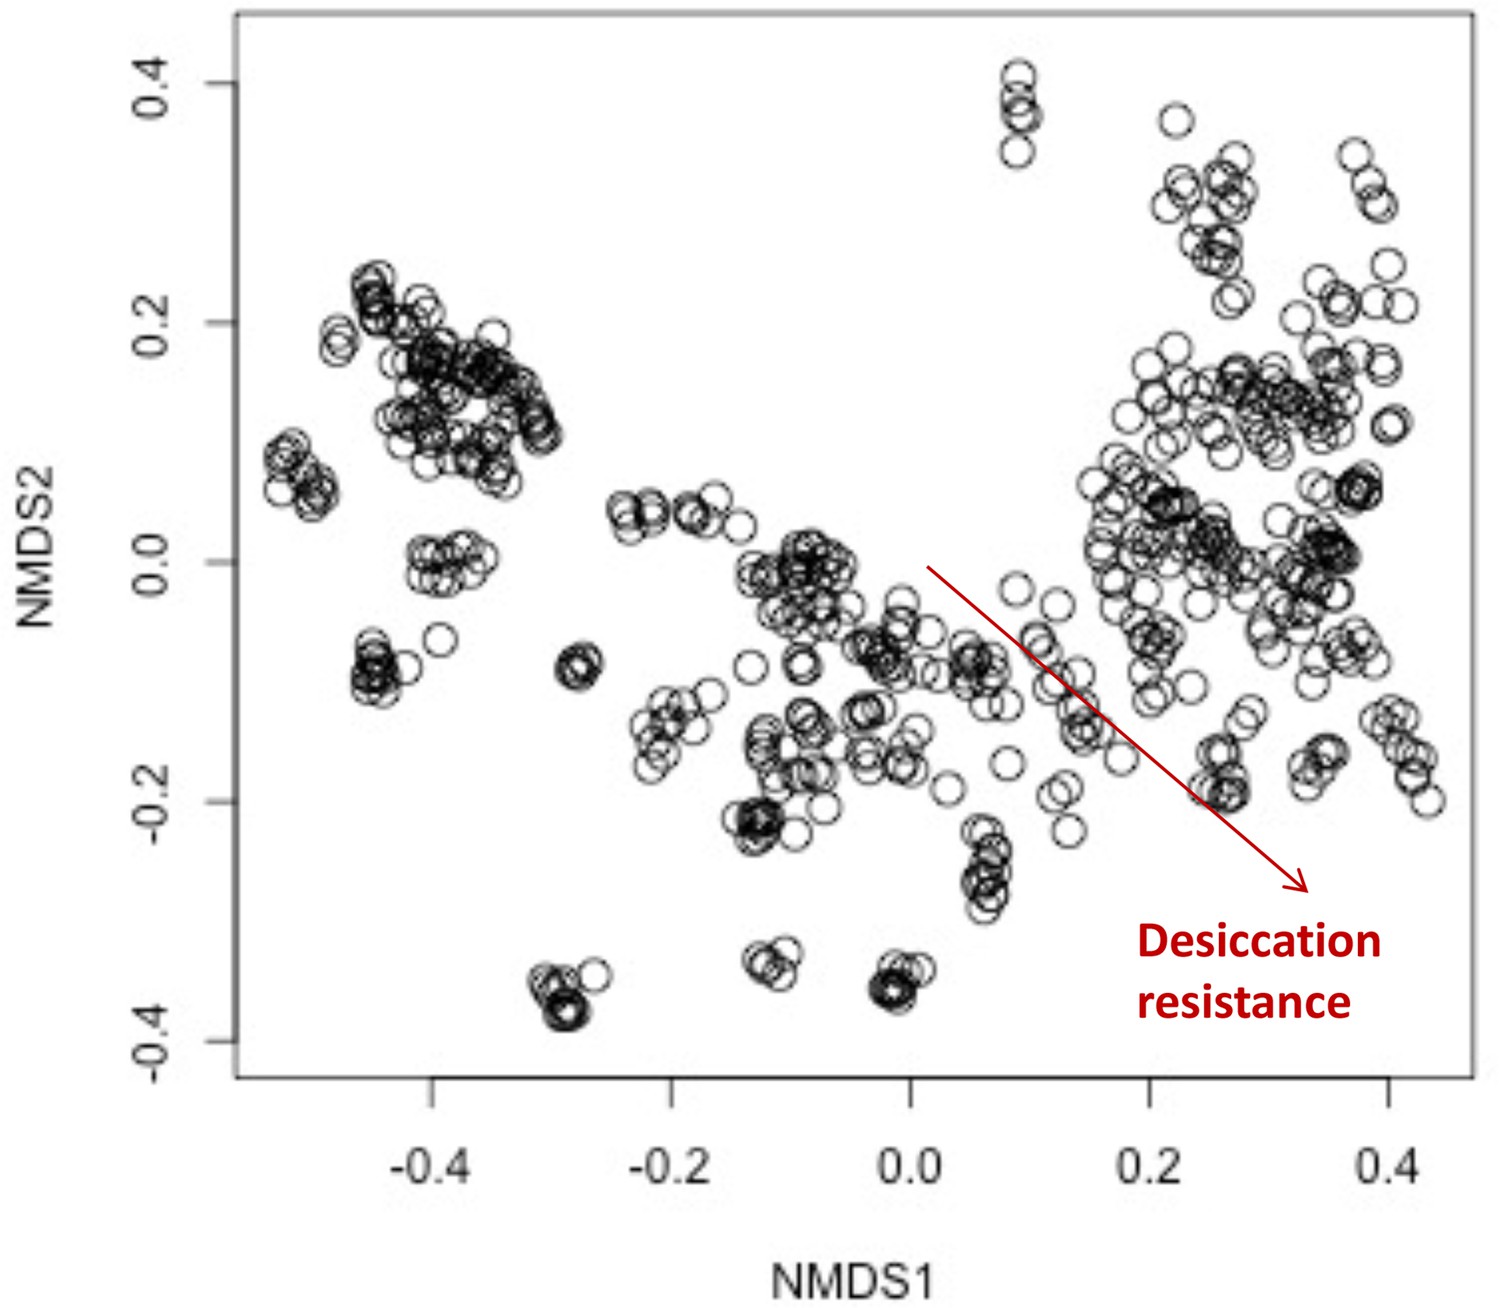
The composition of cuticular hydrocarbons (CHCs) significantly differed across the increasing desiccation resistance.
The non-metric multidimensional scaling (NMDS) plot showing the beta diversity of CHCs differs significantly across the increasing desiccation resistance (permutational multivariate analysis of variance [PERMANOVA]: r2 = 0.1, p < 0.001), suggesting CHC composition could affect desiccation resistance in the 50 Drosophila and selected species.
Figure 4—figure supplement 2
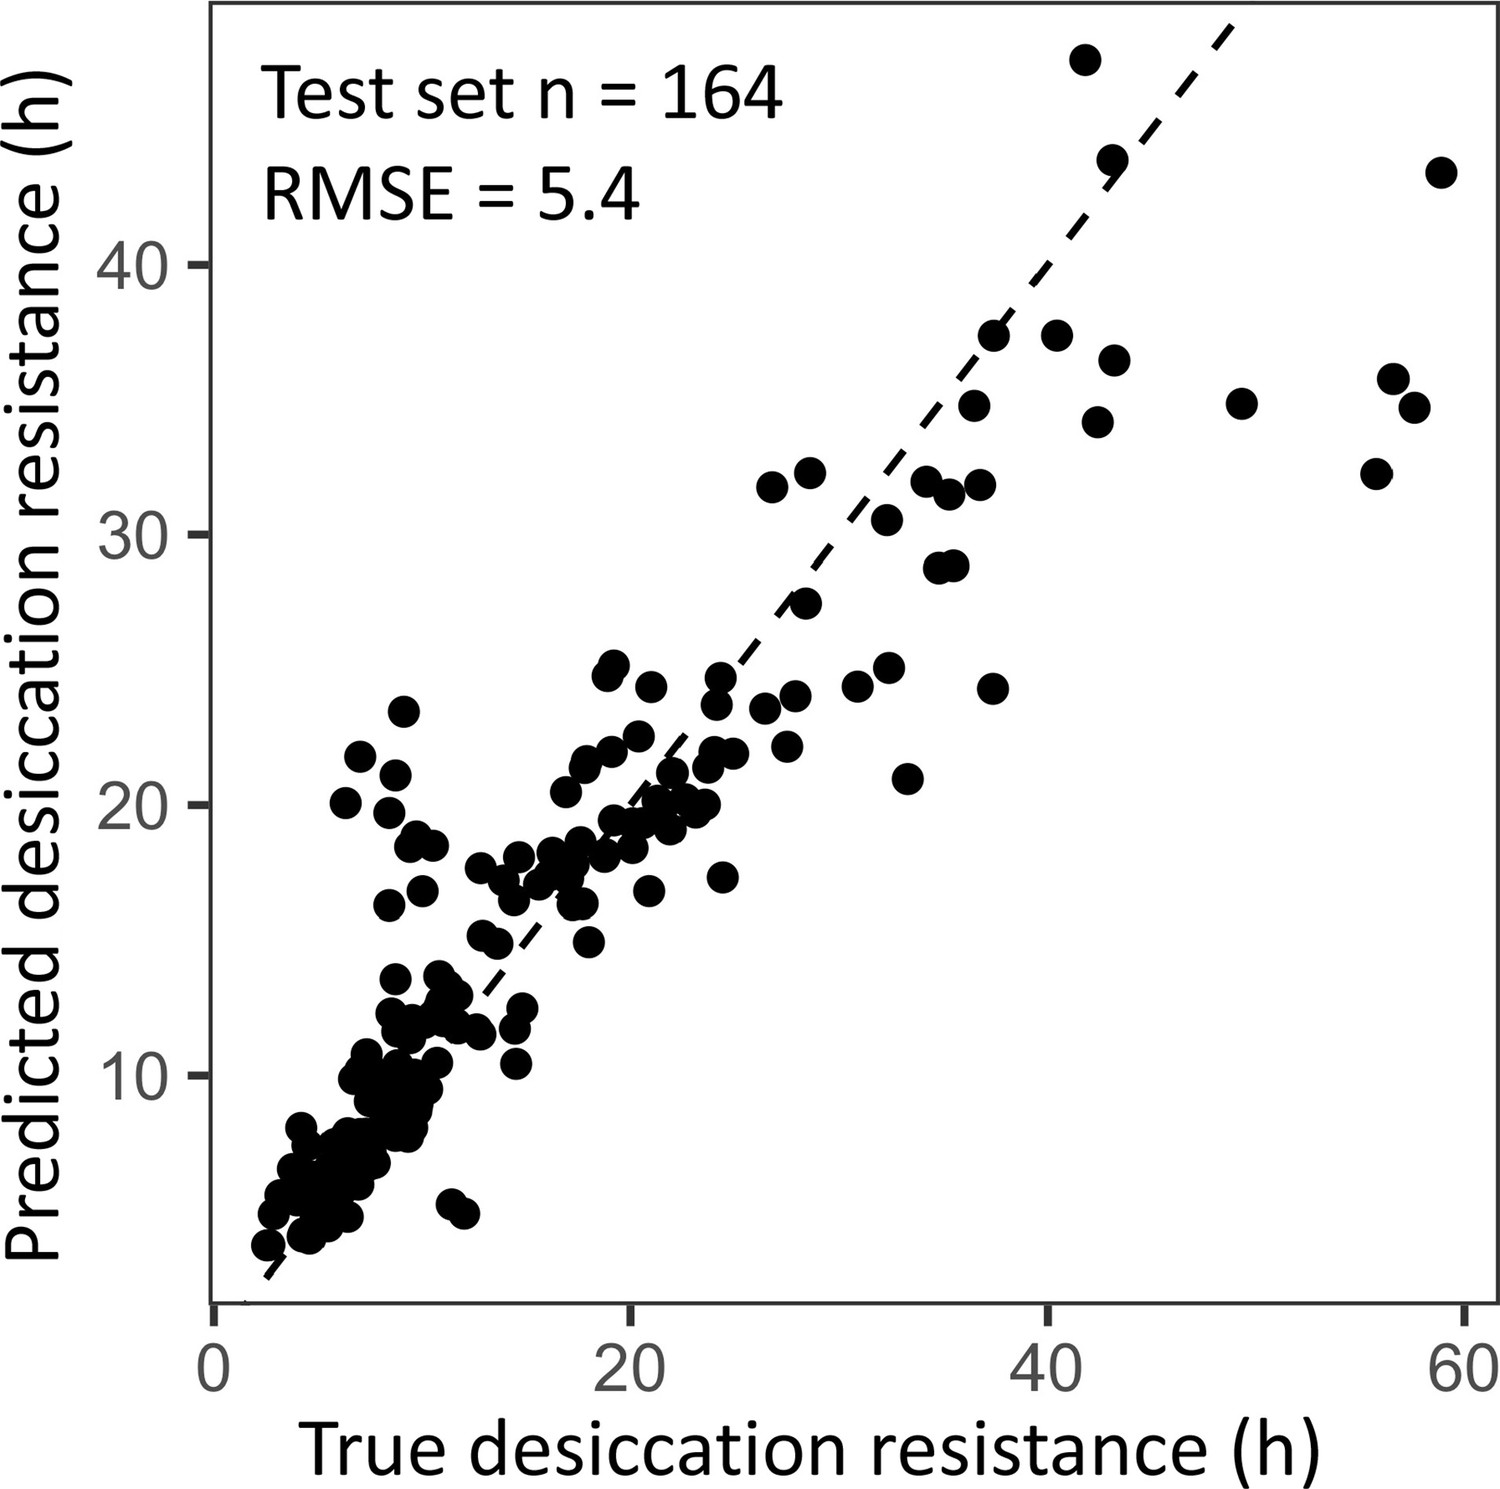
Cross-validation of the random forest regression model has a similar performance to the regression model using the full dataset.
A 70:30 training/test split in the dataset (n = 382, n = 164) was used to evaluate the performance of the random forest regression model. The out of bag estimate of the root mean square error (RMSE) in the split dataset is 5.4, which is similar to the RMSE using the full dataset (RNMSE = 4.5).
Figure 5 with 9 supplements
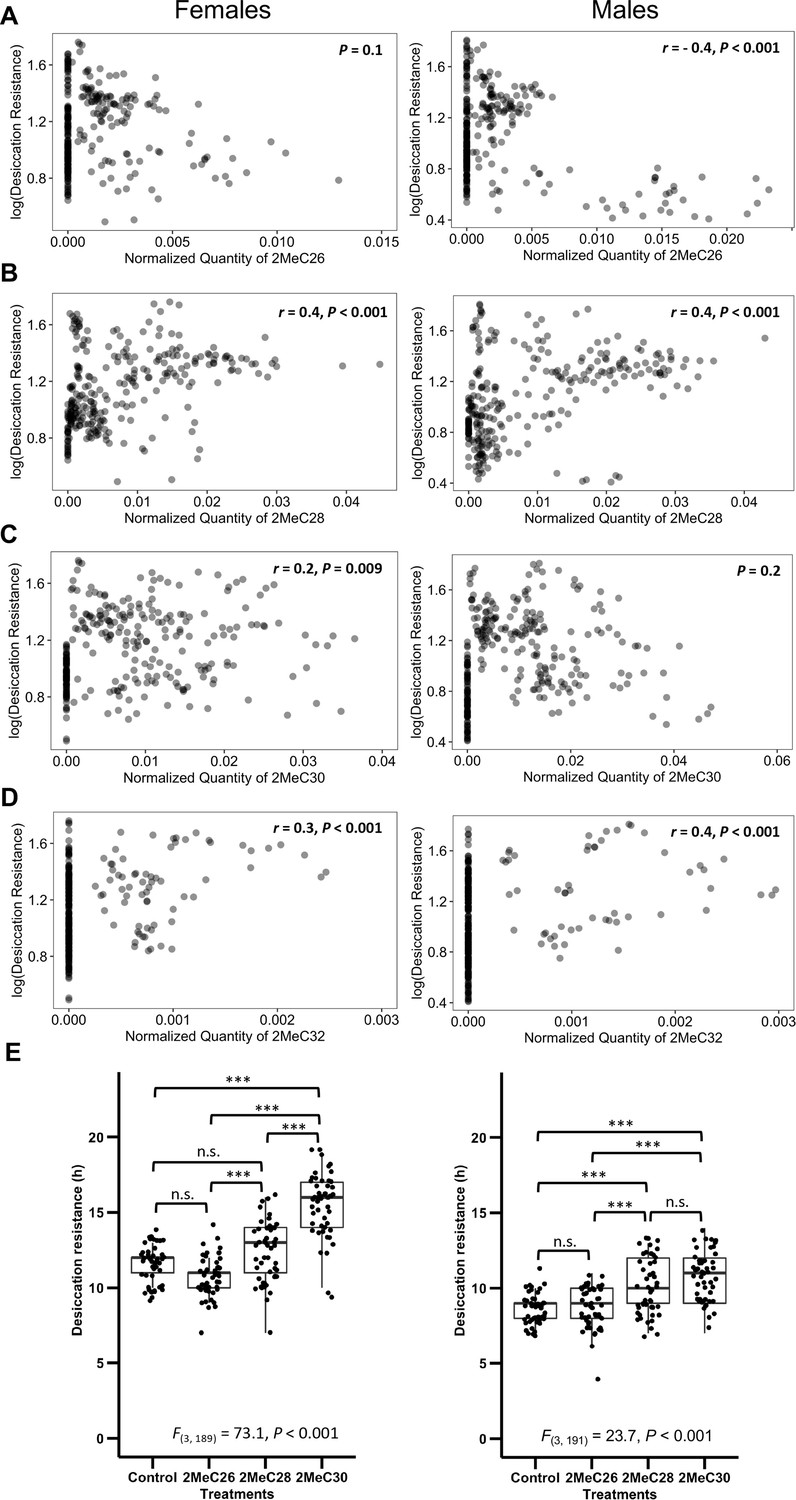
Longer mbCHCs are associated with higher desiccation resistance.
(A) Quantity of 2MeC26 is negatively correlated with desiccation resistance in males, but no correlation in females (Females: p = 0.1, Males: r = −0.4, p < 0.001). (B) Quantity of 2MeC28 is positively correlated with desiccation resistance (Females: r = 0.4, p < 0.001, Males: r = 0.4, p < 0.001). (C) Quantity of 2MeC30 is positively correlated with desiccation resistance in females, but no correlation in males (Females: r = 0.2, p = 0.009, Males: p = 0.2). (D) Quantity of 2MeC32 is positively correlated with desiccation resistance (Females: r = 0.3, p < 0.001, Males: r = 0.4, p < 0.001). Correlations between the quantities of each mbCHC and desiccation resistance were determined using Pearson’s method. (E) D. melanogaster coated with longer mbCHCs have higher desiccation resistance. Coating of synthetic mbCHCs on D. melanogaster showed that 2MeC26 does not influence desiccation resistance. 2MeC30 increases desiccation resistance in female D. melanogaster while both 2MeC28 and 2MeC30 in increases desiccation resistance in male D. melanogaster. The bold horizontal line within each box plot corresponds to the median value, the box length to the interquartile range, and the lines emanating from the box (whiskers) extend to the smallest and largest observations. One-way analysis of variance (ANOVA) showed significant differences between D. melanogaster flies coated with different mbCHCs (Female: F(3,189) = 73.1, p < 0.001, Male: F(3,191) = 23.7, p < 0.001). Post hoc comparison was conducted using Tukey’s method. ***p < 0.001; n.s. refers to not significant.
-
Figure 5—source data 1
Desiccation resistance of Drosophila melanogaster attP40 flies when coated with individual mbCHC of 2MeC26, 2MeC28, and 2MeC30.
- https://cdn.elifesciences.org/articles/80859/elife-80859-fig5-data1-v2.xlsx
-
Figure 5—source data 2
Desiccation resistance of Drosophila melanogaster attP40 flies when coated with individual n-alkane of C23, C25, C27, C29, and C31.
- https://cdn.elifesciences.org/articles/80859/elife-80859-fig5-data2-v2.xlsx
-
Figure 5—source data 3
Desiccation resistance of Drosophila melanogaster CHC- flies when coated with individual CHC of 2MeC26, 2MeC28, 2MeC30, C23, C25, C27, C29, and C31.
- https://cdn.elifesciences.org/articles/80859/elife-80859-fig5-data3-v2.xlsx
Figure 5—figure supplement 1
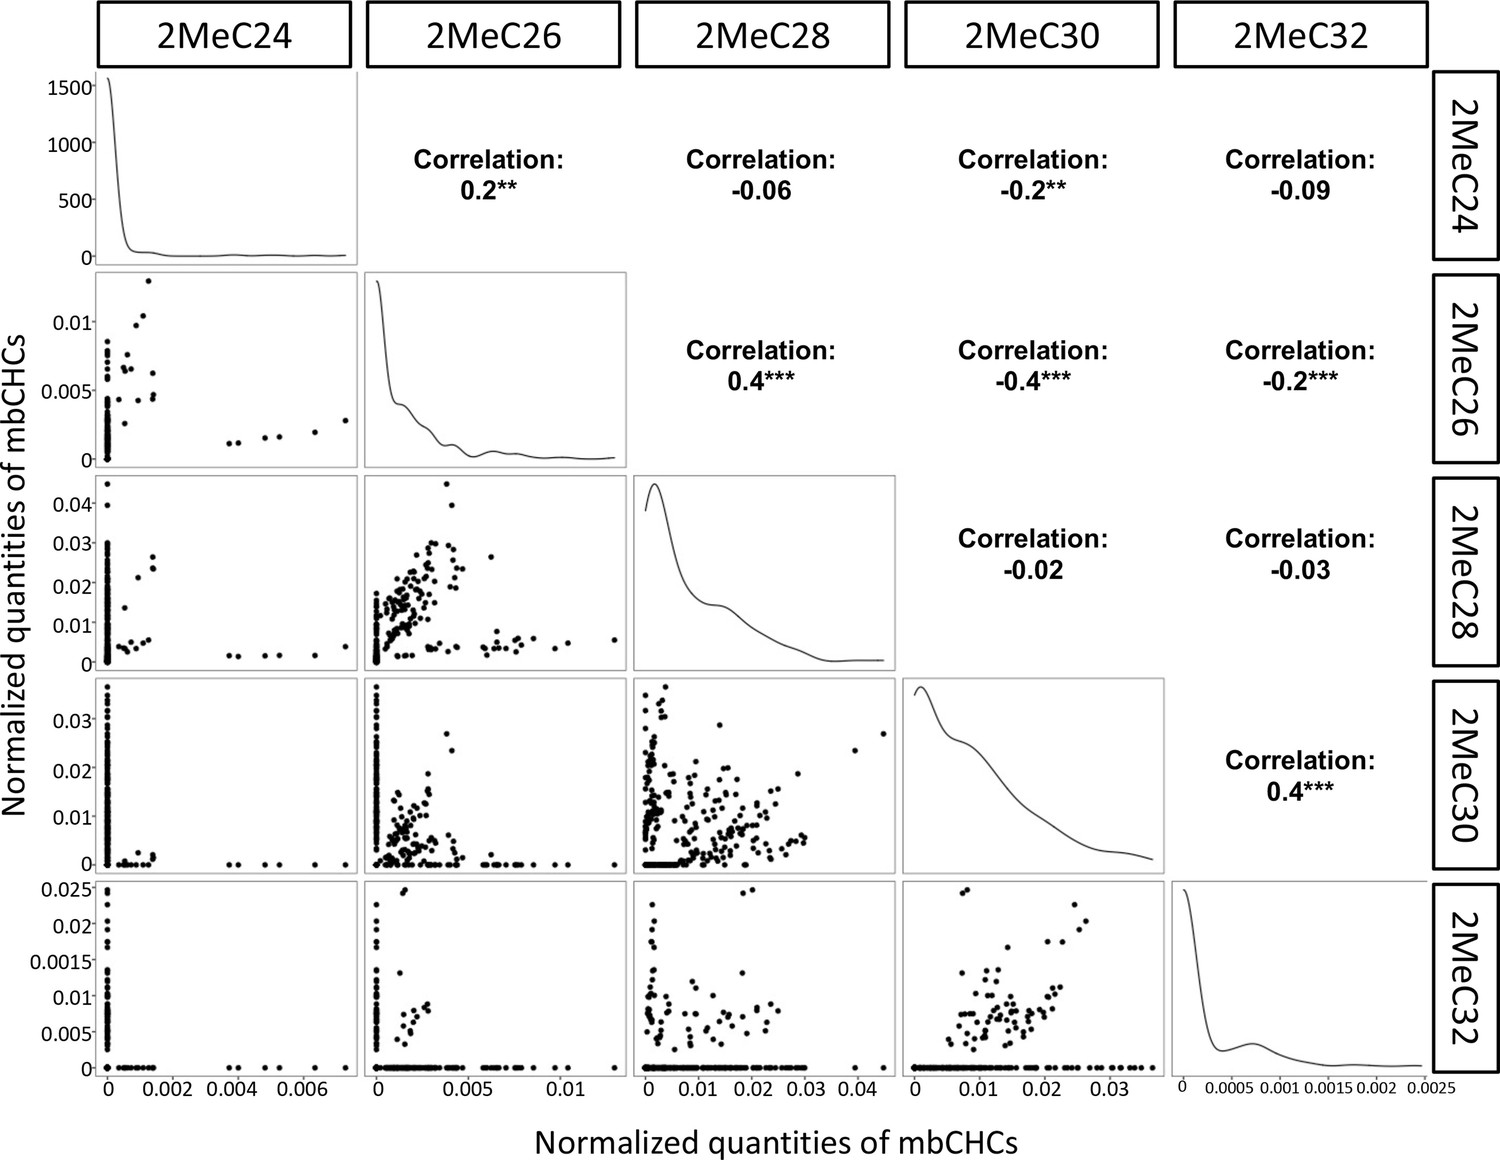
Correlation between different mbCHCs in 50 Drosophila and related species.
Correlation between different mbCHCs was determined using Pearson’s method. Significant correlations between each pairs of mbCHCs were labeled with stars following with the correlation coefficients. The lines on the diagonals represent the distribution of the data for each mbCHC. **p < 0.01; ***p < 0.001.
Figure 5—figure supplement 2
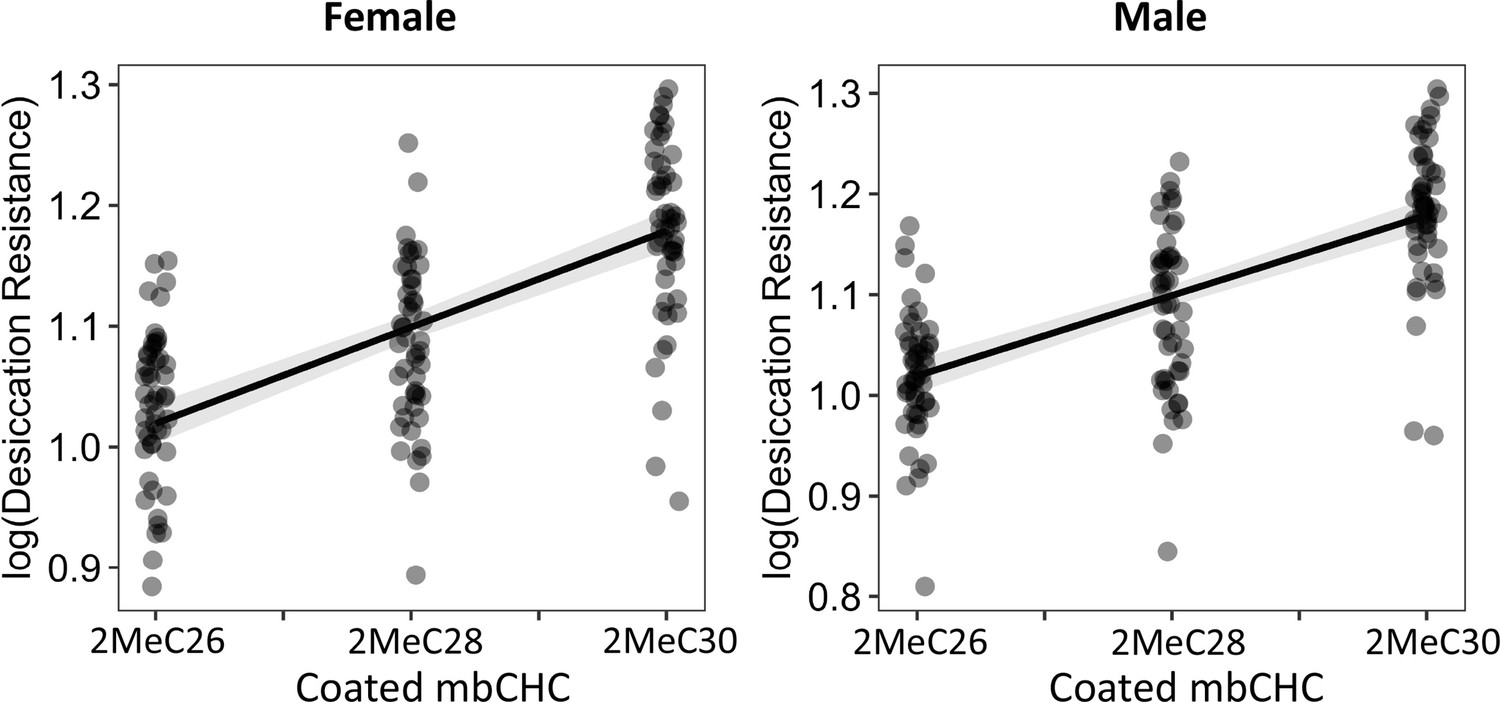
The length of coated mbCHCs on D. melanogaster attP40 flies is positively correlated with desiccation resistance in both females and males.
Pearson’s correlation: Female, r = 0.7, p < 0.001; Male, r = 0.5, p < 0.001.
Figure 5—figure supplement 3
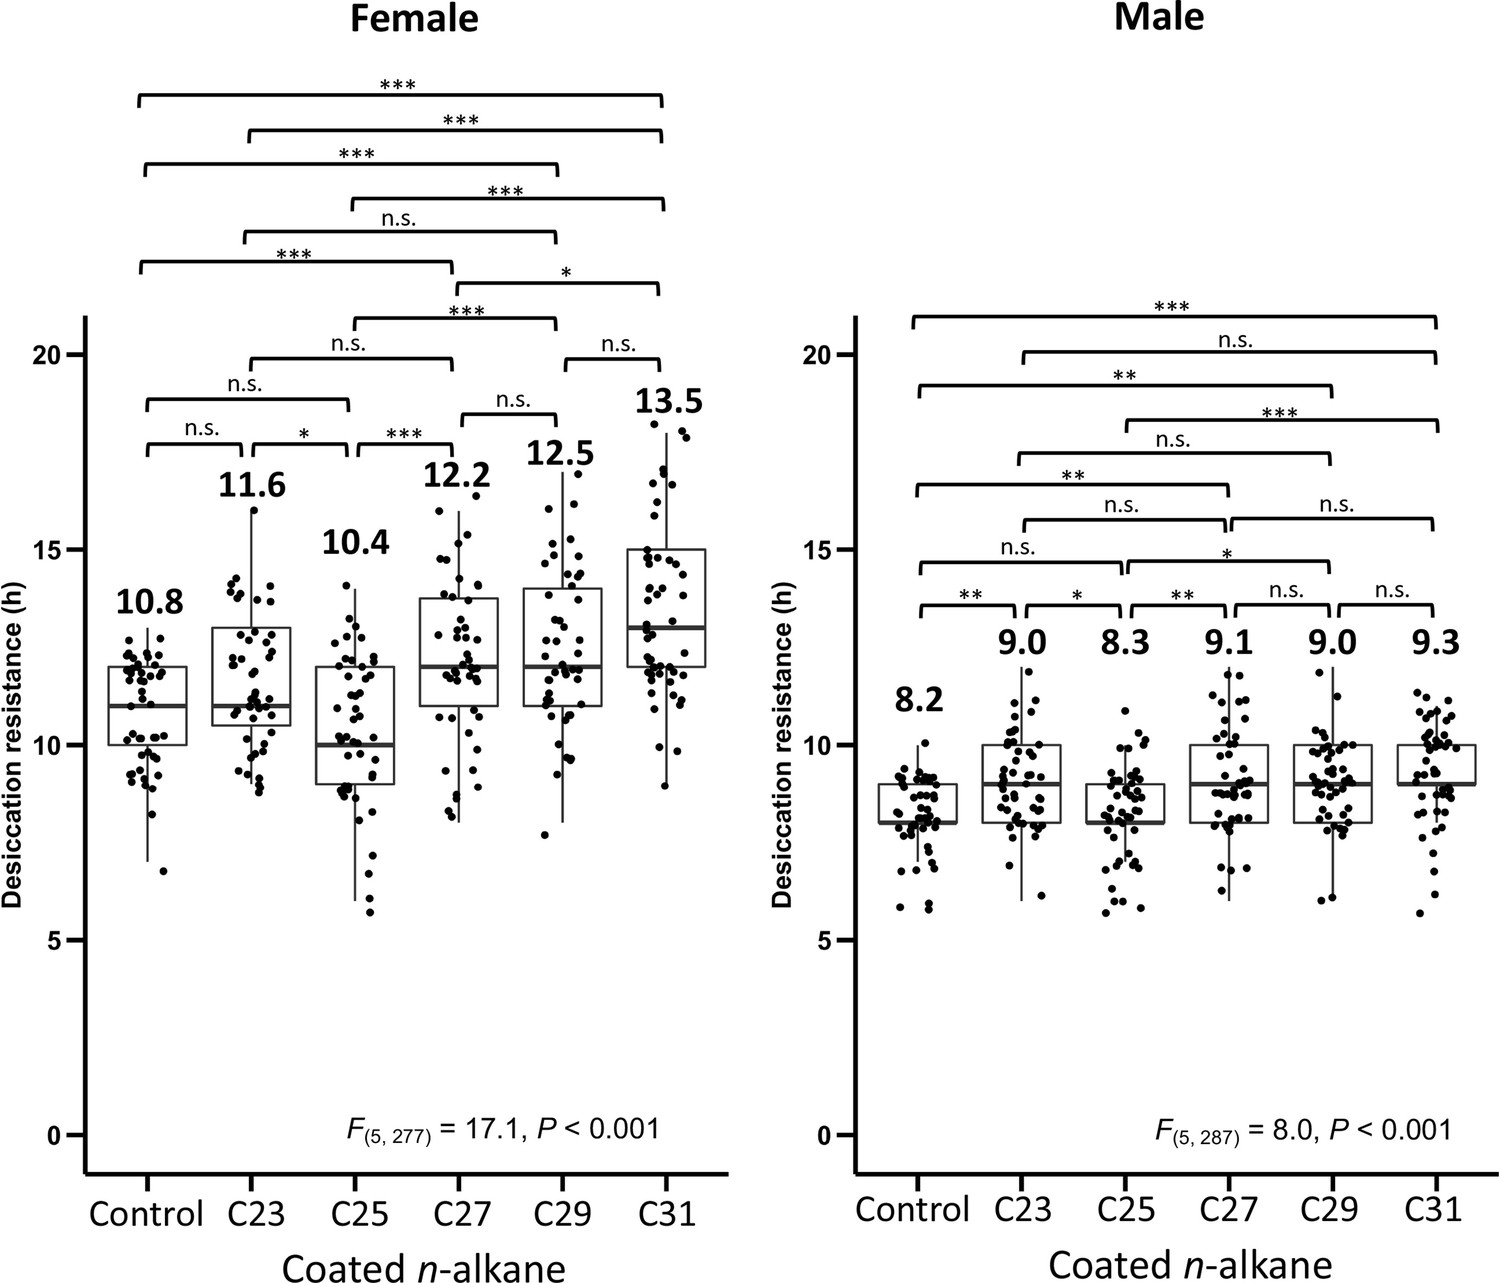
Desiccation resistance of D. melanogaster attP40 flies coated with individual n-alkanes (C23, C25, C27, C29, and C31).
One-way analysis of variance (ANOVA) was applied to test the differences in desiccation resistance between the coating of different n-alkanes (Female: F(5, 277) = 17.1, p < 0.001, Male: F(5, 287) = 8.0, p < 0.001), following with post hoc comparison using Tukey’s method at alpha = 0.05. *p < 0.05; **p < 0.01; ***p < 0.001; n.s. refers to not significant. The bold horizontal line within each box plot corresponds to the median value, the box length to the interquartile range, and the lines emanating from the box (whiskers) extend to the smallest and largest observations. Numbers on top of the boxplots are the mean in each treatment.
Figure 5—figure supplement 4
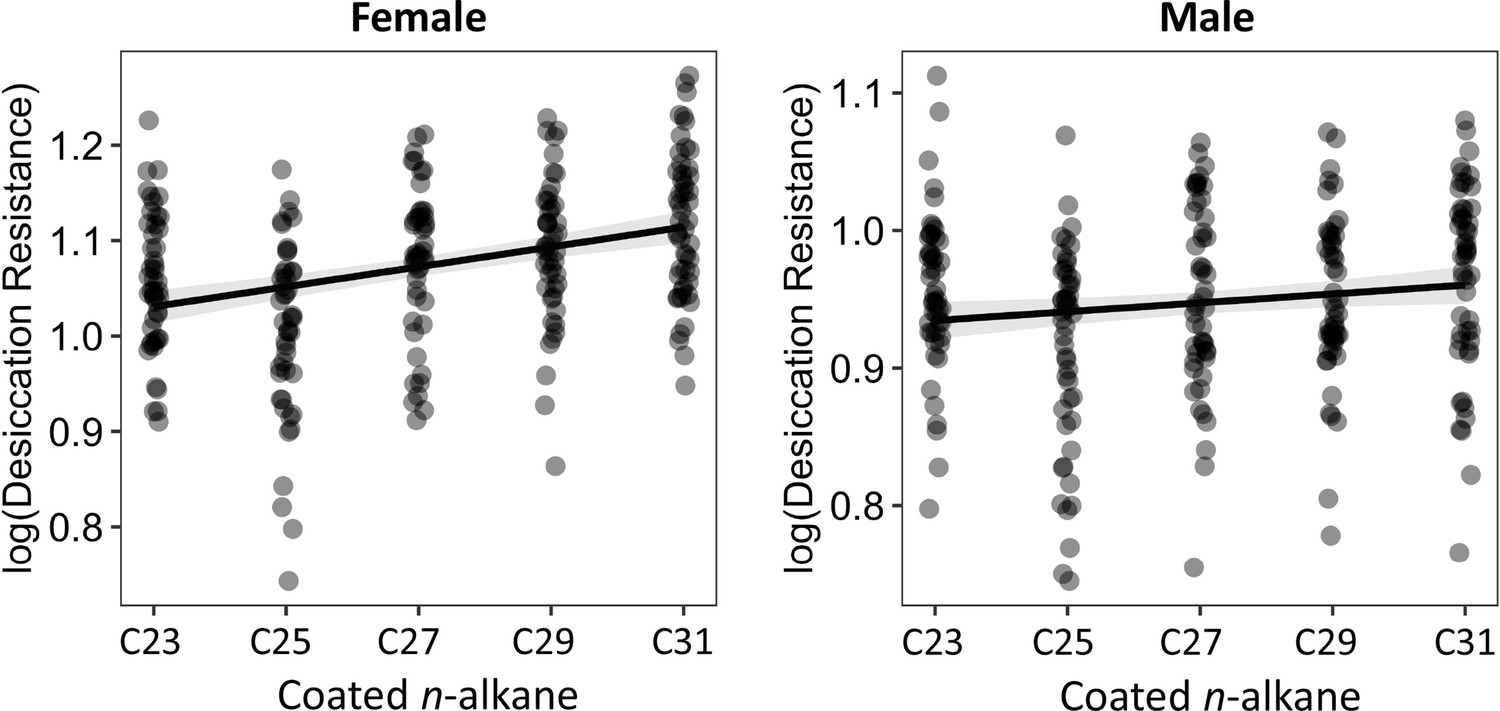
The length of coated n-alkanes on D. melanogaster attP40 flies is positively correlated with desiccation resistance in both females and males.
Pearson’s correlation: Female, r = 0.4, p < 0.001; Male, r = 0.1, p = 0.02.
Figure 5—figure supplement 5
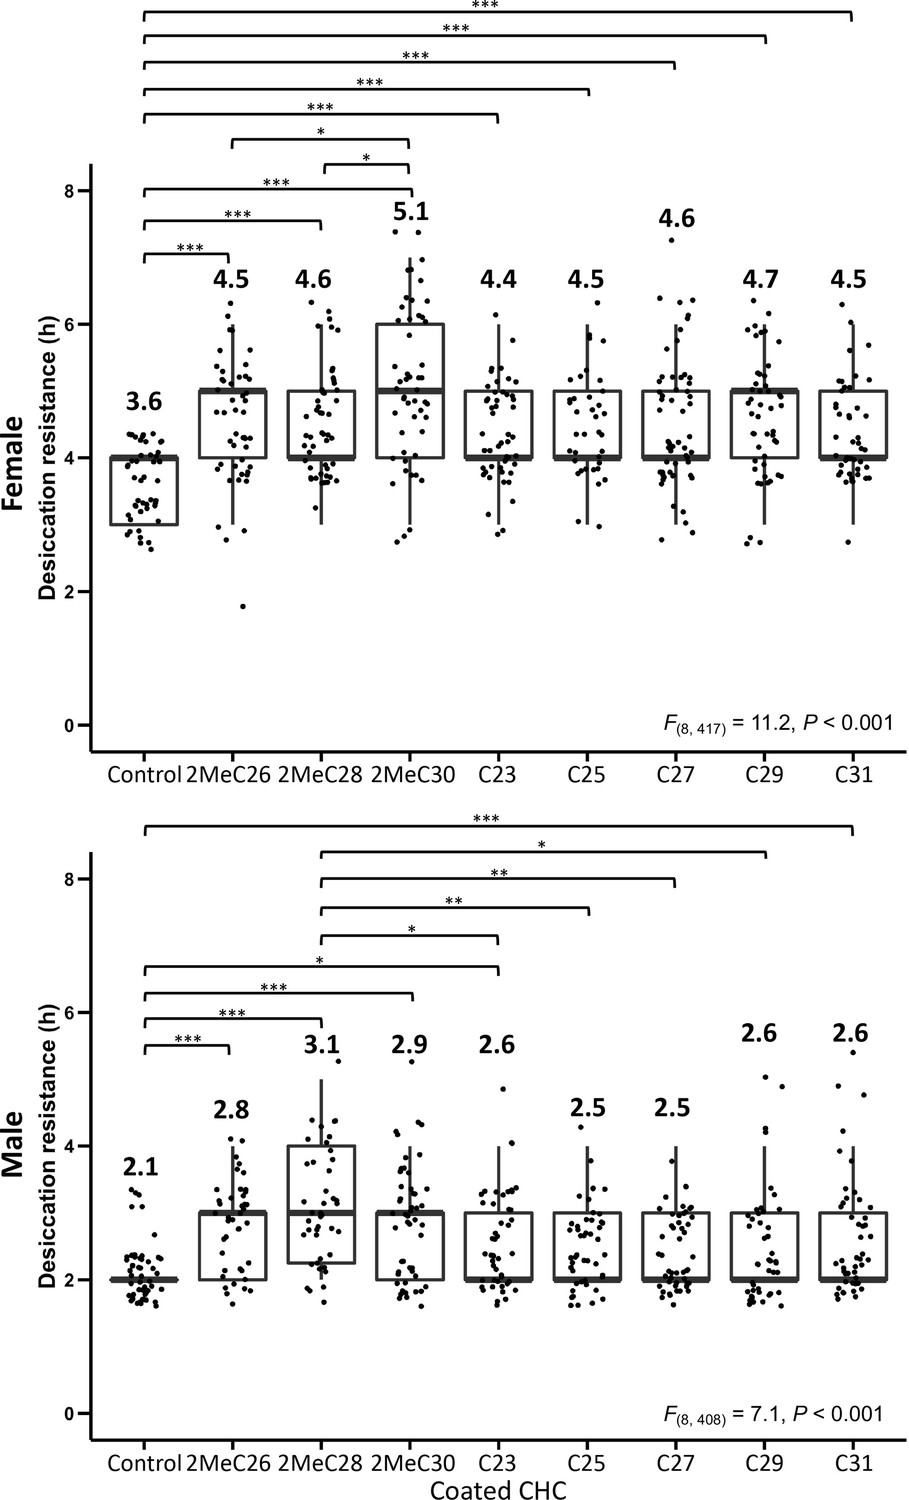
Desiccation resistance of CHC- D. melanogaster flies coated with individual mbCHCs (2MeC26, 2MeC28, 2MeC30) or n-alkanes (C23, C25, C27, C29, and C31).
One-way analysis of variance (ANOVA) was applied to test the difference of desiccation resistance between the coating of different mbCHCs and n-alkanes (Female: F(8, 417) = 11.2, p < 0.001, Male: F(8, 408) = 7.1, p < 0.001), following with post hoc comparison using Tukey’s method at alpha = 0.05. *p < 0.05; **p < 0.01; ***p < 0.001. The bold horizontal line within each box plot corresponds to the median value, the box length to the interquartile range, and the lines emanating from the box (whiskers) extend to the smallest and largest observations. Numbers on top of the boxplots are the mean in each treatment.
Figure 5—figure supplement 6
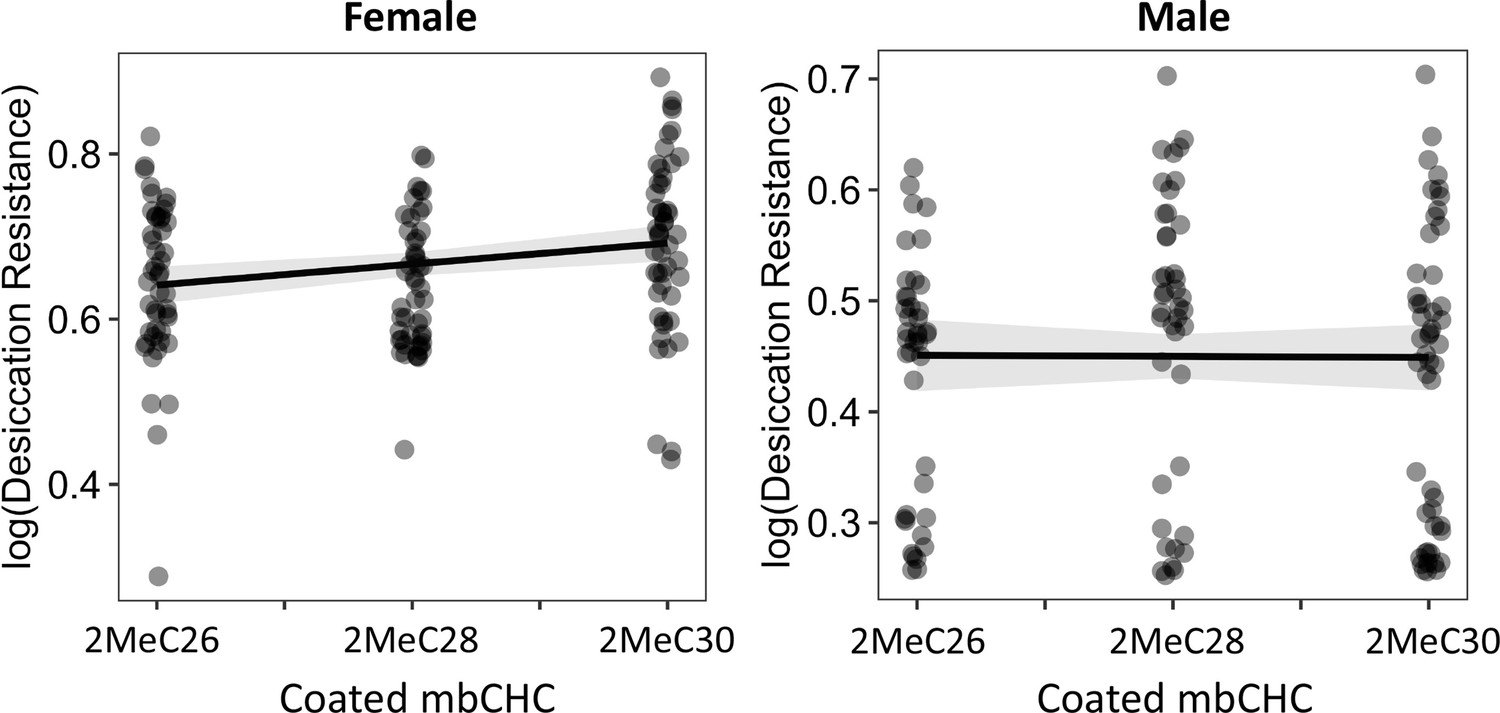
The length of coated mbCHCs on CHC- flies has a weak positive correlation with desiccation resistance in females but did not correlate with the levels of desiccation resistance in males.
Pearson’s correlation: Female, r = 0.2, p = 0.004; Male, p = 0.9.
Figure 5—figure supplement 7
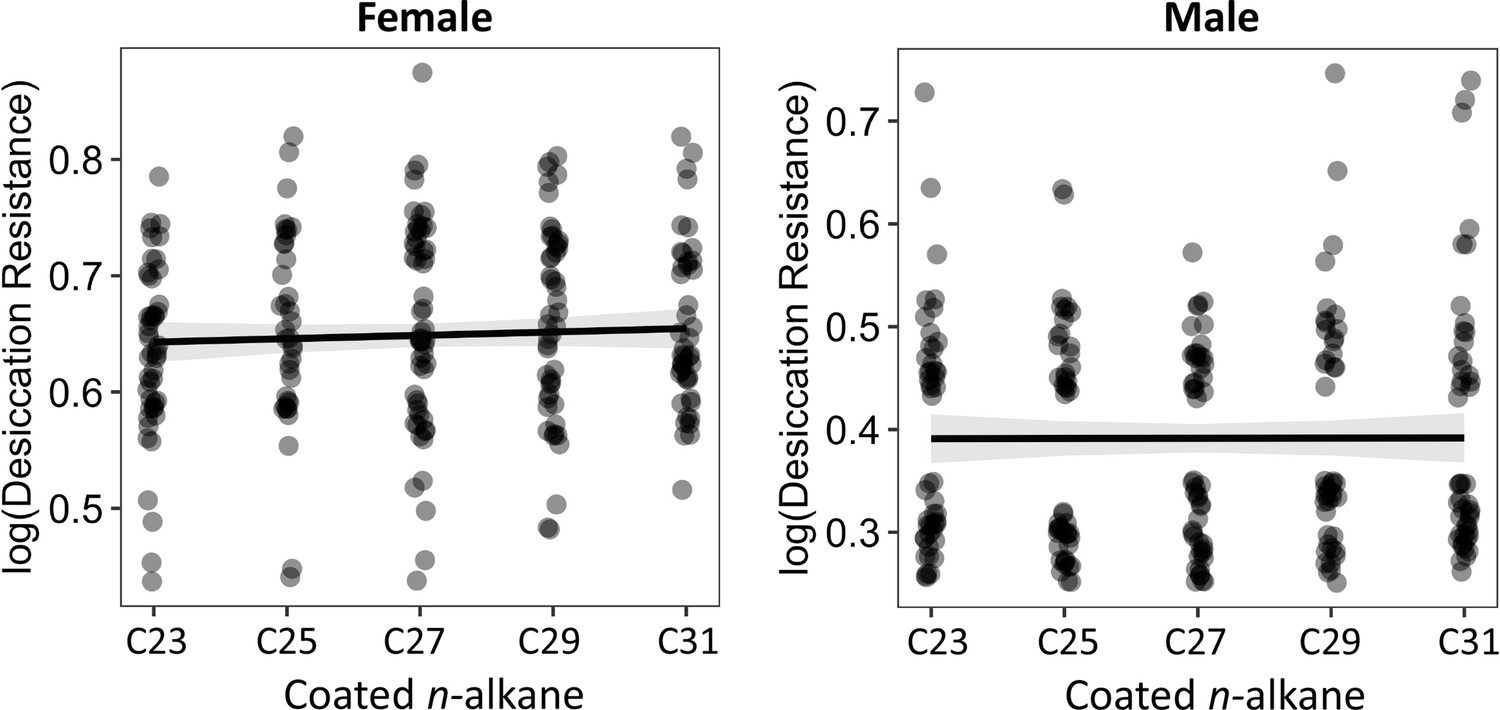
The length of coated n-alkanes on CHC- flies did not correlate with desiccation resistance.
Pearson’s correlation: Female, p = 0.4; Male, p = 1.0.
Figure 5—figure supplement 8
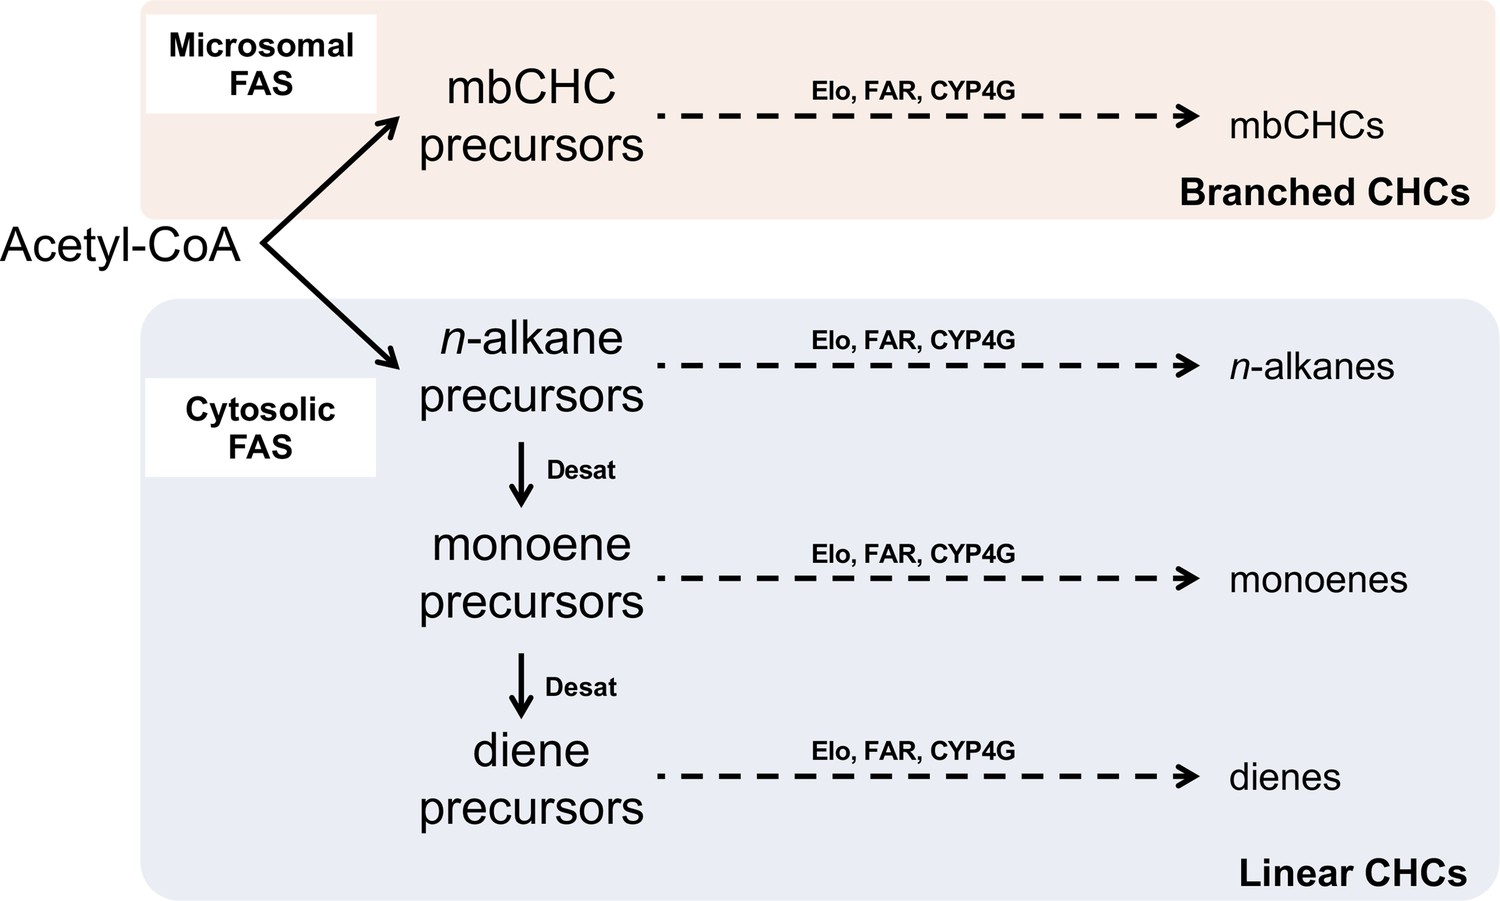
Pathway for the synthesis of branched cuticular hydrocarbons (mbCHCs) and linear CHCs (n-alkanes, monoenes, and dienes).
All CHCs are synthesized via the fatty acyl-CoA synthesis pathway from acetyl-CoA. The pathway splits early due to the action of two fatty acid synthetases (FAS) into the branched CHC pathway or the linear CHC pathway. The precursors of each pathway are modified by synthesis enzymes such as elongases (Elo), reductases (FAR), and the terminal P450 decarbonylase (CYP4G) into CHCs. For linear CHCs, additional enzymes such as desaturases (Desat) incorporate double bonds during synthesis. The diagram was modified from Chung and Carroll, 2015.
Figure 5—figure supplement 9
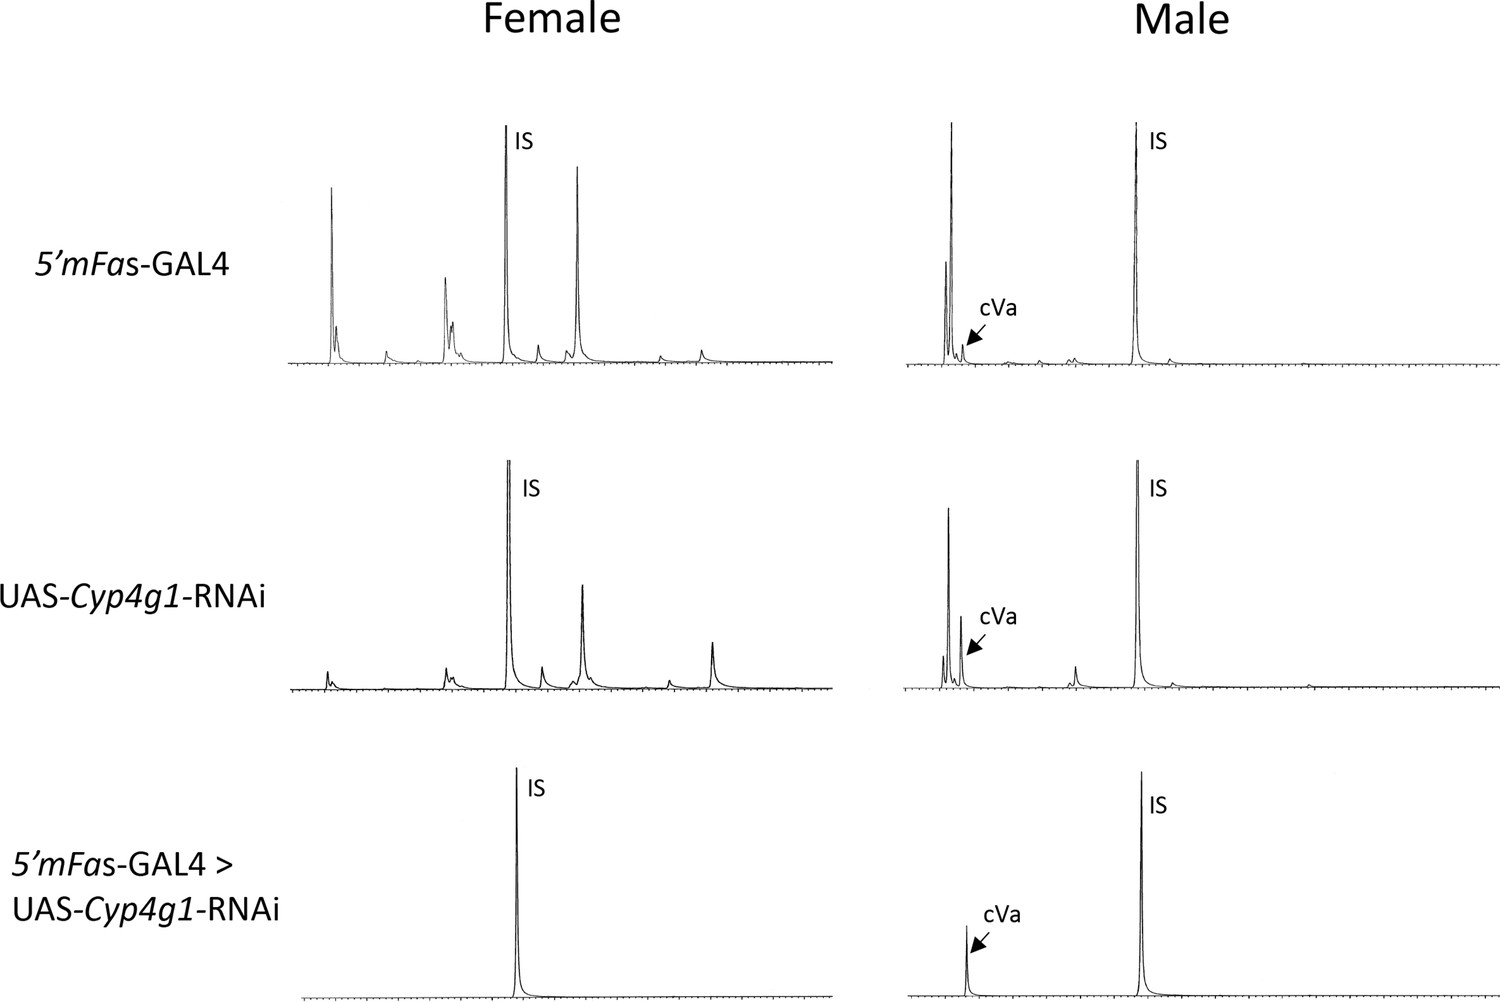
Gas chromatography–mass spectrometry (GC–MS) chromatograms of 5′mFAS-GAL4, UAS-Cyp4g1-RNAi, and the F1 offspring from 5′mFAS-GAL4 × UAS-Cyp4g1-RNAi.
CHC- D. melanogaster flies are generated by crossing 5′mFAS-GAL4 and UAS-Cyp4g1-RNAi, resulting in adult oenocyte specific knockdown of Cyp4g1 and loss of cuticular hydrocarbon (CHC) production. IS = internal standard spiked in for quantification (C26). cVA = cis-vaccenyl acetate, a lipid produced in the male ejaculatory bulb not affected by the RNAi knockdown of Cyp4g1 in the oenocytes.
Figure 6 with 1 supplement

Evolution of longer mbCHCs is significantly correlated with evolution of higher desiccation resistance.
Patterns in the normalized quantities of the longest mbCHCs and desiccation resistance for females (top) and males (bottom) were listed across the phylogeny of the 50 Drosophila and related species. Phylogenetic Generalized Linear Square (PGLS) analysis between the longest mbCHCs and desiccation resistance showed both the higher quantity and longer length of the longest mbCHC affect desiccation resistance (interaction term, Female: t = 3.5, p < 0.001; Male: t = 2.2, p = 0.03).
-
Figure 6—source data 1
Normalized quantities of mbCHCs, the length and normalized quantities of the longest mbCHC in each species.
- https://cdn.elifesciences.org/articles/80859/elife-80859-fig6-data1-v2.xlsx
Figure 6—figure supplement 1

Ancestral state reconstruction of mbCHC for the Drosophila genus.
Bar plots on the right were the derived ancestral state of female and male mbCHC profiles for the common ancestor of the Drosophila genus (A), the Sophophora subgenus (B), the Drosophila subgenus (C), the melanogaster group (D), the willistoni group (E), the nasuta group (F), the virilis group (G), the repleta group (H), the clade of D. melanogaster, D. simulans, and D. mauritiana (I), and the clade of D. mojavensis and D. arizonae (J). 2MeC28 and 2MeC30 were the major cuticular hydrocarbons (CHCs) in the derived ancestral state (A).
Additional files
-
Supplementary file 1
Statistical output from phylogenetic comparative analyses and the list of species used in this study.
(a) Phylogenetic signals for mbCHCs in Drosophila species. (b) Phylogenetic signals for desiccation resistance in Drosophila species. (c) Summary of the Phylogenetic Generalized Linear Square (PGLS) models between the longest mbCHCs and desiccation resistance for females and males in 50 Drosophila and related species. (d) List of species used in this study.
- https://cdn.elifesciences.org/articles/80859/elife-80859-supp1-v2.docx
-
MDAR checklist
- https://cdn.elifesciences.org/articles/80859/elife-80859-mdarchecklist1-v2.docx
-
Source data 1
Data of normalized cuticular hydrocarbon (CHC) quantities, body weight, averaged desiccation resistance, total CHC quantity, and percentage of CHC quantities per body weight.
- https://cdn.elifesciences.org/articles/80859/elife-80859-data1-v2.xlsx
-
Source code 1
Code for Pearson’s correlation analysis and analysis of variance (ANOVA) tests in Figure 3 and Figure 5.
- https://cdn.elifesciences.org/articles/80859/elife-80859-code1-v2.zip
-
Source code 2
Code for NMDS plot and random forest analysis for Figure 4.
- https://cdn.elifesciences.org/articles/80859/elife-80859-code2-v2.zip
-
Source code 3
Code for Phylogenetic Generalized Linear Square (PGLS) analyses in Figure 6.
- https://cdn.elifesciences.org/articles/80859/elife-80859-code3-v2.zip
Download links
A two-part list of links to download the article, or parts of the article, in various formats.
Downloads (link to download the article as PDF)
Open citations (links to open the citations from this article in various online reference manager services)
Cite this article (links to download the citations from this article in formats compatible with various reference manager tools)
Desiccation resistance differences in Drosophila species can be largely explained by variations in cuticular hydrocarbons
eLife 11:e80859.
https://doi.org/10.7554/eLife.80859


