Kiaa1024L/Minar2 is essential for hearing by regulating cholesterol distribution in hair bundles
- State Key Laboratory of Medical Neurobiology and MOE Frontiers Center for Brain Science, Institutes of Brain Science, Fudan University, China
Figures
Figure 1 with 2 supplements
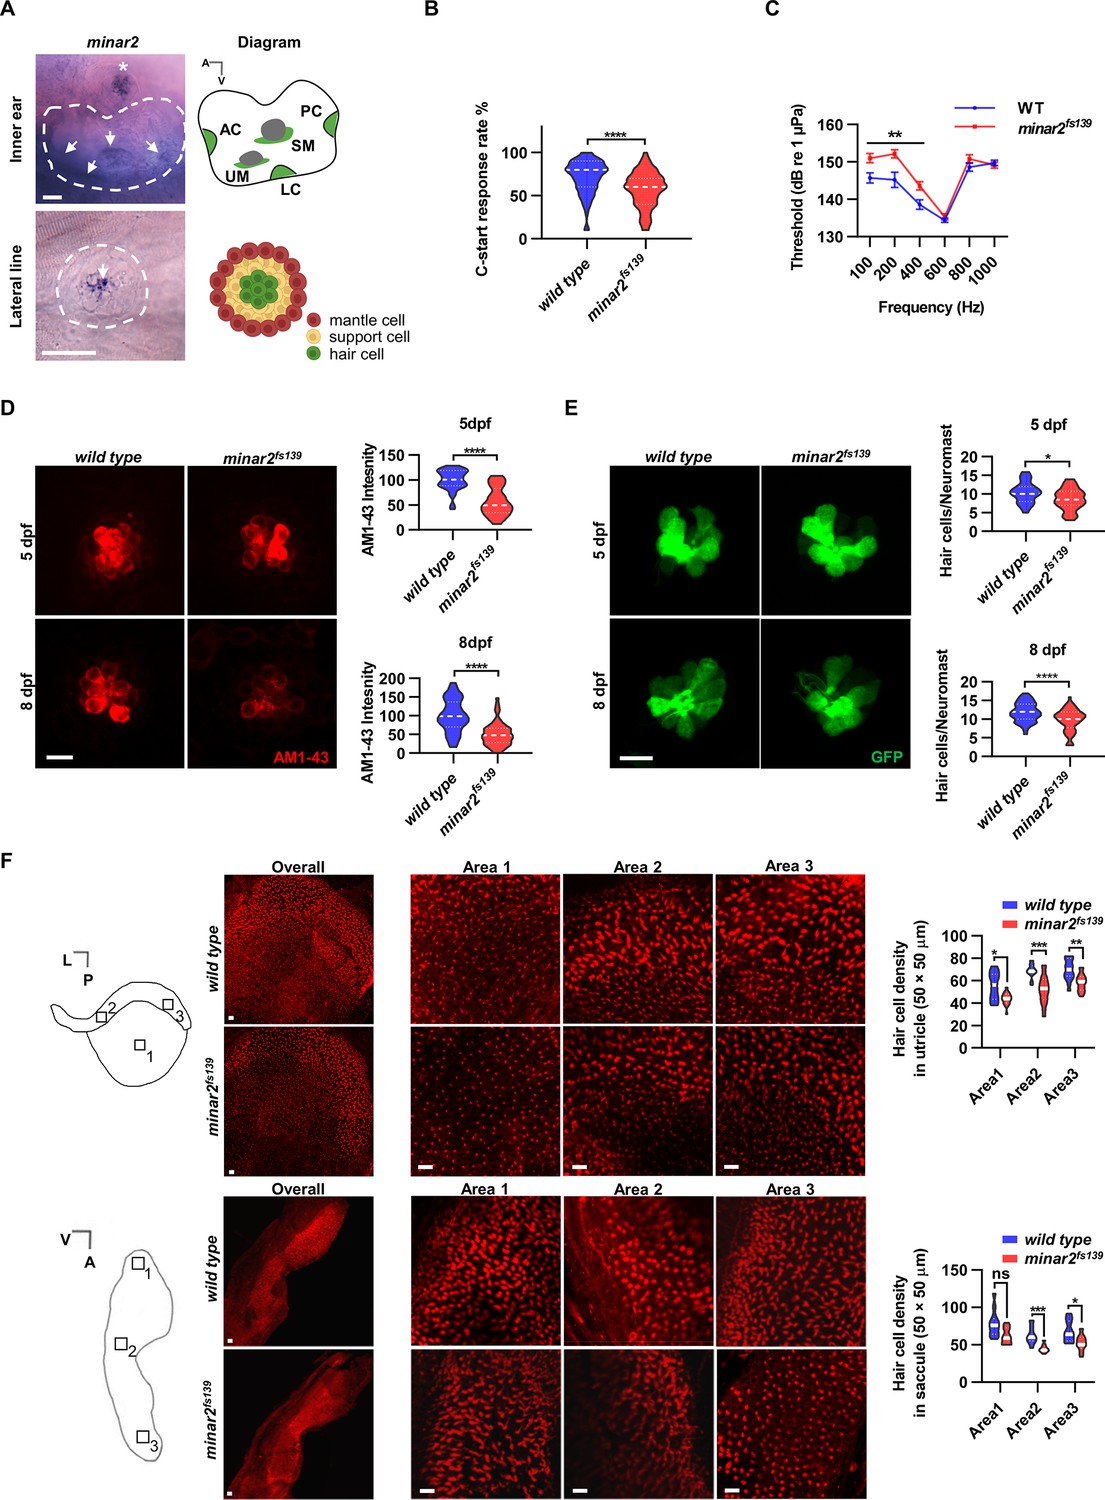
minar2 is required for normal hearing in the zebrafish.
(A) RNA in situ hybridization results showed that minar2 was specifically expressed by the hair cells of the inner ears and the lateral line neuromasts (5 dpf). Arrows point to hair cells. An asterisk in the upper panel marks a head neuromast located next to the inner ear. AC: anterior crista; LC: lateral crista; PC: posterior crista; UM: utricular macula; SM: saccular macula. (B) C-start response rates for wild type and homozygous minar2fs139 mutants at 8 dpf (n=63 and 64, respectively. ****p<0.0001, Mann-Whitney test). (C) Auditory evoked potentials (AEP) thresholds in wild type and the minar2fs139 mutants (n=11 and 13, respectively. For 100-, 200-, and 400 Hz, **p<0.01). (D) Evaluation of mechanotransduction by AM 1–43 staining. The lateral line L3 neuromasts of 5 dpf and 8 dpf larvae were imaged and quantified (for 5 dpf, n=35 and 36, t=7.465, df = 64.84, ****p<0.0001; for 8 dpf, n=49 and 51, t=6.444, df = 86.90, ****p<0.0001). (E) Quantification of hair cell numbers by counting the myo6:Gal4FF;UAS-EGFP-positive cells in lateral line L3 neuromast (for 5 dpf, n=30 and 32, t=2.578, df = 59.93, *p=0.0124; for 8 dpf, n=58 and 58, t=4.148, df = 114, ****p<0.0001). (F) Quantification of hair cell numbers in the inner ears of zebrafish adult. Hair bundles in dissected utricles (upper panels) and saccules (lower panels) were labeled with fluorescence-conjugated phalloidin. Diagrams of a utricle and saccule on the left. Numbered boxes (1-3) in the diagrams indicate the positions of imaged and counted areas (for utricles, n=15 and 19; for saccules, n=12 and 9. *p<0.05, **p<0.01, ***p<0.001). A: anterior; L: lateral; P: posterior; V: ventral. Scale bars represent 25 μm (A), and 10 μm (D, E, and F).
-
Figure 1—source data 1
Functional requirement and expression of minar2 in hair cells Figure 1B-FFigure 1—figure supplement 1B, D, E; Figure 1—figure supplement 2A-C.
- https://cdn.elifesciences.org/articles/80865/elife-80865-fig1-data1-v2.xlsx
Figure 1—figure supplement 1
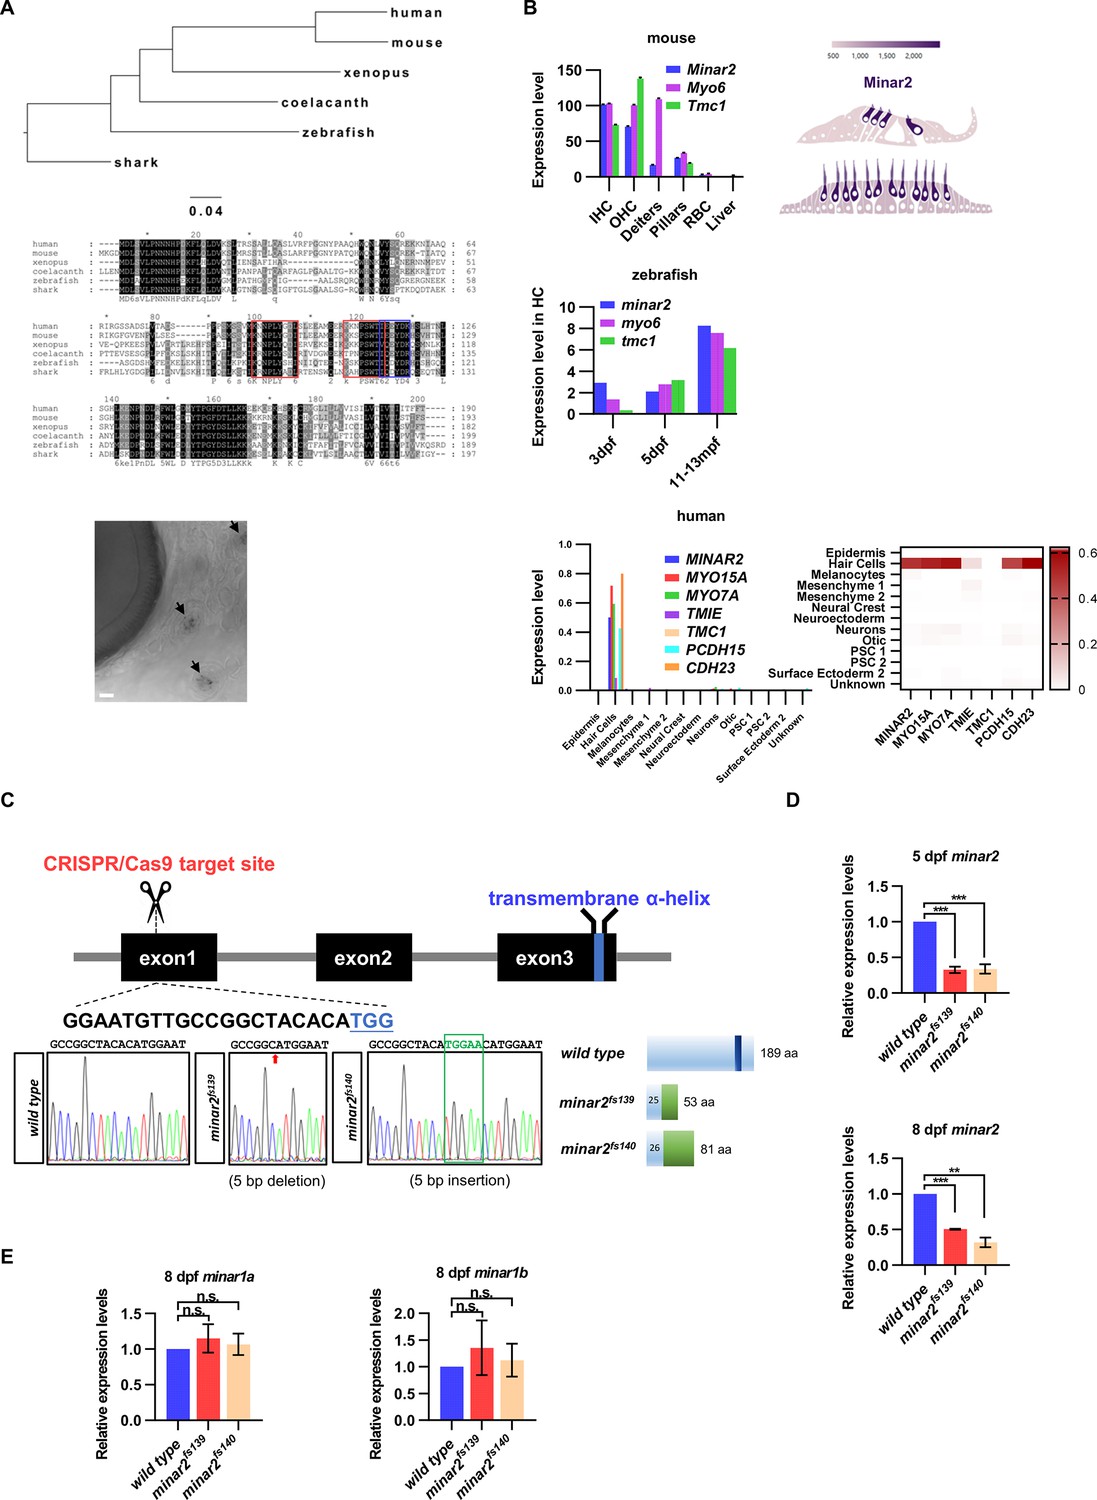
Expressions of minar2 orthologs in hair cells and generation of minar2 mutant alleles in the zebrafish.
(A) Phylogenetic tree and multiple sequence alignment of minar2 orthologs. No minar2 homologs were found outside the vertebrates. The sequences matched to the cholesterol-recognizing amino-acid consensus motif (CRAC, red box) and its analog CARC (blue box) are indicated. The bottom panel shows minar2 expression in the hair cells of anterior lateral line (aLL) neuromasts (5 dpf). Arrows point to aLL neuromasts. Scale bars represent 25 μm. (B) minar2 orthologs are highly expressed in hair cells. Expression data were taken from published sources: mouse (Elkon et al., 2015; Liu et al., 2018), zebrafish (Barta et al., 2018; Elkon et al., 2015; Erickson and Nicolson, 2015), and human inner ear organoid (Steinhart et al., 2022). (C) Targeted disruption of the zebrafish minar2 gene by CRISPR/Cas9. The sequence for the gRNA target site is indicated under the exon1 box. Sequencing chromatographs are marked to show altered nucleotides in the minar2 loci. Schematic representations of wild-type and mutant Minar2 proteins are shown next to the sequencing chromatographs. (D) Real-Time quantitative reverse transcription PCR (qPCR) analysis of minar2 expression levels. Expression levels relative to β-actin levels were normalized to the wild-type control group. For 5 dpf samples, wild type versus minar2f139: t=14.94, df = 4, ***p<0.001; wild type versus minar2f140: t=10.29, df = 4, ***p<0.001. For 8 dpf samples, wild type versus minar2f139: t=75.38, df = 2, ***p<0.001; wild type versus minar2f140: t=10.16, df = 2, **p<0.01. (E) qPCR analysis of minar1a and minar1b expression levels. For minar1a, wild type versus minar2f139: t=0.7491, df = 2, p=0.532; wild type versus minar2f140: t=0.4518, df = 2, p=0.696; for minar1b, wild type versus minar2f139: t=0.6927, df = 2, p=0.560; wild type versus minar2f140: t=0.4008, df = 2, p=0.727.
Figure 1—figure supplement 2
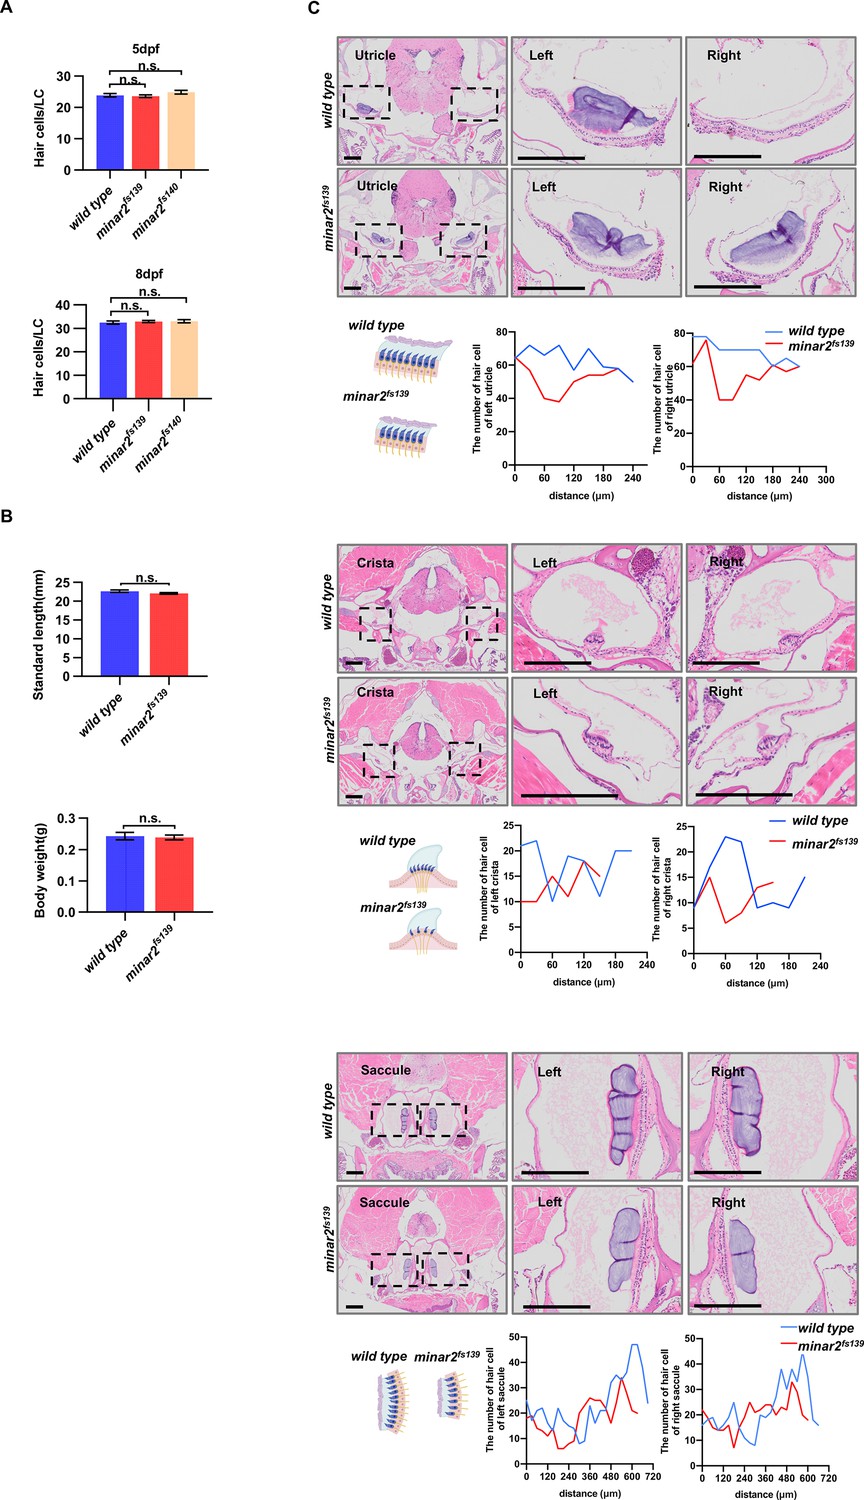
Numbers of inner ear hair cells in zebrafish larvae and adults.
(A) Quantification of hair cell numbers in the inner ears of zebrafish larvae. Hair bundles were labeled with fluorescence-conjugated phalloidin then the lateral crista regions were imaged and counted (for 5 dpf, n=34, 29, and 22; for 8 dpf, n=36, 23 and 23. n.s.: not significant). (B) Quantification of body length and body weight in wild type and mutant minar2fs139 adult zebrafish (6 mpf, n=9 and 11. n.s.: not significant). (C) Hematoxylin and eosin staining of head sections of wild type and mutant minar2fs139 adult zebrafish (12 mpf). The head regions were cross-sectioned and sampled every 30 μm. The number of hair cells was counted and plotted along the anterior-posterior axis. The lengths of the utricle, crista, and saccule appeared smaller in the minar2fs139 mutant. Results were from 1 wild type and 1 mutant fish. Sections of another wild type and mutant from a different batch of fish in another replicate showed a similar reduction of hair cells in the minar2fs139 mutant. Scale bars represent 200 μm.
Figure 2 with 2 supplements
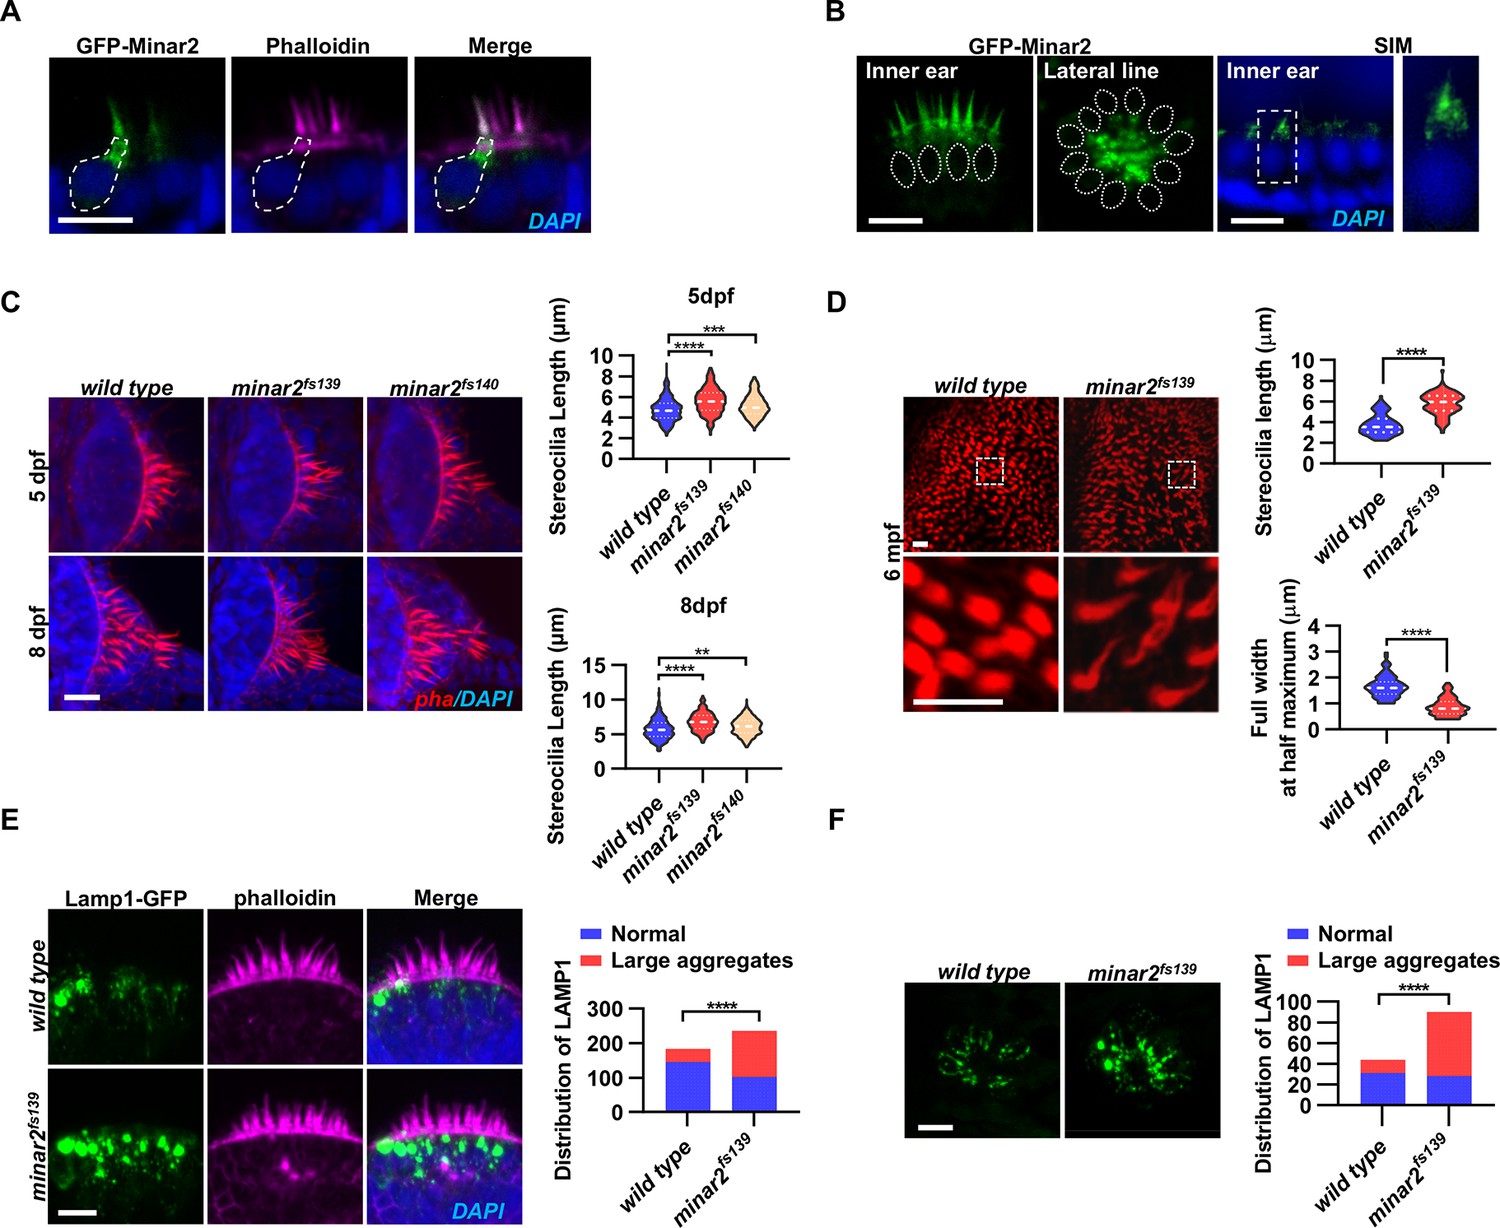
Localization and function of Minar2 in the stereocilia and the apical region of the hair cells.
(A) Representative images of transiently expressed GFP-Minar2 in hair cells. The dashed line marks the border of a hair cell expressing GFP-Minar2. Stereocilia were labeled with phalloidin. Nuclei were counterstained by DAPI. (B) Distribution of GFP-Minar2 in hair cells in the stable myo6:GFP-Minar2 transgenic line. Representative images of hair cells of lateral crista of the inner ear (Inner ear) and lateral line neuromast (Lateral line). Dashed lines mark the nuclei of hair cells. Hair cells were also imaged with structured illumination microscopy (SIM), a super-resolution method. The right panel shows an enlarged view of the boxed area. (C) Quantification of hair bundle lengths of the inner ear hair cells in zebrafish larvae. Hair bundles were labeled with phalloidin and the lateral crista regions of inner ears were imaged. Hair bundle lengths were measured from 34, 29, and 22 images of wild type, minar2fs139, and minar2fs140 larvae at 5 dpf, or 36, 23, and 23 images of respective larvae at 8 dpf. For 5 dpf, n=340, 290, and 220, F(2, 847)=42.58, p<0.001; For 8 dpf, n=360, 230, and 230, F(2, 817)=42.95, p<0.001. Multiple comparison significance values are indicated on the graph. (D) Quantification of hair bundle lengths and width of inner ear hair cells in zebrafish adult (6 mpf). The bottom panels show enlarged views of the boxed area. Hair bundles in the saccules were measured from 8 images for the wild type, and 8 images for the minar2fs139 mutant. n=80 and 80. ****p<0.0001. (E–F) Morphology and distribution of Lamp1-labeled lysosomes in the hair cells of the inner ear (E) and lateral line neuromast (F) in zebrafish larvae (5 dpf). For the inner ear, 36 and 44 images of lateral crista regions in the wild type and minar2fs139 mutant were counted, respectively (n=184 and 236, ****p<0.0001, Fisher’s exact test). For the lateral line, 10 and 15 images of lateral line L3 neuromasts were counted (n=44 and 90, ****p<0.0001, Fisher’s exact test). Scale bars represent 10 μm.
-
Figure 2—source data 1
Localization and function of Minar2 in the apical regions of hair cells Figure 2C-F, Figure 2—figure supplement 1D.
- https://cdn.elifesciences.org/articles/80865/elife-80865-fig2-data1-v2.xlsx
Figure 2—figure supplement 1
Subcellular localization of Minar2 protein.
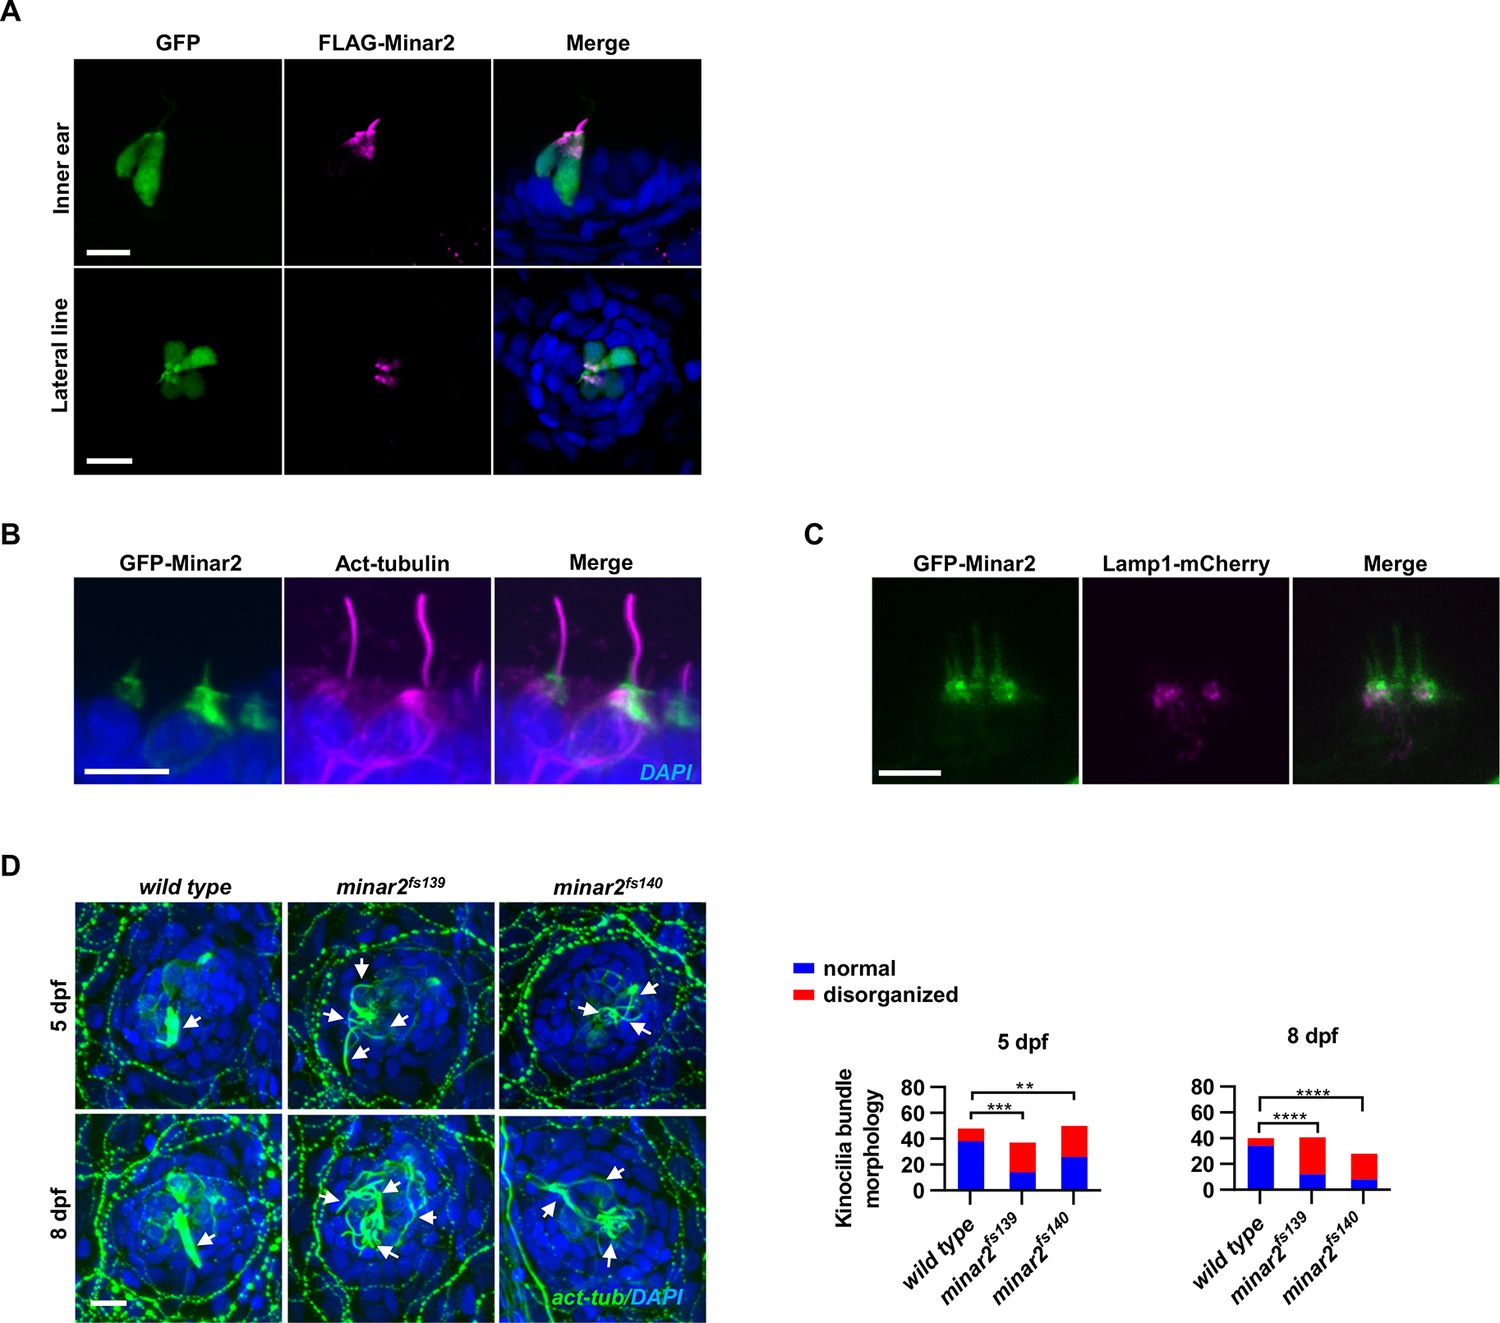
(A) Representative images of FLAG-Minar2 localization in hair cells. Hair cells were identified by GFP labeling, and FLAG-Minar2 was localized by anti-FLAG antibody staining. GFP and FLAG-Minar2 were both expressed from the myo6b:GFP-P2A-FLAG-Minar2 construct. (B) Representative images of GFP-Minar2 localization in the inner ear hair cells. Kinocilia were stained with anti-acetylated tubulin antibodies (Act-tubulin). (C) Localization of GFP-Minar2 and Lamp1-mCherry in the inner ear hair cells. Representative image of lateral crista region. (D) Kinocilia of lateral line hair cells were disorganized in the minar2 mutants. For 5 dpf, n=48, 37, and 50, respectively. For 8 dpf, n=40, 41, and 28, respectively. White arrows point to bundled kinocilia (wild type), or disorganized kinocilia (minar2 mutants). Scale bars represent 10 μm.
Figure 2—figure supplement 2
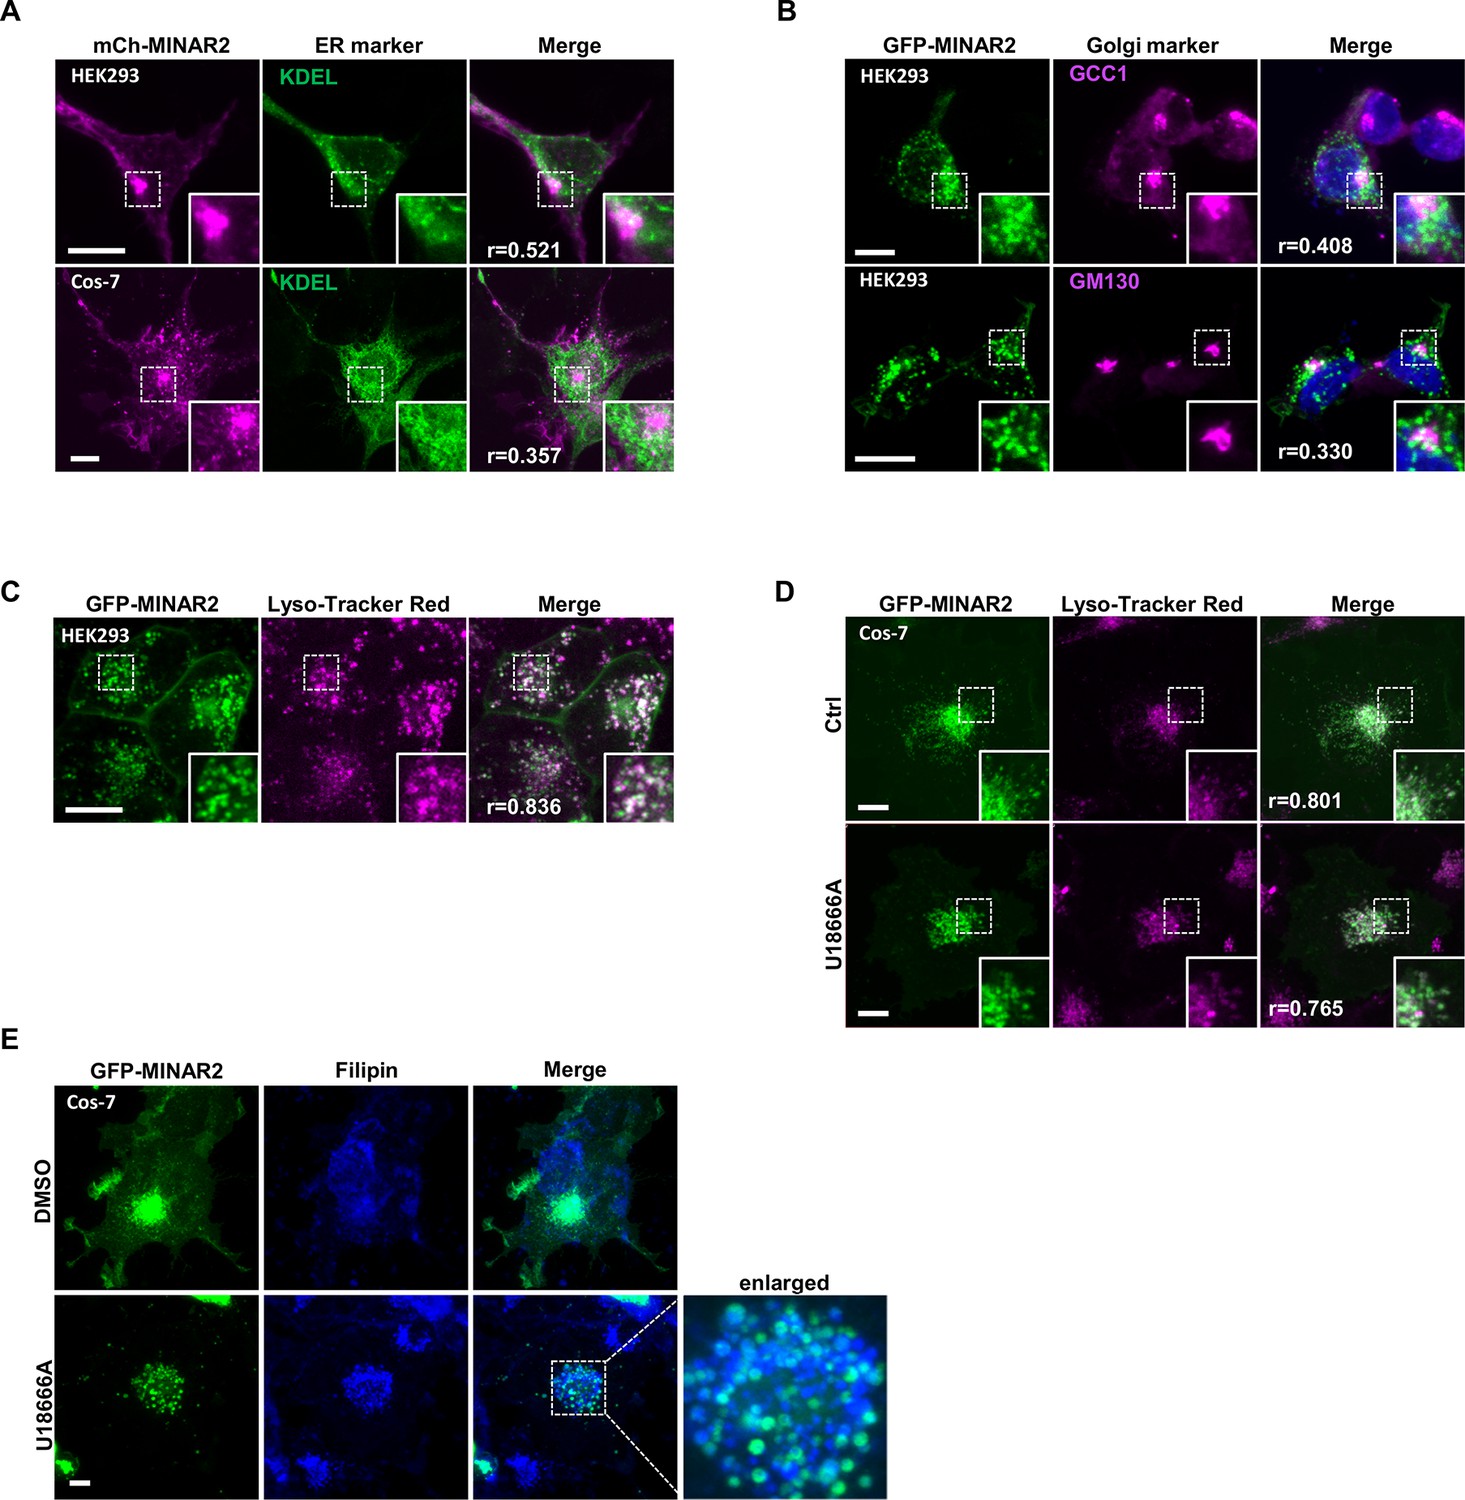
Subcellular localization of GFP-Minar2 in cultured cells.
Endoplasmic reticulum (A), Golgi complex (B), and lysosome (C and D) are labeled by KDEL, GCC1/GM130, and Lyso-Tracker Red, respectively. Figure inserts show enlarged views of the boxed area. Pearson correlation coefficients (Pearson’s r values) are indicated. U18666A treatment traps cholesterol (stained by filipin) in the lysosome lumen (E). Scale bars represent 10 μm.
Figure 3
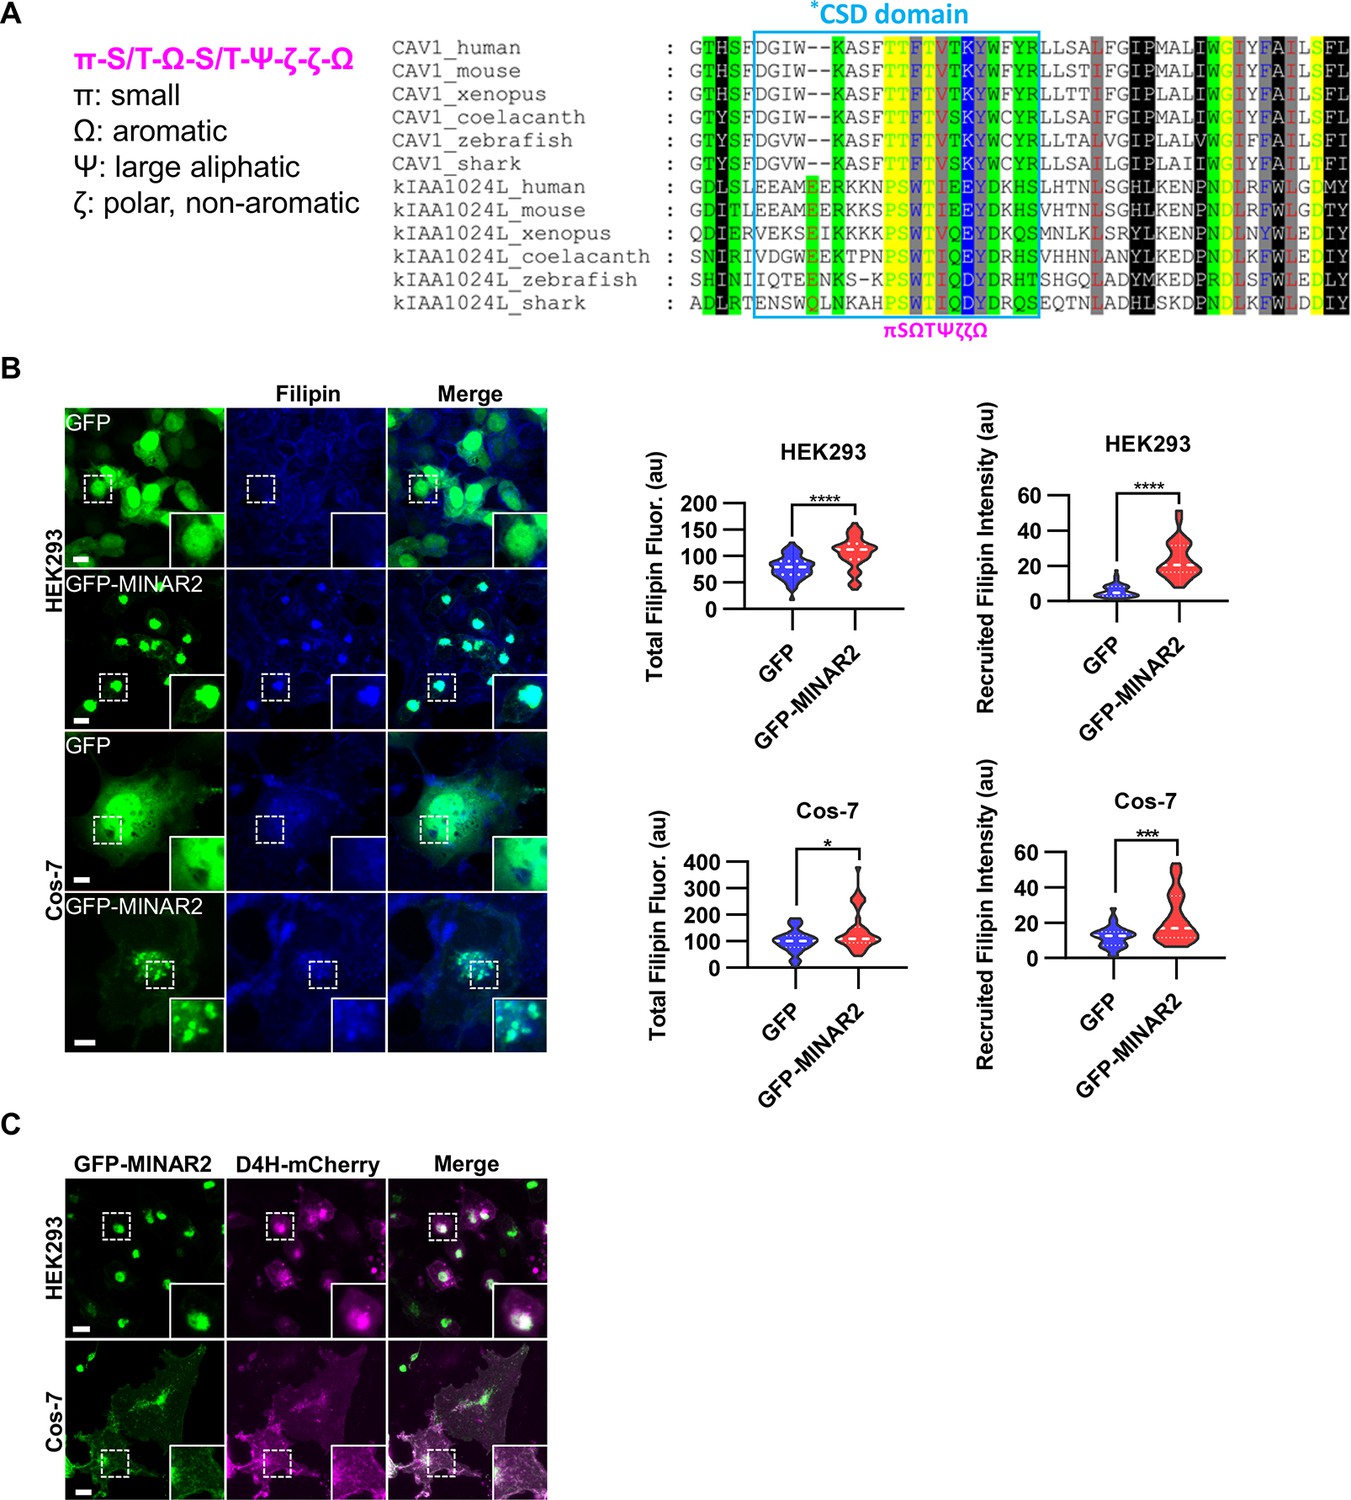
Minar2 increases cholesterol labeling and colocalizes with cholesterol in cultured cells.
(A) Protein sequence pattern search for Minar2 identifies caveolin. The conserved Minar2 sequence pattern is written in normalized symbols (Aasland et al., 2002; Livingstone and Barton, 1993). Sequence alignment is highlighted by the physico-chemical properties of the amino acids. *CSD: caveolin scaffolding domain. (B) Effects of Minar2 on levels and distributions of filipin labeling in cultured cells. Total filipin fluorescence indicates the sum of all pixel values of filipin signals. Recruited filipin represents the average pixel values of filipin signals located within the GFP-positive area. For HEK293 cells, n=51 and 58; for Cos-7 cells, n=28 and 35. au: arbitrary unit. (C) Distribution of GFP-MINAR2 and D4H-mCherry in cultured cells. Figure inserts show enlarged views of the boxed area. Scale bars represent 10 μm.
-
Figure 3—source data 1
Effects of Minar2 on levels and distributions of cholesterol in cultured cells Figure 3B.
- https://cdn.elifesciences.org/articles/80865/elife-80865-fig3-data1-v2.xlsx
Figure 4 with 1 supplement
Cholesterol labeling in the stereocilia is reduced in minar2 mutant.
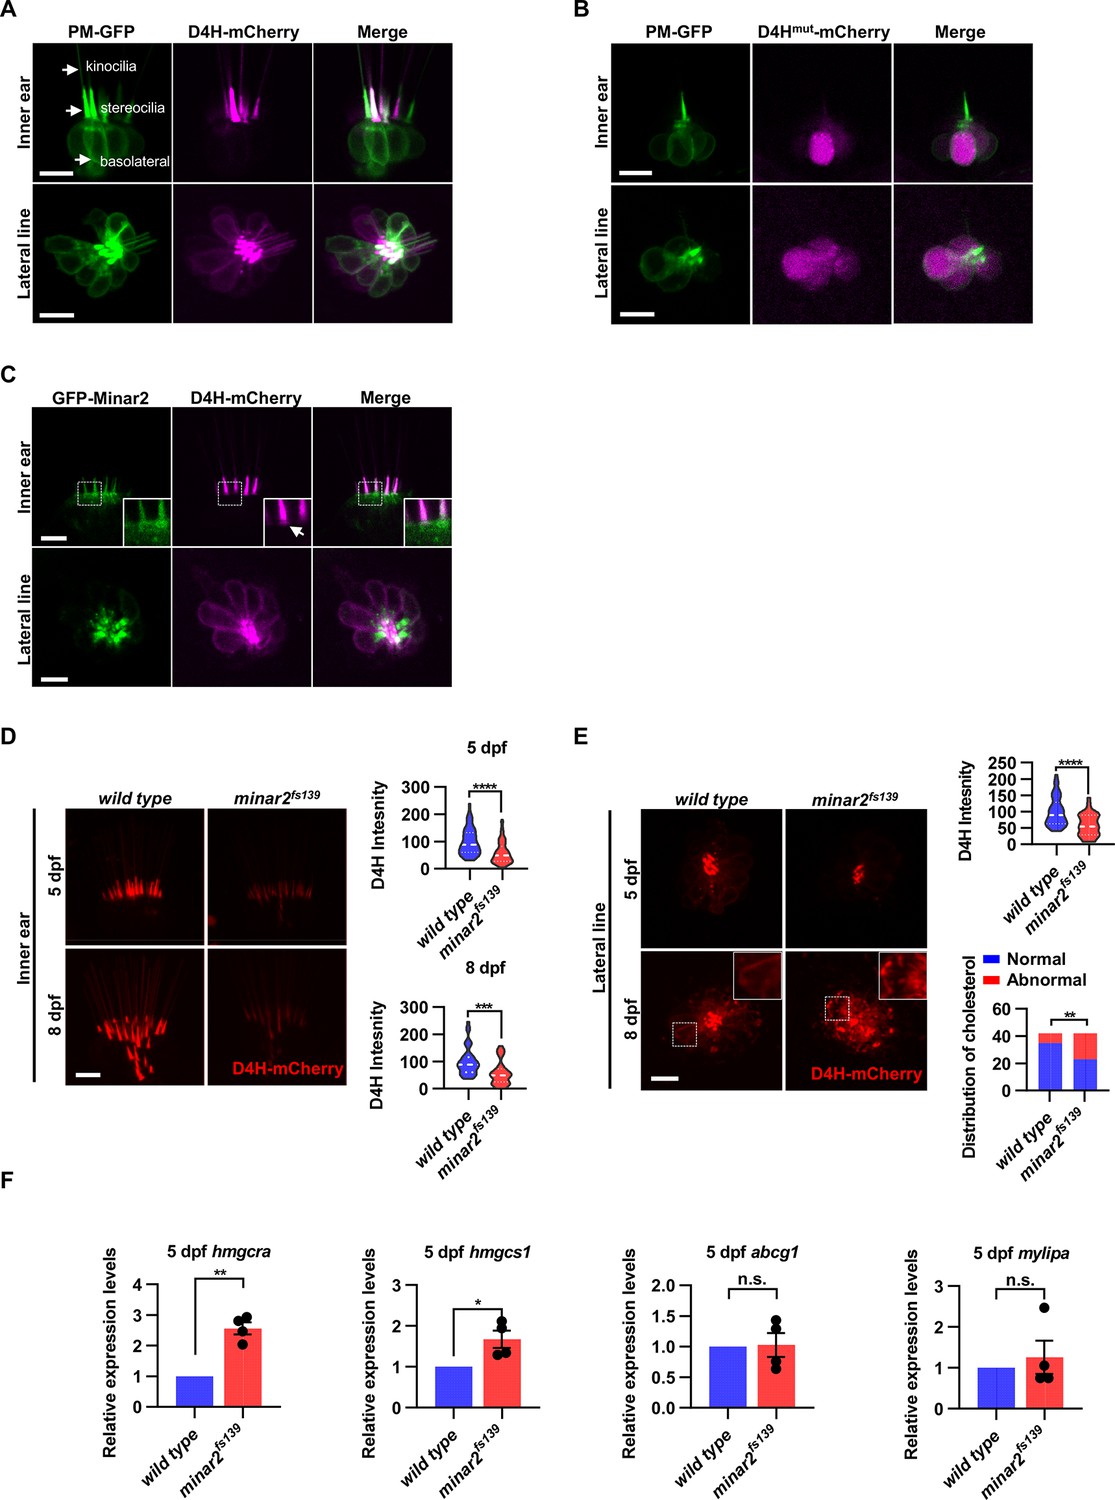
(A) Representative images of PM-GFP and D4H-mCherry expressed in hair cells. The plasma membrane probe PM-GFP labels kinocilia, stereocilia, and basolateral membranes (arrows). The cholesterol probe D4H-mCherry mostly labels the stereocilia in the inner ear. The lateral crista of the inner ear and the L3 lateral line neuromast were imaged. (B) Representative images of PM-GFP and non-binding D4Hmut-mCherry expressed in hair cells. The non-binding D4Hmut-mCherry carried a D4HT490G-L491G mutation that abolishes cholesterol binding. (C) Distribution of GFP-Minar2 and D4H-mCherry in hair cells in stable transgenic zebrafish. GFP-Minar2 and D4H-mCherry extensively co-localize in the stereocilia and a few structures just below the stereocilia (arrow in figure insert). (D) Quantification of the intensity of cholesterol probe D4H-mCherry in the inner ear hair cells. The lateral crista regions of the inner ears were imaged and quantified. For the 5 dpf groups, n=49 and 49 for the wild type and the minar2fs139 mutant, respectively. t=4.446, df = 93.30, ****p<0.0001; For the 8 dpf groups, n=39 and 36, t=3.982, df = 72.30, ***p<0.001. (E) Quantification of the intensity and appearance of D4H-mCherry in the lateral line hair cells. The lateral line L3 neuromasts were imaged and quantified. For the 5 dpf groups, the intensity of D4H-mCherry was quantified. n=40 and 33, t=4.438, df = 70.81, ****p<0.0001. For the 8 dpf groups, the appearance of abnormally enlarged vesicles was quantified. Figure inserts show large vesicles in the basolateral regions in the minar2fs139 mutant. n=42 and 42, **p<0.01, Fisher’s exact test. (F) Quantification of expression levels of genes involved in cholesterol metabolism. The Srebp2 target gene (hmgcra and hmgcs1) and LXR target gene (abcg1 and mylipa) were examined by qRT-PCR. Expression levels relative to GAPDH levels were normalized to the wild-type control group. For hmgcra, t=7.805, df = 3, **p<0.01. For hmgcs1, t=3.217, df = 3, *p<0.05. Scale bars represent 10 μm.
-
Figure 4—source data 1
Effects of minar2 loss-of-function on cholesterol in the apical regions of hair cells Figure 4D–F; Figure 4—figure supplement 1B.
- https://cdn.elifesciences.org/articles/80865/elife-80865-fig4-data1-v2.zip
Figure 4—figure supplement 1
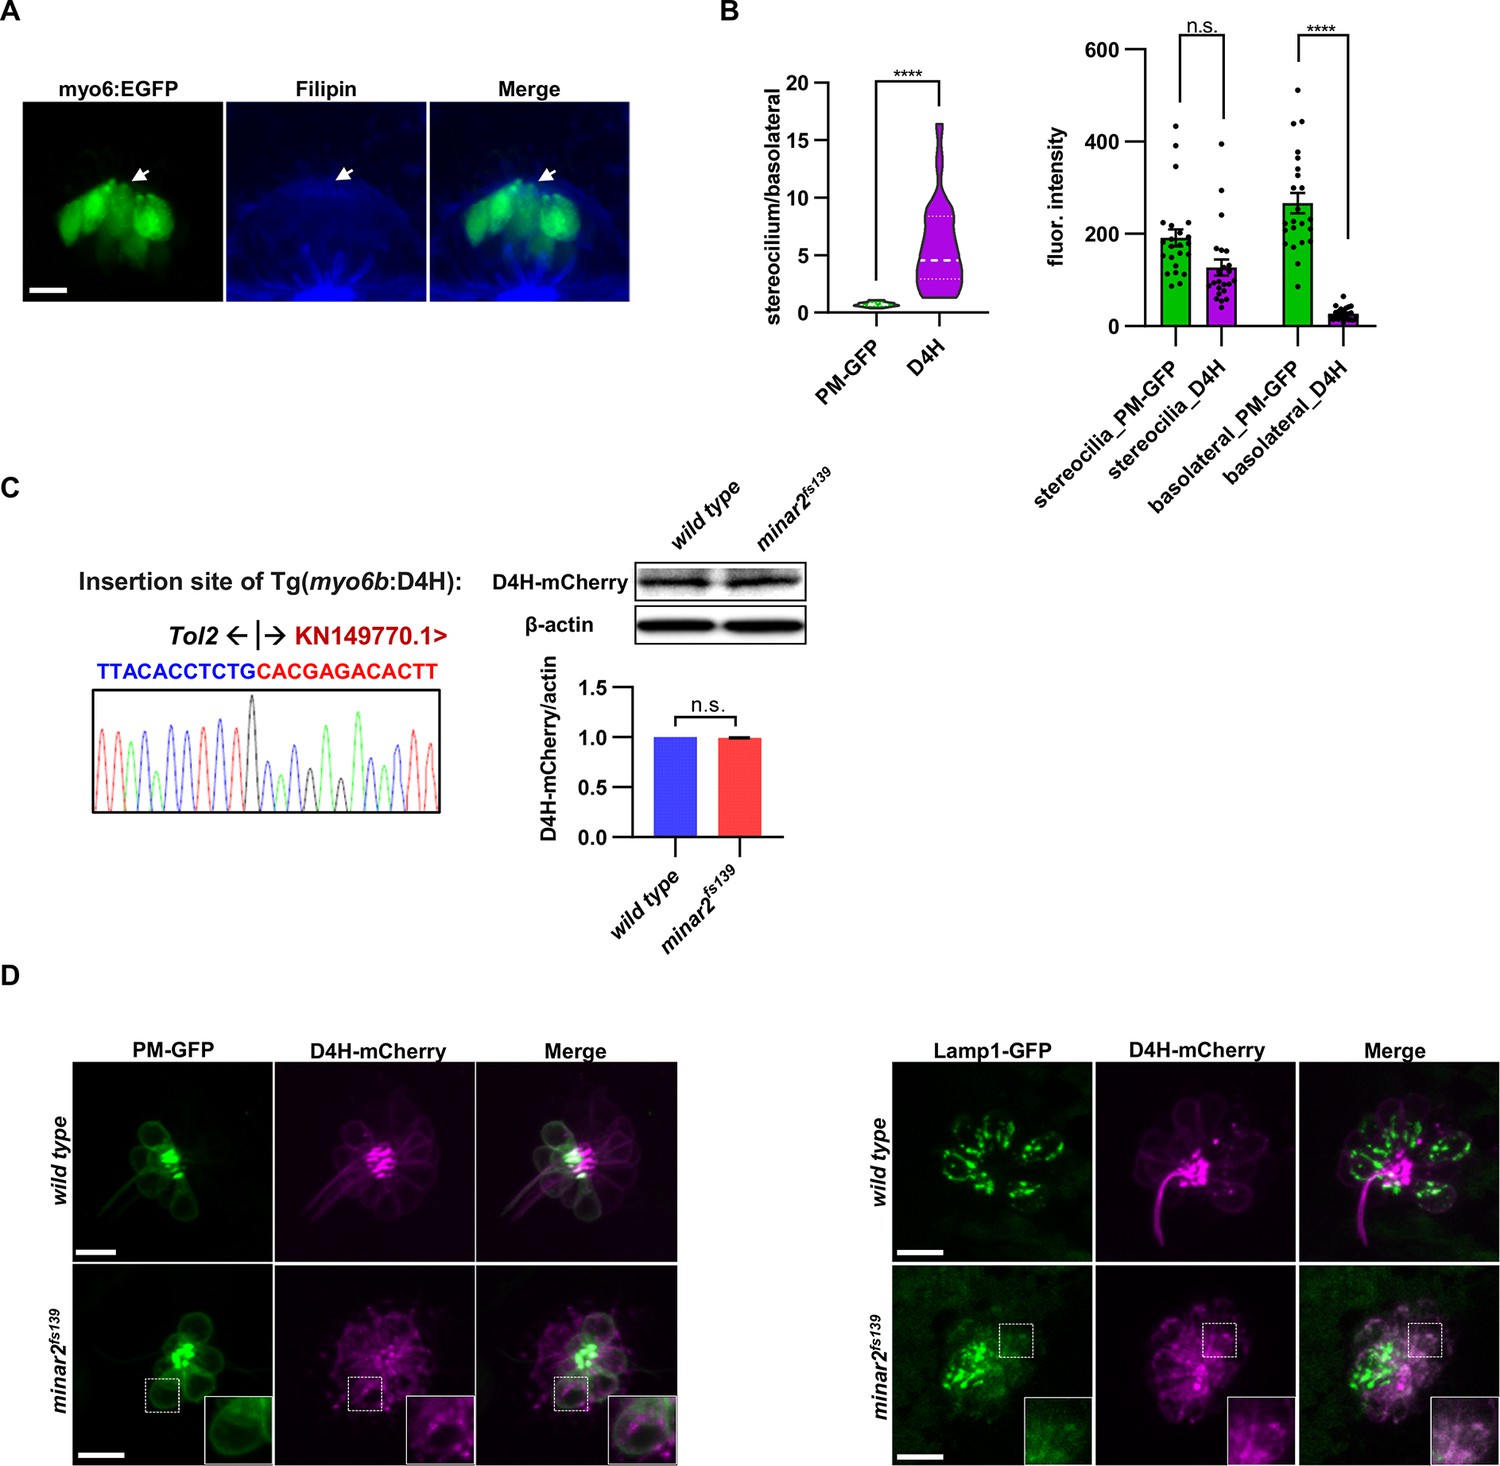
The abnormal vesicles in the minar2 mutant were co-labeled with the lysosome.
(A) Representative image of filipin staining of inner ear tissue. The lateral crista region of the inner ear was imaged. The GFP signals in the myo6:Gal4FF;UAS-EGFP transgenic line (myo6:GFP) labels hair cells. The white arrow points to the apical borders of hair cells. (B) Distribution of plasma membrane probe PM-GFP and cholesterol probe D4H in stereocilia and basolateral regions of inner ear hair cells. n=23. For the plot showing stereocilium/basolateral ratio to the left, ****p<0.0001, Mann-Whitney test. For the plot showing fluorescence intensity to the right: in the stereocilium region, p=0.263, and the basolateral region, ****p<0.0001, Kruskal-Wallis test. (C) Characterization of the Tg(myo6b:D4H-mCherry) report line. The genomic sequence at the transgenic insertion site is shown (left). Immunoblot and quantifications show that the expression levels of the D4H-mCherry transgene were not affected by the loss of minar2 in zebrafish larvae. t=1.25, df = 2, p=0.337. (D) Representative images of D4H-mCherry-labeled large vesicles in the lateral line hair cells and co-labeling by plasma membrane probe PM-GFP (left panels) and lysosomal marker Lamp1-GFP (right panels). D4H-mCherry-labeled large vesicles were co-labeled by Lamp1-GFP. Figure inserts show enlarged views of the boxed area. Scale bars represent 10 μm.
Figure 5 with 1 supplement
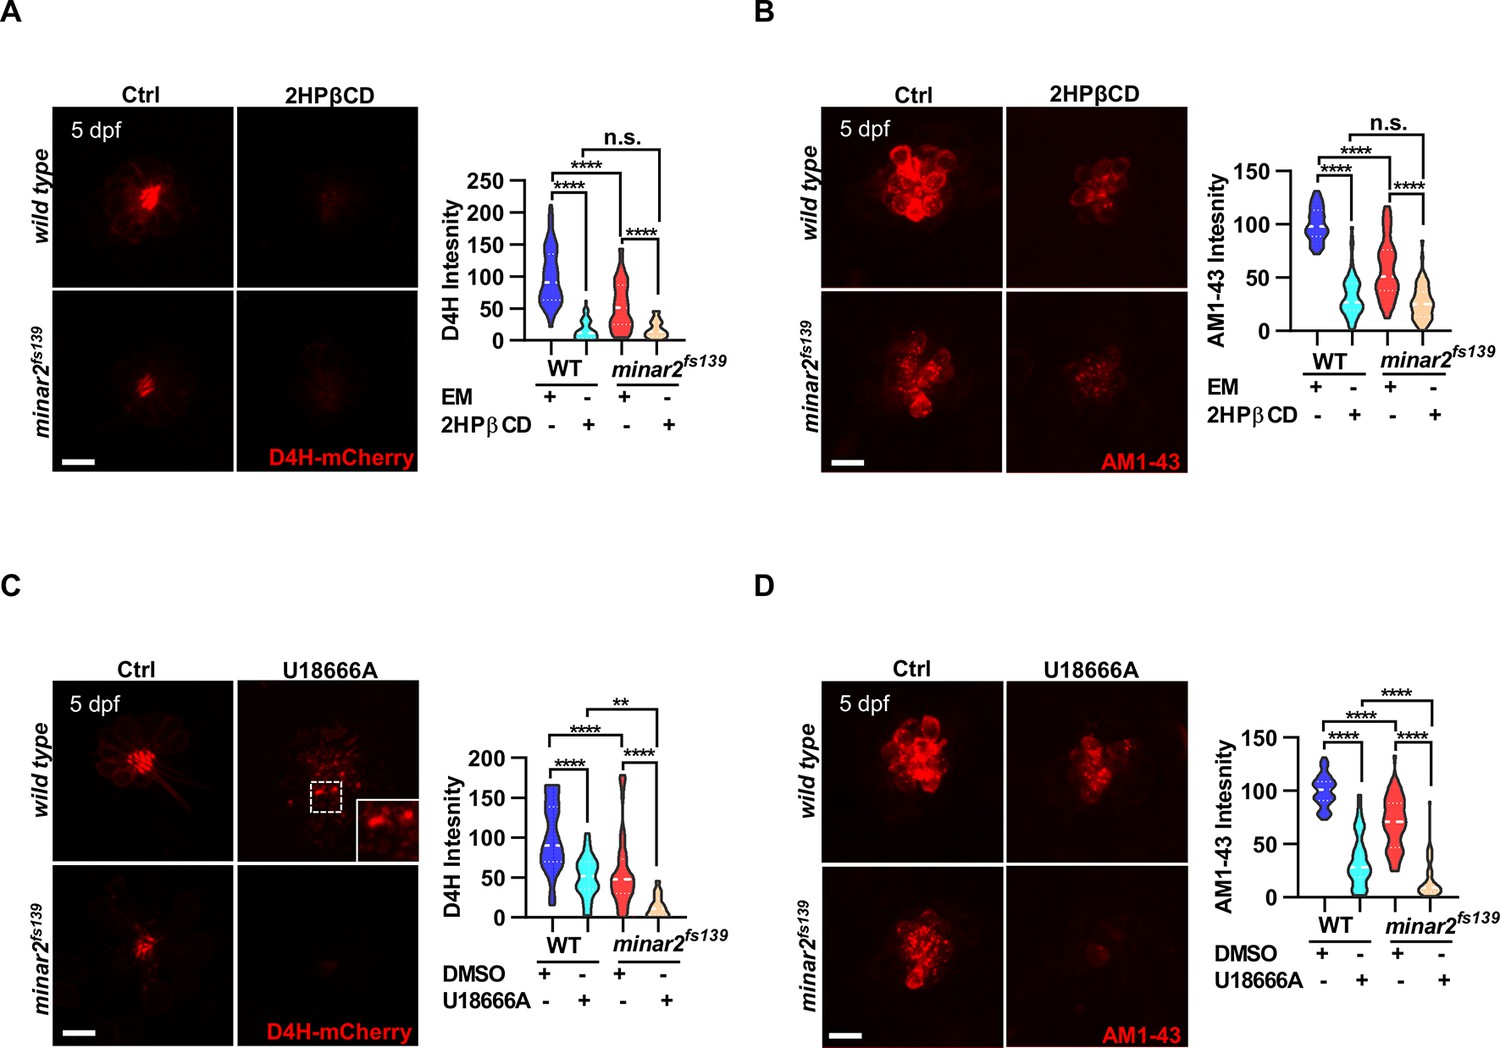
Lowering cholesterol levels aggravates hair cell defects in minar2 mutants.
(A) Quantification of D4H-mCherry intensity in wild type and mutant minar2fs139 larvae after 2HPβCD treatment. The lateral line L3 neuromast was imaged and quantified. n=45, 41, 52, and 51. F(3, 110.2)=74.76, p<0.0001. (B) Quantification of AM1-43 labeling in wild type and mutant minar2fs139 larvae after 2HPβCD treatment. n=49, 46, 49, and 51. F(3, 155.4)=124.4, p<0.0001. (C) Quantification of D4H-mCherry intensity in wild type and mutant minar2fs139 larvae after U18666A treatment. n=40, 31, 42, and 33. F(3, 111.3)=39.34, p<0.0001. (D) Quantification of AM1-43 labeling in wild type and mutant minar2fs139 larvae after U18666A treatment. n=53, 50, 52, and 46. F(3, 169.9)=158.0, p<0.0001. EM: embryonic medium, solvent control groups for 2HPβCD treatment (A and B); DMSO: solvent control groups for U18666A treatment (C and D); Multiple comparison significance values are indicated on the graph. Scale bars represent 10 μm.
-
Figure 5—source data 1
Effects of decreasing cholesterol levels on hair cells in minar2 mutant Figure 5A–D, Figure 5—figure supplement 1A–B.
- https://cdn.elifesciences.org/articles/80865/elife-80865-fig5-data1-v2.xlsx
Figure 5—figure supplement 1
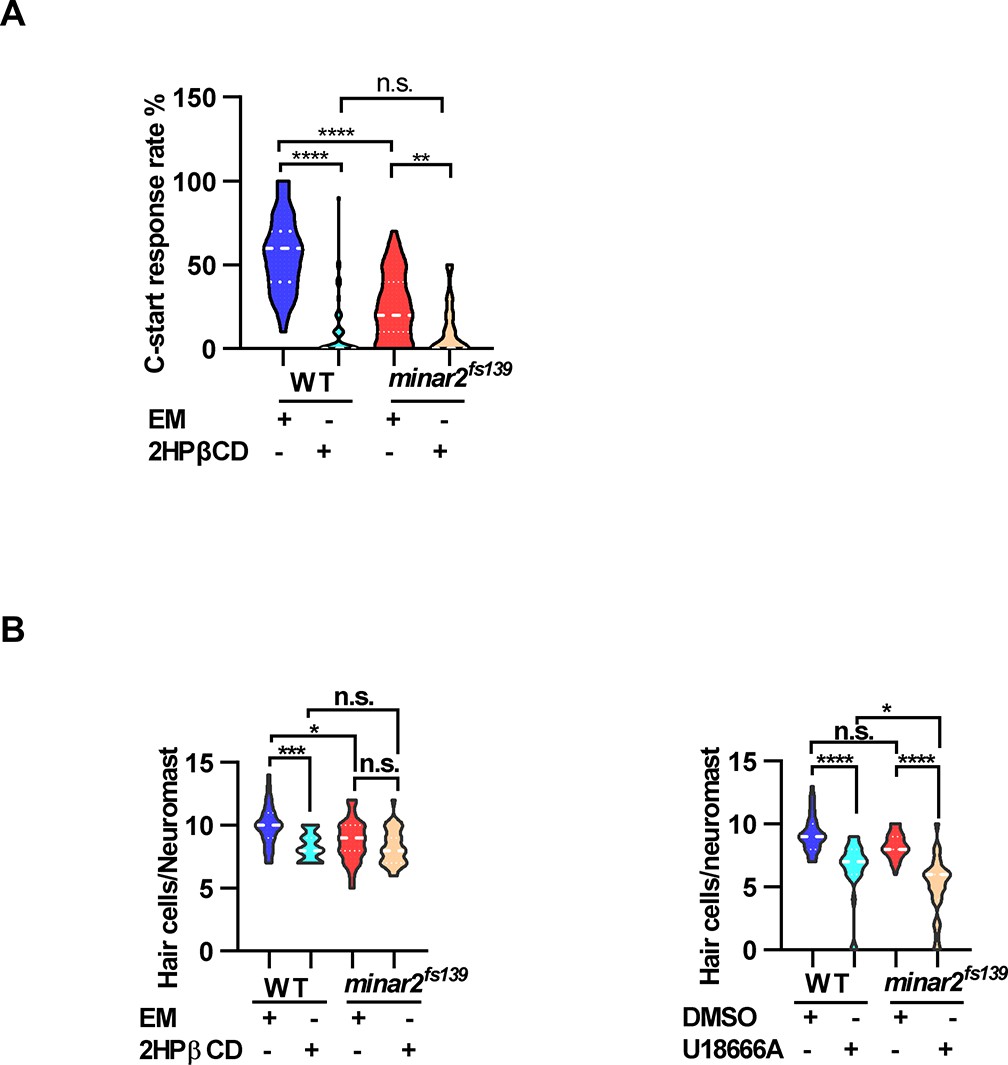
Effects of lowering cholesterol levels on hearing and neuromast hair cell numbers.
(A) Effects of 2HPβCD treatment on C-start response rates for wild type and minar2fs139 mutants (n=48 for all 4 groups. p<0.0001, Kruskal-Wallis test). (B) Effects of 2HPβCD and U18666A treatment on the numbers of hair cells in lateral line L3 neuromast (for the 2HPβCD treatment, n=27, 32, 27, and 31, F(3,113) = 8.326, p<0.0001; for the U18666A treatment, n=30, 25, 28, and 27, F(3, 106)=28.22, p<0.0001. One-way ANOVA test.). EM: embryonic medium, solvent control groups for 2HPβCD treatment; DMSO: solvent control groups for U18666A treatment. Multiple comparison significance values are indicated on the graph.
Figure 6 with 1 supplement

Increasing cholesterol levels rescue hair cell defects and hearing in minar2 mutants.
(A) Quantification of D4H-mCherry in hair cells of wild type and minar2fs139 zebrafish after efavirenz treatment. The lateral line L3 neuromast was imaged and quantified. n=40, 41, 42, and 41. F(3, 127.8)=7.557, p<0.001. (B) Quantification of AM1-43 labeling in wild type and mutant minar2fs139 larvae after efavirenz treatment. n=31, 33, 33, and 30. F(3, 115.7)=46.65, p<0.0001. (C) Effects of efavirenz treatment on the appearance of abnormally enlarged vesicles in hair cells of wild type and mutant minar2fs139 zebrafish. n=42, 38, 42, and 34. χ2=20.92, df = 3, p<0.001. (D) Effects of efavirenz treatment on C-start response rates for wild type and minar2fs139 mutants (n=48 for all 4 groups. p<0.0001, Kruskal-Wallis test). DMSO: solvent control groups; Efa: efavirenz treatment groups. Multiple comparison significance values are indicated on the graph. Scale bars represent 10 μm.
-
Figure 6—source data 1
Effects of increasing cholesterol levels on hair cells in minar2 mutant Figure 6A–D; Figure 6—figure supplement 1A–B.
- https://cdn.elifesciences.org/articles/80865/elife-80865-fig6-data1-v2.xlsx
Figure 6—figure supplement 1
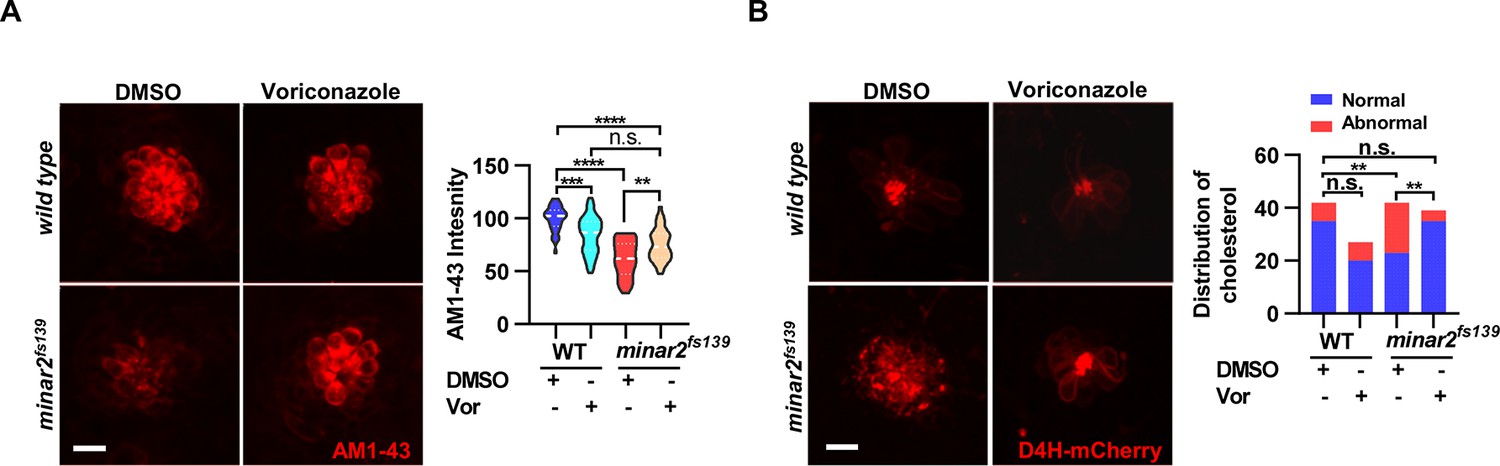
Increasing cholesterol levels by voriconazole rescue hair cell defects in minar2 mutant.
(A) Quantification of AM1-43 labeling in wild type and mutant minar2fs139 larvae after voriconazole treatment. The lateral line L3 neuromast was imaged and quantified. n=31, 43, 33, and 34. F(3, 131.4)=34.50, p<0.0001. (B) Effects of voriconazole treatment on the appearance of abnormally enlarged vesicles in hair cells of wild type and minar2fs139 zebrafish. n=42, 38, 42, and 34. χ2=20.92, df = 3, p<0.001. Multiple comparison significance values are indicated on the graph. Scale bars represent 10 μm.
Figure 7 with 1 supplement
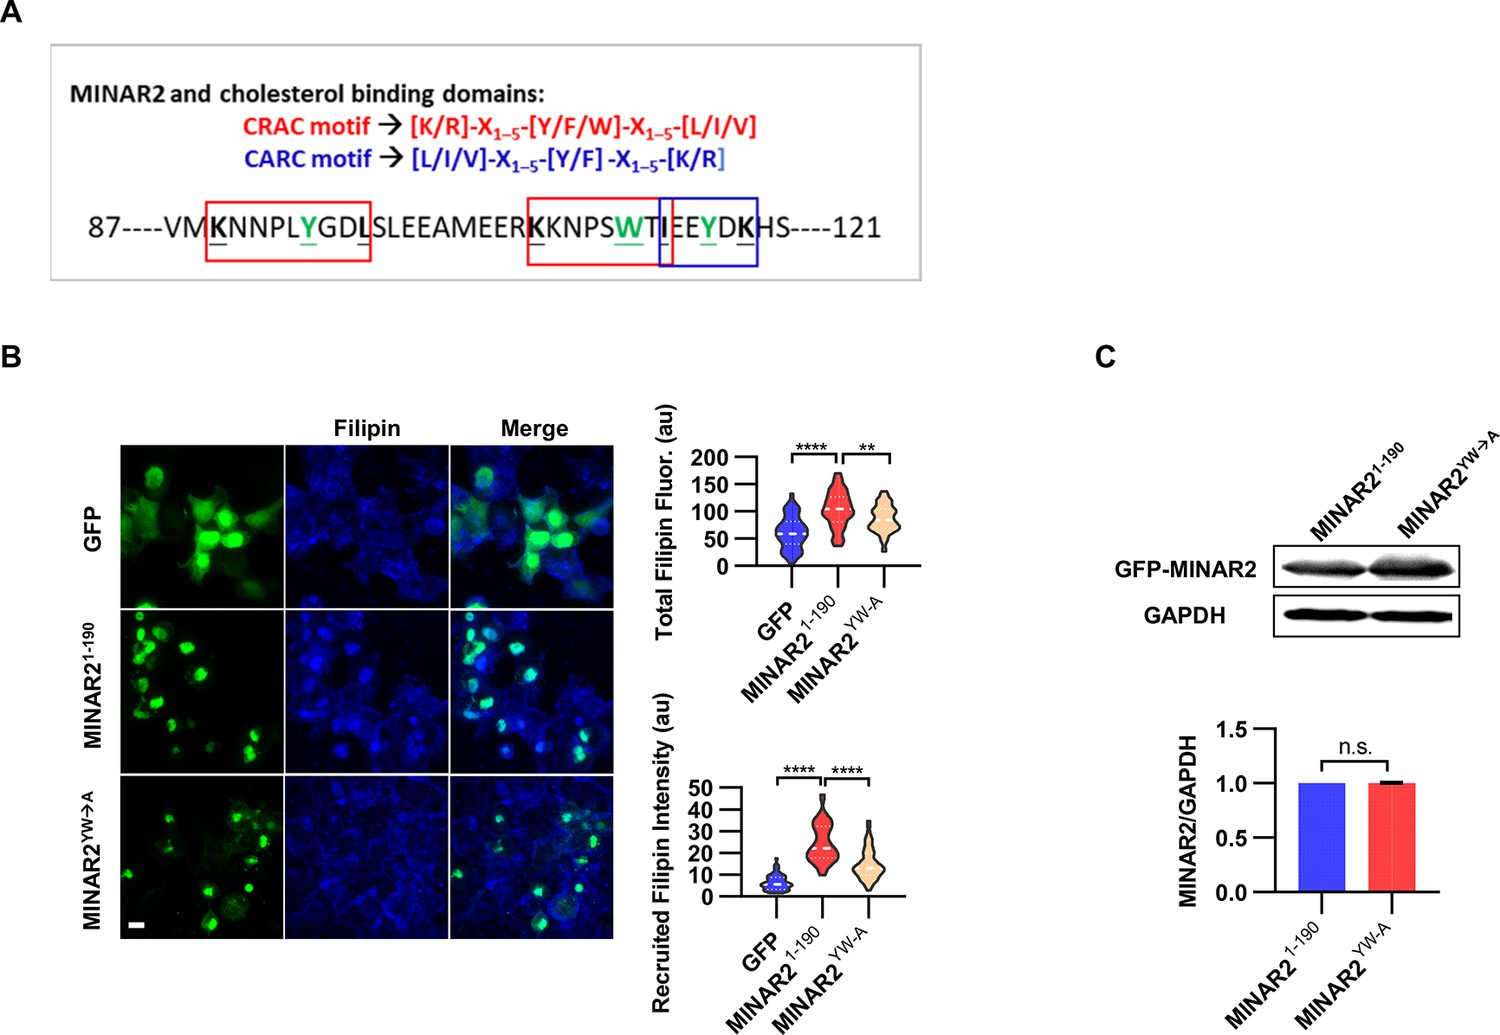
Minar2 interacts with cholesterol in vitro.
(A) Cholesterol recognition motifs in Minar2 primary sequence. The sequences for cholesterol-recognizing amino-acid consensus (CRAC, red letter and box) and its analog CARC (blue letter and box) are indicated. The critical aromatic resides (Y/W, in green letters) were mutated to alanine in the point mutation MINAR2YW-A construct. (B) Effects of critical aromatic reside mutation on the levels and distributions of filipin labeling in cultured cells. HEK293 cells were transfected with GFP alone (GFP), full length (GFP-MINAR21-190), or the point mutation construct (GFP-MINAR2YW-A). n=44, 46, and 62, for total filipin fluorescence, F(2, 149)=23.80, p<0.0001; for recruited filipin intensity, F(2, 105.5)=79.28, p<0.0001. Multiple comparison significance values are indicated on the graph. Scale bars represent 10 μm. (C) Immunoblot analysis of the expression levels of the full-length construct (GFP-MINAR21-190) and the point mutation construct (GFP-MINAR2YW-A) in HEK293 cells. Expression levels relative to GAPDH were quantified. t=0.7498, df = 2, p=0.532.
-
Figure 7—source data 1
Interaction between Minar2 and cholesterol Figure 7B–C.
- https://cdn.elifesciences.org/articles/80865/elife-80865-fig7-data1-v2.zip
Figure 7—figure supplement 1
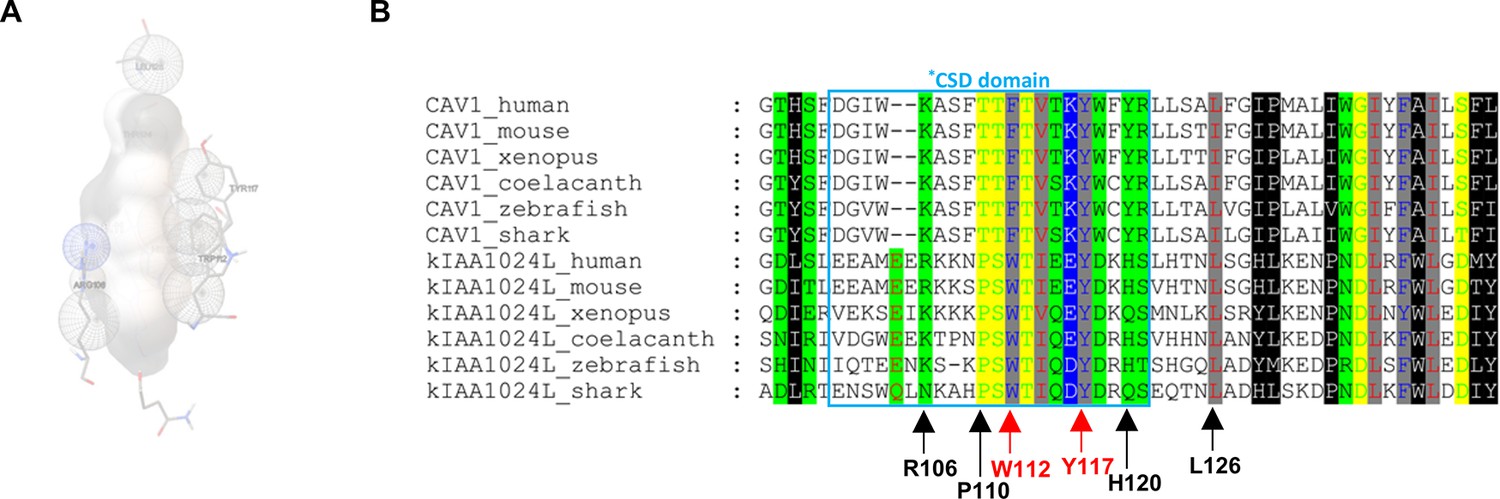
Computational docking between MINAR2 structure model and cholesterol.
(A) Interaction between MINAR2 residues and cholesterol as modeled by AutoDock. MINAR2 residues in ball-and-stick view and cholesterol molecule in grey sphere view. (B) Cholesterol interacting residues of MINAR2 are conserved. Arrows point to residues showing interaction with cholesterol as modeled by AutoDock. The arrows pointing to the critical aromatic residues are labeled in red.
Tables
Appendix 1—key resources table
| Reagent type (species) or resource | Designation | Source or reference | Identifiers | Additional information |
|---|---|---|---|---|
| Strain, strain background (Danio rerio) | AB | University of Oregon Zebrafish Facility | N/A | |
| Genetic reagent (Danio rerio) | minar2fs139 | This paper | N/A | Available from G. Peng (the lead contact)’s lab |
| Genetic reagent (Danio rerio) | minar2fs140 | This paper | N/A | Available from G. Peng (the lead contact)’s lab |
| Genetic reagent (Danio rerio) | Tg (UAS:EGFP) | Asakawa et al., 2008 | N/A | |
| Genetic reagent (Danio rerio) | Tg (myo6b: GAL4FF) | This paper | N/A | Available from G. Peng (the lead contact)’s lab |
| Genetic reagent (Danio rerio) | Tg (myo6b: GFP-Minar2) | This paper | N/A | Available from G. Peng (the lead contact)’s lab |
| Genetic reagent (Danio rerio) | Tg (myo6b: Lamp1-GFP) | This paper | N/A | Available from G. Peng (the lead contact)’s lab |
| Genetic reagent (Danio rerio) | Tg (myo6b: Lamp1-mCherry) | This paper | N/A | Available from G. Peng (the lead contact)’s lab |
| Genetic reagent (Danio rerio) | Tg (myo6b: PM-GFP) | This paper | N/A | Available from G. Peng (the lead contact)’s lab |
| Genetic reagent (Danio rerio) | Tg (myo6b: D4H-mCherry) | This paper | N/A | Available from G. Peng (the lead contact)’s lab |
| Cell line (Homo sapiens) | HEK-293 | Chinese Academia of Sciences Cell Bank | SCSP-502 | |
| Cell line (Homo sapiens) | HeLa | Chinese Academia of Sciences Cell Bank | TCHu187 | |
| Cell line (Cercopithecus aethiops) | Cos-7 | Chinese Academia of Sciences Cell Bank | SCSP-508 | |
| Antibody | anti-Tubulin Acetylated antibody (Mouse monoclonal) | Sigma | T6793 | IF(1:1000) |
| Antibody | anti-GCC1 (Rabbit polyclonal) | Sigma | 021323 | IF(1:200) |
| Antibody | anti-GM130 (Mouse monoclonal) | BD | 610822 | IF(1:200) |
| Antibody | anti-GFP (Mouse monoclonal) | Proteintech | 66002 | WB(1:2000) |
| Antibody | anti-β-actin (Mouse monoclonal) | Proteintech | 60008 | WB(1:1000) |
| Antibody | anti-mCherry (Mouse monoclonal) | Abmart | M40012 | WB(1:2000) |
| Antibody | anti-GAPDH (Mouse monoclonal) | Abmart | M20006 | WB(1:1000) |
| Antibody | anti-FLAG M2 (Mouse monoclonal) | Sigma | F3165 | IF(1:1000) |
| Antibody | anti-FLAG M2 (Rabbit monoclonal) | Cell Signaling Technology | 14793 S | IF(1:500) |
| Antibody | Alexa Fluor 488 Goat anti-Mouse IgG (H+L) (Goat polyclonal) | Thermo Fisher Scientific | A11001 | IF(1:500) |
| Antibody | Alexa Fluor 488 Goat anti-Rabbit IgG (H+L) (Goat polyclonal) | Thermo Fisher Scientific | A11034 | IF(1:500) |
| Antibody | Alexa Fluor 546 Goat anti-Mouse IgG (H+L) (Goat polyclonal) | Thermo Fisher Scientific | A11003 | IF(1:500) |
| Antibody | Alexa Fluor 546 Goat anti-Rabbit IgG (H+L) (Goat polyclonal) | Thermo Fisher Scientific | A11035 | IF(1:500) |
| Antibody | Anti-mouse IgG, HRP- linked antibody (Horse polyclonal) | Cell Signaling Technology | 7076 | WB(1:8000) |
| Antibody | Anti-rabbit IgG, HRP- linked antibody (Goat polyclonal) | Cell Signaling Technology | 7074 | WB(1:8000) |
| Recombinant DNA reagent | pCS2-mCherry-MINAR2 | This paper | N/A | Available from G. Peng (the lead contact)’s lab |
| Recombinant DNA reagent | pCS2-EGFP-MINAR2 | This paper | N/A | Available from G. Peng (the lead contact)’s lab |
| Recombinant DNA reagent | pCS2-EGFP-MINAR2YW-A | This paper | N/A | Available from G. Peng (the lead contact)’s lab |
| Recombinant DNA reagent | Endoplasmic targeting KDEL | Kneen et al., 1998; Sasavage et al., 1982 | N/A | |
| Recombinant DNA reagent | pCS2-EGFP-KDEL | This paper | N/A | Available from G. Peng (the lead contact)’s lab |
| Recombinant DNA reagent | Plasma membrane targeting PM | Pyenta et al., 2001; Wu et al., 2004 | N/A | |
| Recombinant DNA reagent | pCS2-PM-EGFP | This paper | N/A | Available from G. Peng (the lead contact)’s lab |
| Recombinant DNA reagent | D4H | Lim et al., 2019; Maekawa and Fairn, 2015 | N/A | |
| Recombinant DNA reagent | pCS2-D4H-mCherry | This paper | N/A | Available from G. Peng (the lead contact)’s lab |
| Recombinant DNA reagent | myo6b: D4HT490G-L491G-mCherry | This paper | N/A | Available from G. Peng (the lead contact)’s lab |
| Recombinant DNA reagent | myo6b:GFP-P2A-FLAG-Minar2 | This paper | N/A | Available from G. Peng (the lead contact)’s lab |
| Recombinant DNA reagent | myosin 6b gene promoter | Kindt et al., 2012 | N/A | |
| Chemical compound, drug | 2-hydroxypropyl- β-cyclodextrin (2HPβCD) | Sangon Biotech | A600388 | |
| Chemical compound, drug | AM1-43 | Biotium | 70024 | |
| Chemical compound, drug | Efavirenz | MCE | HY-10572 | |
| Chemical compound, drug | Filipin | MCE | HY-N6716 | |
| Chemical compound, drug | Lyso-Tracker Red | Beyotime | C1046 | |
| Chemical compound, drug | Phalloidin | Beyotime | C1033/C2203S | |
| Chemical compound, drug | U18666A | MCE | HY-107433 | |
| Chemical compound, drug | Voriconazole | MCE | HY-76200 | |
| Software, algorithm | MATLAB | Mathworks | https://www.mathworks.com/products/matlab.html | |
| Software, algorithm | GraphPad Prism 9 | GraphPad Software | https://www.graphpad.com/scientificsoftware/prism/ | |
| Software, algorithm | ImageJ | Schneider et al., 2012 | https://imagej.nih.gov/ij/index.html | |
| Software, algorithm | Clustal Omega sequence alignment software | European Bioinformatics Institute | https://www.ebi.ac.uk/Tools/msa/clustalo/ | |
| Software, algorithm | FigTree v1.4.2 | Andrew Rambaut | http://tree.bio.ed.ac.uk/software/figtree/ | |
| Software, algorithm | GIMP 2.8.14 | GNU Image Manipulation Program | https://www.gimp.org/downloads/ | |
| Software, algorithm | GeneDoc | NRBSC | http://nrbsc.org/gfx/genedoc | |
| Software, algorithm | Flycapture2 | Teledyne FLIR | https://www.flir.com/products/flycapture-sdk/ | |
| Software, algorithm | FV10-ASW 4.2 Viewer | Olympus | https://www.olympus-lifescience.com.cn/en/ | |
| Sequence-based reagent | minar2fs139 WT genotyping_F | This paper | PCR primers | TGGGAATGTTGCC GGCTACACAT |
| Sequence-based reagent | minar2fs139 WT genotyping_R | This paper | PCR primers | AGCCTACTATTGTA GTTGTATTACC |
| Sequence-based reagent | minar2fs139 HO genotyping_F | This paper | PCR primers | GGAATGTTGCC GGCATGGAA |
| Sequence-based reagent | minar2fs139 HO genotyping_R | This paper | PCR primers | AGCCTACTATTG TAGTTGTATTACC |
| Sequence-based reagent | minar2fs140 WT genotyping_F | This paper | PCR primers | GTTGCCGGCTA CACATGGAA |
| Sequence-based reagent | minar2fs140 WT genotyping_R | This paper | PCR primers | AGCCTACTATTG TAGTTGTATTACC |
| Sequence-based reagent | minar2fs140 HO genotyping_F | This paper | PCR primers | GAATGTTGCCGG CTACATGGAAC |
| Sequence-based reagent | minar2fs140 HO genotyping_R | This paper | PCR primers | AGCCTACTATTG TAGTTGTATTACC |
| Sequence-based reagent | minar2 target site verification_F | This paper | PCR primers | AGTAGGTATCAG GTAGAGTTACAT |
| Sequence-based reagent | minar2 target site verification_R | This paper | PCR primers | AGCCTACTATTG TAGTTGTATTACC |
| Sequence-based reagent | zebrafish- minar2_F | This paper | RT-PCR primers | CAACGGCAGTG GCACAACAGGAT |
| Sequence-based reagent | zebrafish-minar2_R | This paper | RT-PCR primers | GTGAAGTGTGTC TGTCATAGTCCTG |
| Sequence-based reagent | zebrafish-minar1a_F | This paper | RT-PCR primers | CAGGTCCAGGA ATCACTCAACC |
| Sequence-based reagent | zebrafish-minar1a_R | This paper | RT-PCR primers | GCGGGGAAAAA ATAAAGATAGAAACC |
| Sequence-based reagent | zebrafish-minar1b_F | This paper | RT-PCR primers | CCAGGAGCCAC ACAGAGAGC |
| Sequence-based reagent | zebrafish-minar1b_R | This paper | RT-PCR primers | CGGTGTGTAAAT CTCATCTGTCCA |
| Sequence-based reagent | zebrafish-gapdh_F | This paper | RT-PCR primers | CATCGTTGAAGGTC TTATGAGCACTG |
| Sequence-based reagent | zebrafish-gapdh_R | This paper | RT-PCR primers | AGGTTTCTCAAGAC GGACTGTCAG |
| Sequence-based reagent | zebrafish-hmgcra_F | This paper | RT-PCR primers | GATTGAGCCTGA CATGCCCCTG |
| Sequence-based reagent | zebrafish-hmgcra_R | This paper | RT-PCR primers | GCAGGGGTCGAAT CACTAAATCTC |
| Sequence-based reagent | zebrafish-hmgcs1_F | This paper | RT-PCR primers | ATGGGATTCTGC TCGGACCGC |
| Sequence-based reagent | zebrafish-hmgcs1_R | This paper | RT-PCR primers | CATACACAGCAA TATCACCAGCAAC |
| Sequence-based reagent | zebrafish-mylipa_F | This paper | RT-PCR primers | GAATCTCCCAGC AGATGGACAATC |
| Sequence-based reagent | zebrafish-mylipa_R | This paper | RT-PCR primers | TGTGCTTGGCTA TGATACTGTTGATG |
| Sequence-based reagent | zebrafish-abcg1_F | This paper | RT-PCR primers | GCCCTGGAGCT GGTCAACAAC |
| Sequence-based reagent | zebrafish-abcg1_R | This paper | RT-PCR primers | TATTCACCAGACG CCACCTCCATT |
| Sequence-based reagent | zebrafish probe minar2_F | This paper | PCR primers | AGTCACAAAATGG ACATAGCCGTC |
| Sequence-based reagent | zebrafish probe minar2_R | This paper | PCR primers | CTAGATTGTAGAG CAGGGTTGTTC |
| Sequence-based reagent | myo6b promoter section1_F | This paper | PCR primers | ccagtttaatttGTACACCTGT CCAACTGCTCATTAG |
| Sequence-based reagent | myo6b promoter section1_R | This paper | PCR primers | cAAGTCACAAGGTGC CTACTGGGTTGCC |
| Sequence-based reagent | myo6b promoter section2_F | This paper | PCR primers | ggcaccttgtgacttAACCCAG TAGGCACCTTGTGACTT |
| Sequence-based reagent | myo6b promoter section2_R | This paper | PCR primers | ccccaTTATTTACAGT GTAAAATTCTTTG |
| Sequence-based reagent | myo6b promoter section3_F | This paper | PCR primers | ctgtaaataaTGGGGTCG CCACAGCGGAATGAAC |
| Sequence-based reagent | myo6b promoter section3_R | This paper | PCR primers | ataagtacgggatctATTG CACCCCACAATT ACTCCACAGCTCTG |
| Sequence-based reagent | p-mTol2-myo6b:GAL4FF_F | This paper | PCR primers | tggggtgcaatAAATAGAT CCCGTACTTATATAAG |
| Sequence-based reagent | p-mTol2-myo6b:GAL4FF_R | This paper | PCR primers | ggacaggtgtacAAATTA AACTGGGCATCAGCGC |
| Sequence-based reagent | zebrafish minar2 cDNA_F | This paper | RT-PCR primers | ATGGACATAGCCG TCCTGCCGAAC |
| Sequence-based reagent | zebrafish minar2 cDNA_R | This paper | RT-PCR primers | TCAGTCTCTTGATT GTTTTACCACTAT |
| Sequence-based reagent | myo6b:GFP-Minar2_F | This paper | PCR primers | aaatagatcccATGGTGA GCAAGGGCGAGGAG |
| Sequence-based reagent | myo6b:GFP-Minar2_R | This paper | PCR primers | gattagttacccTCAGTC TCTTGATTGTTTTACC |
| Sequence-based reagent | p-mTol2-myo6b:GFP-Minar2_F | This paper | PCR primers | tcaagagactgaGGGTA ACTAATCTAGAACTATAG |
| Sequence-based reagent | p-mTol2-myo6b:GFP-Minar2_R | This paper | PCR primers | cttgctcaccatGGGATCT ATTTATTGCACCCCA |
| Sequence-based reagent | p-mTol2-myo6b:GFP-P2A- FLAG-Minar2 (P2A section)_F | This paper | PCR primers | gagctgtacaagGGAAGC GGAGCTACTAACTTC |
| Sequence-based reagent | p-mTol2-myo6b:GFP-P2A- FLAG-Minar2 (P2A section)_R | This paper | PCR primers | cggatcctgcaaAGGTCC AGGGTTCTCCTCC |
| Sequence-based reagent | p-mTol2-myo6b:GFP-P2A- FLAG-Minar2 (FLAG section)_F | This paper | PCR primers | aaccctggacctTTGCAG GATCCGATGGACTAC |
| Sequence-based reagent | p-mTol2-myo6b:GFP-P2A- FLAG-Minar2 (FLAG section)_R | This paper | PCR primers | ggctatgtccatTCCAGAA CCTTTGTCATCGTC |
| Sequence-based reagent | p-mTol2-myo6b:GFP-P2A- FLAG-Minar2 (Minar2 section)_F | This paper | PCR primers | aaaggttctggaATGGACAT AGCCGTCCTGC |
| Sequence-based reagent | p-mTol2-myo6b:GFP-P2A- FLAG-Minar2 (Minar2 section)_R | This paper | PCR primers | agctccgcttccCTTGTAC AGCTCGTCCATGC |
| Sequence-based reagent | D4H_F | This paper | PCR primers | ATGAAGGGAAAA ATAAACTTAGATC |
| Sequence-based reagent | D4H_R | This paper | PCR primers | ATTGTAAGTAAT ACTAGATCCAGG |
| Sequence-based reagent | myo6b:D4H-mCherry_F | This paper | PCR primers | taaatagatcccgccaccA TGAAGGGAAAAATAAA |
| Sequence-based reagent | myo6b:D4H-mCherry_R | This paper | PCR primers | gattagttacccTTACTTG TACAGCTCGTCCATG |
| Sequence-based reagent | p-mTol2-myo6b:D4H-mCherry_F | This paper | PCR primers | ctgtacaagtaaGGGTAA CTAATCTAGAACTATAG |
| Sequence-based reagent | p-mTol2-myo6b:D4H-mCherry_R | This paper | PCR primers | ttcccttcatggtggcGGG ATCTATTTATTG |
| Sequence-based reagent | p-mTol2-myo6b: D4HT490G-L491G-mCherry_F | This paper | PCR primers | tggggaacaggcGGATACC CTGGATCTAGTATTAC |
| Sequence-based reagent | p-mTol2-myo6b: D4HT490G-L491G-mCherry_R | This paper | PCR primers | tccagggtatccGCCTGTT CCCCATATTGAAACAT |
| Sequence-based reagent | myo6b:PM-GFP_F | This paper | PCR primers | gatcccGCCACCatgggttgt aaaaaatccaagttggatggtgacc aaaatggatgtgtgcttgaaccagt gaacGGTTCTGGAATG |
| Sequence-based reagent | myo6b:PM-GFP_R | This paper | PCR primers | CATTCCAGAACCgttc actggttcaagcacacatccattttggt caccatccaacttggatttttta caacccatGGTGGCgggatc |
| Sequence-based reagent | p-mTol2-myo6b:PM-GFP_F | This paper | PCR primers | gaaccagtgaacGGTTCT GGAATGGTGAGCAAGG |
| Sequence-based reagent | p-mTol2-myo6b:PM-GFP_R | This paper | PCR primers | tttacaacccatGGTGGCGG GATCTATTTATTGCAC |
| Sequence-based reagent | zebrafish lamp1_F | This paper | RT-PCR primers | ATGGCGCGAG CTGCAGGTGT |
| Sequence-based reagent | zebrafish lamp1_R | This paper | RT-PCR primers | GATGGTCTGGT ACCCGGCGT |
| Sequence-based reagent | myo6b:Lamp1-GFP/mCherry_F | This paper | PCR primers | taccagaccatcGGTTC TGGAATGGTGAGCAAGG |
| Sequence-based reagent | myo6b:Lamp1-GFP/mCherry_R | This paper | PCR primers | agctcgcgccatGGTGG CGGGATCTATTTATTGCAC |
| Sequence-based reagent | p-mTol2-myo6b:Lamp1-GFP/mCherry_F | This paper | PCR primers | gatcccgccaccATGGC GCGAGCTGCAGGTGT |
| Sequence-based reagent | p-mTol2-myo6b:Lamp1-GFP/mCherry_R | This paper | PCR primers | ccattccagaaccGATGG TCTGGTACCCGGCGT |
| Sequence-based reagent | human MINAR2 cDNA_F | This paper | RT-PCR primers | aattgccaccATGGATCTC TCTGTTTTGCCAAATAACAA |
| Sequence-based reagent | human MINAR2 cDNA_R | This paper | RT-PCR primers | ccggGGTGAAAAAAG TAATGATAGTCACTATGG |
| Sequence-based reagent | pCS2-eGFP-MINAR21-190_F | This paper | PCR primers | acTGTACAAGat ggatctctctgttttgcc |
| Sequence-based reagent | pCS2-eGFP-MINAR21-190_R | This paper | PCR primers | gcagCGAGCTCTTA ggtgaaaaaagtaatgatagtc |
| Sequence-based reagent | pCS2-eGFP-MINAR2 YW-A step1_F | This paper | PCR primers | GCTACCATTGAGGA AGCAGACAAACATT CCCTGCACACA |
| Sequence-based reagent | pCS2-eGFP-MINAR2 YW-A step1_R | This paper | PCR primers | AACTTAGGTCACCTG CGAGTGGGTTATT CTTCATAACTG |
| Sequence-based reagent | pCS2-eGFP-MINAR2 YW-A step2_F | This paper | PCR primers | GCTATGGAAGAAAG AAAAAAGAACCCCTC AGCTACCATTGAG GAAGCAGAC |
| Sequence-based reagent | pCS2-eGFP-MINAR2 YW-A step2_R | This paper | PCR primers | TCTTTTTTCTTTCTTC CATAGCTTCCTCC AAACTTAGGTCACC TGCGAGTG |
Additional files
-
MDAR checklist
- https://cdn.elifesciences.org/articles/80865/elife-80865-mdarchecklist1-v2.docx
-
Source code 1
MATLAB scripts for quantification of fluorescence signals.
- https://cdn.elifesciences.org/articles/80865/elife-80865-code1-v2.zip
Download links
A two-part list of links to download the article, or parts of the article, in various formats.
Downloads (link to download the article as PDF)
Open citations (links to open the citations from this article in various online reference manager services)
Cite this article (links to download the citations from this article in formats compatible with various reference manager tools)
Kiaa1024L/Minar2 is essential for hearing by regulating cholesterol distribution in hair bundles
eLife 11:e80865.
https://doi.org/10.7554/eLife.80865


