Nested mechanosensory feedback actively damps visually guided head movements in Drosophila
- Department of Mechanical Engineering, Pennsylvania State University, United States
Figures
Figure 1
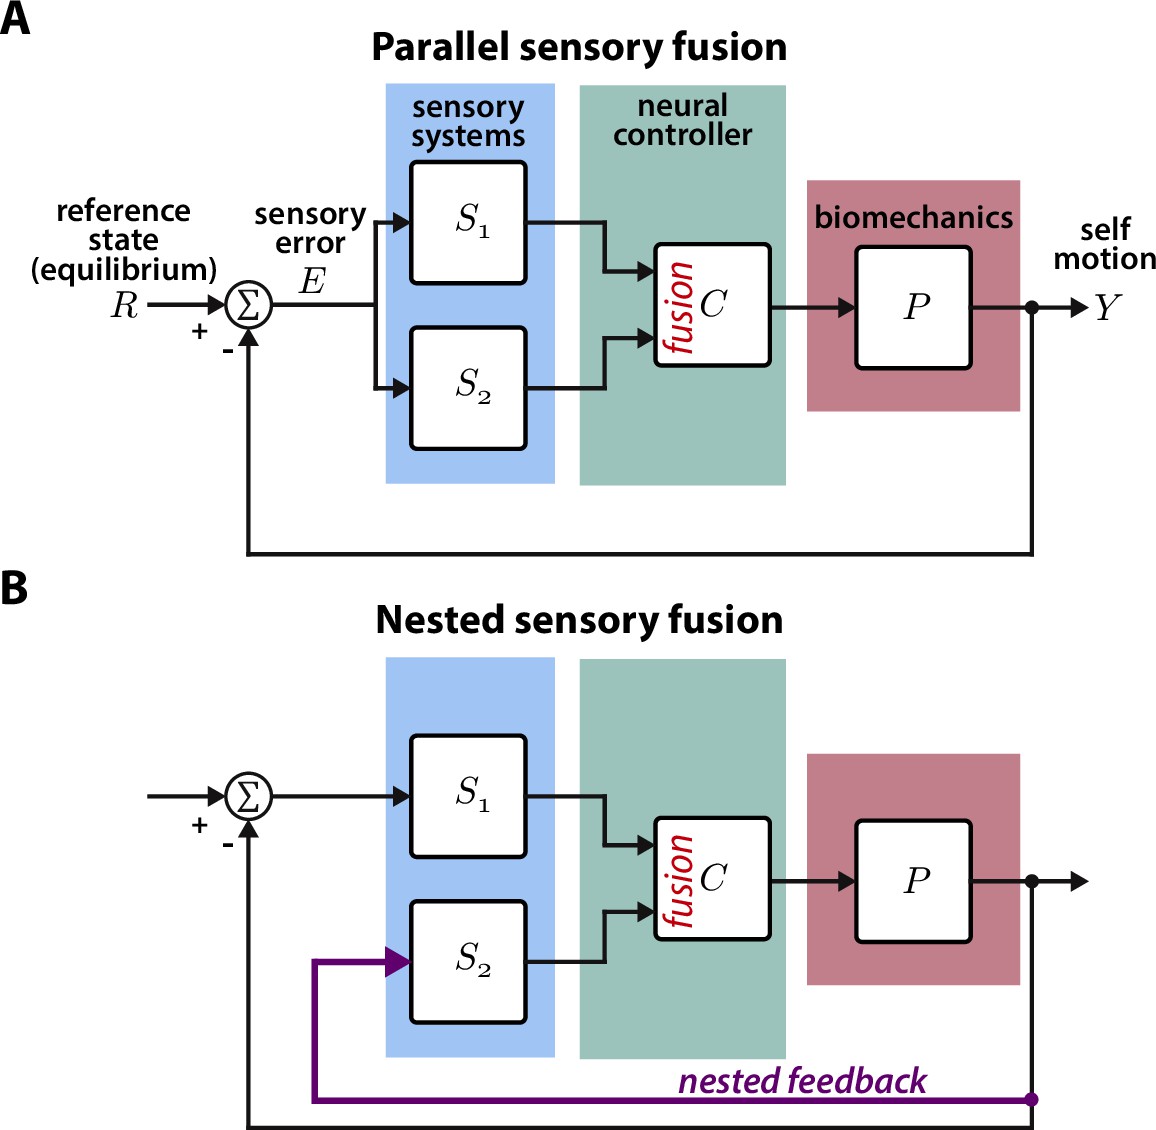
Parallel and nested sensory fusion in biological systems.
(A) Control model of parallel sensory fusion. Multiple sensory systems, S1 and S2, measure an external reference state with respect to the system’s motion . The information measured by S1 and S2 is fused together in parallel by a neural controller to maintain equilibrium. The neural controller drives locomotion through the system’s biomechanics , which feeds back to shape future sensory inputs, thus closing the loop. (B) Control model of nested sensory fusion. Same as (A) but one of the sensory systems (S2) does not directly measure the external reference state . Instead the system state is directly fed to the neural controller (purple). Thus S2 is not involved with measuring external sensory states.
Figure 2
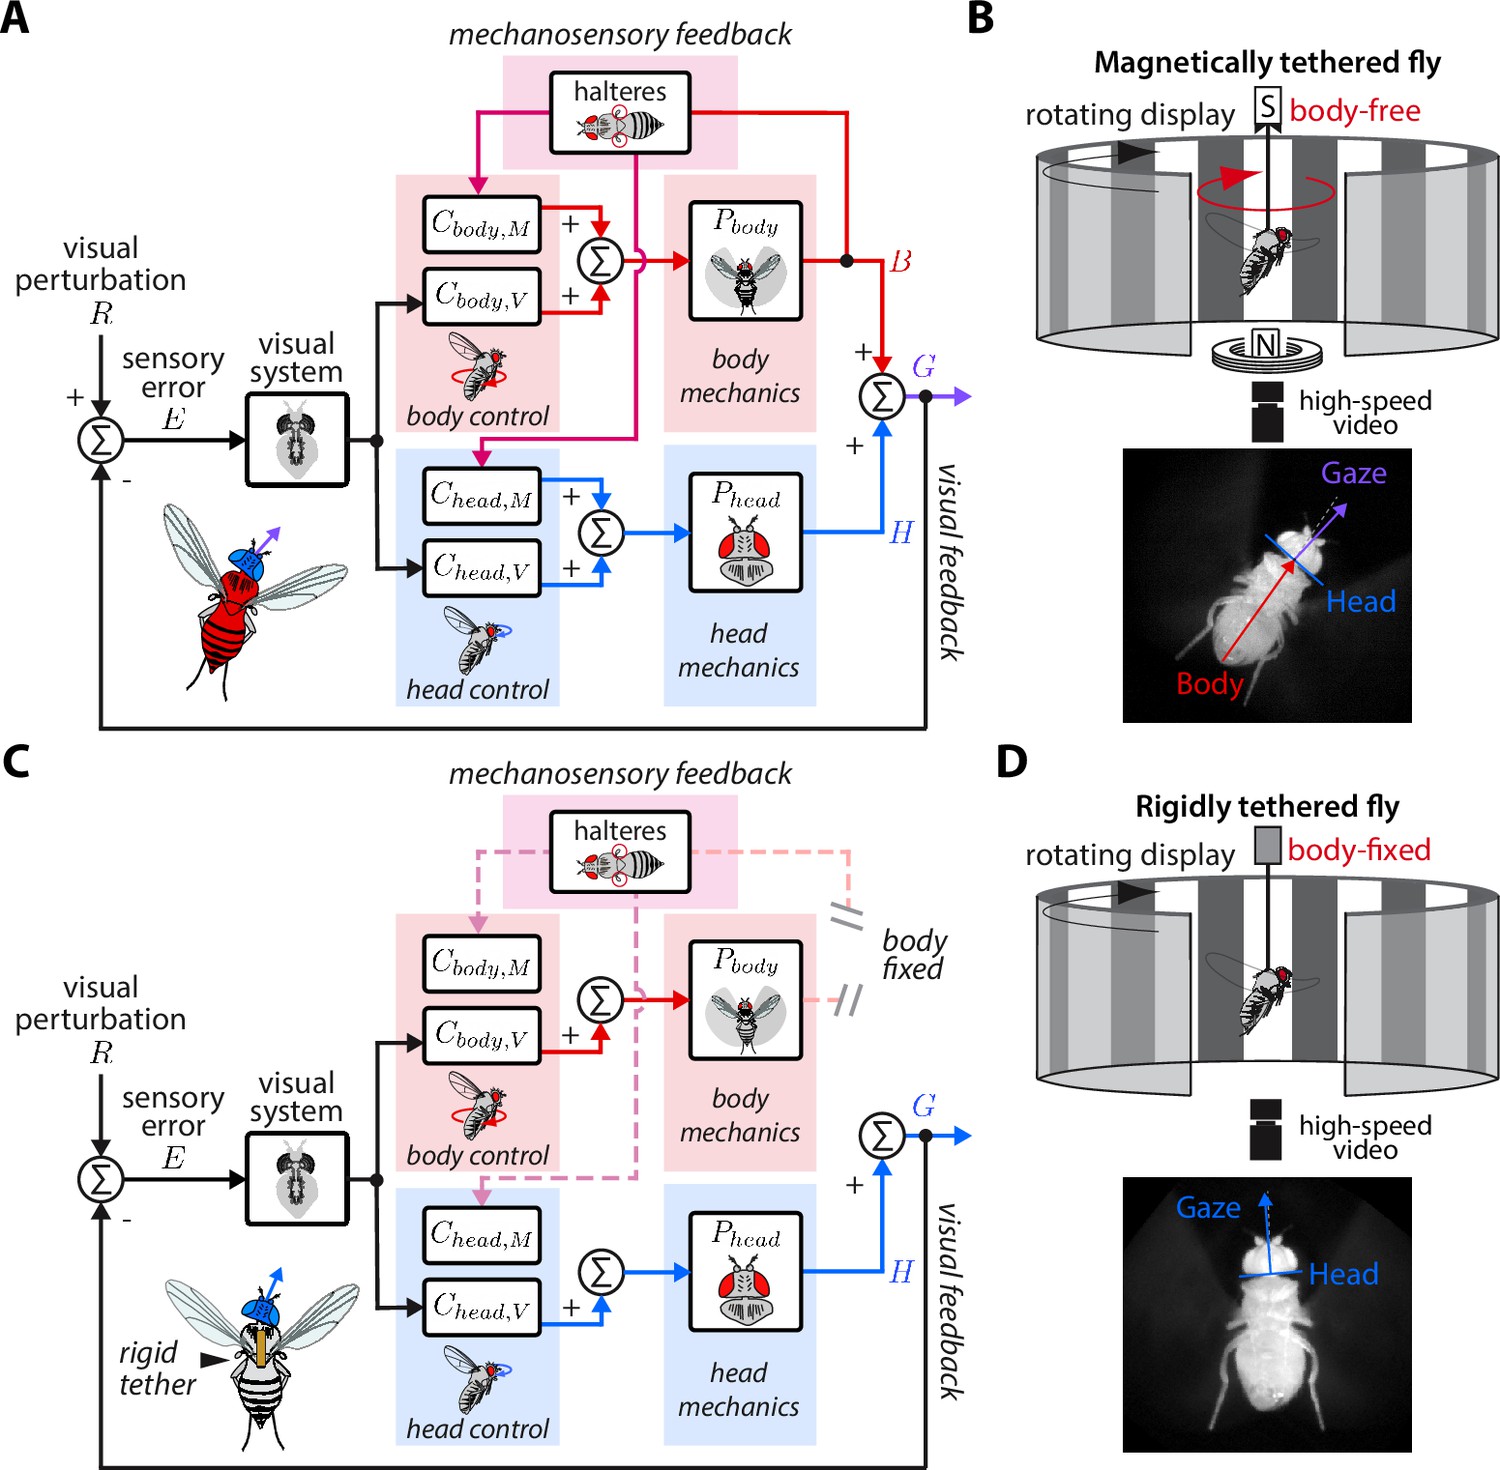
Control model of visual and nested mechanosensory feedback during gaze stabilization in fly flight.
(A) The control framework used to model and analyze the gaze stabilization system in body-free flies. Flies respond to an external visual perturbation by attempting to minimize the sensory visual error measured by their visual system. Neural control circuits in the brain for the head and body process the sensory error and send motor control signals to the corresponding biomechanical systems and to generate head and body movements. The fly’s gaze is controlled by the sum of head and body movements, which feeds back to shape the sensory error entering the visual system. Flies also measure mechanosensory information associated with body motion via the halteres, which is processed in the brain by analogous controllers for the head and body , and also contributes to shaping head and body responses. In this paradigm, mechanosensory feedback is nested within visual feedback. (B) The magnetic tether experimental paradigm for body-free flies corresponding to (A). A fly is tethered to a pin which is placed in a low-friction bearing and suspended in a magnetic field, allowing free rotation about the vertical (yaw) axis. (C) Same as (A) but for a body-fixed fly. Note that contributions of body visual feedback and nested mechanosensory feedback due to body motion are no longer present. The fly’s gaze is now purely determined by head movements. (D) The rigid tether experimental paradigm for body-fixed flies corresponding to (C).
Figure 3 with 6 supplements

Sensory feedback generated from body movements alters the magnitude, timing, and performance of head responses.
(A) The body response (red) of body-free flies to single-sine visual perturbations (grey) with varying frequency. The x-axis is normalized to show four oscillations at each frequency. Note that the body response is larger relative to the visual perturbation at low frequencies, leading to a smaller sensory error signal (yellow) in the head reference frame. Thick lines: mean. Thin lines: individual fly means. (B) The distribution of compensation errors in the head reference frame corresponding to the sensory error in (A) normalized by the perturbation amplitude. Values below one indicate that body movements reduced the sensory error while values greater than one indicate that body movements increased the sensory error. (C) The head response of body-free (blue) and body-fixed (violet) flies to the same visual perturbation (grey) shown in (A). At low frequencies, the head would often run into the anatomical limits of the neck joint (dashed pink lines). Thick lines: mean response. Thin lines: individual fly means. (D) The total distribution of head angular displacements for body-free and body-fixed flies for each perturbation frequency. For each frequency, the body-free and body-fixed head distributions had a different variance (F-test, ). Body-free: flies, Body-fixed: flies.
Figure 3—figure supplement 1
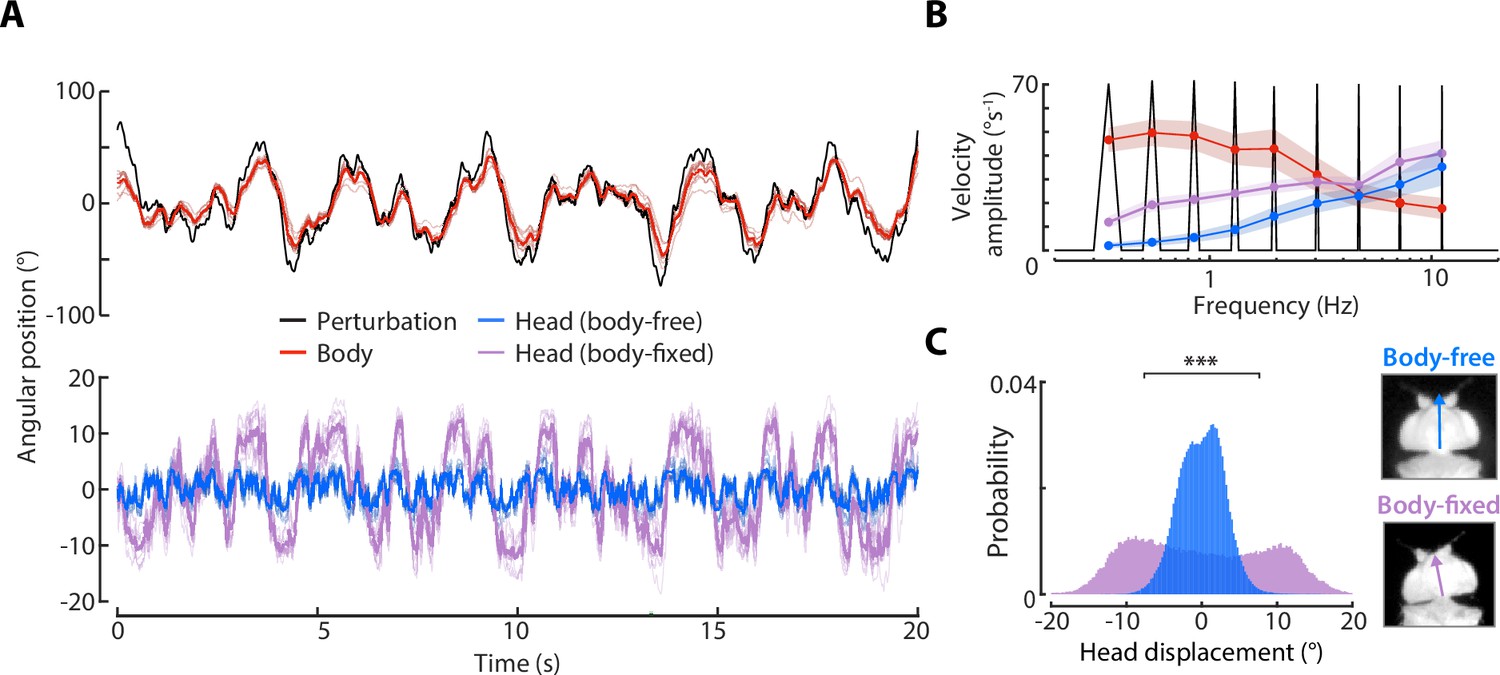
Sum-of-sines body and head responses.
(A) Top: the body response (red) of body-free flies to a sum-of-sines visual perturbation (black). Bottom: the head response of body-free (blue) and body-fixed (violet) flies to the same visual perturbation. Thick lines: mean response. Thin lines: individual fly means. (B) The velocity magnitude of the body, and head for body-free and body-fixed paradigms calculated at each frequency present in the visual perturbation (calculated from Chirp-Z transform, see Materials and method). Shaded regions: ±1 STD. (C) The total distribution of head angular displacements from body-free and body-fixed flies. *** F-test . Body-free: flies, Body-fixed: flies.
Figure 3—figure supplement 2
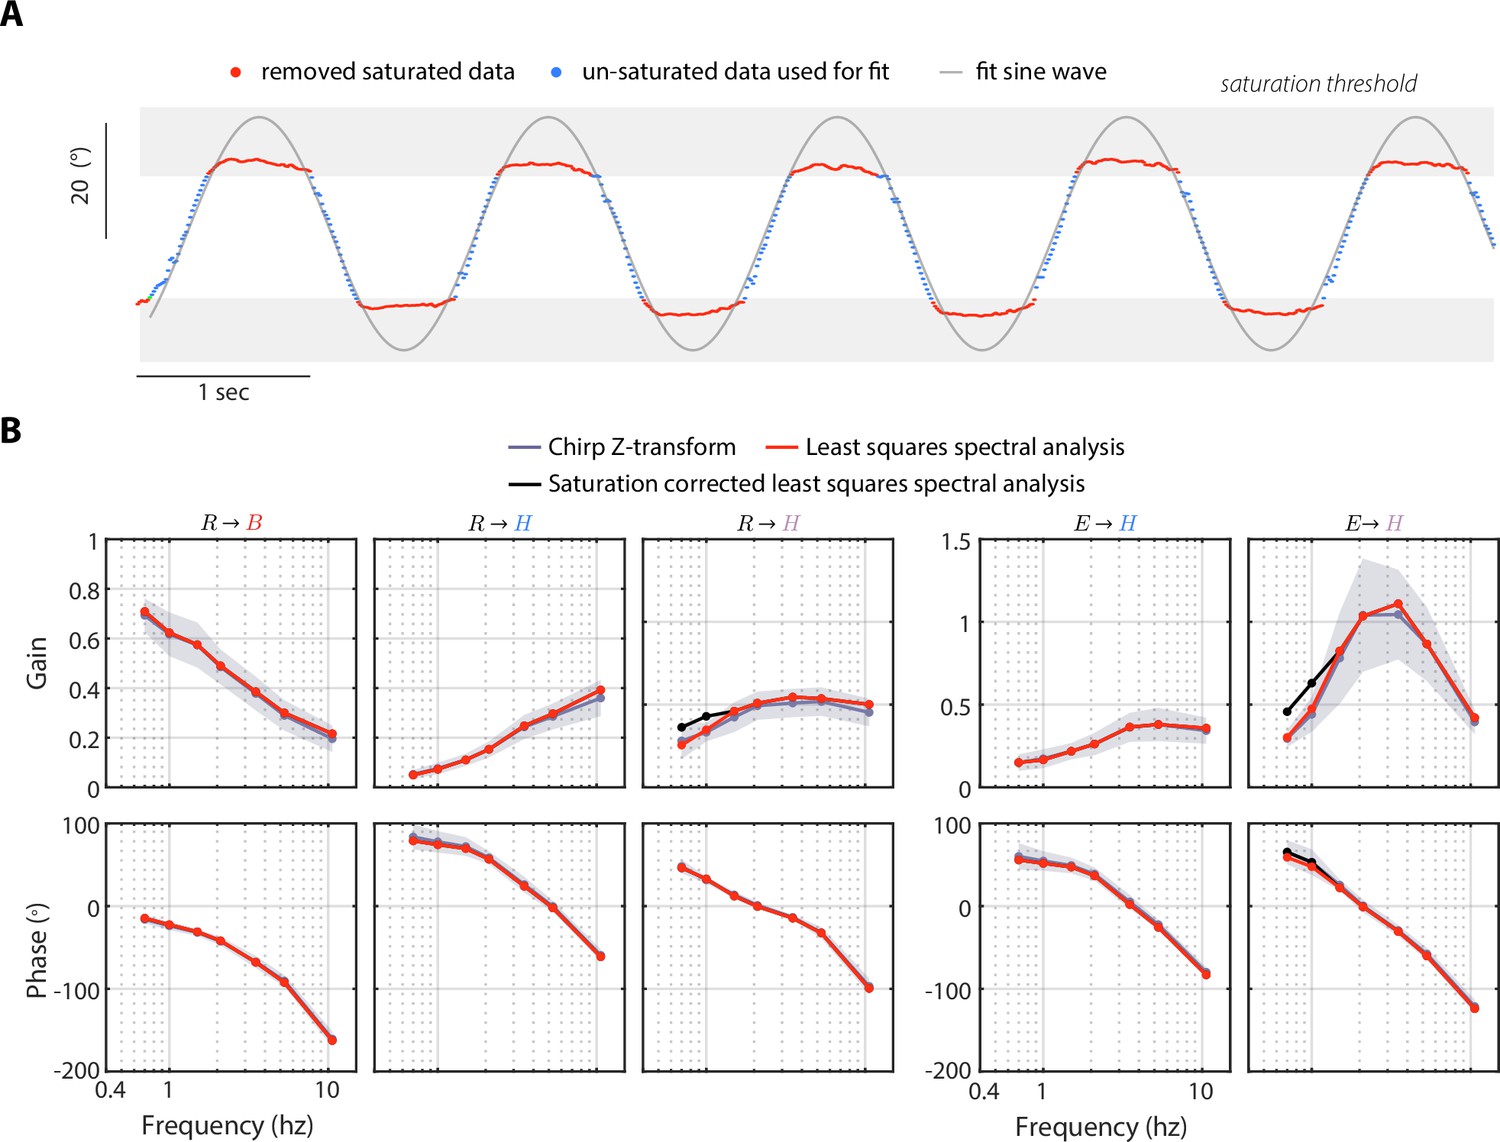
Saturation-corrected head response and LSSA sensitivity analysis.
(A) A saturation-correction routine applied to the mean head response of body-fixed flies at the 0.7 Hz perturbation frequency. We removed the saturated data points and fit a sine wave to the remaining data points (see Methods). (B) A comparison of three different system identification methods: (1) from a Chirp-Z Transform, (2) from least squares spectral analysis (LSSA), and (3) from LSSA applied to the saturation corrected data. We showed that the Chirp-Z Transform and LSSA methods yielded near-identical results, while saturation-correction only effected the lowest two frequencies of the body-fixed head transforms: (violet) and (violet), leading to a slight increase in gain. The transforms indicated above each plot correspond to the legends in Figures 4 and 5. We used the Chip-Z Transform for our analysis in Figures 4—6, but applied the LSSA saturation correction to the body-fixed head response at the lowest two frequencies. Shaded regions: ±1 STD. Body-free: flies, Body-fixed: flies.
Figure 3—video 1
Comparison of a body-free fly (magnetic tether, left) and body-fixed fly (rigid tether, right) head response to a 1 Hz sine wave visual perturbation.
The body-stabilized head view is shown below each raw video. Note that head movements are larger in the body-fixed fly.
Figure 3—video 2
Same as Figure 3—video 1 but for a 2.1 Hz visual perturbation.
Figure 3—video 3
Same as Figure 3—video 1 but for a 5.3 Hz visual perturbation.
Figure 3—video 4
Same as Figure 3—video 1 but for a sum-of-sines visual perturbation.
Figure 4 with 3 supplements
Visual and mechanosensory feedback mediate head control.
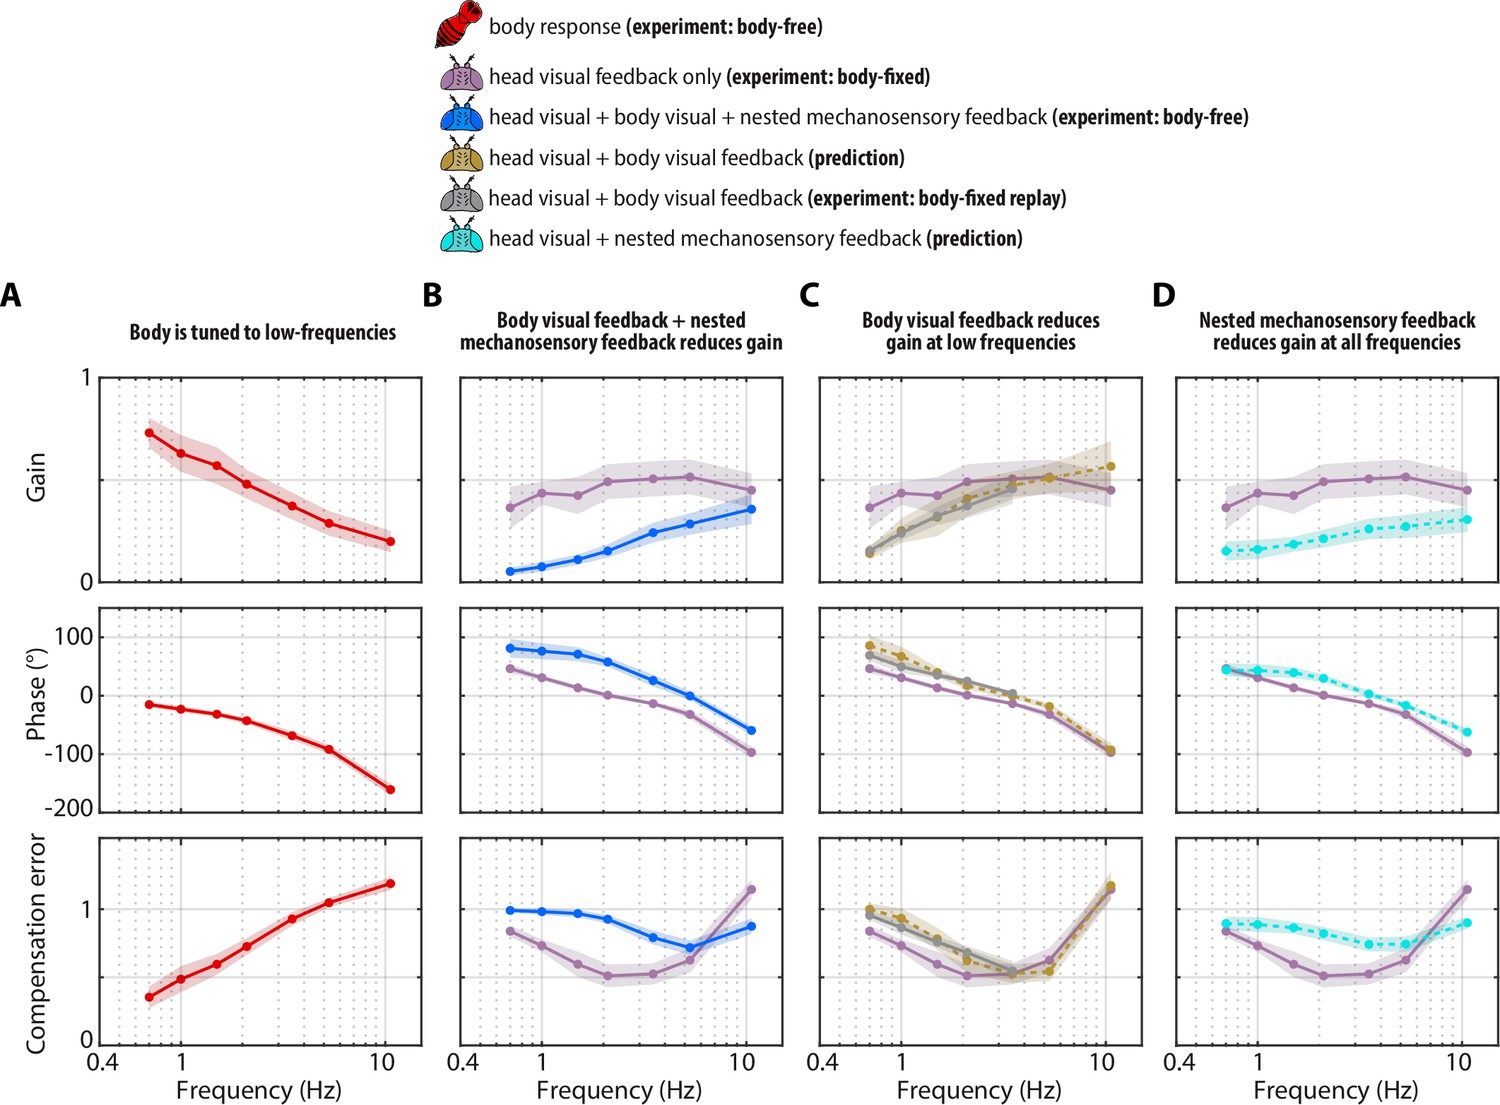
The legend indicates whether the data corresponds to the head or body, , the sources of sensory feedback, and the relevant experiment (or prediction). (A) The closed-loop transform from the visual perturbation to the body response . Note that the body is primarily tuned to low frequencies. (B) The closed-loop transform from the visual perturbation to the head response for different sensory feedback conditions. The head transform measured in body-free flies (blue) contains all three sources of feedback (see Equation 3), while the head transform measured in body-fixed flies (purple) contains only head visual feedback (see Equation 6). (C) The predicted (dashed line) transform for the head response with head and body visual feedback (copper, see Equation 7, corresponding to Figure 4—figure supplement 2A) and the experimentally measured equivalent from a ’replay’ experiment (grey, corresponding to Figure 4—figure supplement 2C-E). The highest two frequencies were omitted in the replay experiment due to limitations of our flight arena display system (see Materials and methods). (D) The predicted (dashed line) transform for the response with head visual feedback and body mechanosensory feedback (cyan, see Equation 8, corresponding to Figure 4—figure supplement 2B). Body-free: flies, Body-fixed: flies, Body-fixed replay: flies. For all panels, shaded regions: ±1 STD. Also see Figure 4—figure supplement 3 for all plots overlaid to facilitate comparison across groups.
Figure 4—figure supplement 1
Sum-of-sines transforms.
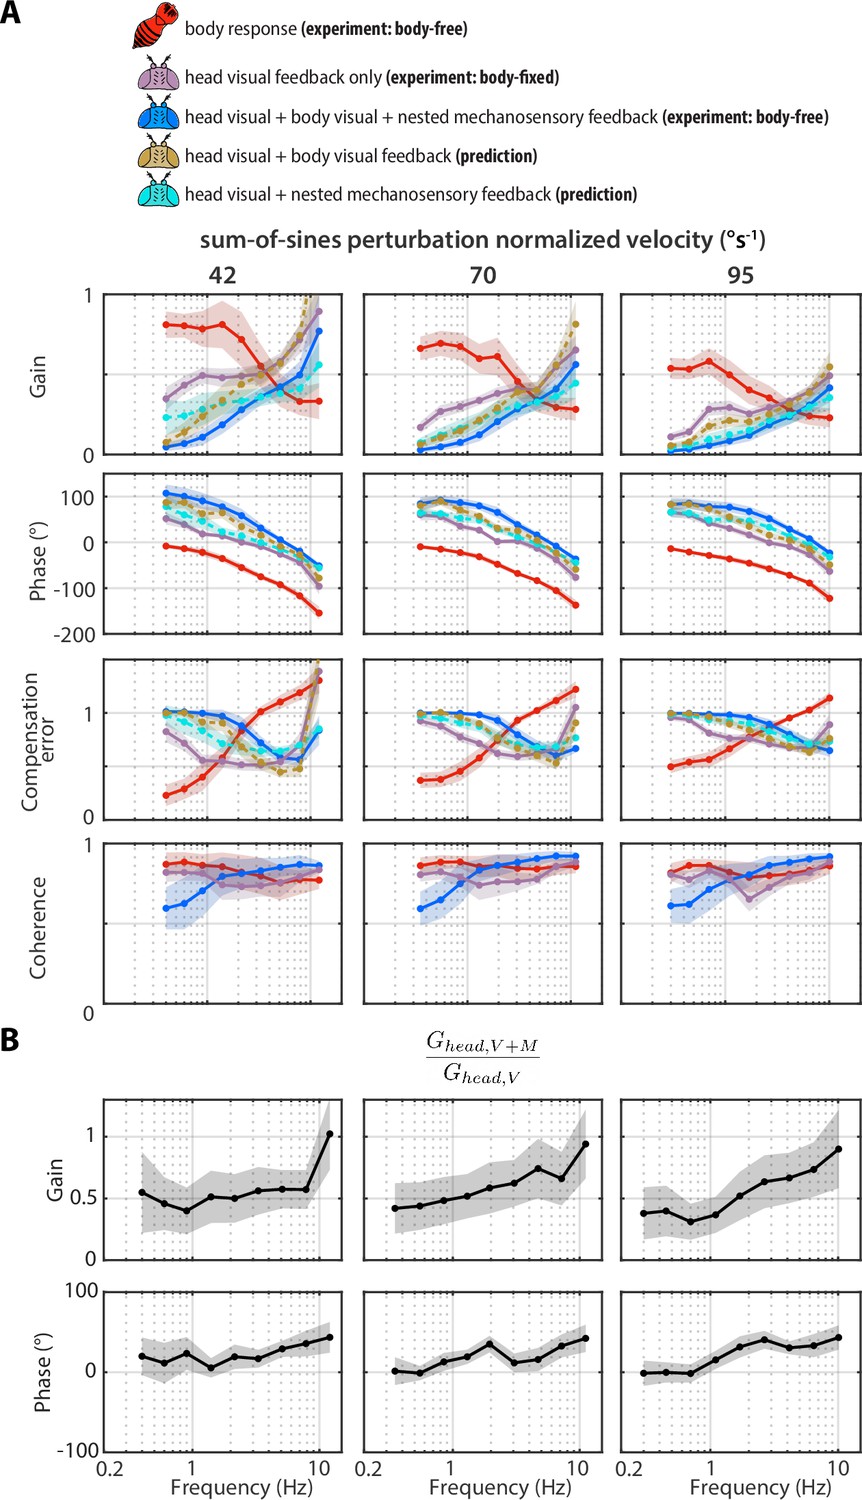
A Same as Figure 4 and Figure 4—figure supplement 3, but for sum-of-sines visual perturbations with different normalized velocities. (B) Same as Figure 5C but for the sum-of-sines perturbations. Shaded regions: ±1 STD. Body-free: flies, Body-fixed: flies.
Figure 4—figure supplement 2
Control diagrams and replay experiment for manipulations of sensory feedback.
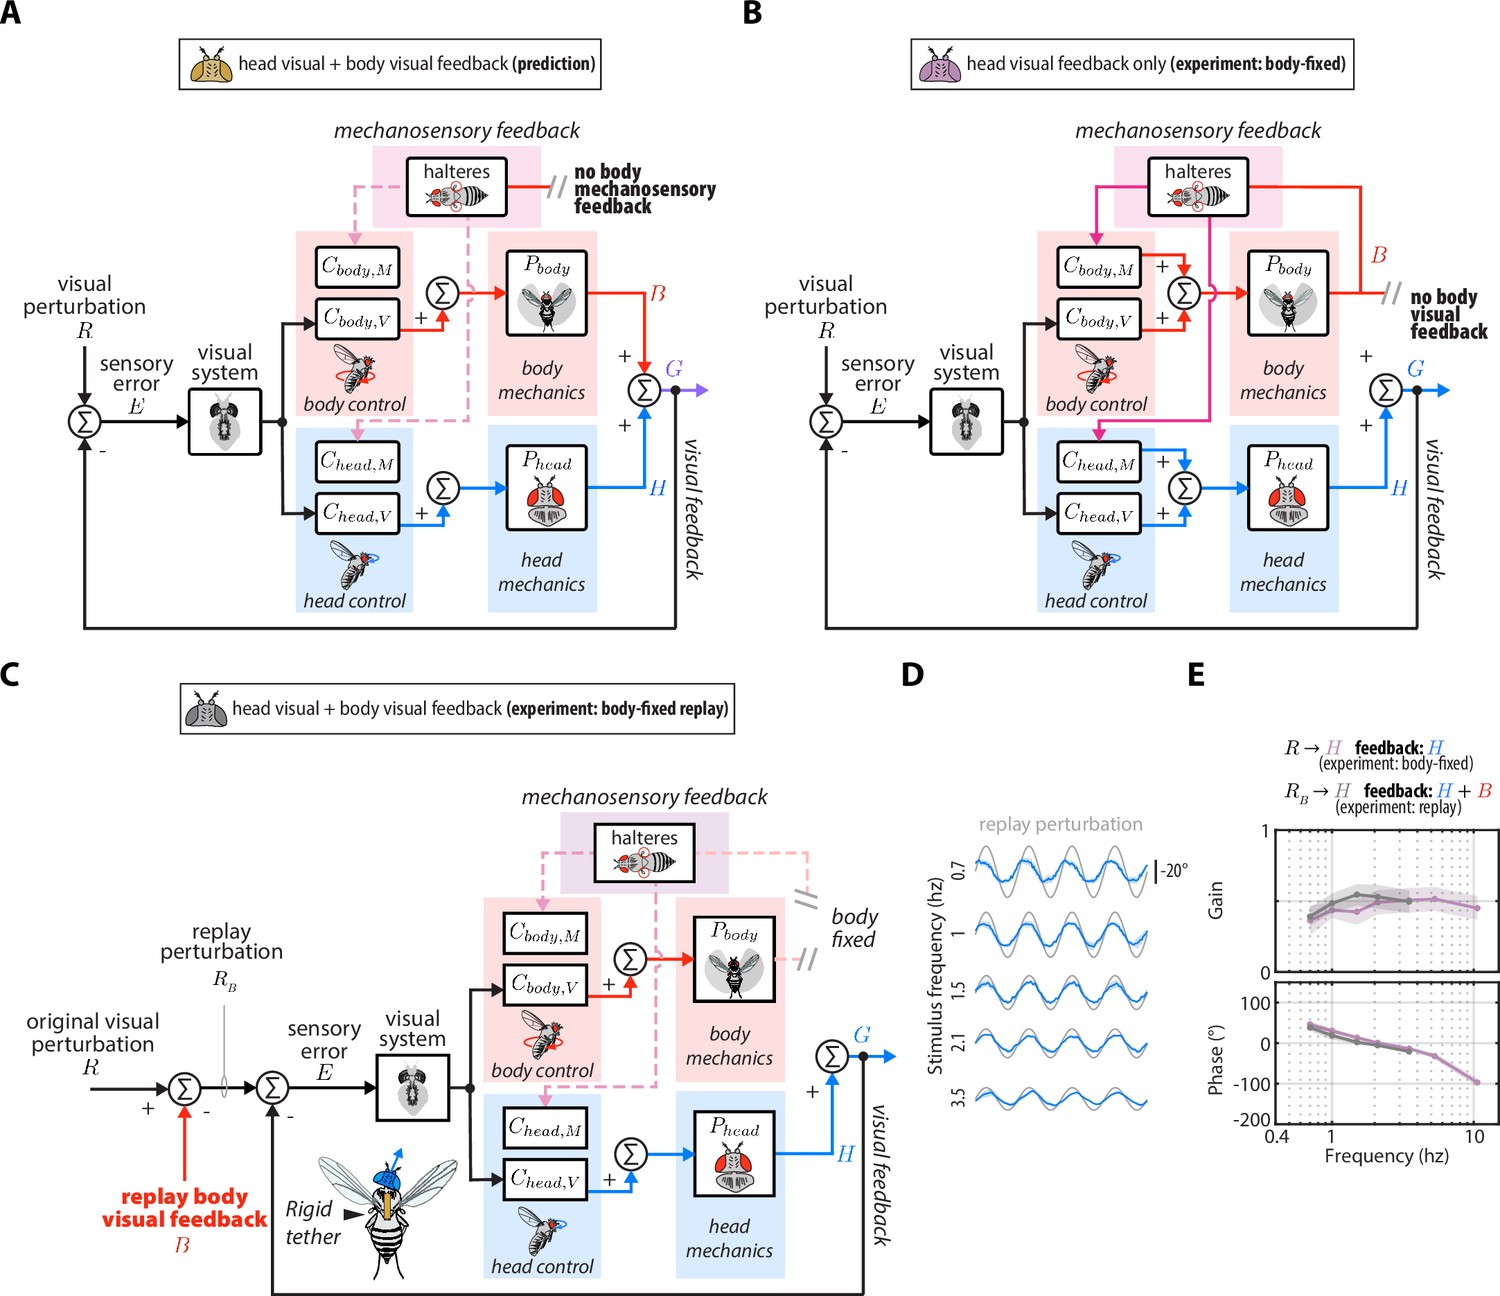
(A) Control diagram for the prediction of the head response with head and body visual feedback (corresponding to Equation 7). (B) Control diagram for the prediction of the head response with head visual feedback and body mechanosensory feedback (corresponding to Equation 8). (C) The experimental equivalent to (A). We reintroduced body visual feedback to body-fixed flies by ‘replaying’ the body response measured in the body-free flies. We subtracted the body response from the original visual perturbation to generated the replay perturbation . This allowed us to experimentally quantify the effects of head and body visual feedback without body mechanosensory feedback. (D) The head response (blue) to the replay perturbation (grey) across perturbation frequencies. (E) The head transform from to measured in the replay experiment (grey) compared to the head transform from to measured in the original experiment with body-fixed flies. These transforms should be approximately equal, assuming linear-time-invariant dynamics, which was the case. Shaded regions: ±1 STD. Body-fixed: flies, Body-fixed replay: flies. See Figure 4 and Figure 4—figure supplement 3 for experimental data corresponding to (A–C).
Figure 4—figure supplement 3
Overlaid transforms.
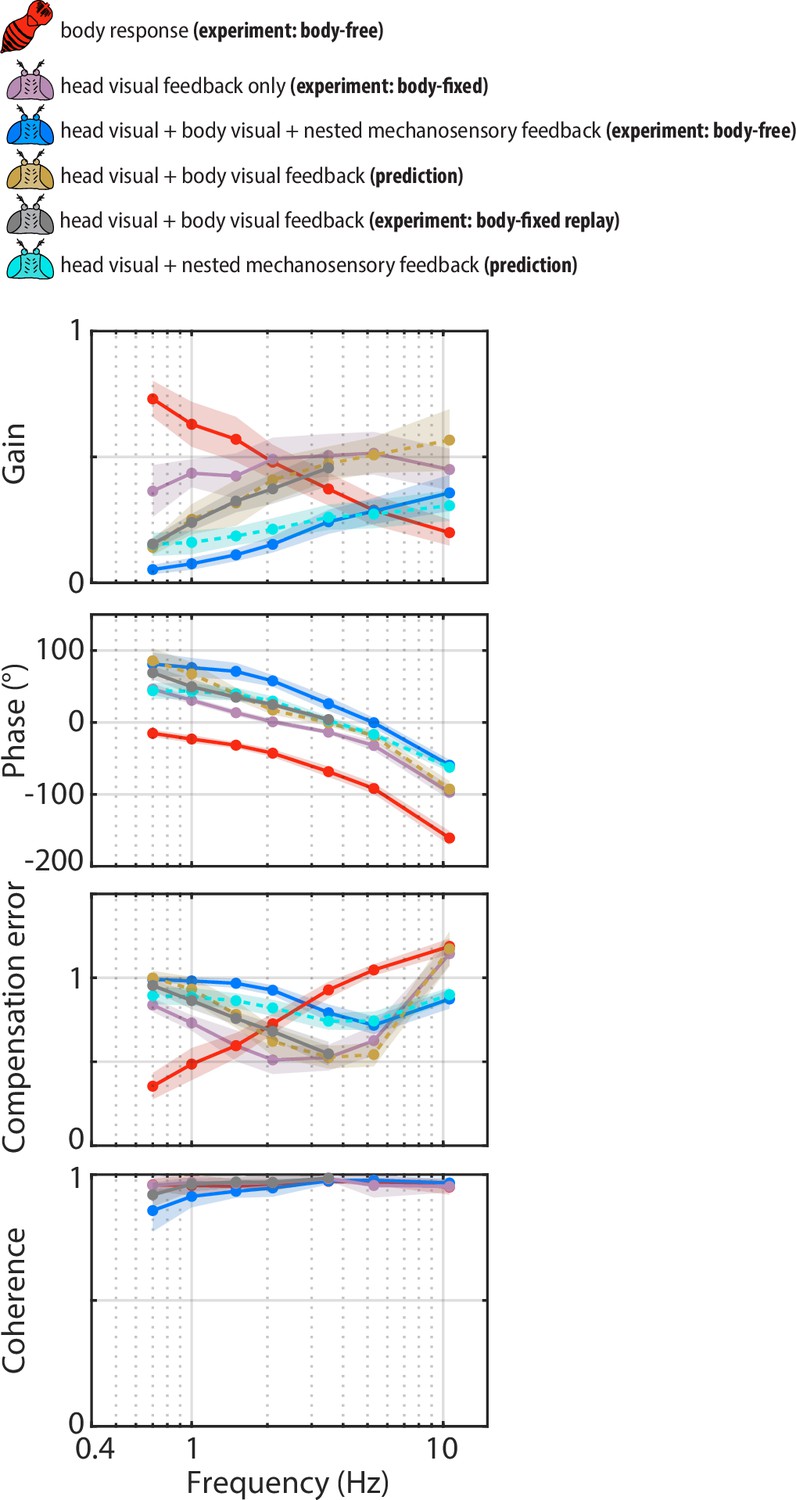
(A) Same as Figure 4, but with all transforms plotted on the same axes and the coherence of the experimentally measured responses. Shaded regions: ±1 STD. Body-free: flies, Body-fixed: flies, Body-fixed replay: flies.
Figure 5
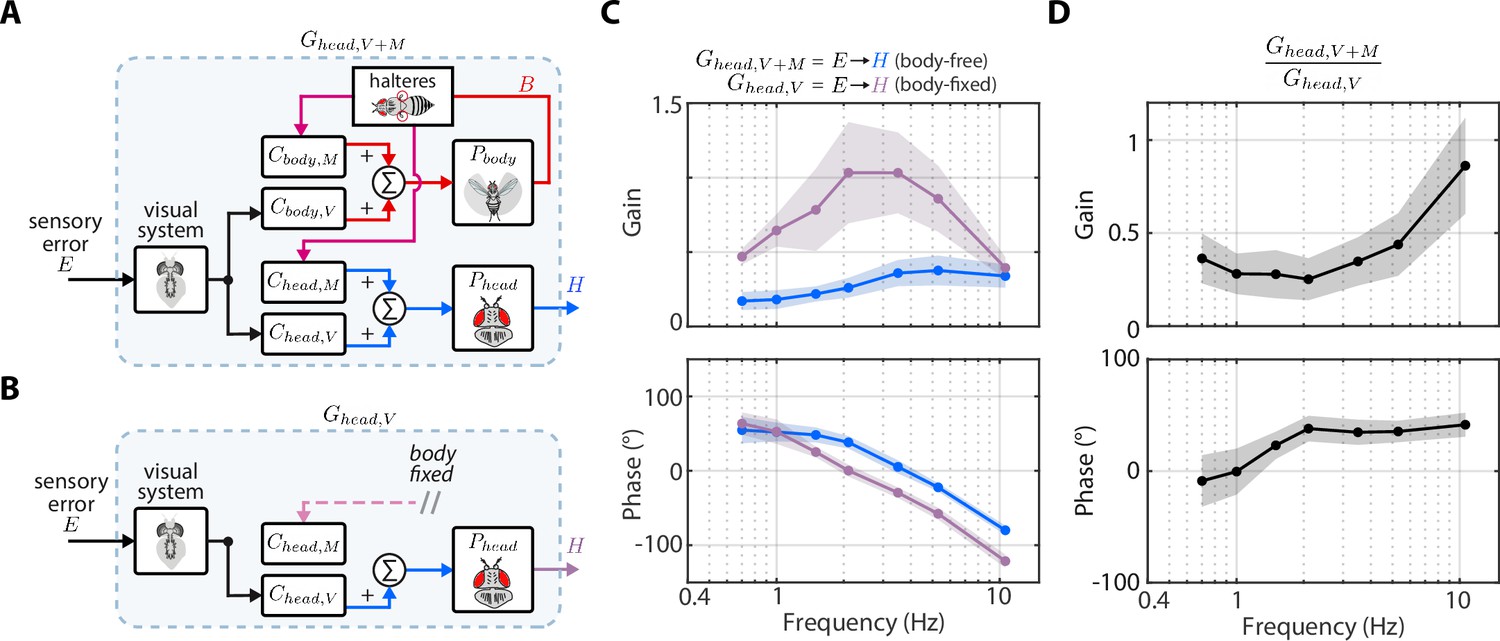
Nested mechanosensory feedback damps head movements.
(A) The control diagram of the sensory error to head transform in body-free flies. Note that this transform includes nested mechanosensory feedback from body motion. (B) The control diagram of the sensory error to head transform in body-fixed flies, which is simply the visual transform . (C) The gain and phase of the to transform for body-free (blue) and body-fixed (purple) flies. Shaded regions: ±1 STD (D) The ratio of the to transform in body-free and body-fixed flies (). If nested mechanosensory feedback from body motion had no effect, we would expect this ratio to have a gain of one and phase of 0 (dashed blue lines). The empirical data has a gain less than one, indicating the head movements are damped by nested mechanosensory feedback. Shaded regions: ±1 STD. Body-free: flies, Body-fixed: flies.
Figure 6 with 7 supplements
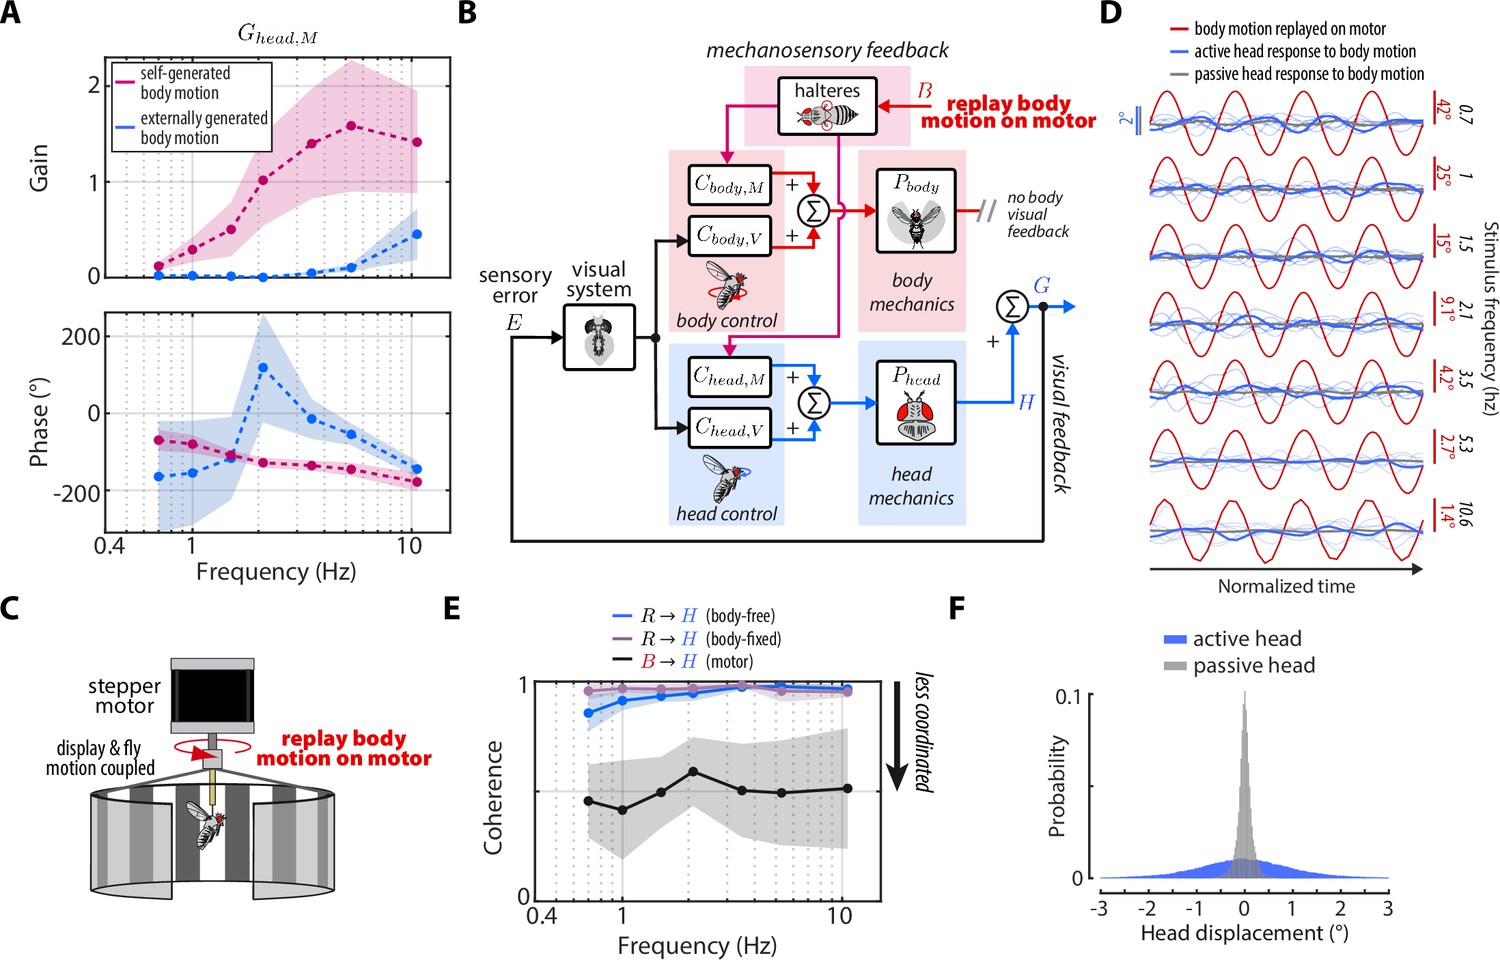
Head damping is present during self-generated but not externally generated body motion.
(A) The predicted transforms from body mechanosensory information to the head response for self-generated body motion (pink) and externally generated body motion (blue). Shaded regions: ±1 STD. (B) The control framework outlining how externally generated body motion influences head response via mechanosensory feedback. Note that head visual feedback is still present even if there is no external visual perturbation since the head is free to move. (C) Experimental equivalent to (B). Flies were mounted to the shaft of a stepper motor and the body motion measured in body-free flies was replayed on the motor. Note that the visual display was also mounted to the motor shaft, effectively removing body visual feedback, while leaving mechanosensory feedback intact. (D) The head response (blue) of flies during the experiment where body motion (red) was replayed on the motor. Thin blue lines show the response of individual flies. Thick grey line shows the mean passive head response of an anesthetized fly to the same replayed body motion. Also see Figure 6—figure supplement 1. (E) Coherence for the visual transform from to in body-free (blue) and body-fixed (violet) flies compared to the mechanosensory transform from to measured from the motor experiment. Note that the mechanosensory transform has much lower coherence, indicative of an uncoordinated response. Shaded regions: ±1 STD. (F) The distribution of all active head displacements (blue) compared to the distribution of all passive head displacements from the motor experiment (grey). Motor experiments: flies.
Figure 6—figure supplement 1
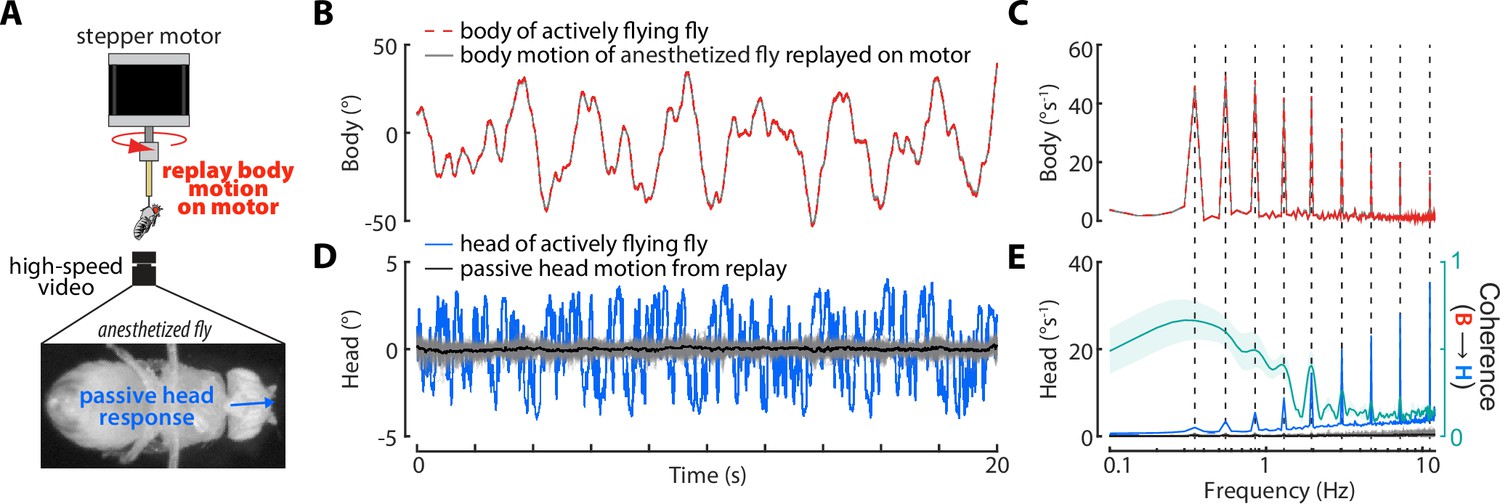
Passive head movements.
(A) Flies were anesthetized with triethylamine (commercially available as FlyNap, Carolina Biological Supply) and rigidly tethered to the shaft of a stepper motor (Nema 17). The body motion of actively flying flies in the magnetic tether was replayed on the motor and the passive (due to body motion alone) head motion was measure. (B) The mean body angular position of actively flying flies in the magnetic tether (red, same as Figure 3—figure supplement 1A) and the replayed body motion on the motor (grey, all trials shown but variance is small so it looks like one line). (C) Same as (B) but for the frequency domain (Chirp-Z Transform) of the body velocity. Dashed lines indicate the frequencies present in the sum-of-sine perturbation. (D) The head of actively flying flies in the magnetic tether (blue, same as Figure 3—figure supplement 1A) and the passive head response in anesthetized flies (all trials: grey, mean: black). (E) Same as (D) but for the frequency domain (Chirp-Z Transform) of the head velocity.The right y-axis (teal) indicates the coherence between the head and body of anesthetized flies (shaded region: ±1 STD). Note that very little passive head motion is elicited by body motion alone. flies, trials.
Figure 6—video 1
A fly was mounted on a motor and rotated about the vertical (yaw) axis such that the body angle matched that of a magnetically tethered fly in response to a 1 Hz sine wave visual perturbation (see Figure 3A and Figure 3—video 1).
Body visual feedback was removed by mounting the visual scene to the motor. The head response (right) of the same fly in the body-stabilized coordinate frame. Note that the head response was generally uncoordinated with body motion.
Figure 6—video 2
Same as Figure 6—video 1 but for a 2.1 Hz perturbation.
Figure 6—video 3
Same as Figure 6—video 1 but for a 5.3 Hz perturbation.
Figure 6—video 4
Same as Figure 6—video 1 but for an anesthetized fly.
Figure 6—video 5
Same as Figure 6—video 2 but for an anesthetized fly.
Figure 6—video 6
Same as Figure 6—video 3 but for an anesthetized fly.
Figure 7 with 2 supplements
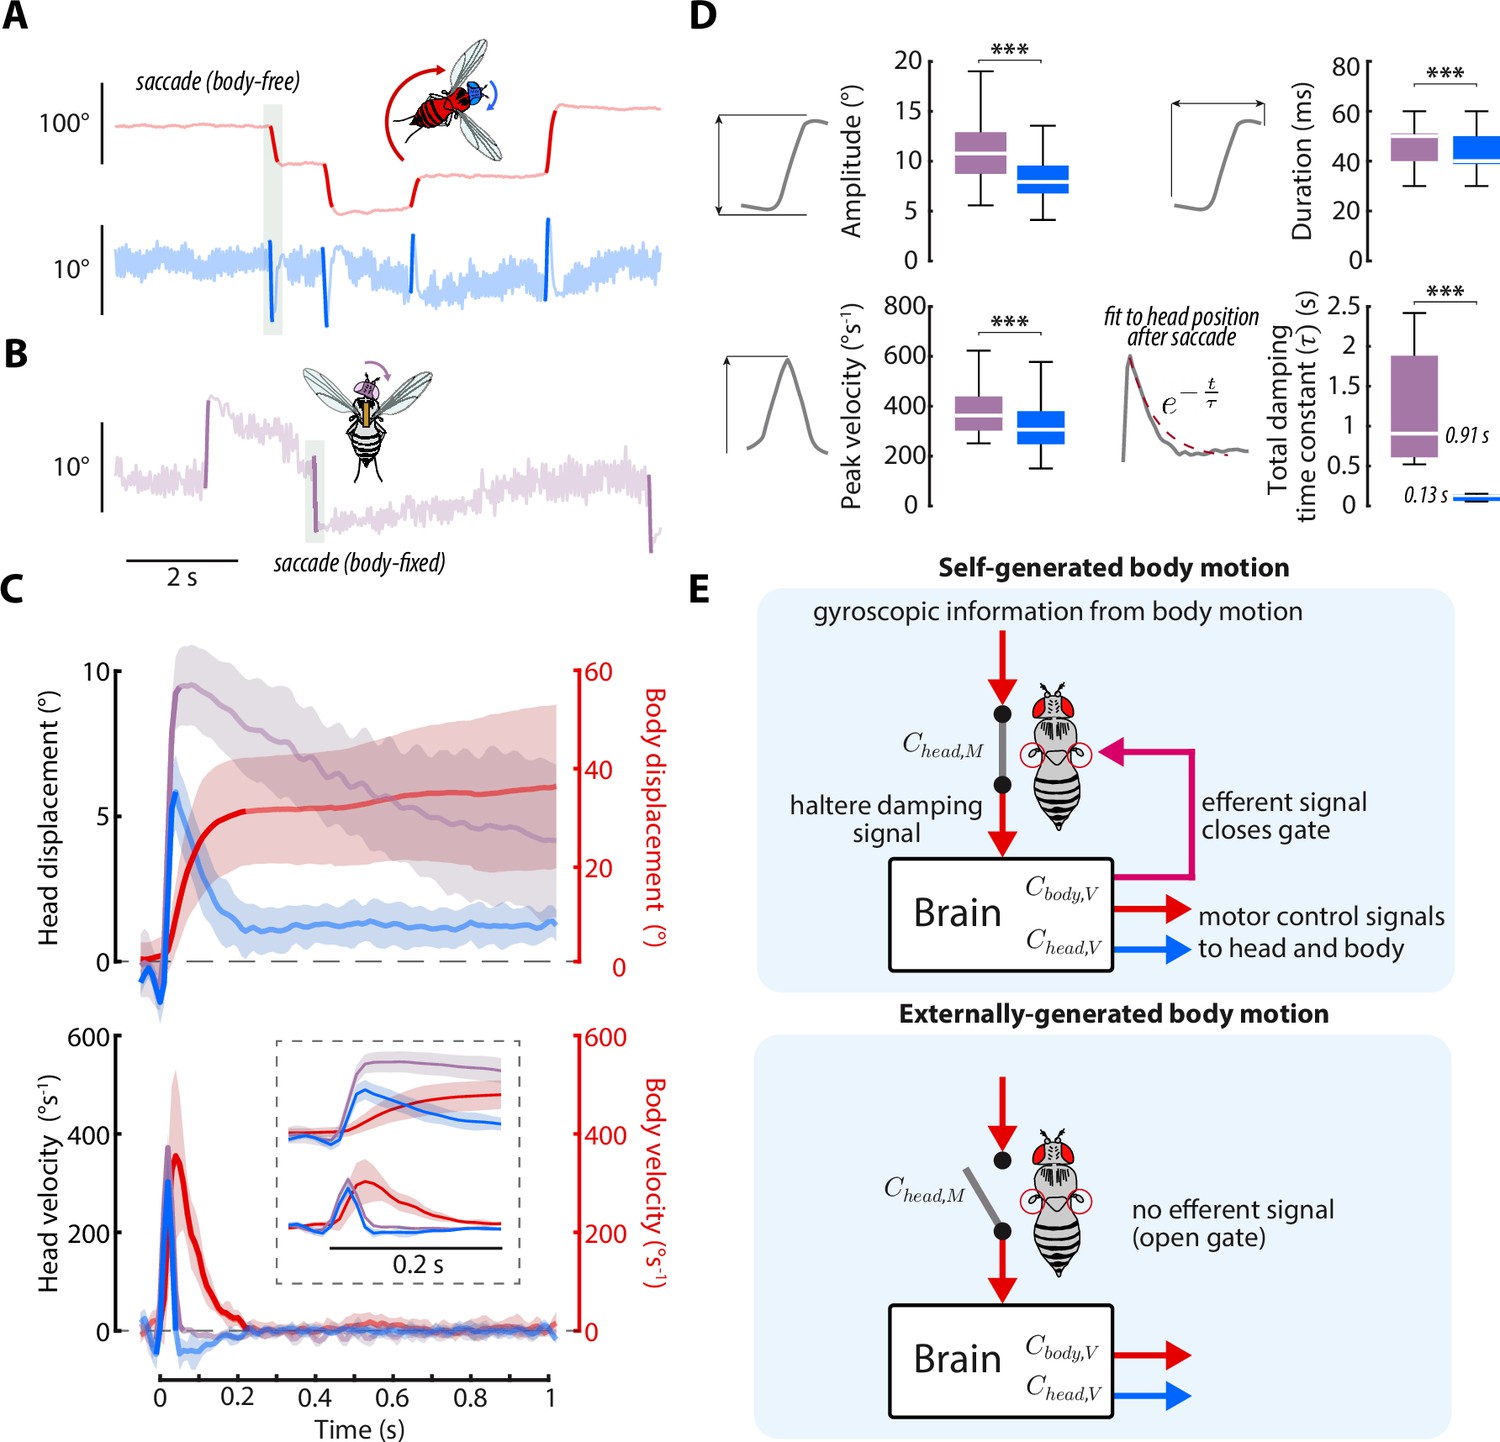
Head saccades are actively damped by mechanosensory feedback.
(A) Example body (red) and head (blue) trajectories for a body-free fly in the magnetic tether presented with a static visual stimulus. Rapid flight turns called saccades are highlighted. Note that head saccades are followed by a head movement that returns the head to the center position. Also see Figure 7—video 1. (B) Same as A) but for a body-fixed fly. Head movements are shown in purple. Note that head saccades are not followed by a return head movement. (C) Left y-axis: averaged head saccade displacement (top) and velocity (bottom) for body-free and body-fixed flies. Right y-axis: averaged body saccade displacement (top) and velocity (bottom). Note that saccades typically last less than 200ms (bold portion of head and body trajectories indicate saccades), but an extra second of data is shown to illustrate the difference between the body-free and body-fixed head movements after a saccade. Inset shows the first 200ms of head and body trajectories. Shaded regions: ±1 STD. (D) Distributions of head saccade amplitude, peak velocity, duration, and damping time constant. The damping time constant was computed by fitting a decaying exponential to the head response directly after a saccade. ***Wilcoxon rank sum and t-test, p < 0.001. Body-free: flies, saccades, Body-fixed: flies, saccades. (E) Proposed neural architecture for haltere-related damping of head movements for self-generated vs. externally-generated body motion. When body motion is self-generated, head and body motor commands are sent in parallel with an efferent signal, effectively closing a gate that allows mechanosensory feedback due to body motion to damp head movements. When body motion is externally generated, this gate is open and body motion has little effect on head movements (Figure 6A and (D).
Figure 7—figure supplement 1
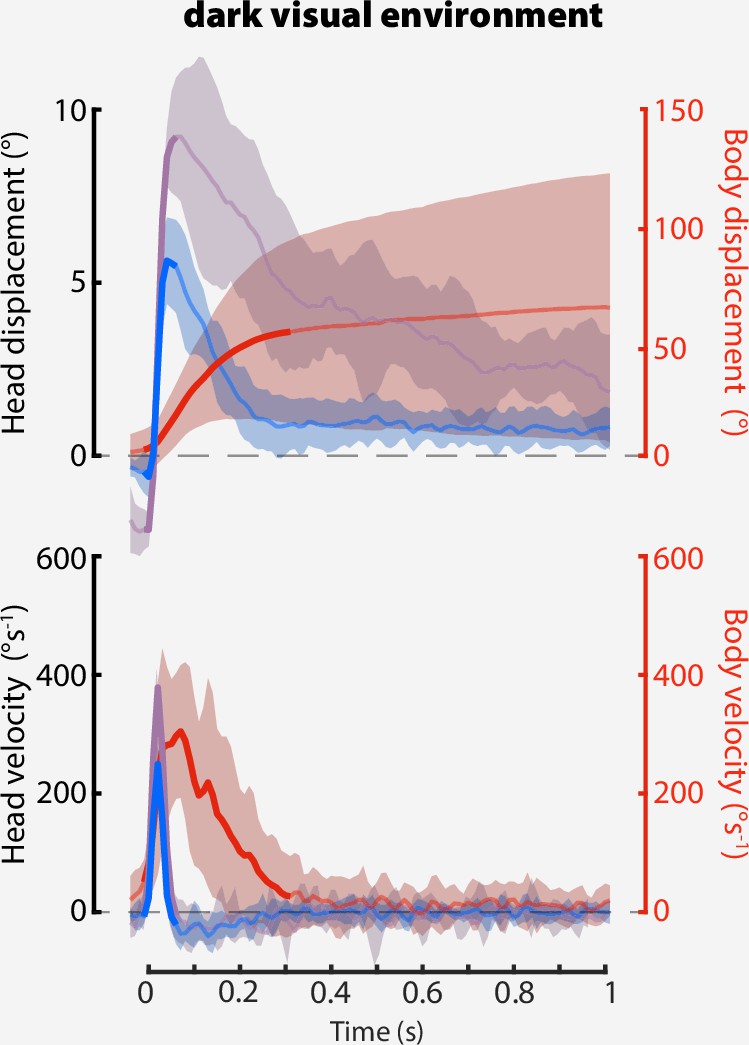
Head saccades in darkness.
A Same as Figure 7D, but for a dark visual environment. Shaded regions: ±1 STD. Body-free: flies, saccades. Body-fixed: flies, saccades.
Figure 7—video 1
A body-free fly (magnetic tether) presented with a static visual background performing simultaneous body and head saccades.
The left video shows the raw images and the right video shows the images in the body-stabilized coordinate frame. See Cellini et al., 2021 for videos of saccades in body-fixed flies (Cellini et al., 2021).
Author response image 1
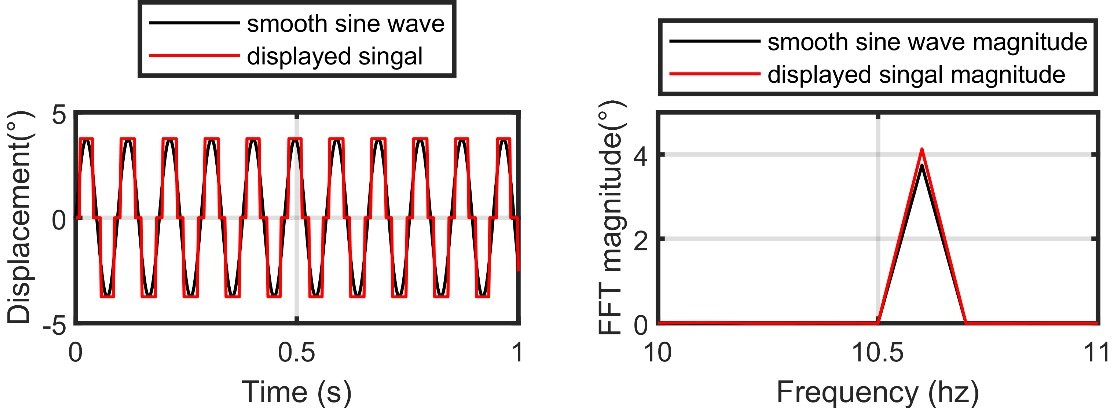
Left: the idealized smooth sine wave at the highest frequency designed for our flight simulator (black) vs the actual displayed signal (red).
Note that our flight simulator display has an angular resolution of 3.75°. Right: same as the left, but for the Fast-Fourier Transform (FFT) magnitude of the two signals.
Additional files
Download links
A two-part list of links to download the article, or parts of the article, in various formats.
Downloads (link to download the article as PDF)
Open citations (links to open the citations from this article in various online reference manager services)
Cite this article (links to download the citations from this article in formats compatible with various reference manager tools)
Nested mechanosensory feedback actively damps visually guided head movements in Drosophila
eLife 11:e80880.
https://doi.org/10.7554/eLife.80880


