The injured sciatic nerve atlas (iSNAT), insights into the cellular and molecular basis of neural tissue degeneration and regeneration
- Department of Cell and Developmental Biology, University of Michigan-Ann Arbor, United States
- Neuroscience Graduate Program, University of Michigan–Ann Arbor, United States
- Kresge Hearing Institute, University of Michigan–Ann Arbor, United States
- Departments of Psychiatry and Neurology, University of California, Los Angeles, United States
- Department of Neurosurgery, University of Michigan-Ann Arbor, United States
- Department of Biological Sciences, University of South Carolina, United States
- Department of Neurology, Program in Neurogenetics, David Geffen School of Medicine, University of California, Los Angeles, United States
- Department of Human Genetics,David Geffen School of Medicine, University of California, Los Angeles, United States
- Institute of Precision Health, University of California, Los Angeles, United States
- Department of Neurology, University of Michigan–Ann Arbor, United States
Figures
Figure 1 with 3 supplements

The cellular and molecular landscape of naïve mouse sciatic nerve.
(A) Schematic of workflow for peripheral nervous tissue analysis. Cartoon of a mouse spinal cord, lumbar dorsal root ganglia (DRGs), and sciatic nerve trunk with main branches. The nerve segment marked with a red bracket was harvested for further analysis. Immune cells were captured with anti-CD45 conjugated magnetic beads. The flow through, containing non-immune (CD45-) cells, was collected as well. In separate scRNAseq runs, CD45+ and CD45- single-cell transcriptomes were determined. A total of 21,973 high-quality transcriptomes, including 4539 CD45+ cells and 17,434 CD45- cells were generated and used for downstream analysis. (B) UMAP embedding of naïve sciatic nerve cells. Unsupervised Seurat-based clustering identified 24 clusters. (C) List of cell types identified in the naïve sciatic nerve, grouped into immune cells (clusters 0–7), structural/stromal cells (clusters 8–16), cells associated with the nerve vasculature (clusters 17–22), and Schwann cells (clusters 23 and 24). (D–L) Feature plots of scRNAseq data showing expression of canonical markers used for assignment of major cell types, including epineurial fibroblasts (Pcolce2/procollagen C-endopeptidase enhancer 2), endoneurial MES (Cdkn2a/cyclin dependent kinase inhibitor 2A), perineurial MES (Cldn1/claudin-1), endothelial cells (Pecam1/CD31), vascular smooth muscle cells and pericytes (Notch3/notch receptor 3), Schwann cells (Sox10/SRY-box transcription factor 10), epineurial Mac (Ccl8/C-C motif chemokine ligand 8), endoneurial Mac (Cx3cr1/C-X3-C motif chemokine receptor 1), and dendritic cells (Napsa/napsin A, aspartic peptidase). Expression levels are color coded and calibrated to average gene expression.
Figure 1—figure supplement 1
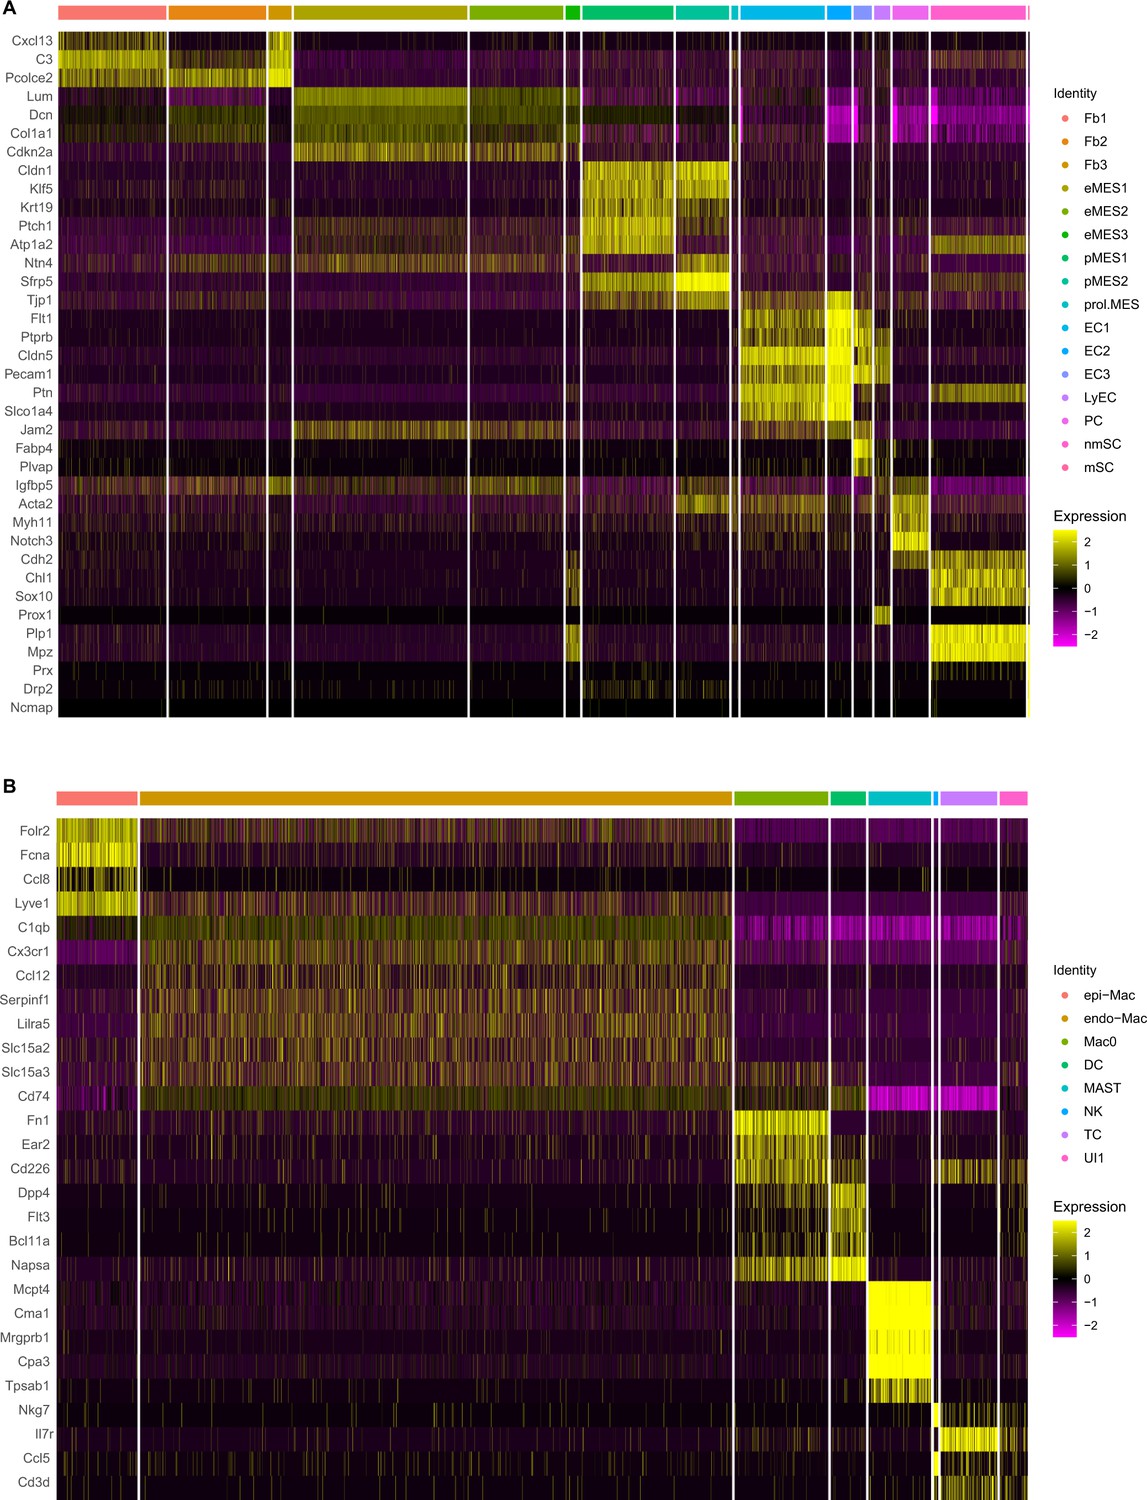
Cell-type-enriched gene products in the naïve mouse sciatic nerve.
Heatmaps of top cluster-enriched gene products. (A) Nonimmune cells (CD45 negative) include Fb, fibroblasts; eMES, endoneurial mesenchymal cells; pMES, perineurial mesenchymal cells; prol.MES, proliferating mesenchymal cells; EC, endothelial cells; LyEC, lymphatic endothelial cells; PC, pericytes; nmSC, non-myelinating Schwann cells; mSC, myelinating Schwann cells. (B) Nerve resident immune cells (CD45 positive) include epiMac, epineurial macrophages; endoMac, endoneurial macrophages; Mac0, macrophages expressing high levels of fibronectin (Fn1); DC, dendritic cells; MAST, mast cells; NK, natural killer cells; TC, T cells; and UI, unidentified cells. Expression levels are calibrated to median gene expression.
-
Figure 1—figure supplement 1—source data 1
X-ray films of cytokine ELISA membranes probed with serum or sicatic nerve lysate of naive mice.
- https://cdn.elifesciences.org/articles/80881/elife-80881-fig1-figsupp1-data1-v2.zip
Figure 1—figure supplement 2
Markers for nerve resident macrophages.
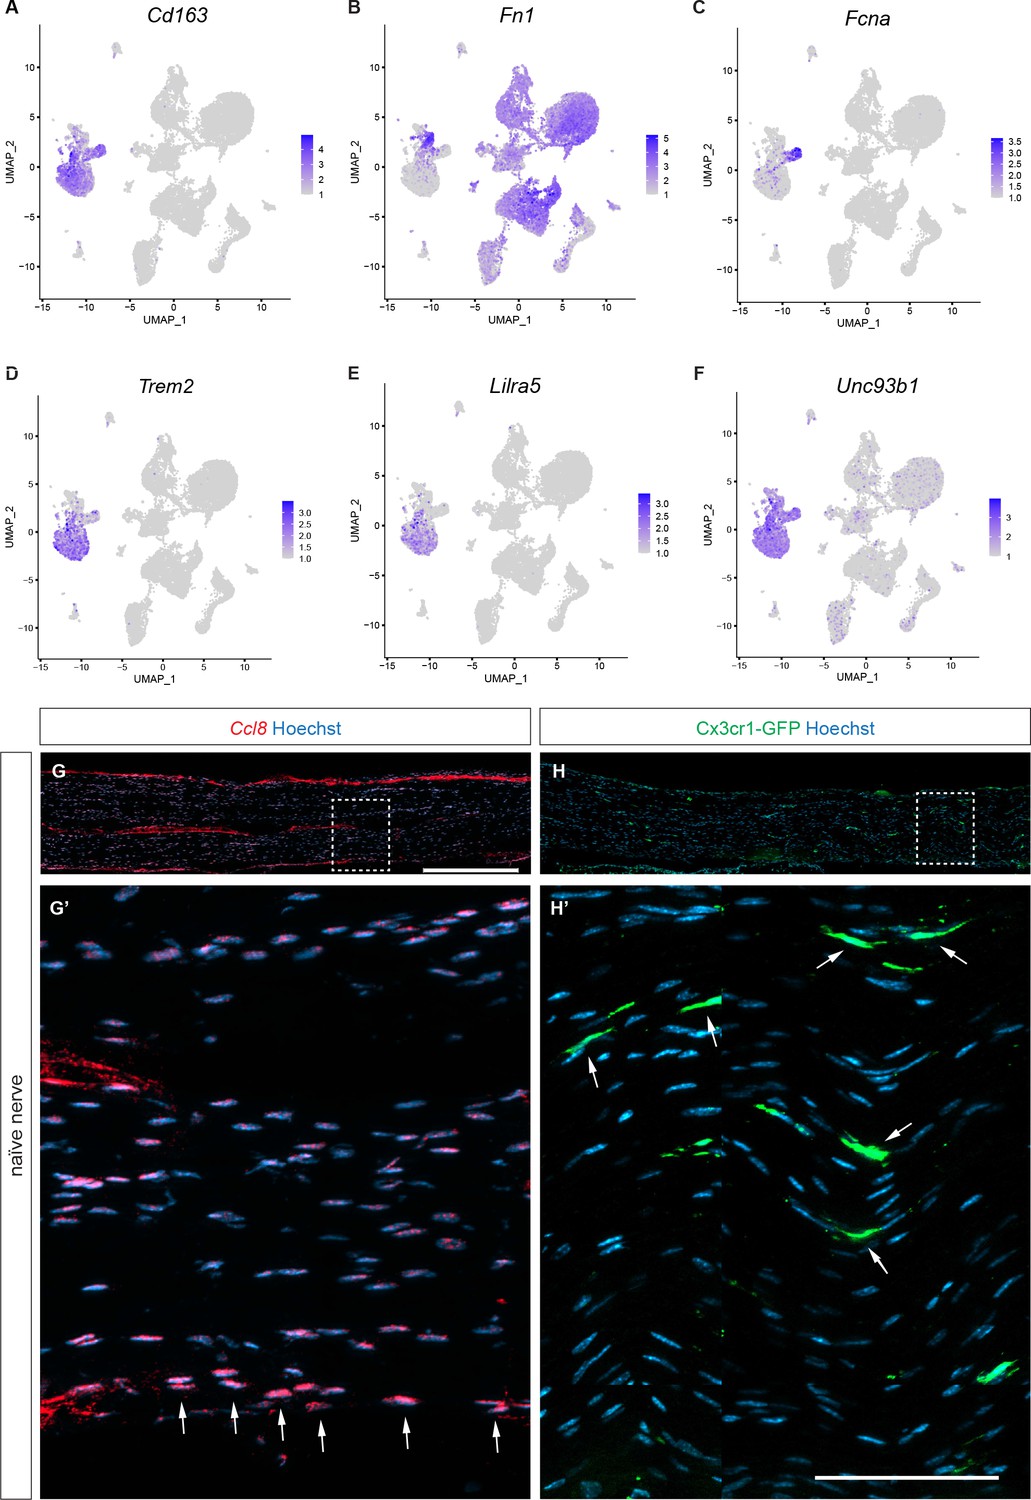
(A–F) Feature plots of naïve mouse sciatic nerve resident macrophages. (A) Cd163 (scavenger receptor cysteine-rich 1 protein M130) is expressed by epi-Mac and endo-Mac. (B) A small subpopulation of Mac (Mac0) expresses high levels of Fn1 (fibronectin). (C) Fcna (Ficolin A) is selectively expressed by epi-Mac. (D–F) Expression of the Mac markers Trem2 (triggering receptor expressed on myeloid cells 2), Lilra5 (leukocyte immunoglobulin like receptor A5), and Unc93b1 (Unc-93 homolog B1) a Toll-like receptor signaling regulator. Expression levels are projected onto UMAP with a minimum expression cutoff of 1. (G, G’) Longitudinal sections of naïve mouse sciatic nerve. In situ hybridization of Ccl8 transcripts with RNAscope revealed preferential staining of epi-Mac, labeled with arrows. (H, H’) Longitudinal sciatic nerve section of Cx3cr1-GFP reporter mice revealed preferential labeling of endo-Mac, labeled with arrows. Scale bar (G, H), 500 µm; (G’,H’), 75 µm.
Figure 1—figure supplement 3
Validation of naïve nerve scRNAseq dataset by ELISA.
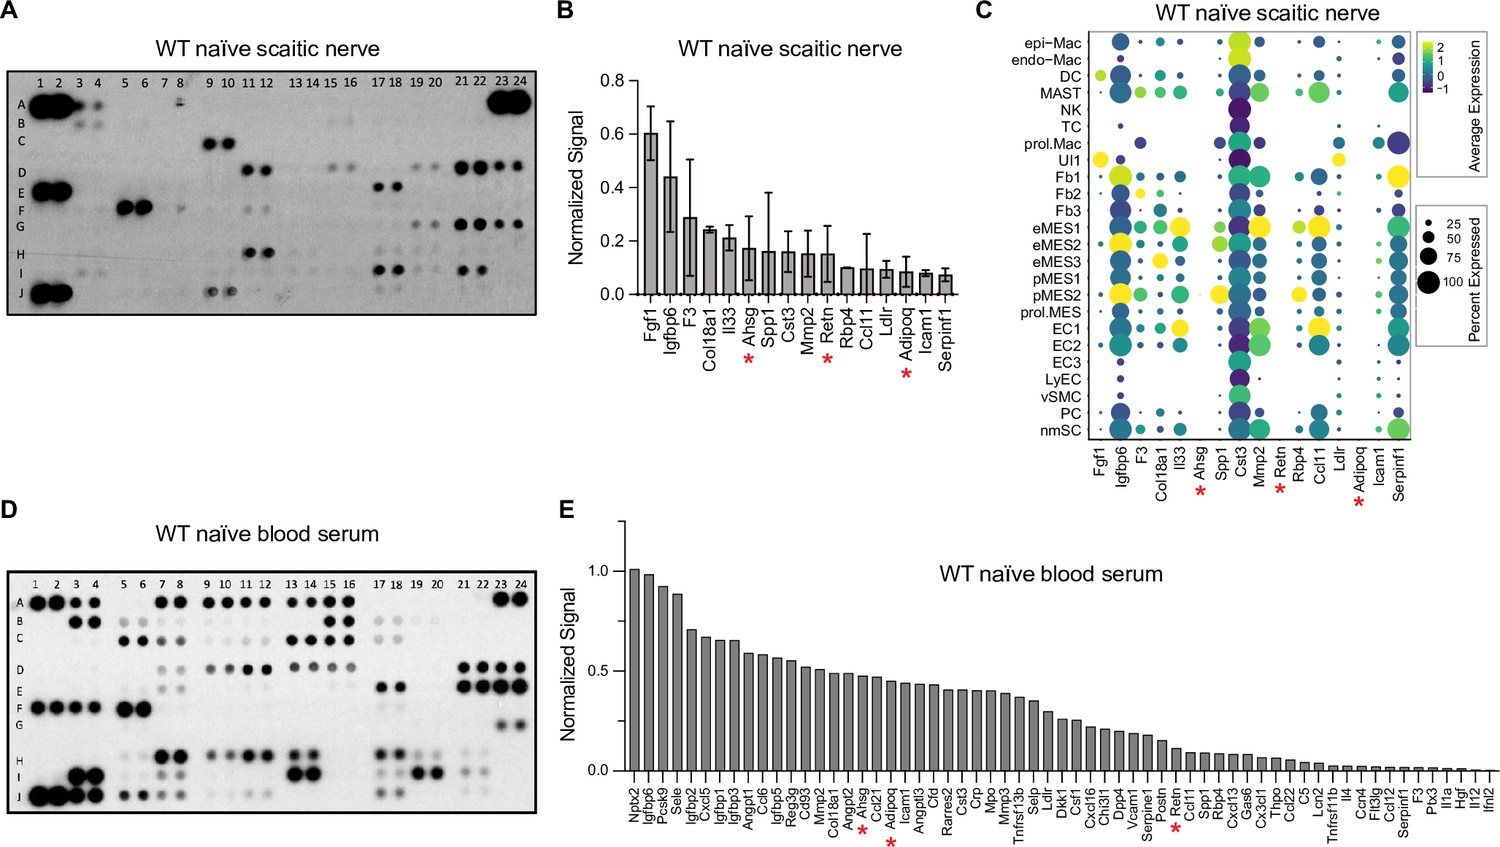
(A) ELISA membranes probed with naïve sciatic nerve lysate, n = 2 biological replicates. (B) List of abundantly detected proteins. For quantification, ELISA signals were averaged and normalized to reference spots shown at coordinates (A1, A2), (A23, A24), and (J1, J2). (C) Dotplot analysis of the corresponding gene products, using scRNAseq datasets of naïve sciatic nerve. Relative expression levels, normalized to average gene expression (color coded) are shown. For each cell cluster, the percentile of cells expressing a specific gene product is indicated by the dot size. Gene products marked with a red asterisk are detected at the protein level but not at the transcriptional level, n = 1 biological replicate (D) ELISA membrane probed with serum from naïve mice. (E) List of top serum proteins detected by ELISA. For quantification, ELISA signals were normalized to reference spots shown at coordinates (A1, A2), (A23, A24), and (J1, J2). Coordinates of proteins detected by the ELISA: (A1, A2) Reference spots, (A3, A4) Adiponectin [Adipoq], (A5, A6) Amphiregulin [Areg], (A7, A8) Angiopoientin-1 [Angpt1], (A9, A10) Angiopoientin-2 [Angpt2], (A11, A12) Angiopoientin-like 3 [Angptl3], (A13, A14) BAFF [Tnfrsf13b], (A15, A16) C1qR1 [Cd93], (A17, A18) CCL2 [Ccl2], (A19, A20) CCL3 [Ccl3], (A21, A22) CCL5 [Ccl5], (A23, A24) Reference spots, (B3, B4) CCL6 [Ccl6], (B5, B6) CCL11 [Ccl11], (B7, B8) CCL12 [Ccl12], (B9, B10) CCL17 [Ccl17], (B11, B12) CCL19 [Ccl19], (B13, B14) CCL20 [Ccl20], (B15, B16) CCL21 [Ccl21], (B17, B18) CCL22 [Ccl22], (B19, B20) CD14 [Cd14], (B21, B22) CD40 [Cd40], (C3, C4) CD160 [Cd160], (C5, C6) Chemerin [Rarres2], (C7, C8) Chitinase 3-like 1 [Chil3], (C9, C10) Coagulation Factor III [F3], (C11, C12) Complement Component C5 [C5], (C13, C14) Complement Factor D [Cfd], (C15, C16) C-Reactive Protein [Crp], (C17, C18) CX3CL1 [Cx3cl1], (C19, C20) CXCL1 [Cxcl1], (C21, C22) CXCL2 [Cxcl2], (D1, D2) CXCL9 [Cxcl9], (D3, D4) CXCL10 [Cxcl10], (D5, D6) CXCL11 [Cxcl11], (D7, D8) CXCL13 [Cxcl13], (D9, D10) CXCL16 [Cxcl16], (D11, D12) Cystatin C [Cst3], (D13, D14) DKK-1 [Dkk1], (D15, D16) DPPIV [Dpp4], (D17, D18) EGF [Egf], (D19, D20) Endoglin [Eng], (D21, D22) Endostatin [Col18a1], (D23, D24) Fetuin A [Ahsg], (E1, E2) FGF acidic [Fgf1], (E3, E4) FGF-21 [Fgf21], (E5, E6) Flt-3 Ligand [Flt3l], (E7, E8) Gas 6 [Gas6], (E9, E10) G-CSF [Csf3], (E11, E12) GDF-15 [Gdf15], (E13, E14) GM-CSF [Csf2], (E15, E16) HGF [Hgf], (E17, E18) ICAM-1 [Icam1], (E19, E20) IFN-gamma [Ifng], (E21, E22) IGFBP-1 [Igfbp1], (E23, E24) IGFBP-2 [Igfbp2], (F1, F2) IGFBP-3 [Igfbp3], (F3, F4) IGFBP-5 [Igfbp5], (F5, F6) IGFBP-6 [Igfbp6], (F7, F8) IL-1alpha [Il1a], (F9, F10) IL-1Beta [Il1b], (F11, F12) IL-1ra [Il1rn], (F13, F14) IL-2 [Il2], (F15, F16) IL-3 [Il3], (F17, F18) IL-4 [Il4], (F19, F20) IL-5 [Il5], (F21, F22) IL-6 [Il6], (F23, F24) IL-7 [Il7], (G1, G2) IL-10 [Il10], (G3, G4) IL-11 [Il11], (G5, G6) IL-12 p40 [Il12], (G7, G8) IL-13 [Il13], (G9, G10) IL-15 [Il15], (G11, G12) IL-17A [Il17a], (G13, G14) IL-22 [Il22], (G15, G16) IL-23 [Il23], (G17, G18) IL-27 p28 [Il27], (G19, G20) IL-28 [Ifnl3], (G21, G22) IL-33 [Il33], (G23, G24) LDL R [Ldlr], (H1, H2) Leptin [Lep], (H3, H4) LIF [Lif], (H5, H6) Lipocalin-2 [Lcn2], (H7, H8) LIX [Cxcl5], (H9, H10) M-CSF [Csf1], (H11, H12) MMP-2 [Mmp2], (H13, H14) MMP-3 [Mmp3], (H15, H16) MMP-9 [Mmp9], (H17, H18) Myeloperoxidase [Mpo], (H19, H20) Osteopontin [Spp1], (H21, H22) Osteoprotegerin [Tnfrsf11b], (H23, H24) PD-ECGF [Tymp], (I1, I2) PDGF-BB [Pdgfb], (I3, I4) Pentraxin 2 [Nptx2], (I5, I6) Pentraxin 3 [Ptx3], (I7, I8) Periostin [Postn], (I9, I10) Pref-1 [Dlk1], (I11, I12) Proliferin [Prl2c2], (I13, I14) Proprotein Convertase 9 [Pcsk9], (I15, I16) RAGE [Ager], (I17, I18) RBP4 [Rbp4], (I19, I20) Reg3G [Reg3g], (I21, I22) Resistin [Retn], (J1, J2) Reference spots, (J3, J4) E-Selectin [Sele], (J5, J6) P-Selectin [Selp], (J7, J8) Serpin E1 [Serpine1], (J9, J10) Serpin F1 [Serpinf1], (J11, J12) Thrombopoietin [Thpo], (J13, J14) TIM-1 [Havcr1], (J15, J16) TNF-alpha [Tnf], (J17, J18) VCAM-1 [Vcam1], (J19, J20) VEGF [Vegf], (J21, J22) WISP-1 [Ccn4], (J23, J24) negative control.
Figure 2 with 3 supplements
Longitudinal analysis of single-cell transcriptomes of injured peripheral nervous system (PNS).
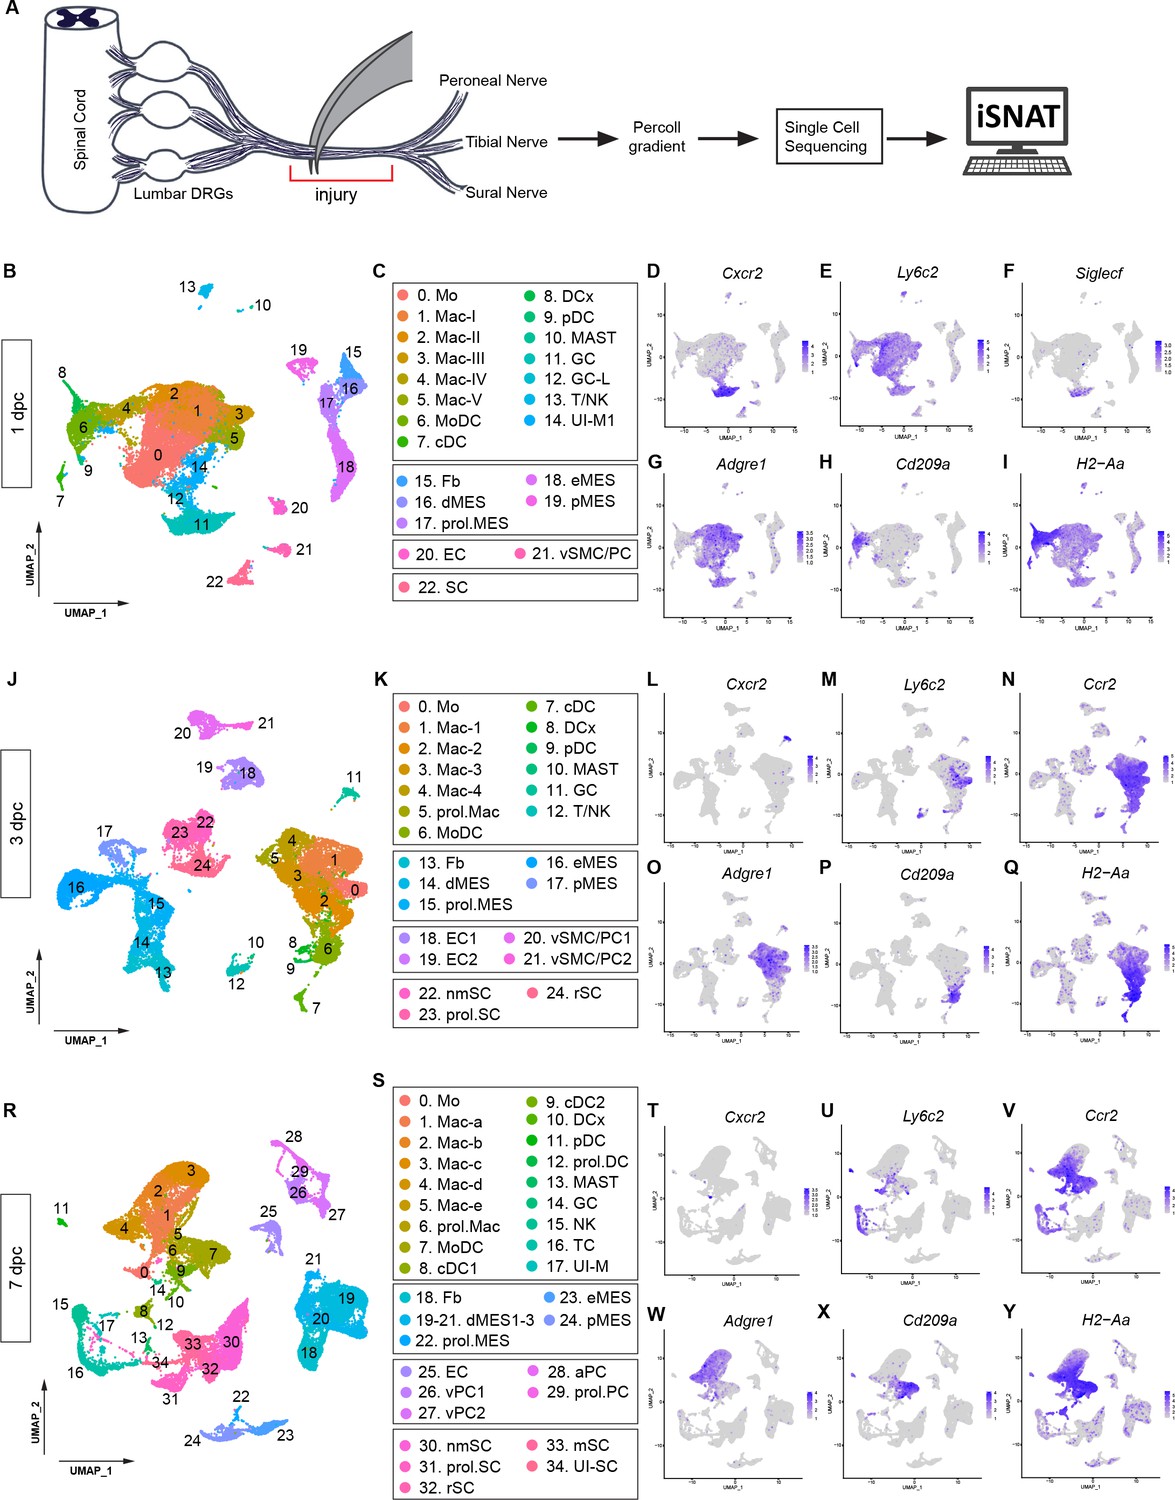
(A) Schematic of workflow for single-cell analysis of injured mouse sciatic nerve trunk. Cartoon of lumbar spinal cord with dorsal root ganglia (DRGs) and sciatic nerve. The nerve injury site is shown, and the segment marked with the red bracket harvested at different post-injury time points for analysis by scRNAseq. (B) UMAP plot embedding of sciatic nerve cells at 1dpc. A total of 29,070 high-quality cells (n = 5 replates) were subjected to unsupervised Seurat-based clustering resulting in 22 clusters. (C) List of cell types identified, grouped into immune cells (clusters 0–14), structural cells (clusters 15–19), cells associated with the nerve vasculature (clusters 20 and 21), and Schwann cells (cluster 22). (D–I) Feature plots of canonical immune cell markers reveals clusters that harbor GC (Cxcr2), including a subset of eosinophils (Siglecf/sialic acid binding Ig-like lectin F), Mo (Ly6c2/Ly6C), Mac (Adgre1/F4/80), MoDC (Cd209a/DC-SIGN), and antigen-presenting myeloid cells (H2-Aa/histocompatibility 2, class II antigen A, alpha). (J) UMAP plot embedding of sciatic nerve cells at 3dpc. A total of 24,672 high-quality cells (n = 6 replates) were subjected to unsupervised Seurat-based clustering, resulting in 24 cell clusters. (K) List of cell types in the 3-day injured nerve, grouped into immune cells (clusters 0–12), structural cells (clusters 13–17), cells associated with the nerve vasculature (clusters 18–21), and Schwann cells (clusters 22–24). (L–Q) Feature plots of canonical markers for immune cells to identify clusters with GC (Cxcr2), Mo (Ly6c2), Mo/Mac (Ccr2), Mac (Adgre1), MoDC (Cd209a), and antigen-presenting cells (H2–Aa). (R) UMAP plot embedding of sciatic nerve cells at 7dpc. A total of 32,976 high-quality cells (n = 8 replates) were subjected to unsupervised Seurat-based clustering resulting in 34 cell clusters. (S) List of cell types in the nerve at 7dpc, grouped into immune cells (clusters 0–17), structural cells (clusters 18–24), cells associated with the nerve vasculature (clusters 25–29), and Schwann cells (clusters 30–34). (T–Y) Feature plots of canonical markers for immune cells revealed GC (Cxcr2), Mo (Ly6c2), Mo/Mac (Ccr2), Mac (Adgre1), MoDC (Cd209a), and antigen-presenting cells (H2–Aa). Expression levels are projected onto UMAP with a minimum expression cutoff of 1. Abbreviations: Mo, monocytes; Mac, macrophages; prol.Mac, proliferating macrophages; MoDC, monocyte-derived dendritic cells; cDC, conventional dendritic cells; DCx mature/migrating dendritic cells; pDC, plasmacytoid dendritic cells; MAST, mast cells; GC, granulocytes (including neutrophils and eosinophils), GC-L, granule cell-like; TC, T cells; NK, natural killer cells. Abbreviations for stromal cells: Fb, fibroblast; dMES, differentiating mesenchymal cells; prol.MES, proliferating mesenchymal cells; eMES, endoneurial mesenchymal cells; pMES, perineurial mesenchymal cells. Abbreviations for vascular cells: EC, endothelial cells, vSMC, vascular smooth muscle cells; PC, pericytes; vPC, venous pericytes; aPC, arterial pericytes; prol.PC, proliferating pericytes. Abbreviations for Schwann cells, nmSC, non-myelinating Schwann cells; mSC myelinating Schwann cells; rSC, repair Schwann cells; prol.SC, proliferating Schwann cells. UI, unidentified cells.
Figure 2—figure supplement 1
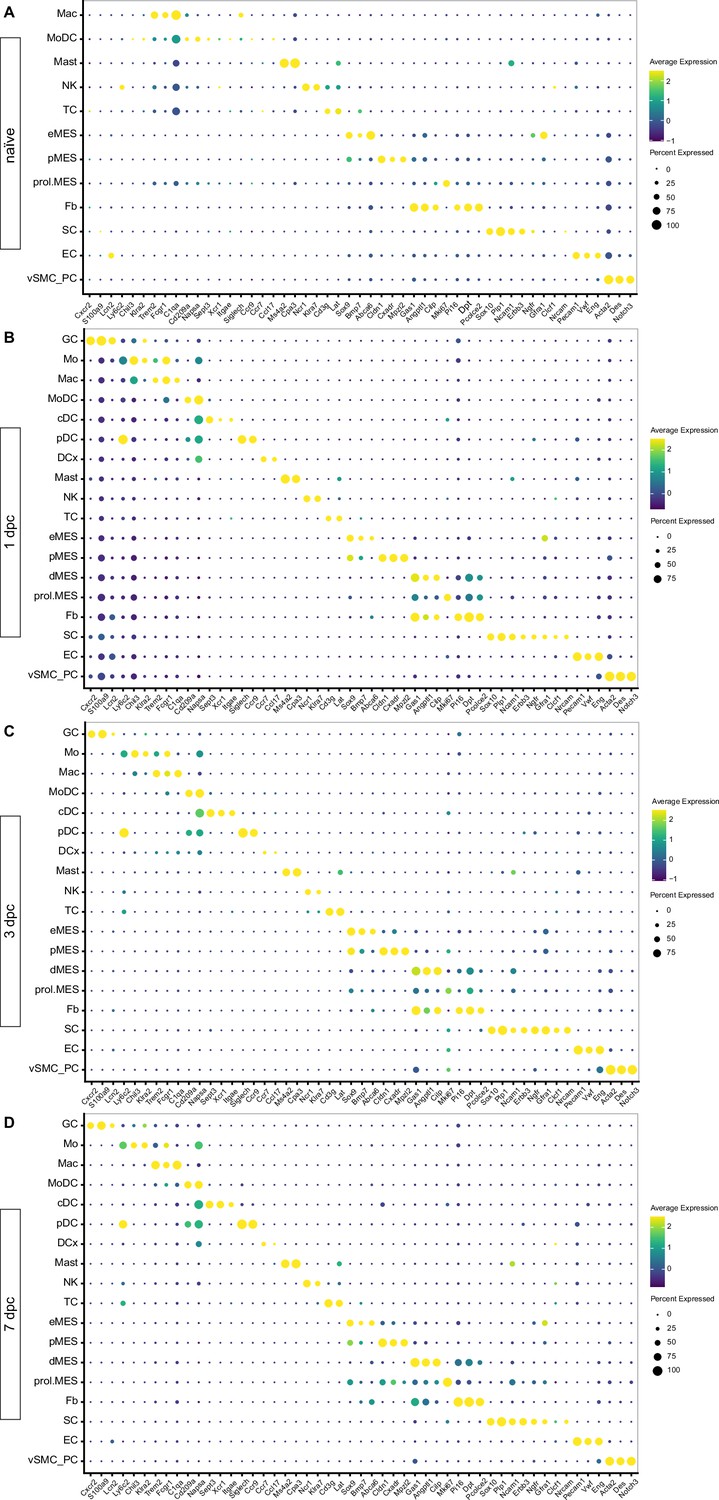
Identification of marker genes for cell type identification in the naïve and injured peripheral nervous system (PNS).
Dotplot analysis of scRNAseq datasets of (A) naïve nerve, (B) 1dpc nerve, (C) 3dpc nerve, and (D) 7dpc nerve. Expression levels are normalized to average gene expression (color coded). For each cell cluster, the percentile of cells expressing a specific gene product is indicated by the dot size.
Figure 2—figure supplement 2
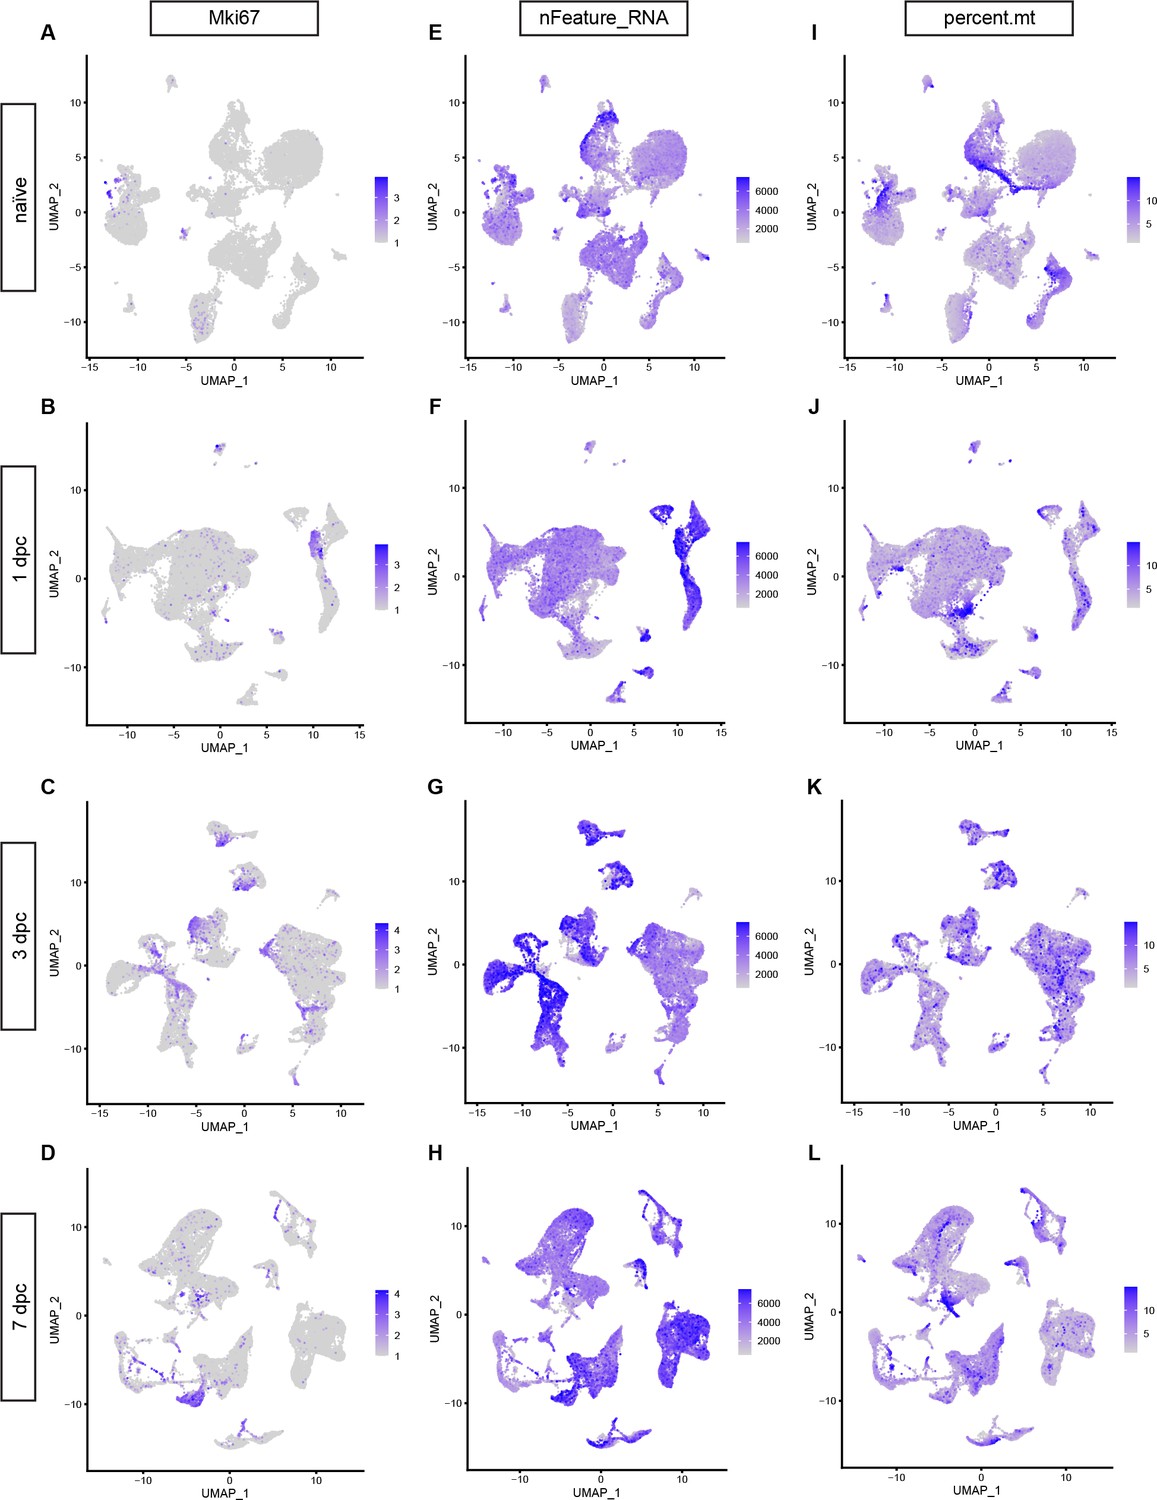
Quality test of scRNAseq datasets and identification of proliferating cells in the naïve and injured sciatic nerve.
Feature plots for Mki67 reveals proliferating cells in (A) naïve nerve, (B) 1dpc, (C) 3dpc, and (D) 7dpc. The expression levels are projected onto the UMAP with a minimum expression cutoff of 1. (E–H) Feature plot showing the number of unique transcripts detected in naïve and injured sciatic nerve cells. Color-coded calibration is shown. Note, cells with less than 500 unique features or more than 7500 were excluded from the study. (I–L) Feature plots showing the mitochondrial content of cells in naïve and injured nerves. Color-coded calibration is shown. Cells with higher than 15% mitochondrial content were excluded from the analysis.
Figure 2—figure supplement 3
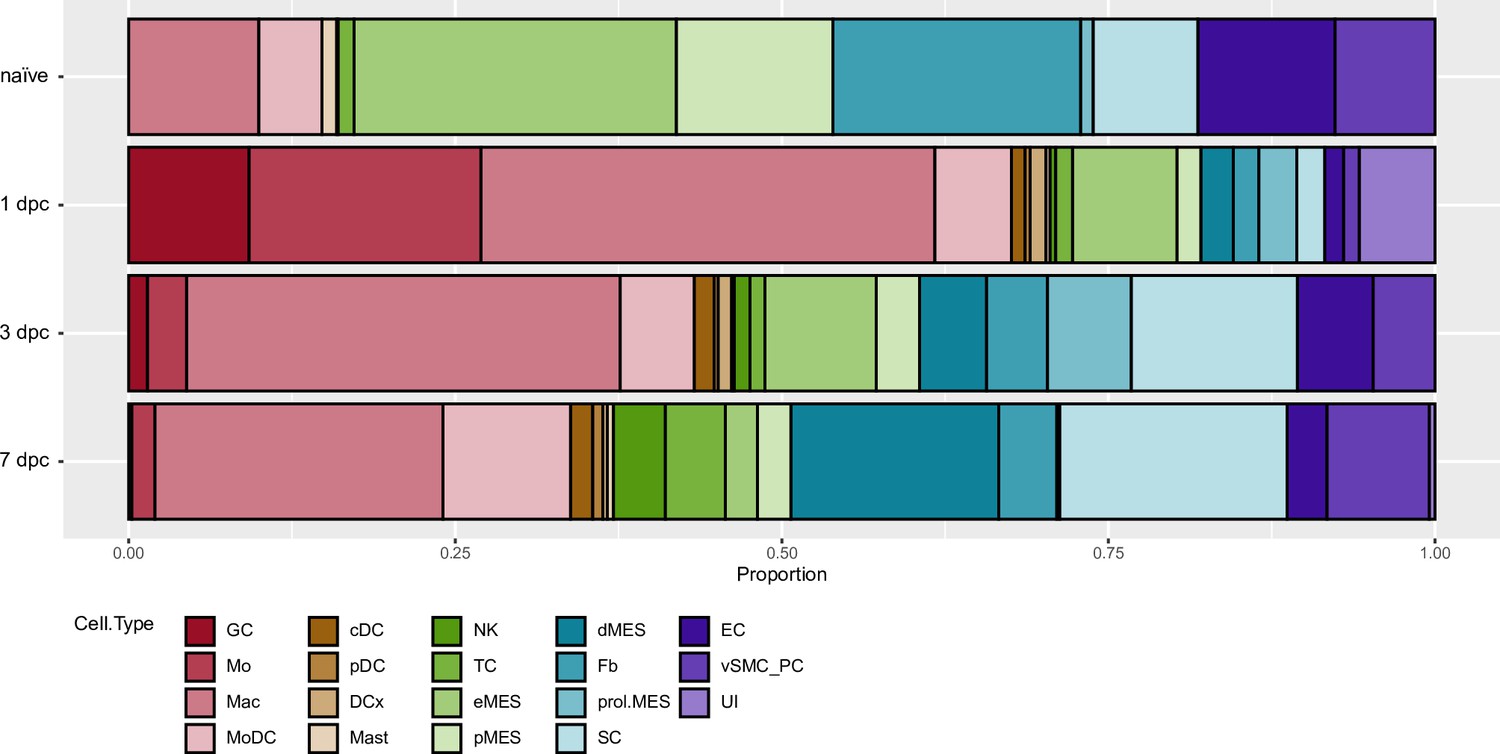
Cell composition on naïve and injured sciatic nerve.
Sciatic nerve scRNAseq datasets generated as part of a longitudinal study were used to assess changes in cell proportion before and after nerve crush injury.
Figure 3 with 4 supplements
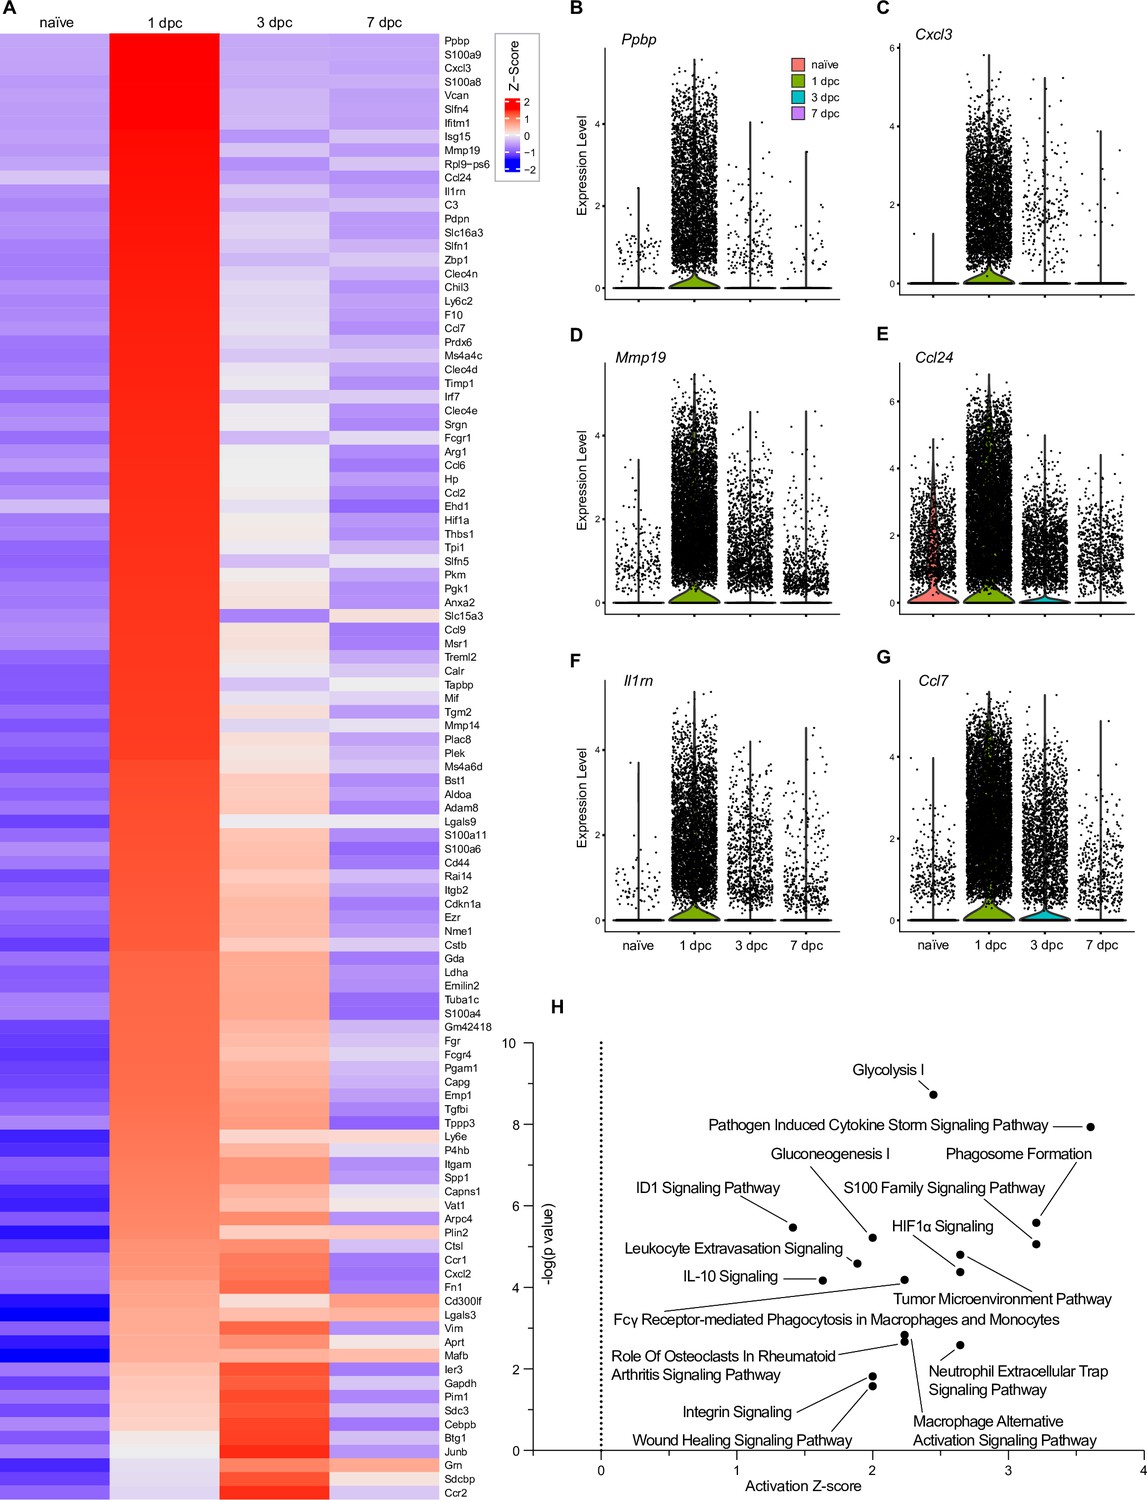
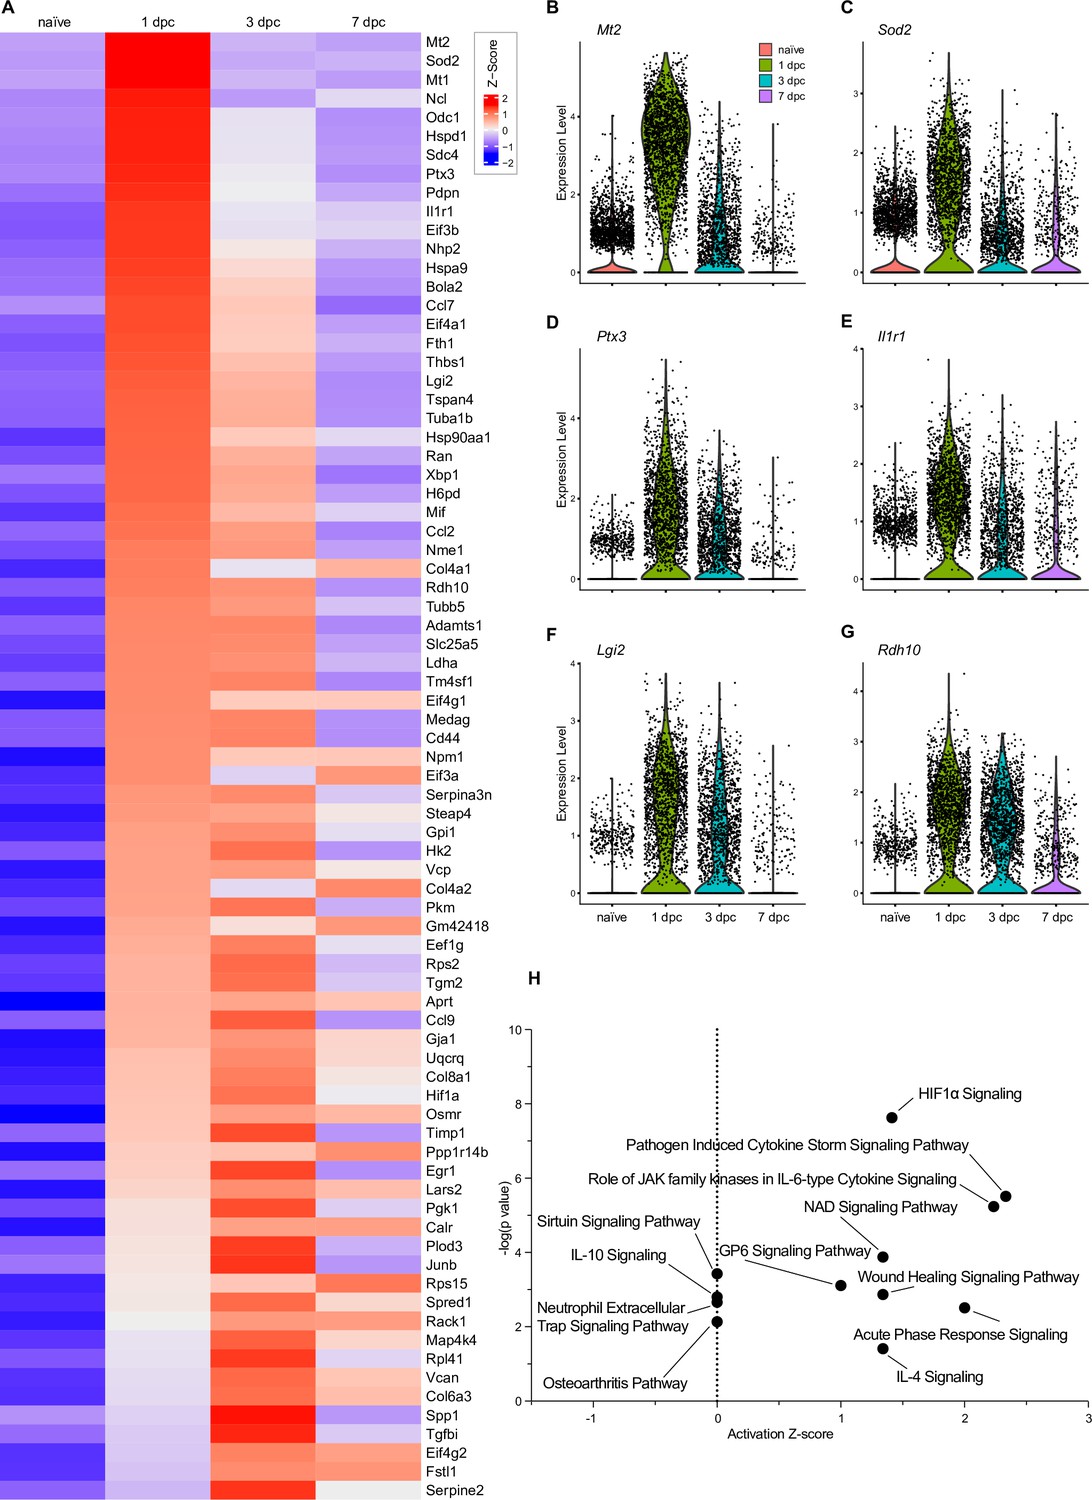
Top injury-regulated Mac gene products.
(A) Heatmap of top 107 injury-upregulated gene products from a list of significant genes, filtered for upregulation in Mac at 1dpc and expression in at least 25% of cells. Shown are z-scores for average expression levels in naïve nerve Mac, and Mac at 1dpc, 3dpc, and 7dpc. (B–G) Examples of injury-induced gene products, violin plots are shown for naïve and injured nerves. (H) Ingenuity pathway analysis for injury-induced gene products in Mac utilizing the top 107 differentially expressed genes determined by Seurat’s FindAllMarkers function and the Wilcoxon rank-sum test. The top-scoring enriched canonical pathways are represented through activation z-scores and p-values.
Figure 3—figure supplement 1
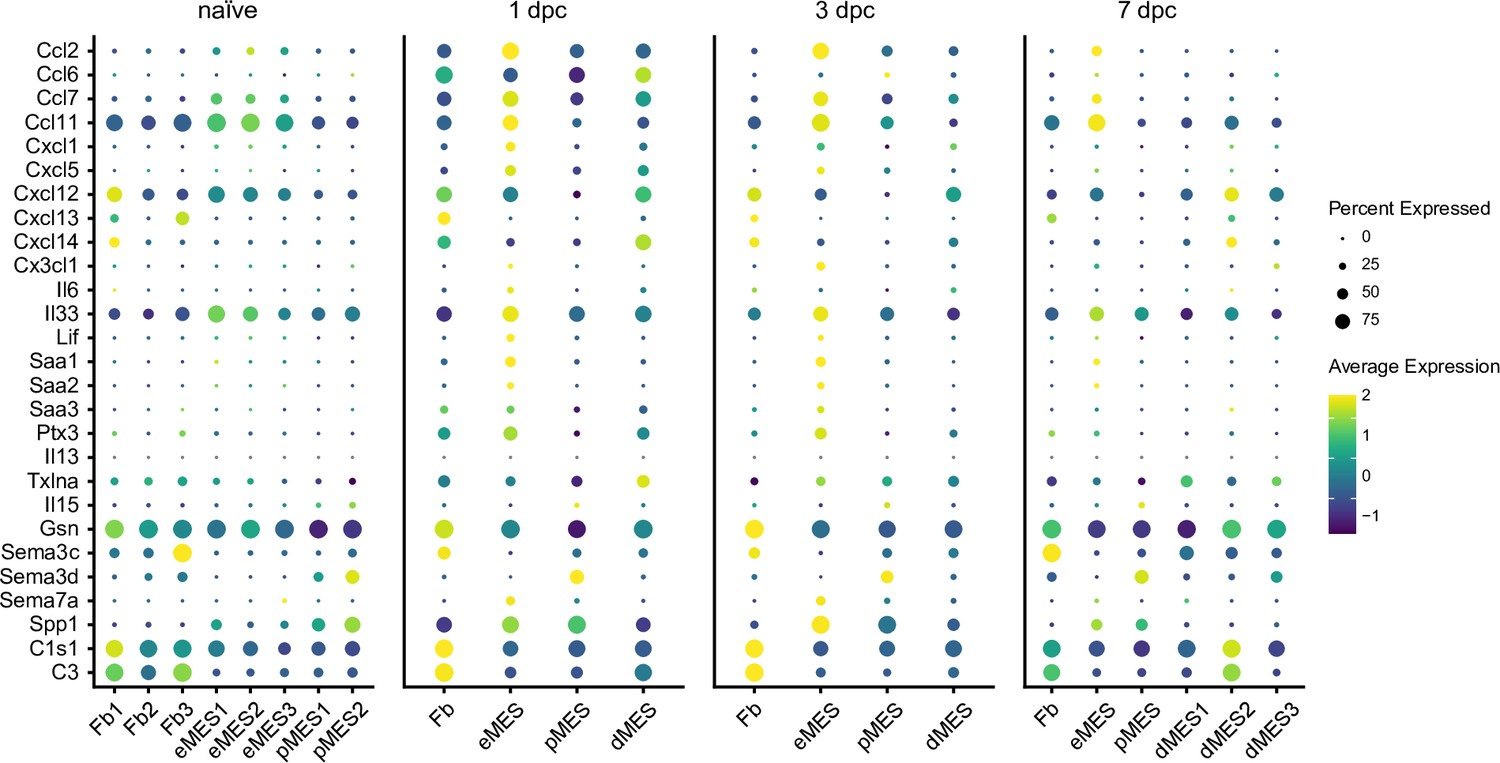
Structural cells in the injured nerve shape the local immune microenvironment.
Dotplots of structural cells, including Fb (fibroblasts), eMES (endoneurial mesenchymal cells), pMES (perineurial mesenchymal cells), and dMES (differentiating mesenchymal cells). Expression of extracellular immune molecules, as detected by scRNAseq of naïve nerve, and at 1-, 3-, and 7dpc is shown. Color-coded gene expression levels, normalized to average gene expression. The dot size reflects the percentage of cells that express the gene.
Figure 3—figure supplement 2
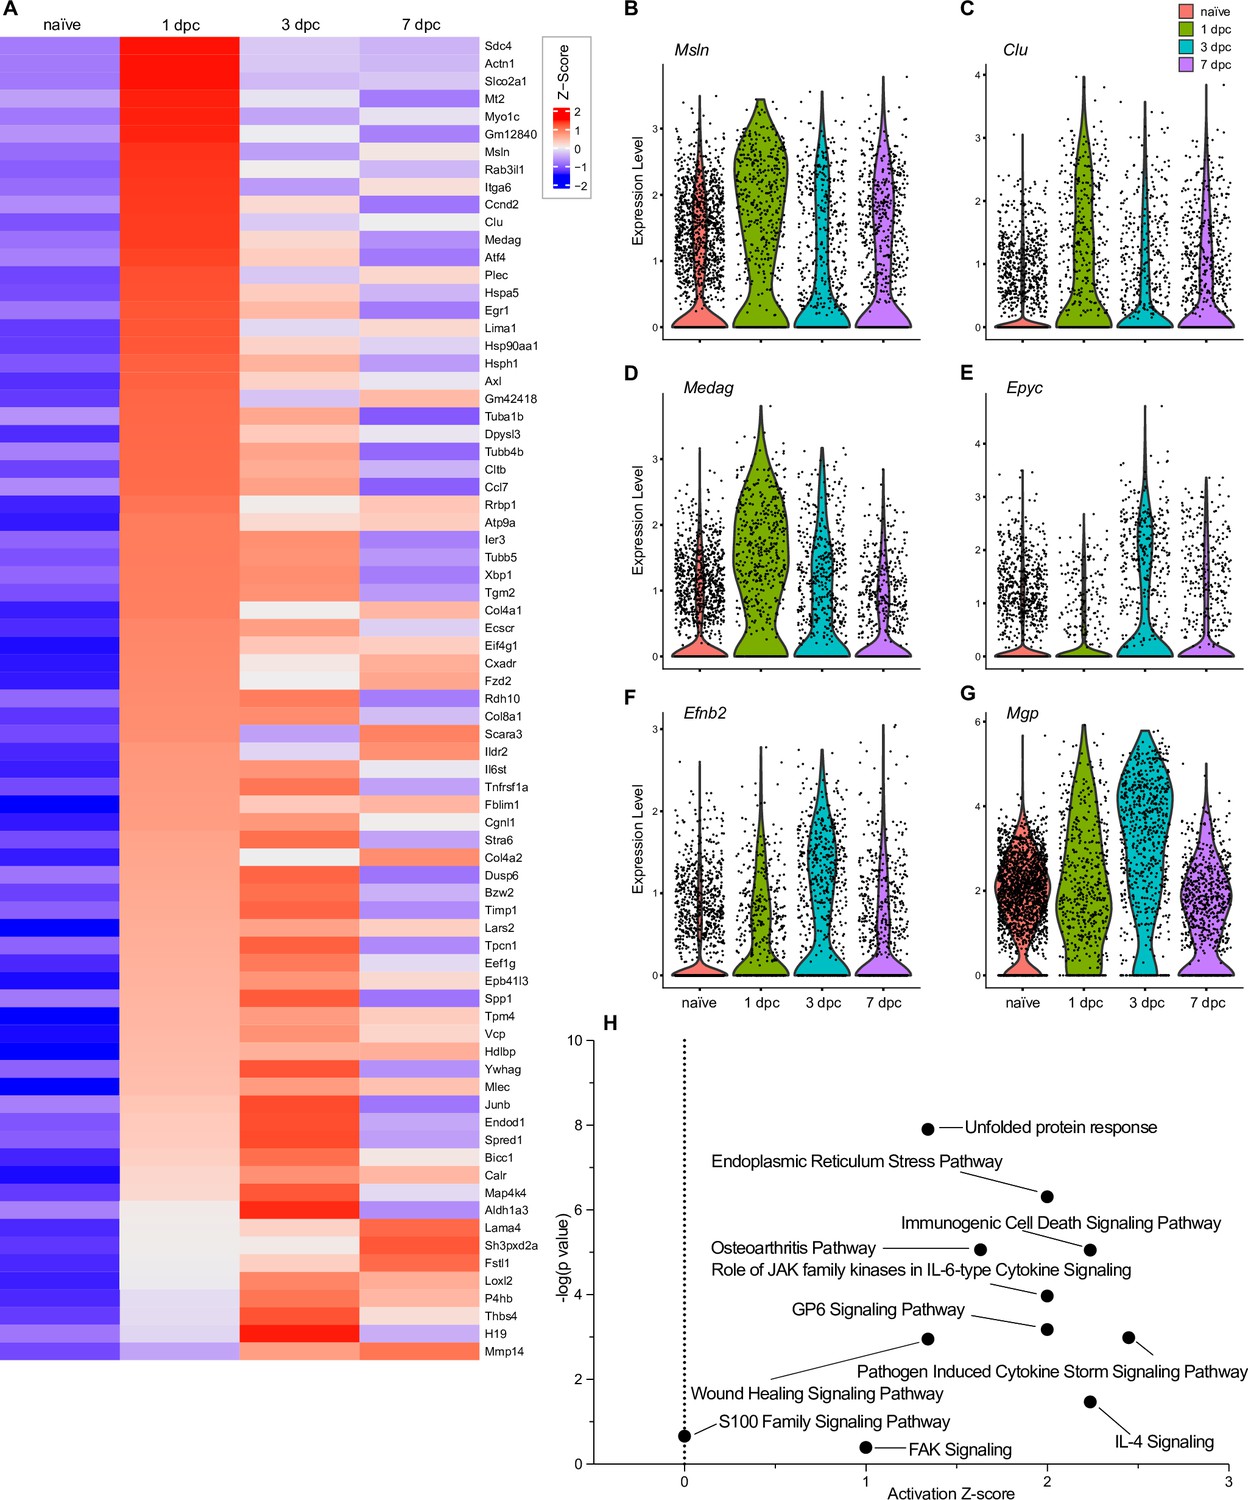
Top injury-regulated gene products in endoneurial mesenchymal cell (eMES).
(A) Heatmap of top 78 injury-upregulated gene products, showing z-scores for average expression levels in naïve nerve eMES, and at 1dpc, 3dpc, and 7dpc. (B–G) Examples of injury-induced gene products, violin plots are shown for naïve and injured nerves. (H) Ingenuity pathway analysis for injury-induced gene products in eMES utilizing the top 78 differentially expressed genes determined by Seurat’s FindAllMarkers function and the Wilcoxon rank-sum test. The top-scoring enriched canonical pathways are represented through activation z-scores and p-values.
Figure 3—figure supplement 3
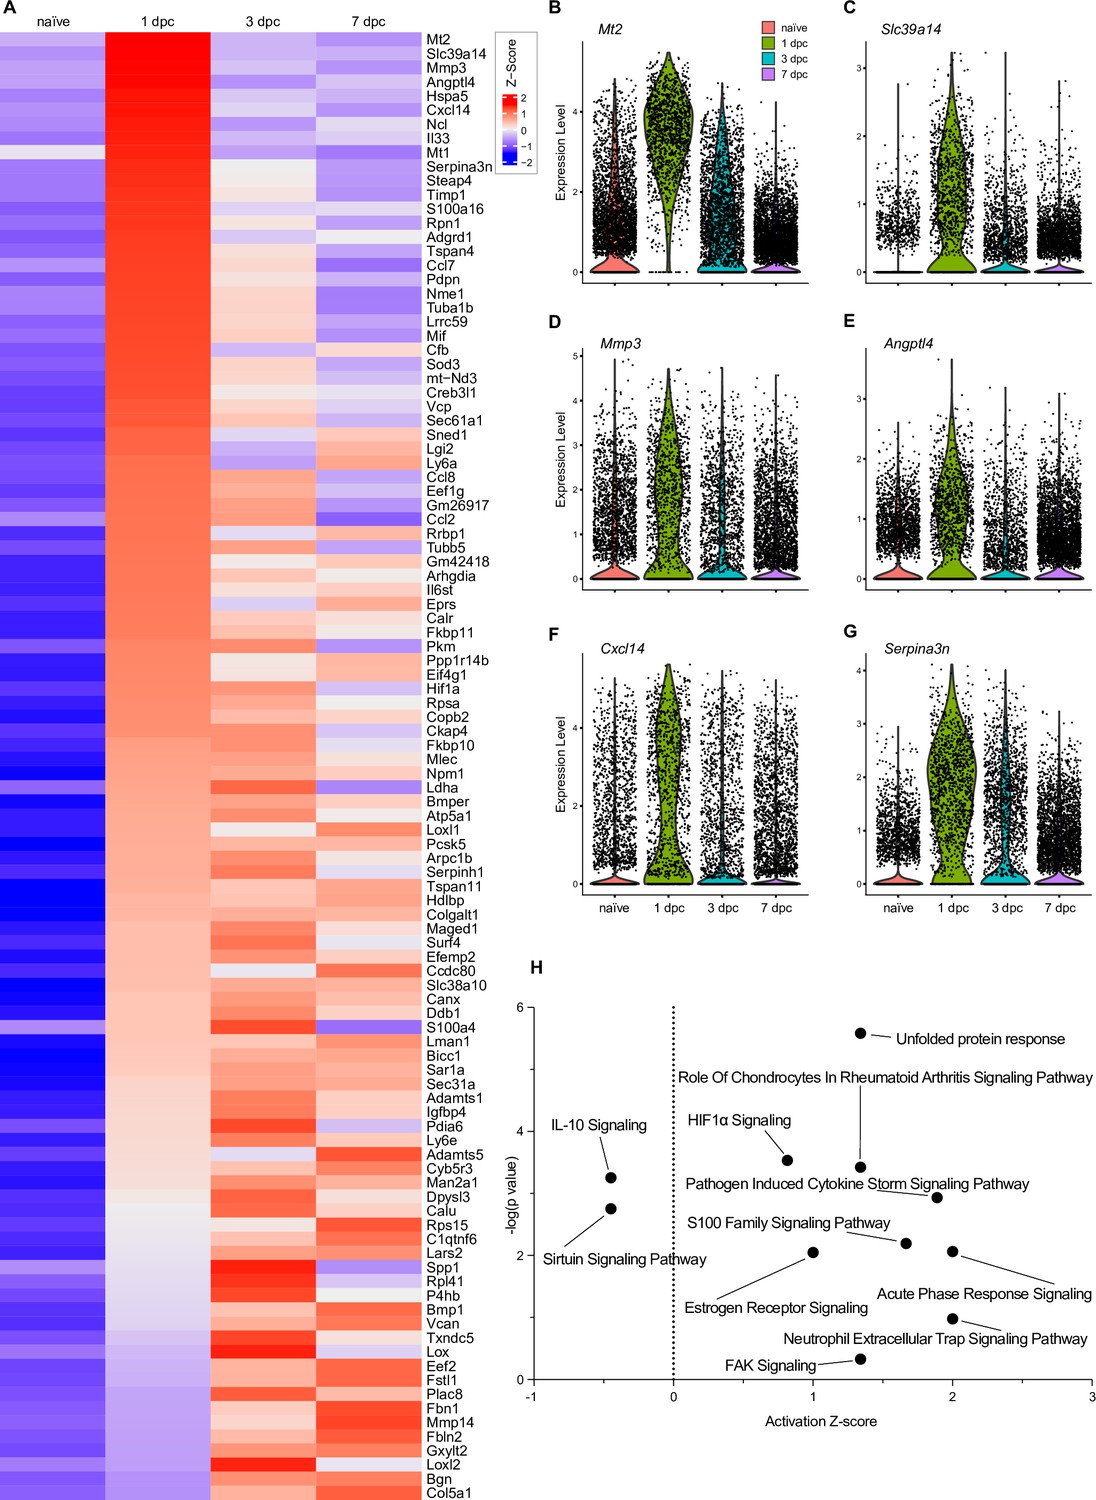
Top injury-regulated gene products in perineurial mesenchymal cells (pMES).
(A) Heatmap of top 75 injury-upregulated gene products, showing z-scores for average expression levels in naïve nerve pMES, and at 1dpc, 3dpc, and 7dpc. (B–G) Examples of injury-induced gene products, violin plots are shown for naïve and injured nerves. (H) Ingenuity pathway analysis for injury-induced gene products in pMES utilizing the top 75 differentially expressed genes determined by Seurat’s FindAllMarkers function and the Wilcoxon rank-sum test. The top-scoring enriched canonical pathways are represented through activation z-scores and p-values.
Figure 3—figure supplement 4
Top injury-regulated gene products in fibroblasts/differentiating mesenchymal cells (Fb/dMES).
(A) Heatmap of top 104 injury-upregulated gene products, showing calibrated expression levels in naïve nerve Fb, and Fb/dMES at 1dpc, 3dpc, and 7dpc. (B–G) Examples of injury-induced gene products, violin plots are shown for naïve and injured nerves. (H) Ingenuity pathway analysis for injury-induced gene products in Fb/dMES utilizing the top 104 differentially expressed genes determined by Seurat’s FindAllMarkers function and the Wilcoxon rank-sum test. The top-scoring enriched canonical pathways are represented through activation z-scores and p-values.
Figure 4 with 4 supplements
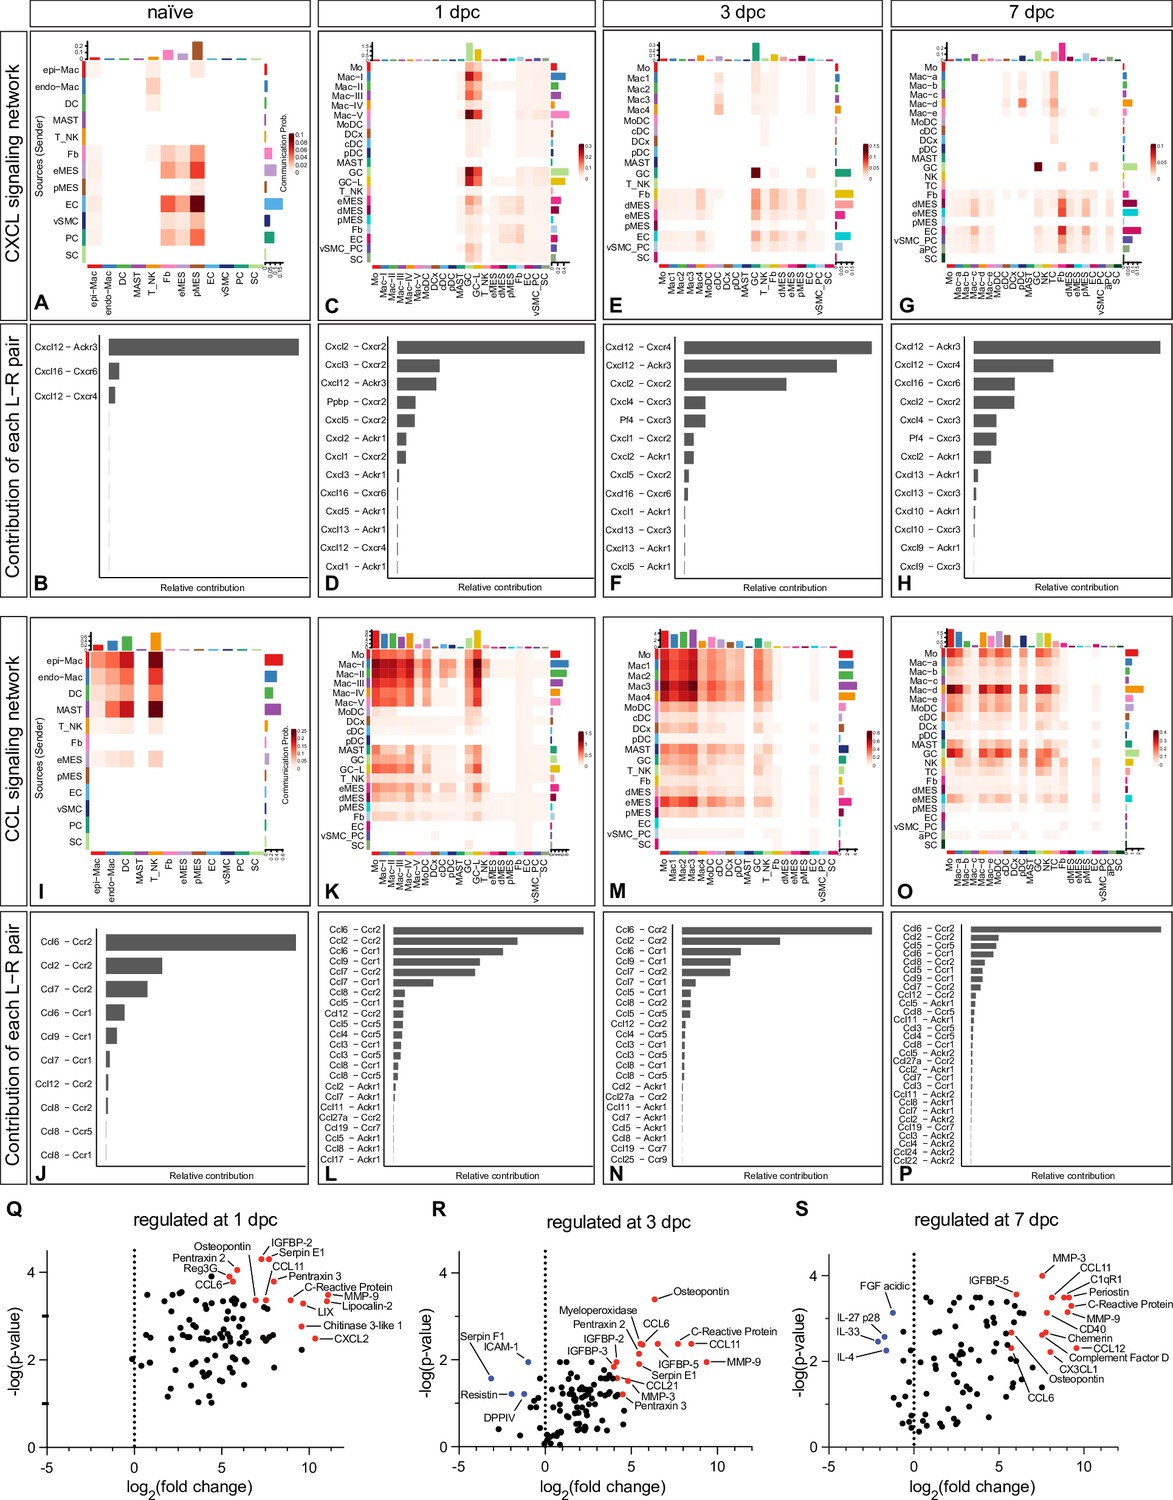
CellChat reveals chemotactic cell–cell communication networks in the injured peripheral nervous system (PNS).
Hierarchical plots of CellChat analysis showing the inferred intercellular communication networks for (A–H) CXCL-chemokines and (I–P) CCL-cytokines in naïve nerve and during the first week following injury. The sender cells (ligand sources) are shown on the y-axis and receiving cells (receptor expression) on the x-axis. The probabilities for cells to communicate with each other are indicated. (B, D ,F, H) The bar graphs show the contributions of CXCL ligand–receptor pairs for each time point. (J, L, N, P) The bar graphs show the relative contributions of CCL ligand–receptor pairs for each time point. (Q–S) Volcano plot of extracellular proteins detected by ELISA compared to naïve nerve. The most abundant and strongly upregulated proteins in the 1dpc nerve (Q), the 3dpc nerve (R), and the 7dpc nerve (S) are labeled in red. The normalized signal on the x-axis shows the log2 fold-change and the y-axis shows the -log(p-value), normalized to naïve nerve.
Figure 4—figure supplement 1
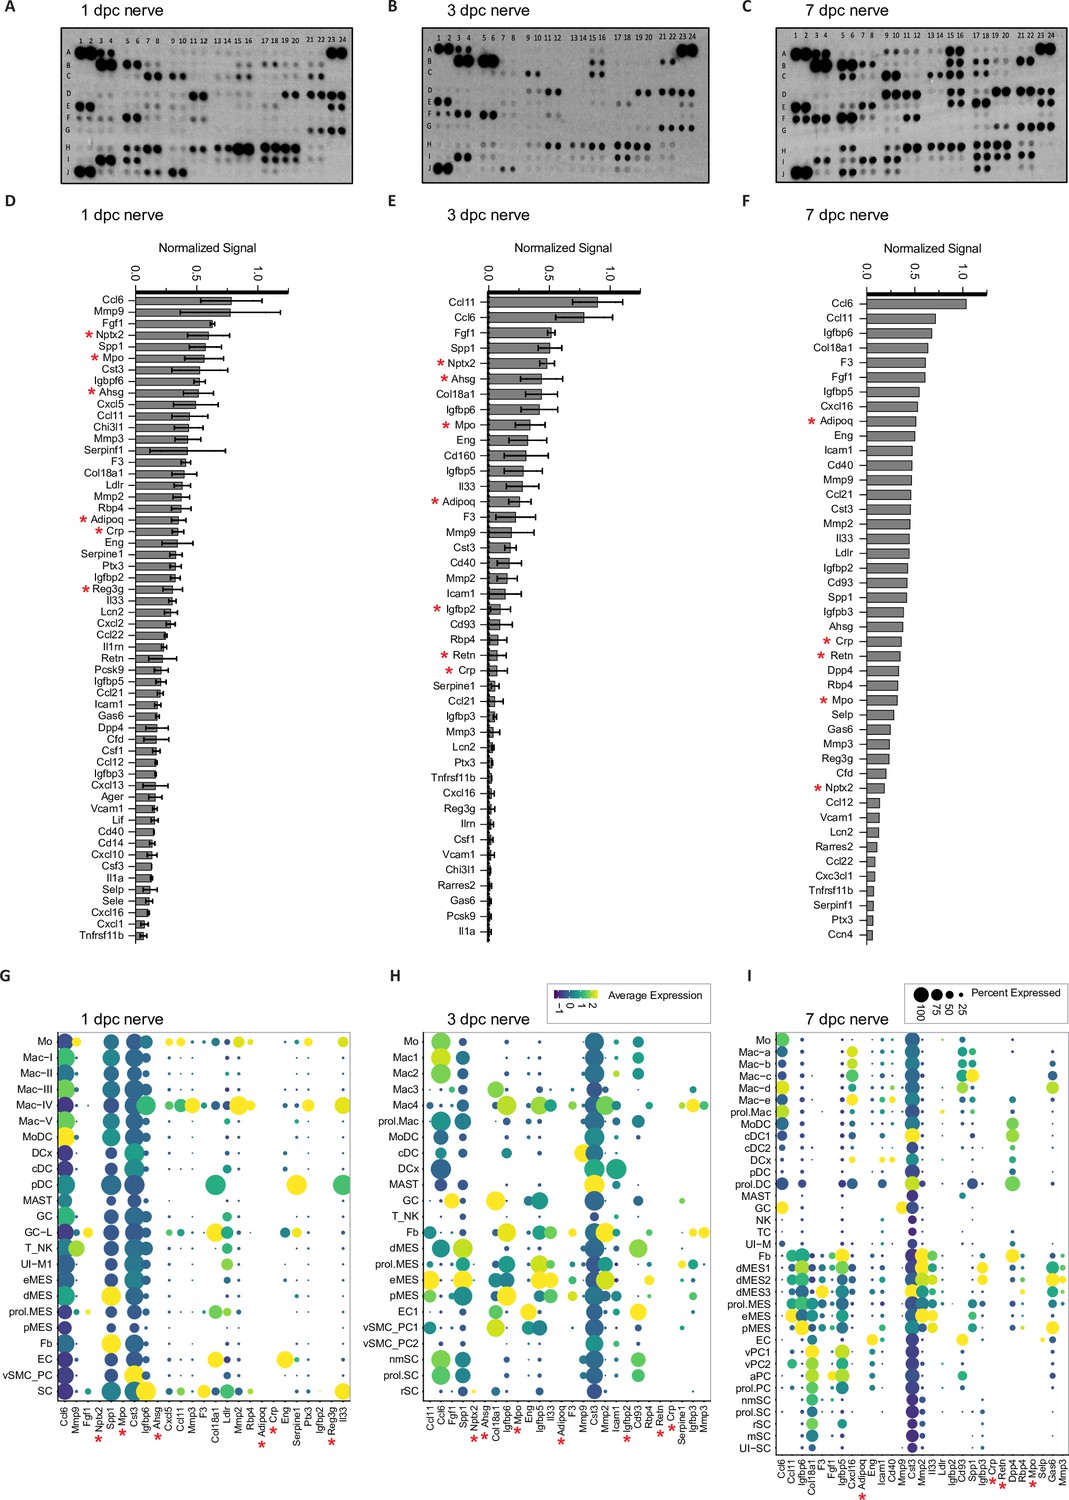
Identification of extracellular proteins in the injured sciatic nerve by ELISA.
(A–C) Representative ELISA membranes probed with injured sciatic nerve lysates prepared at (A) 1dpc (n = 2), (B) 3dpc (n = 2), and (C) 7dpc ( n = 1). (D–F) List of top proteins detected at each time point. For quantification, ELISA signals were normalized to reference spots shown at coordinates (A1, A2), (A23, A24), and (J1, J2). (G, H) Dotplots generated from scRNAseq data obtained from 1dpc, 3dpc, and 7dpc nerves, showing transcripts for top 25 proteins detected by ELISA. Relative RNA expression levels, normalized to average gene expression (color coded). For each cell cluster, the percentile of cells expressing a specific gene product is indicated by the dot size. Gene products marked with a red star are detected by ELISA but not by scRNAseq.
-
Figure 4—figure supplement 1—source data 1
X-Ray films of ELISA membranes probed with injured sciatic nerve lysates.
- https://cdn.elifesciences.org/articles/80881/elife-80881-fig4-figsupp1-data1-v2.zip
Figure 4—figure supplement 2
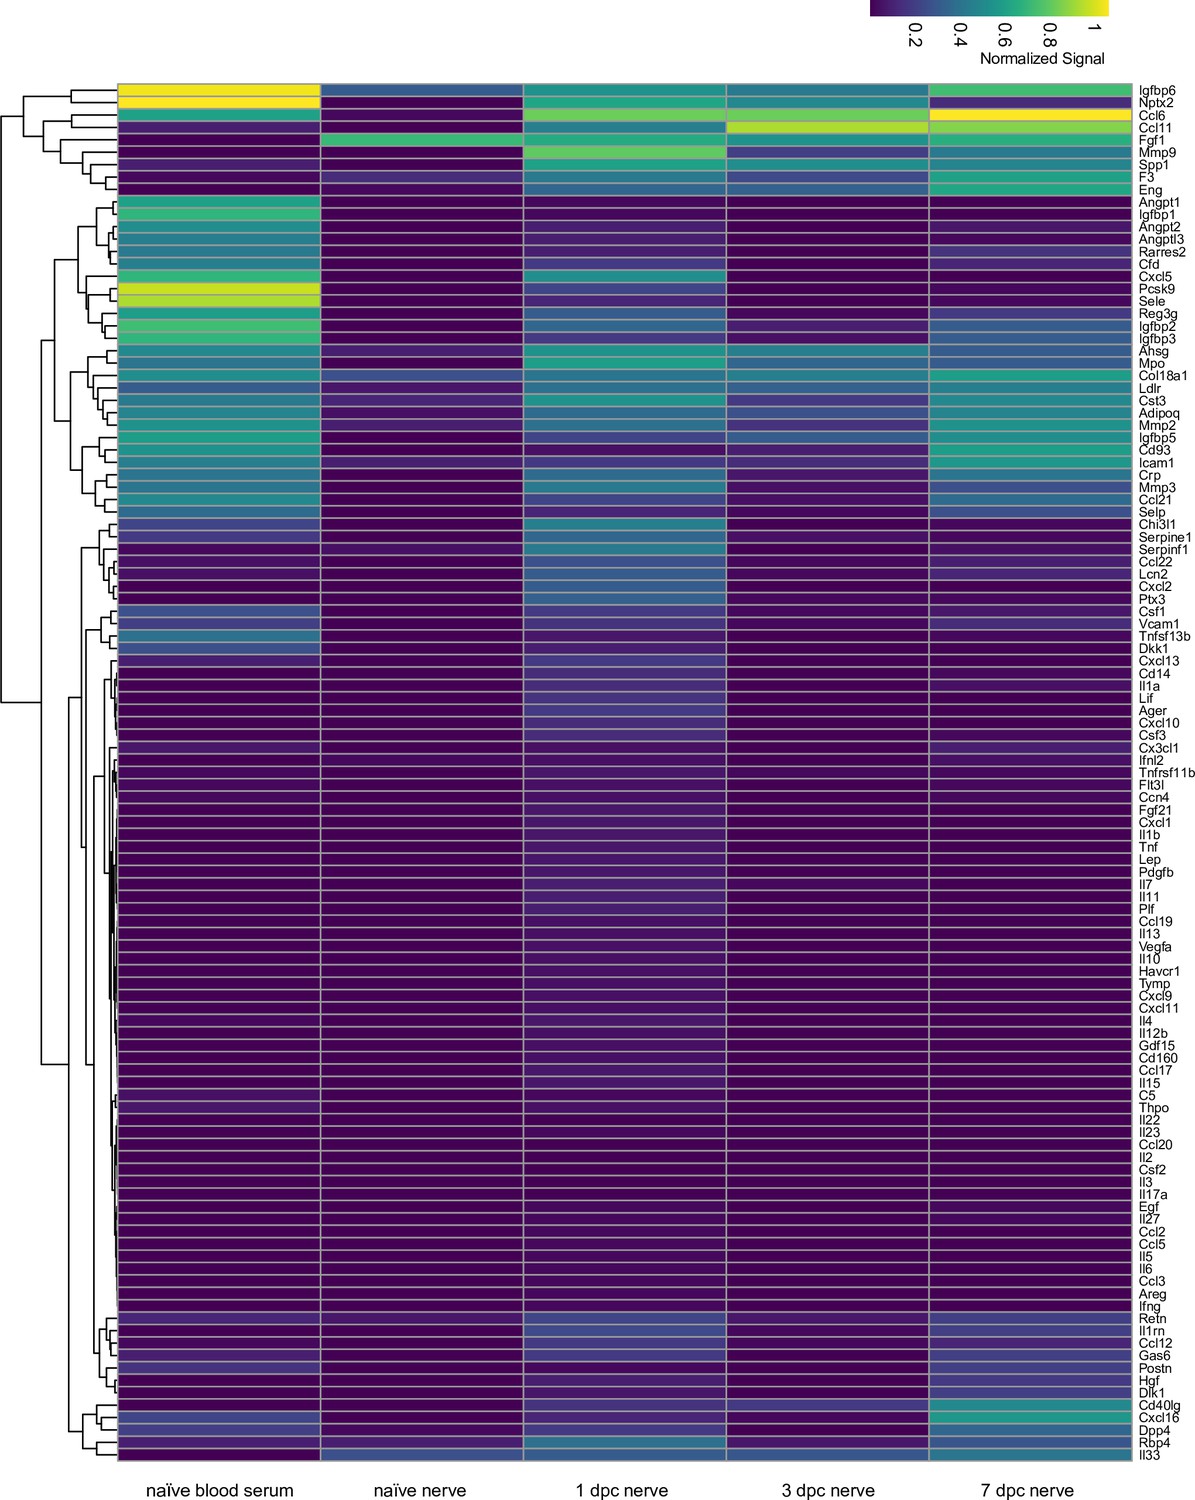
Identification of extracellular proteins in the injured sciatic nerve.
Heatmap shows proteins detected by ELISA in serum, sciatic nerve trunk of naïve mice (n = 2), 1dpc (n = 2), 3dpc (n = 2), and 7dpc (n = 1) nerves. Relative protein levels were averaged and normalized to internal controls on ELISA membranes shown at coordinates (A1, A2), (A23, A24), (J1, J2). Coordinates of proteins that can be detected by the ELISA: (A3, A4) Adiponectin [Adipoq], (A5, A6) Amphiregulin [Areg], (A7, A8) Angiopoientin-1 [Angpt1], (A9, A10) Angiopoientin-2 [Angpt2], (A11, A12) Angiopoientin-like 3 [Angptl3], (A13, A14) BAFF [Tnfrsf13b], (A15, A16) C1qR1 [Cd93], (A17, A18) CCL2 [Ccl2], (A19, A20) CCL3 [Ccl3], (A21, A22) CCL5 [Ccl5], (A23, A24) Reference spots, (B3, B4) CCL6 [Ccl6], (B5, B6) CCL11 [Ccl11], (B7, B8) CCL12 [Ccl12], (B9, B10) CCL17 [Ccl17], (B11, B12) CCL19 [Ccl19], (B13, B14) CCL20 [Ccl20], (B15, B16) CCL21 [Ccl21], (B17, B18) CCL22 [Ccl22], (B19, B20) CD14 [Cd14], (B21, B22) CD40 [Cd40], (C3, C4) CD160 [Cd160], (C5, C6) Chemerin [Rarres2], (C7, C8) Chitinase 3-like 1 [Chil3], (C9, C10) Coagulation Factor III [F3], (C11, C12) Complement Component C5 [C5], (C13, C14) Complement Factor D [Cfd], (C15, C16) C-Reactive Protein [Crp], (C17, C18) CX3CL1 [Cx3cl1], (C19, C20) CXCL1 [Cxcl1], (C21, C22) CXCL2 [Cxcl2], (D1, D2) CXCL9 [Cxcl9], (D3, D4) CXCL10 [Cxcl10], (D5, D6) CXCL11 [Cxcl11], (D7, D8) CXCL13 [Cxcl13], (D9, D10) CXCL16 [Cxcl16], (D11, D12) Cystatin C [Cst3], (D13, D14) DKK-1 [Dkk1], (D15, D16) DPPIV [Dpp4], (D17, D18) EGF [Egf], (D19, D20) Endoglin [Eng], (D21, D22) Endostatin [Col18a1], (D23, D24) Fetuin A [Ahsg], (E1, E2) FGF acidic [Fgf1], (E3, E4) FGF-21 [Fgf21], (E5, E6) Flt-3 Ligand [Flt3l], (E7, E8) Gas 6 [Gas6], (E9, E10) G-CSF [Csf3], (E11, E12) GDF-15 [Gdf15], (E13, E14) GM-CSF [Csf2], (E15, E16) HGF [Hgf], (E17, E18) ICAM-1 [Icam1], (E19, E20) IFN-gamma [Ifng], (E21, E22) IGFBP-1 [Igfbp1], (E23, E24) IGFBP-2 [Igfbp2], (F1, F2) IGFBP-3 [Igfbp3], (F3, F4) IGFBP-5 [Igfbp5], (F5, F6) IGFBP-6 [Igfbp6], (F7, F8) IL-1alpha [Il1a], (F9, F10) IL-1Beta [Il1b], (F11, F12) IL-1ra [Il1rn], (F13, F14) IL-2 [Il2], (F15, F16) IL-3 [Il3], (F17, F18) IL-4 [Il4], (F19, F20) IL-5 [Il5], (F21, F22) IL-6 [Il6], (F23, F24) IL-7 [Il7], (G1, G2) IL-10 [Il10], (G3, G4) IL-11 [Il11], (G5, G6) IL-12 p40 [Il12], (G7, G8) IL-13 [Il13], (G9, G10) IL-15 [Il15], (G11, G12) IL-17A [Il17a], (G13, G14) IL-22 [Il22], (G15, G16) IL-23 [Il23], (G17, G18) IL-27 p28 [Il27], (G19, G20) IL-28 [Ifnl3], (G21, G22) IL-33 [Il33], (G23, G24) LDL R [Ldlr], (H1, H2) Leptin [Lep], (H3, H4) LIF [Lif], (H5, H6) Lipocalin-2 [Lcn2], (H7, H8) LIX [Cxcl5], (H9, H10) M-CSF [Csf1], (H11, H12) MMP-2 [Mmp2], (H13, H14) MMP-3 [Mmp3], (H15, H16) MMP-9 [Mmp9], (H17, H18) Myeloperoxidase [Mpo], (H19, H20) Osteopontin [Spp1], (H21, H22) Osteoprotegerin [Tnfrsf11b], (H23, H24) PD-ECGF [Tymp], (I1, I2) PDGF-BB [Pdgfb], (I3, I4) Pentraxin 2 [Nptx2], (I5, I6) Pentraxin 3 [Ptx3], (I7, I8) Periostin [Postn], (I9, I10) Pref-1 [Dlk1], (I11, I12) Proliferin [Prl2c2], (I13, I14) Proprotein Convertase 9 [Pcsk9], (I15, I16) RAGE [Ager], (I17, I18) RBP4 [Rbp4], (I19, I20) Reg3G [Reg3g], (I21, I22) Resistin [Retn], (J1, J2) Reference spots, (J3, J4) E-Selectin [Sele], (J5, J6) P-Selectin [Selp], (J7, J8) Serpin E1 [Serpine1], (J9, J10) Serpin F1 [Serpinf1], (J11, J12) Thrombopoietin [Thpo], (J13, J14) TIM-1 [Havcr1], (J15, J16) TNF-alpha [Tnf], (J17, J18) VCAM-1 [Vcam1], (J19, J20) VEGF [Vegf], (J21, J22) WISP-1 [Ccn4], (J23, J24) negative control.
Figure 4—figure supplement 3
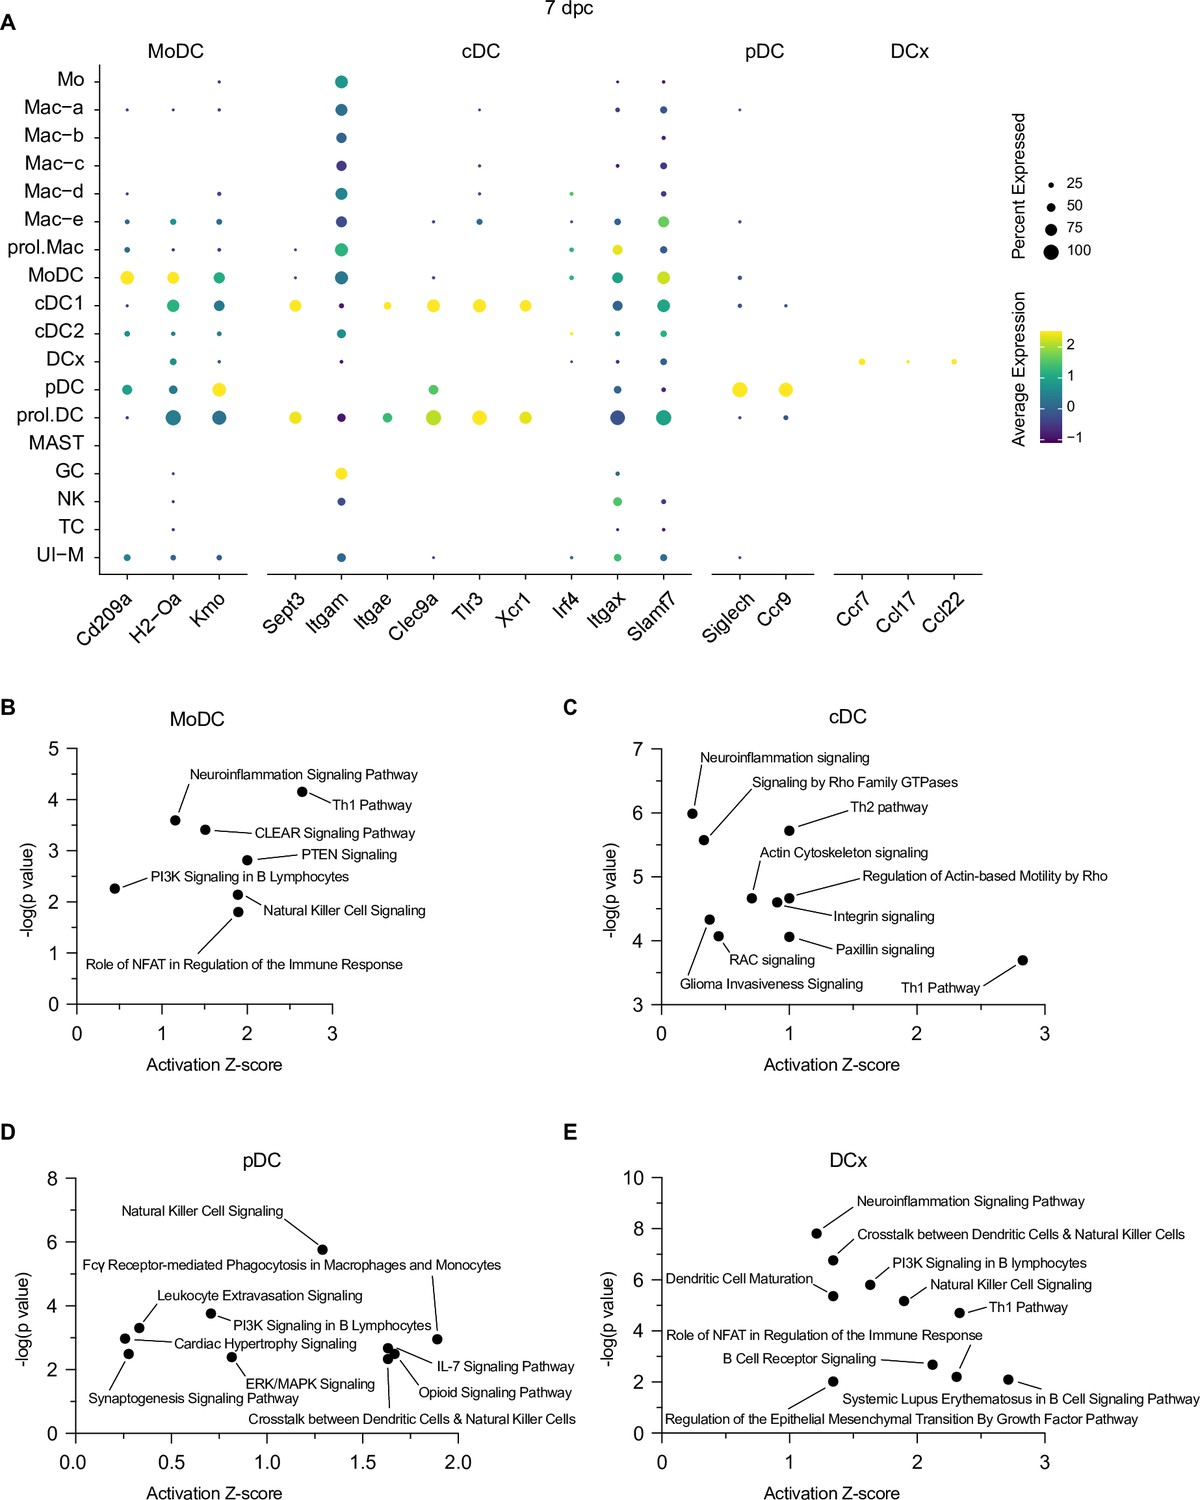
Identification of multiple dendritic cell (DC) populations in the injured peripheral nervous system (PNS).
(A) Dotplot for DC marker genes at 7dpc identifies MoDC (monocyte-derived dendritic cells), cDC (conventional dendritic cells), pDC (plasmacytoid dendritic cells), and DCx (nerve exiting dendritic cells, destined for homing to draining lymph nodes). Relative RNA expression levels, normalized to average gene expression (color coded) are shown. For each cell cluster, the percentile of cells expressing a specific gene product is indicated by the dot size. Ingenuity pathway analysis at 7dpc for (B) MoDC, (C) cDC, (D) pDC, and (E) DCx. Top-scoring enriched canonical pathways in each cell type are represented by activation z-scores and p-values.
Figure 4—figure supplement 4
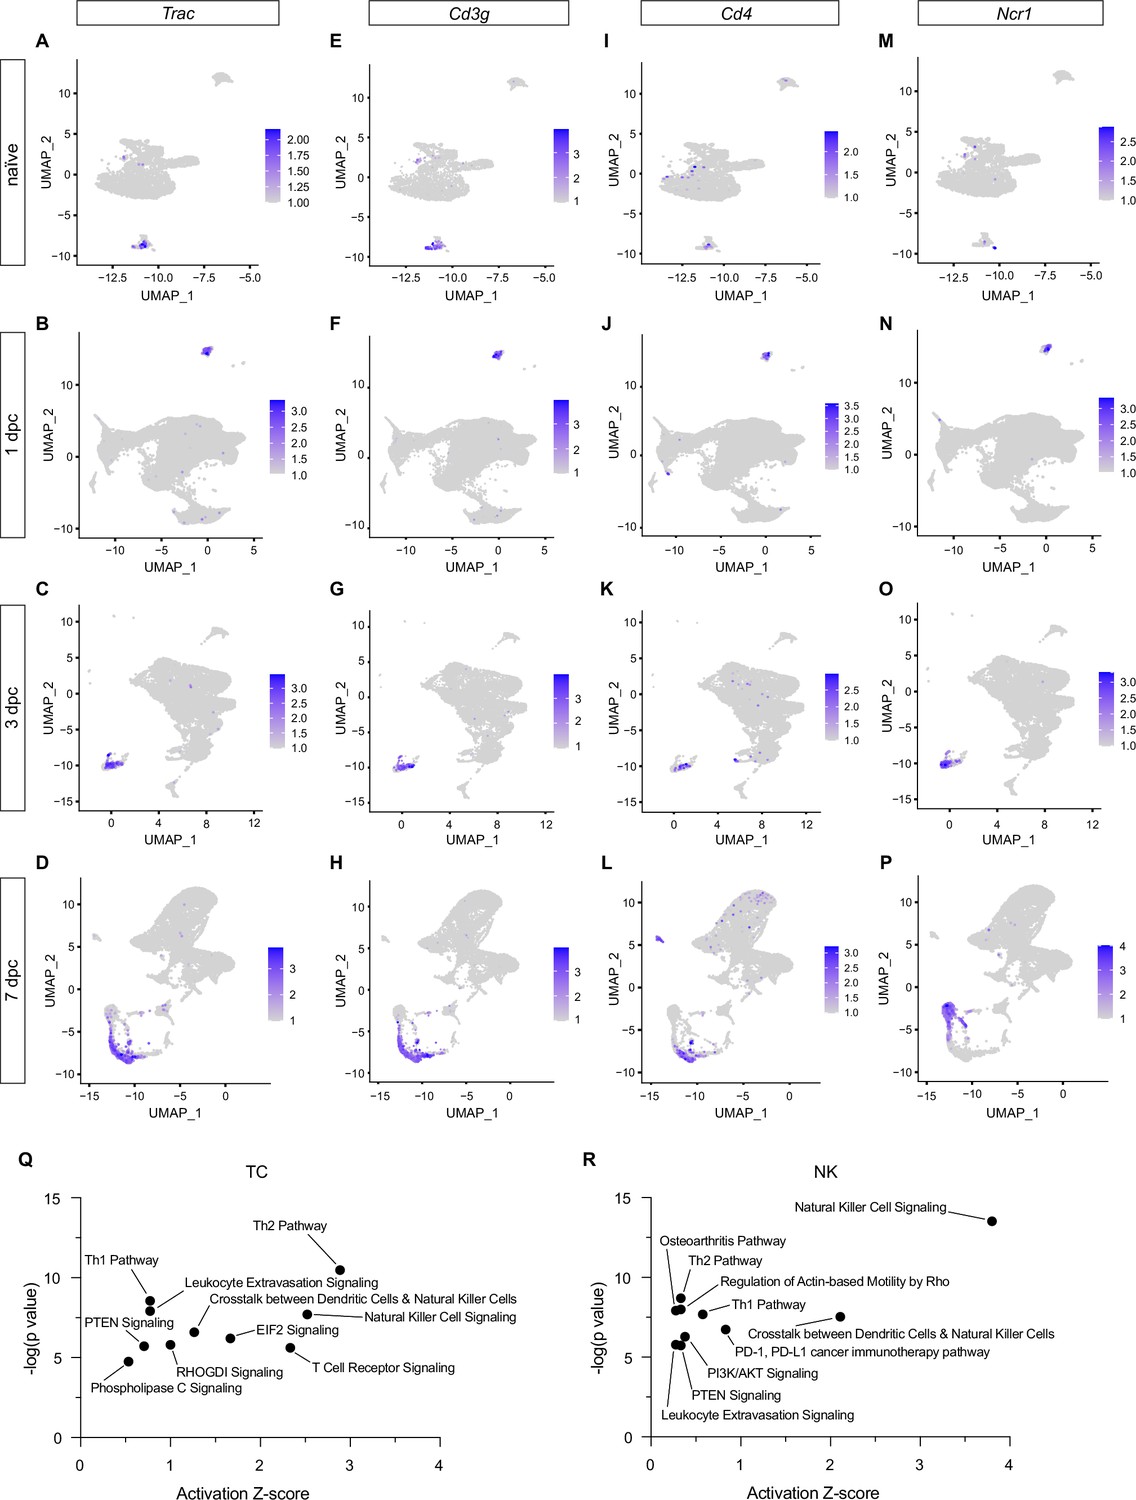
Identification of specific T cell (TC) and natural killer cell (NK) populations in the injured peripheral nervous system (PNS).
Longitudinal analysis of TC and NK populations during the first week following injury. Feature plots for (A–D) Trac/T cell receptor alpha constant, (E–H) Cd3g/CD3 gamma subunit of T cell receptor complex, (I–L) Cd4/T cell surface glycoprotein CD4, and (M–P) Ncr1/Natural cytotoxicity triggering receptor-1 of naïve, 1, 3, and 7dpc nerve. Expression levels are projected onto the UMAP with a minimum expression cutoff of 1. (Q, R) Ingenuity pathway analysis (IPA) for TC and NK at 7dpc. Top-scoring enriched canonical pathways are represented by activation z-scores and p-values.
Figure 5 with 2 supplements
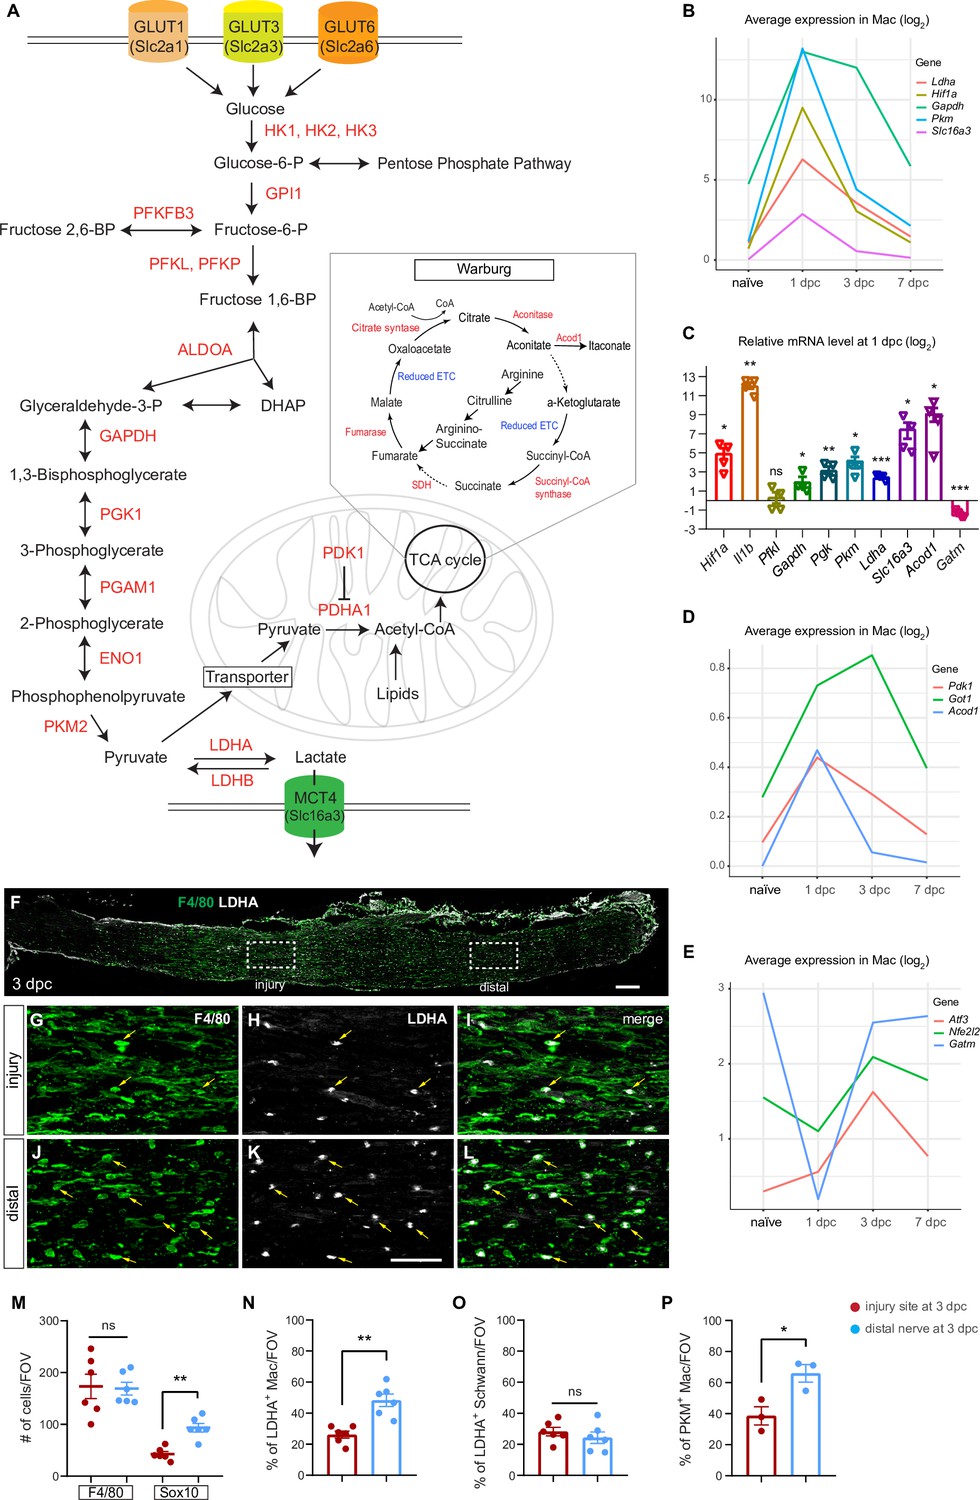
Application of injured sciatic nerve atlas (iSNAT) reveals metabolic reprogramming of immune cells.
Metabolic pathways regulated by peripheral nervous system (PNS) injury. (A) Glycolysis: metabolites and enzymes for the catabolism of glucose into pyruvate and pyruvate to lactate. Glucose-6-phospate is required for nucleotide synthesis through the pentose phosphate pathway. Glycolysis and the pentose phosphate pathway occur in the cytosol. Pyruvate can be metabolized into Acetyl-CoA and enter the tricarboxylic acid (TCA) cycle. The TCA takes place in mitochondria. The Warburg effect allows for rapid ATP production through aerobic glycolysis and fermentation of pyruvate to lactate. The Warburg effect is characterized by limited mitochondrial ATP production because of TCA cycle fragmentation at the conversion of aconitate to α-ketoglutarate and succinate to fumerate, steps marked with dotted arrows. (B) Injury-regulated gene products associated with glycolysis, as inferred by scRNAseq data. Log2 average expression of genes for cells classified as Mac. (C) Quantification of gene expression by qRT-PCR in the 1dpc nerve relative to naïve nerve. Log2-fold changes relative to naïve nerve are shown. Per gene product, n = 4 biological replicates. p-values, *<0.05, **<0.001, ***<0.0001, Student’s t test. ns, not significant. (D, E) PNS injury-regulated gene products associated with inhibition of mitochondrial energy synthesis (D) and inflammation resolution (E), as inferred by scRNAseq data. Log2 average expression of genes for cells classified as Mac. (F) Longitudinal section of 3dpc injured sciatic nerve stained for Mo/Mac (anti-F4/80, green) and LDHA (white), proximal is to the left. Dotted boxes mark regions at the injury site and the distal nerve, respectively. Scale bar, 100 µm. (G–I) Higher magnification view of the dotted box at the injury site. Some F4/80 and LDHA double-positive cells are labeled with arrows (yellow). (J–L) Higher magnification view of distal nerve, dotted box showin in F. box in. Some F4/80 and LDHA double-positive cells are labeled with arrows (yellow). Scale bar (G–L), 50 µm. (M) Quantification of Mo/Mac (F4/80+) and SC (Sox10+) per field of view (FOV) at the 3dpc injury site (red dots) and distal nerve (blue dots). (N–P) Quantification of double labeled cells per FOV at the injury site and distal nerve for (N) LDHA+ Mac (O) LDHA+ SC, and (P) PKM+ Mac. Biological replicates n = 3 with two technical replicates each. Nonparametric independent Student's t tests. *<0.05, **<0.01, GraphPad Prism 9.
Figure 5—figure supplement 1
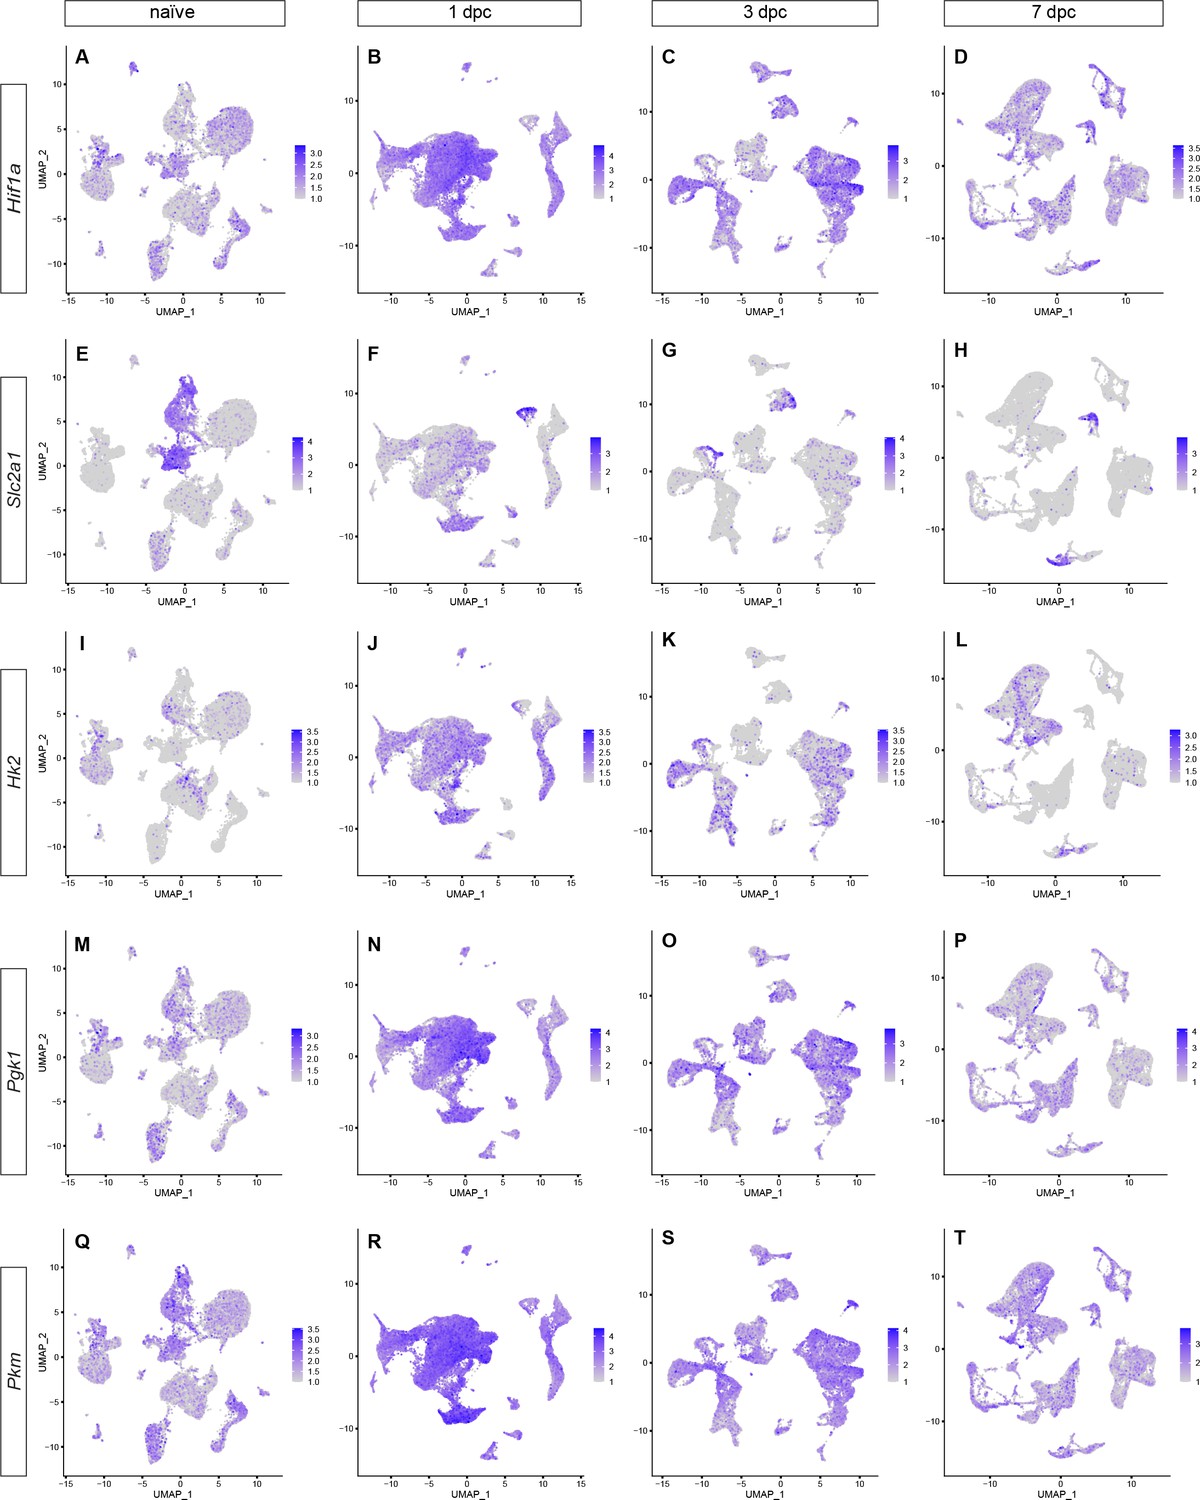
Longitudinal analysis of gene products that regulate glycolysis.
Feature plots showing gene expression in the naïve and crushed sciatic nerve during the first week post injury (1dpc, 3dpc, and 7dpc). (A–D) Hif1a (hypoxia inducible factor 1 subunit alpha), (E–H) Slc2a1 (glucose transporter), (I–L) Hk2 (hexokinase 2), (M–P) Pgk1 (phosphoglycerate kinase 1), and (Q–T) Pkm (pyruvate kinase muscle). Gene product expression, as inferred by scRNAseq data. Expression levels are projected onto the UMAP plot with a minimum expression cutoff of 1.
Figure 5—figure supplement 2
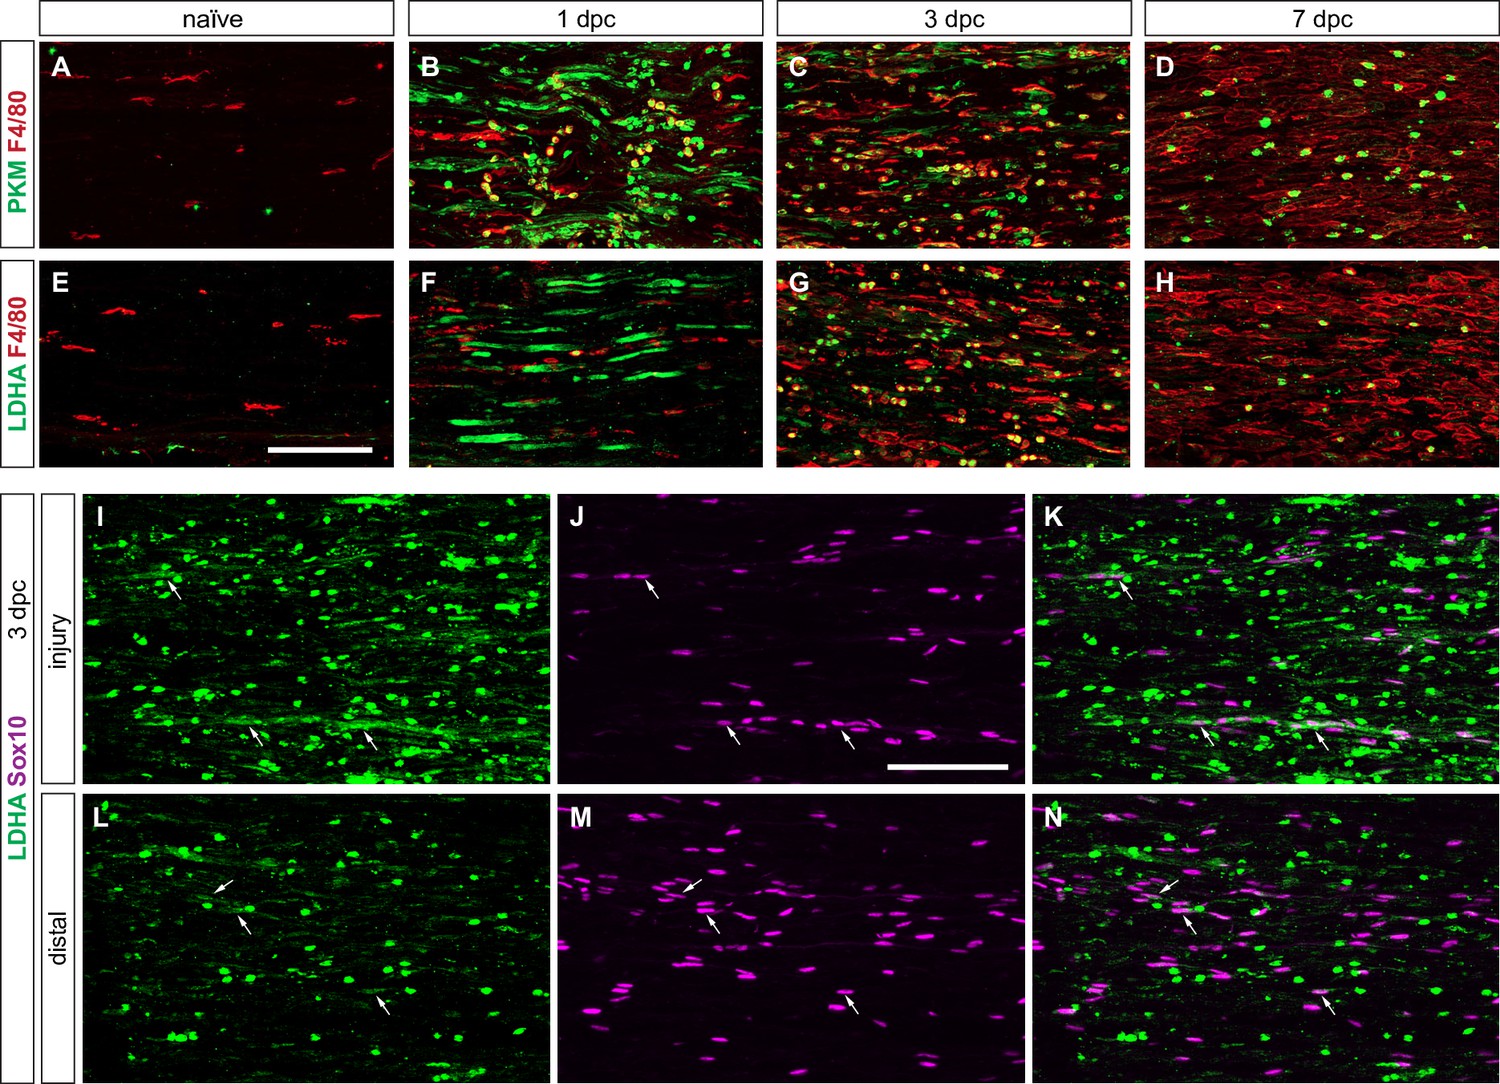
Peripheral nervous system (PNS) injury induces glycolytic macrophages and Schwann cells.
(A–H) Longitudinal sections of naïve and injured sciatic nerves stained for Mo/Mac (anti-F4/80, red). Nerve sections were stained with (A–D) anti-PKM2 (green) and (E–H) anti-LDHA (green). Proximal is to the left. Scale bar, 100 µm. (I–N) Longitudinal nerve sections at 3dpc stained for SC (anti-Sox10, purple) and LDHA (green). The nerve injury site and distal nerve as shown. Scale bar, 100 µm. Representative examples of n = 3 biological replicates.
Figure 6 with 2 supplements
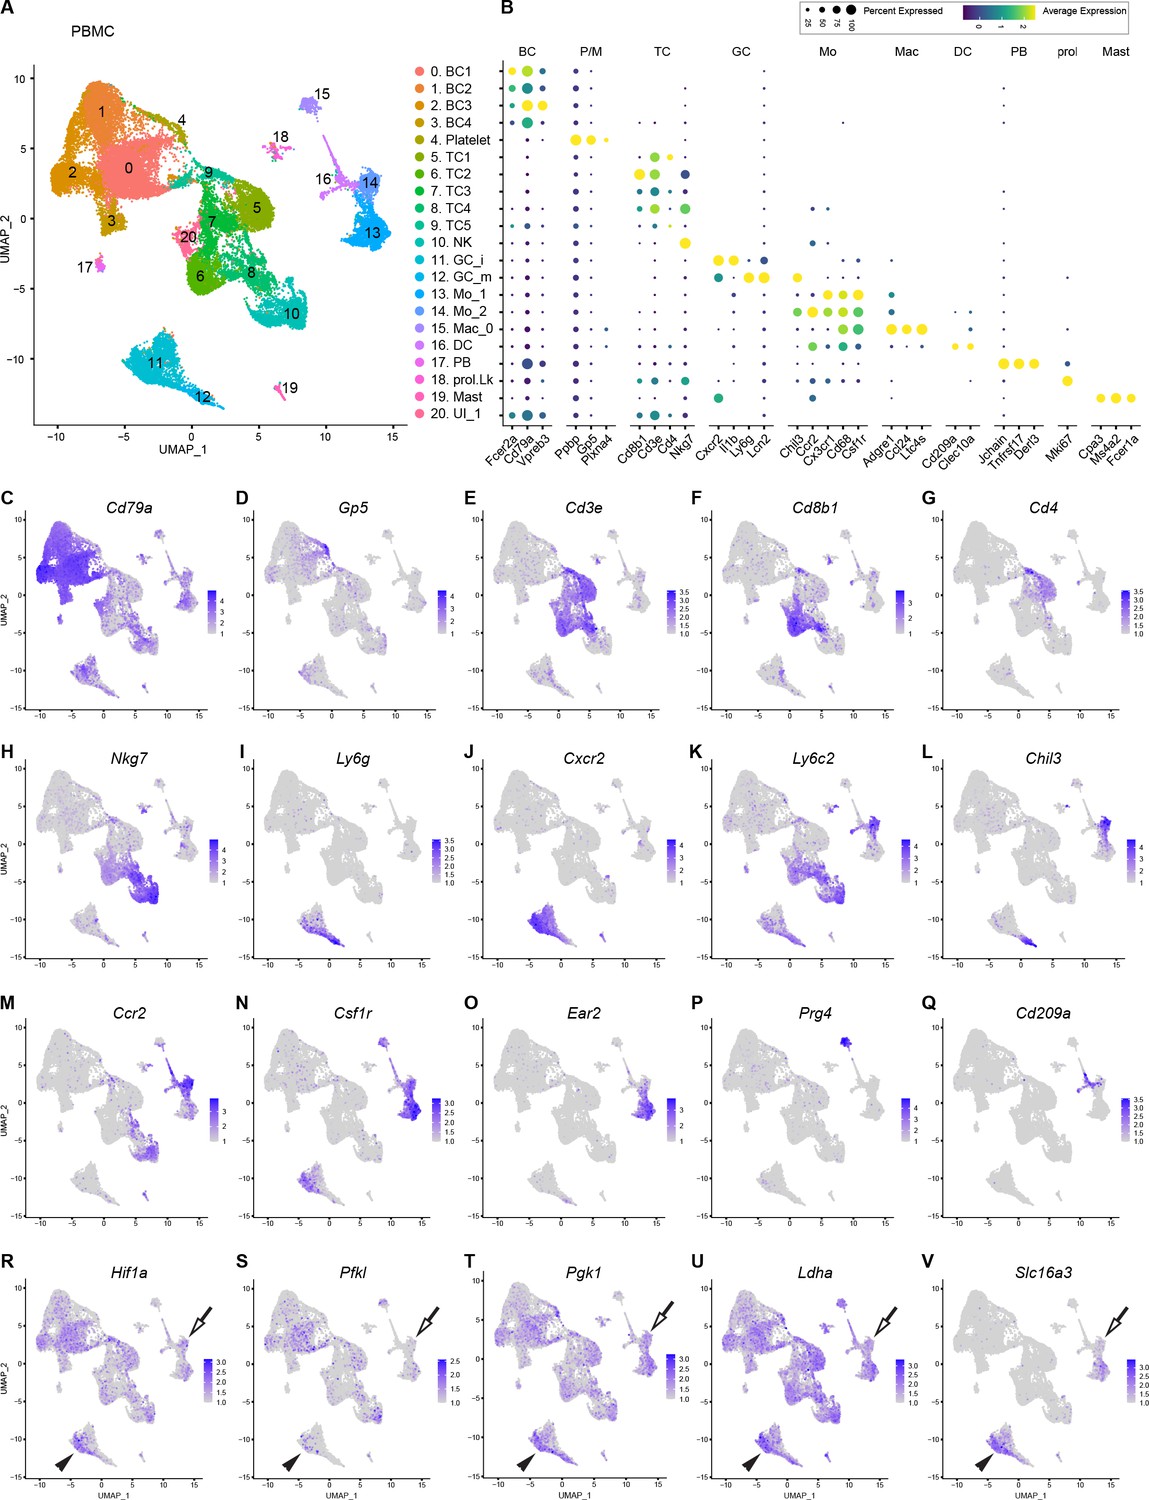
Catalog of peripheral blood mononuclear cells (PBMCs).
(A) Blood was collected by cardiac puncture of naïve mice. UMAP plot embedding of PBMC revealed 20 cell clusters, including B cells (BC1-BC4), Platelets/megakaryocytes (P/M), T cells (TC1-TC5), natural killer cells (NK), immature and mature granulocytes (iGC and mGC), monocytes (Mo_1 and Mo_2), macrophages (Mac_0), dendritic cells (DC), plasma blasts (PB), proliferating leukocytes (prol.Lk), mast cells (MAST), and one cluster with unidentified cells (UI1). A total of 34,386 high-quality PBMC were analyzed (n = 2 replicates). (B) Dotplot with marker genes enriched in PBMC subpopulations. Color-coded expression levels are shown. The dot size reflects the percentage of cells that express the gene. (C–Q) Feature plots of marker gene expression in PBMC used for cell-type identification. Cd79a, CD79A antigen (immunoglobulin-associated alpha); Gp5, glycoprotein V platelet; Cd3e, T cell receptor complex CD3 epsilon subunit; Cd8b1, CD8 antigen beta chain 1; Cd4, CD4 antigen; Nkg7, natural killer cell group 7; Ly6g, lymphocyte antigen 6 complex locus G; Cxcr2, chemokine (C-X-C motif) receptor 2; Ly6c2, lymphocyte antigen 6 complex locus 2, Chil3, chitinase-like 3 (Ym1); Ccr2, chemokine (C-C motif) receptor 2; Csf1r, colony stimulating factor 1 receptor; Ear2, eosinophil-associated ribonuclease A family member 2; Prg4, proteoglycan 4; Cd209a, DC-SIGN (C-type lectin). (R–V) Assessment of PBMC metabolic state. In feature plots classical monocytes (Mo) are labeled with an arrow and immature granulocytes (iGC) with a black arrowhead. Feature plots for Hif1a (hypoxia inducible factor 1 alpha), Pfkl (phosphofructokinase liver type), Pgk1 (phosphoglycerate kinase 1), Ldha (lactate dehydrogenase alpha), and Slc16a3 (lactate exporter) are shown. Expression levels are projected onto the UMAP with a minimum expression cutoff of 1.
Figure 6—figure supplement 1
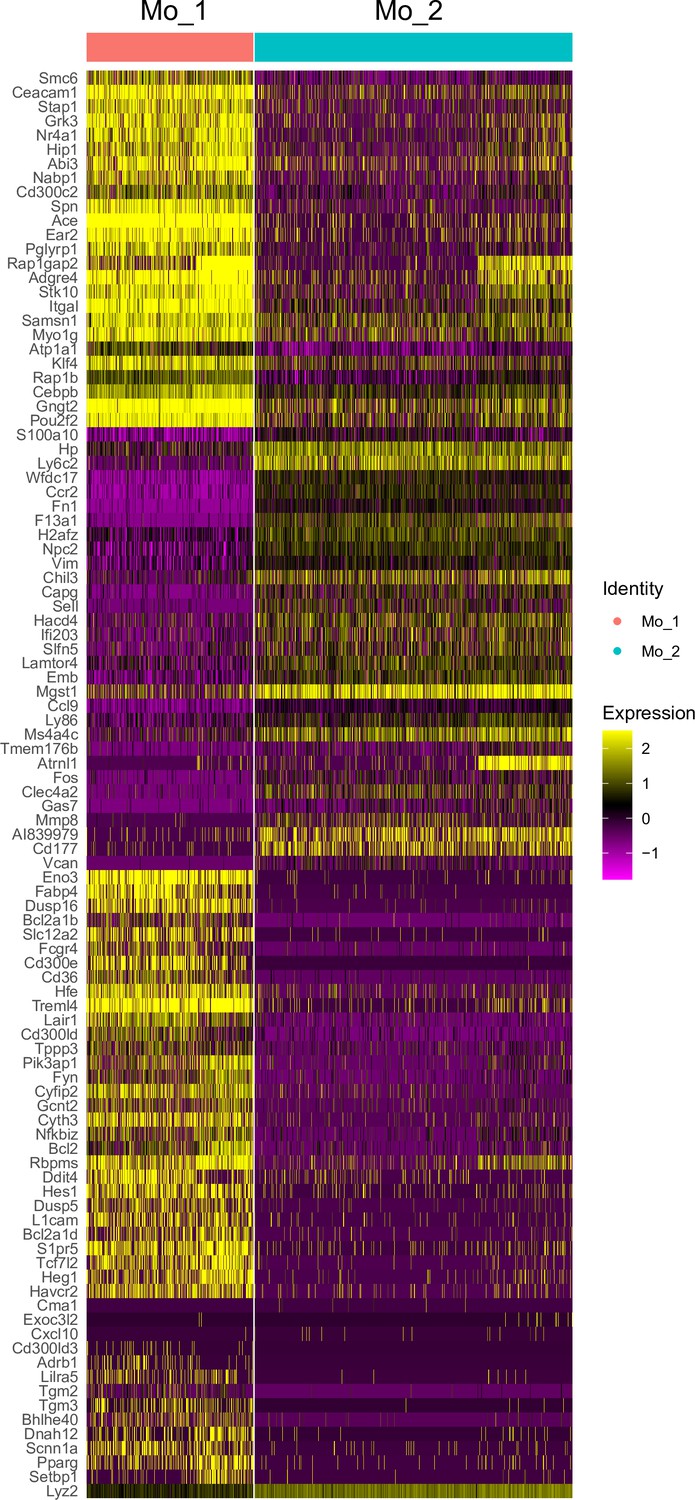
Differential gene expression between patrolling and classical Mo in blood.
A heatmap showing differential gene expression between Mo1 and Mo2 identified by scRNAseq of peripheral blood mononuclear cells (PBMC) obtained from naïve mouse cardiac blood. Hierarchical clustering, expression levels are calibrated to median gene expression. Note: Mo2 show elevated expression of Ly6c2, Chil3, and Hp, markers for classical Mo.
Figure 6—figure supplement 2
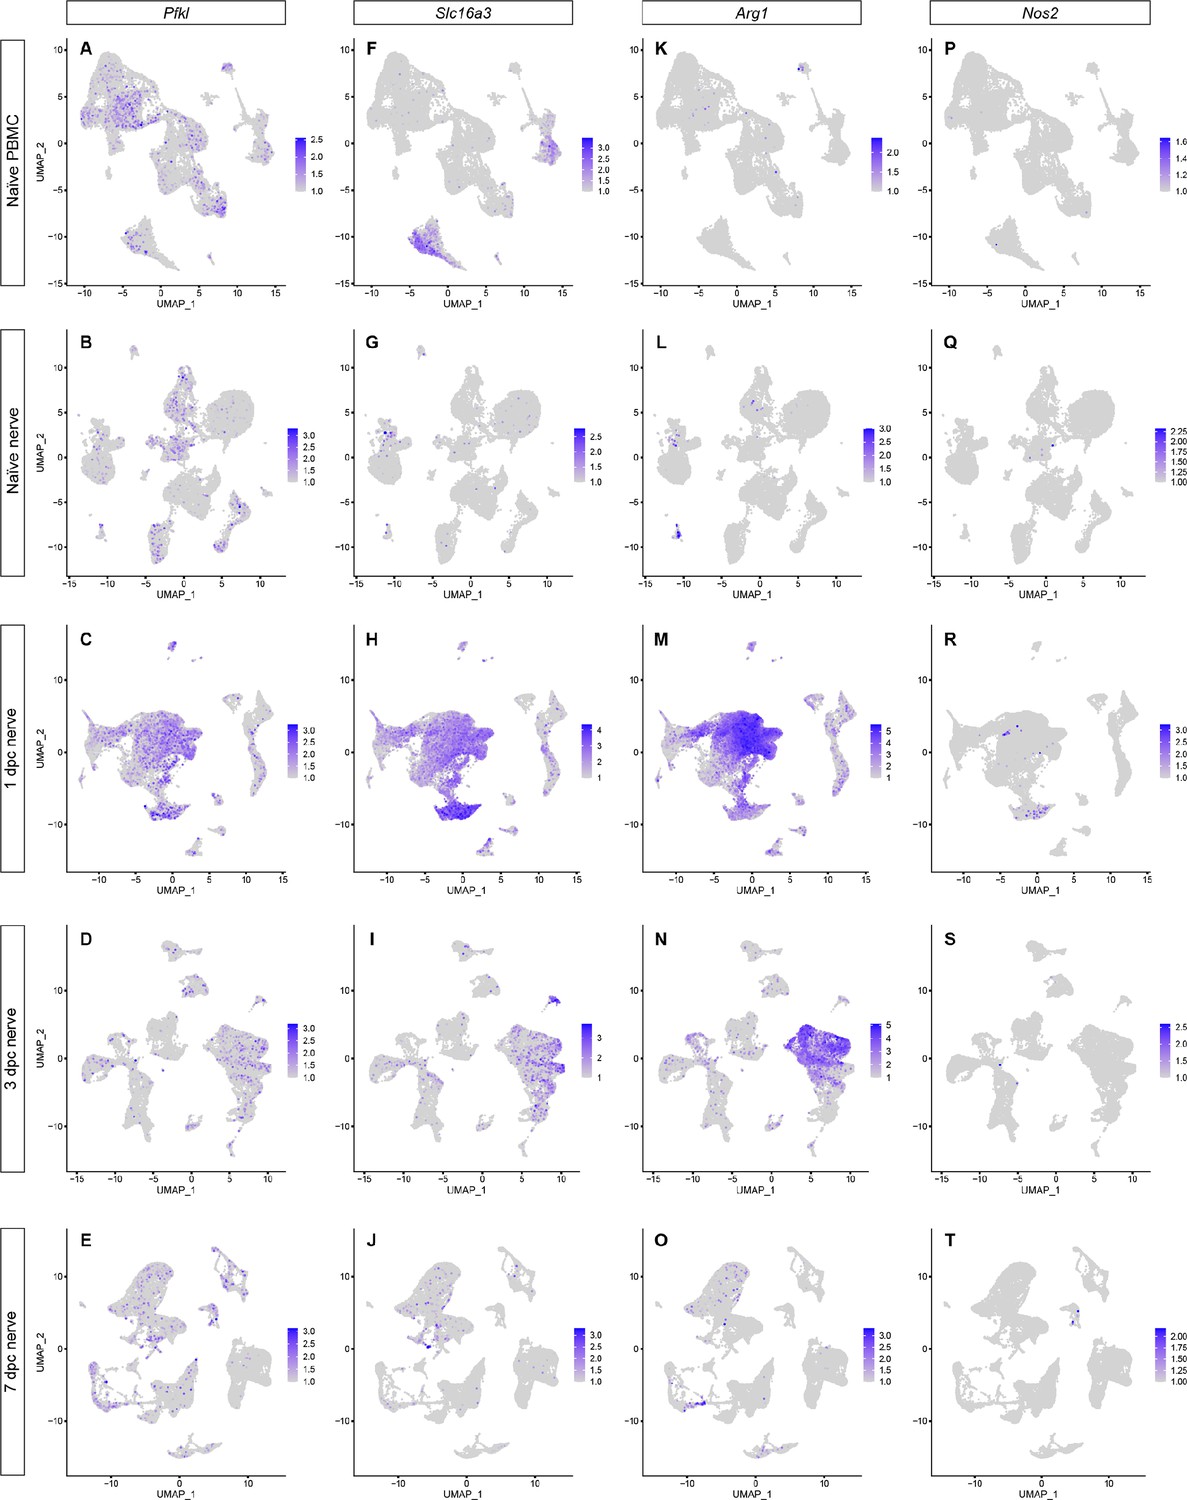
Activation of circulating immune cells upon nerve entry.
Feature plots for the glycolytic enzyme Pfkl (A–E), the monocarboxylate transporter Slc16a3 (F–J), the arginine degrading enzyme Arg1 (K–O), and the NO-producing enzyme Nos2 (P–T) in peripheral blood mononuclear cells (PBMC), naïve nerve, 1dpc, 3dpc, and 7dpc nerve. Color-coded expression levels are shown. Expression levels are projected onto the UMAP with a minimum expression cutoff of 1.
Figure 7 with 4 supplements
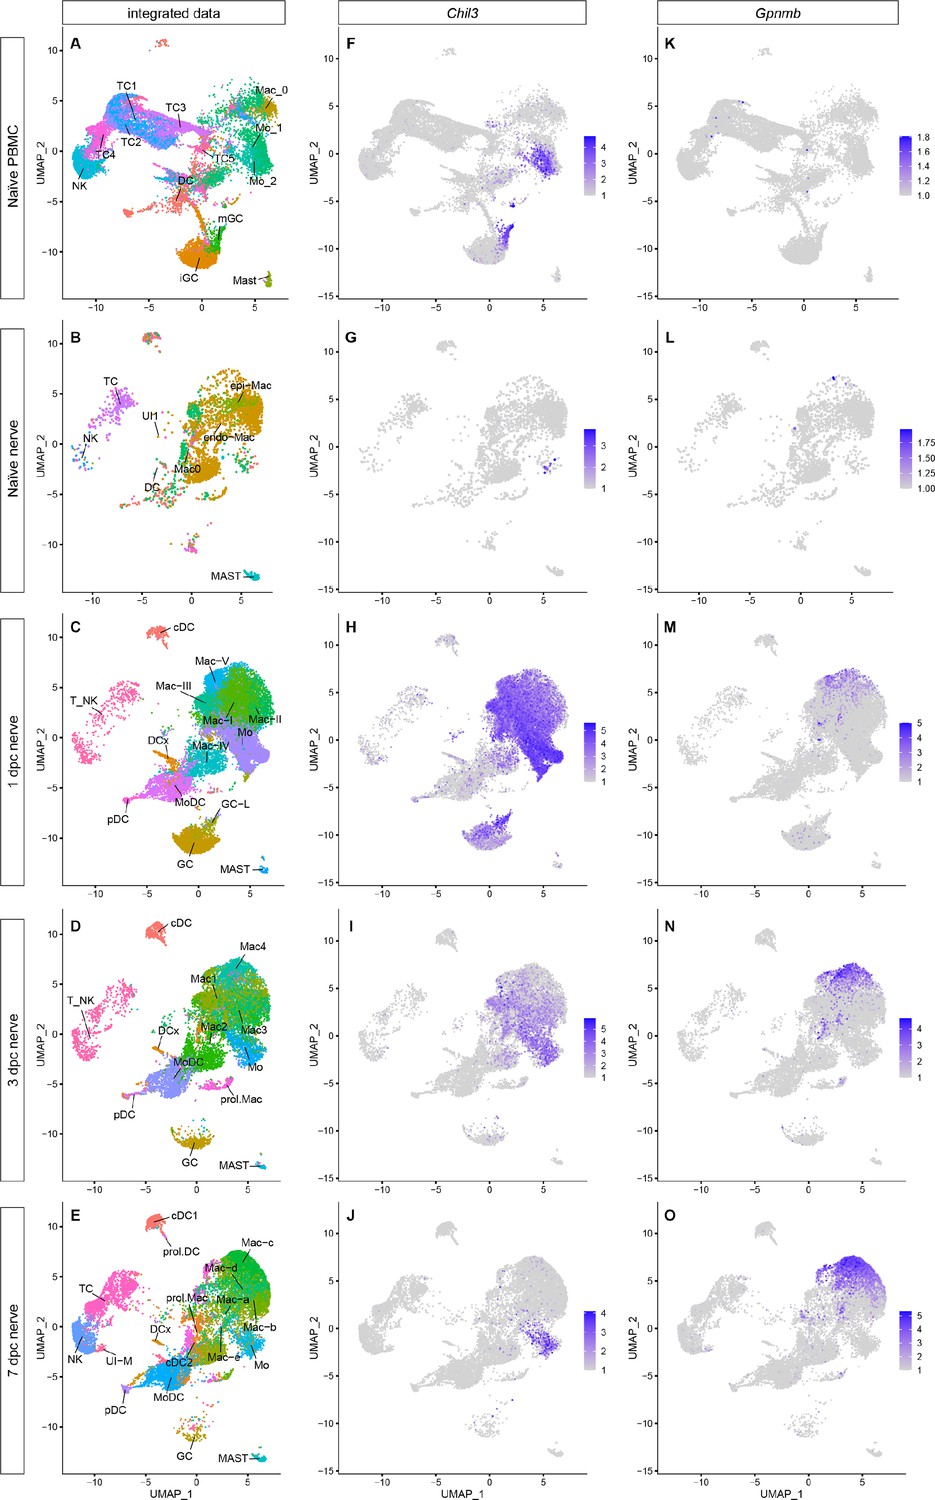
Integrated analysis of single-cell transcriptomes generated from peripheral blood mononuclear cells (PBMC), naïve nerve, and injured nerve.
(A–E) UMAP plots of integrated myeloid cells split into (A) PBMC, (B) naïve sciatic nerve trunk, (C), 1dpc nerve, (D) 3dpc nerve, and (E) 7dpc nerve. (F–J) Integrated analysis of Chil3+ in (F) PBMC, (G) naïve nerve, (H) 1dpc nerve, (I) 3dpc nerve, and (J) 7dpc nerve. (K–D) Integrated analysis of Gpnmb+ Mac in (K) PBMC, (L) naïve nerve, (M) 1dpc nerve, (N) 3dpc nerve, and (O) 7dpc nerve. For feature plots (F–O), expression values are projected onto the integrated UMAP with a minimum expression cutoff of 1. Abbreviations: iGC, immature granulocytes; mGC, mature granulocytes; Mo, monocytes; Mac, macrophages: DC, dendritic cells (MoDC, monocyte-derived DC; cDC, conventional DC; prol.DC, proliferating DC; pDC, plasmocytoid DC; and DCx, homing DC); MAST, mast cells; T_NK, T cells and natural killer cells; TC, T cells; NK, natural killer cells; UI, unidentified cells.
Figure 7—figure supplement 1
Transient upregulation of proinflammatory gene products in the injured sciatic nerve.
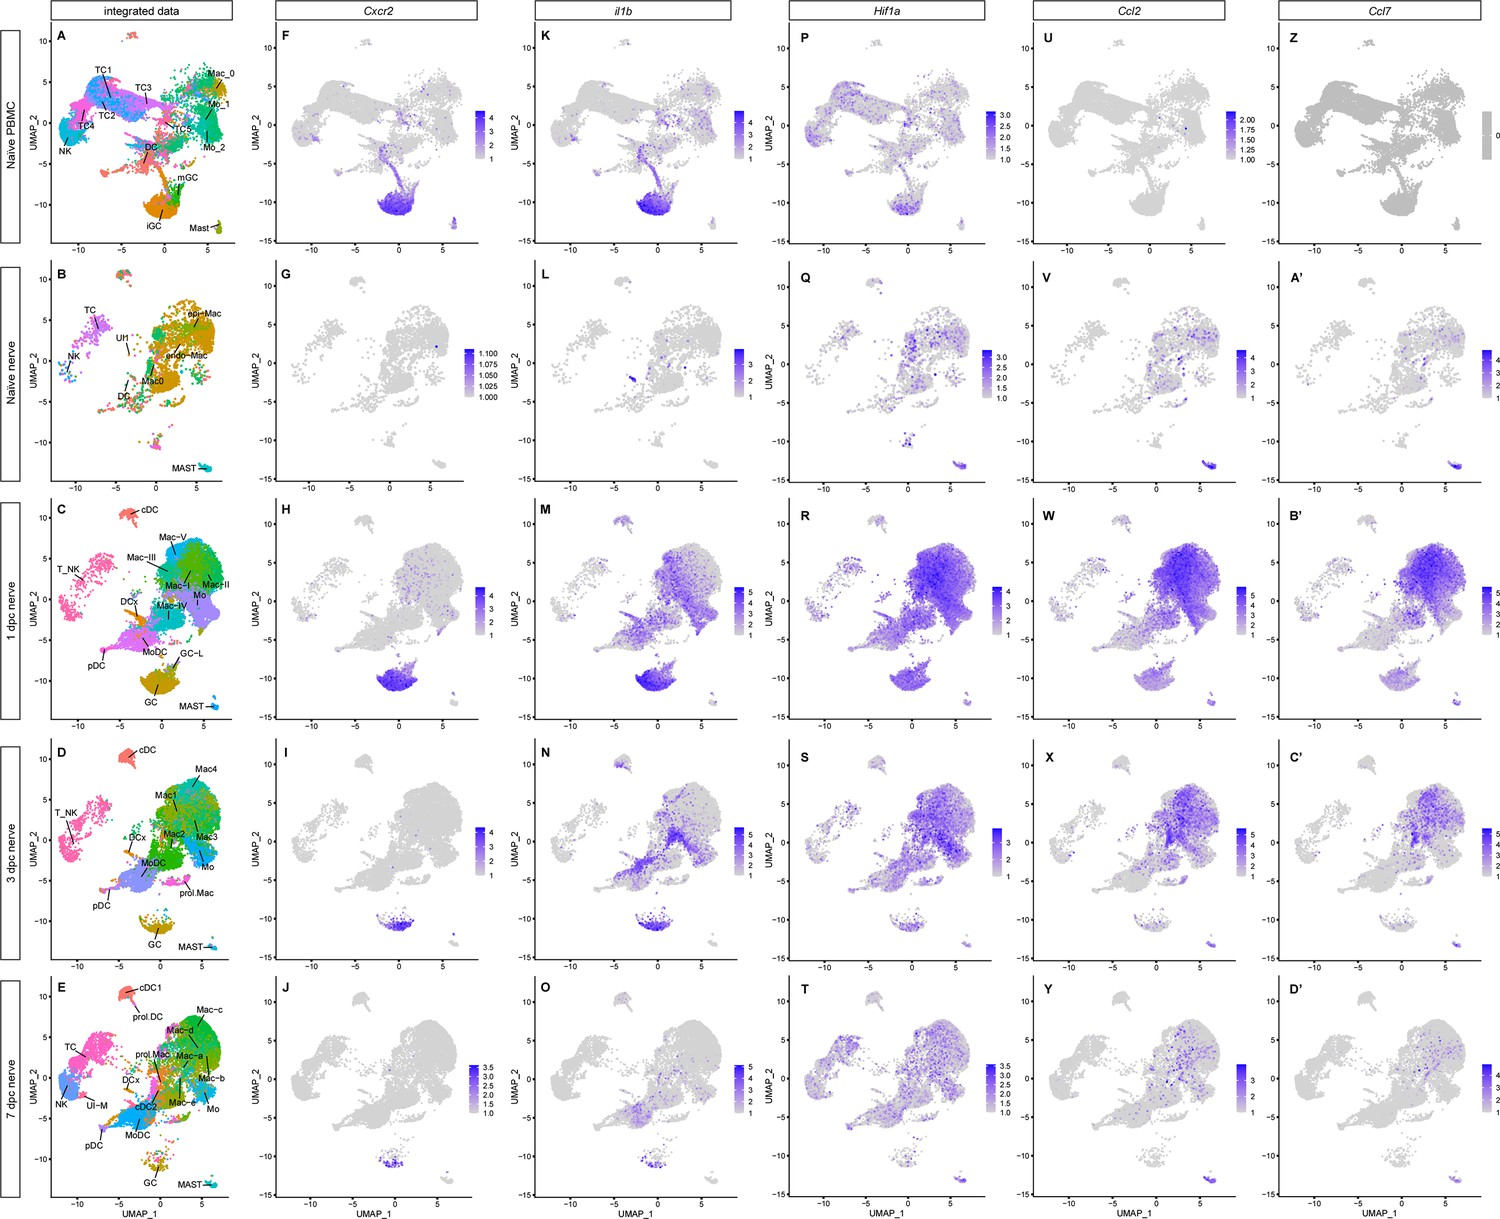
(A–E) UMAP plots of integrated immune cells split into (A) peripheral blood mononuclear cells (PBMC) (of naïve mice), (B) naïve sciatic nerve trunk, (C) 1dpc nerve, (D) 3dpc nerve, and (E) 7dpc nerve. (F–D’) Tracking of temporal changes in Cxcr2+ (F–J), Il1b+ (K–O), Hifa+ (P–T), Ccl2+ (U–Y), and Ccl7+ (Z–D’) expression in immune cells. For all feature plots shown (–-D’), expression values are projected onto the integrated UMAP with a minimum expression cutoff of 1. Abbreviations: GC, granulocytes; Mo, monocytes; Mac, macrophages; DC, dendritic cells (MoDC, monocyte-derived DC; cDC, conventional DC; prol.DC, proliferating DC; pDC, plasmocytoid DC; and DCx, homing DC); MAST, mast cells; TC, T cells and NK, natural killer cells; UI, unidentified cells.
Figure 7—figure supplement 2
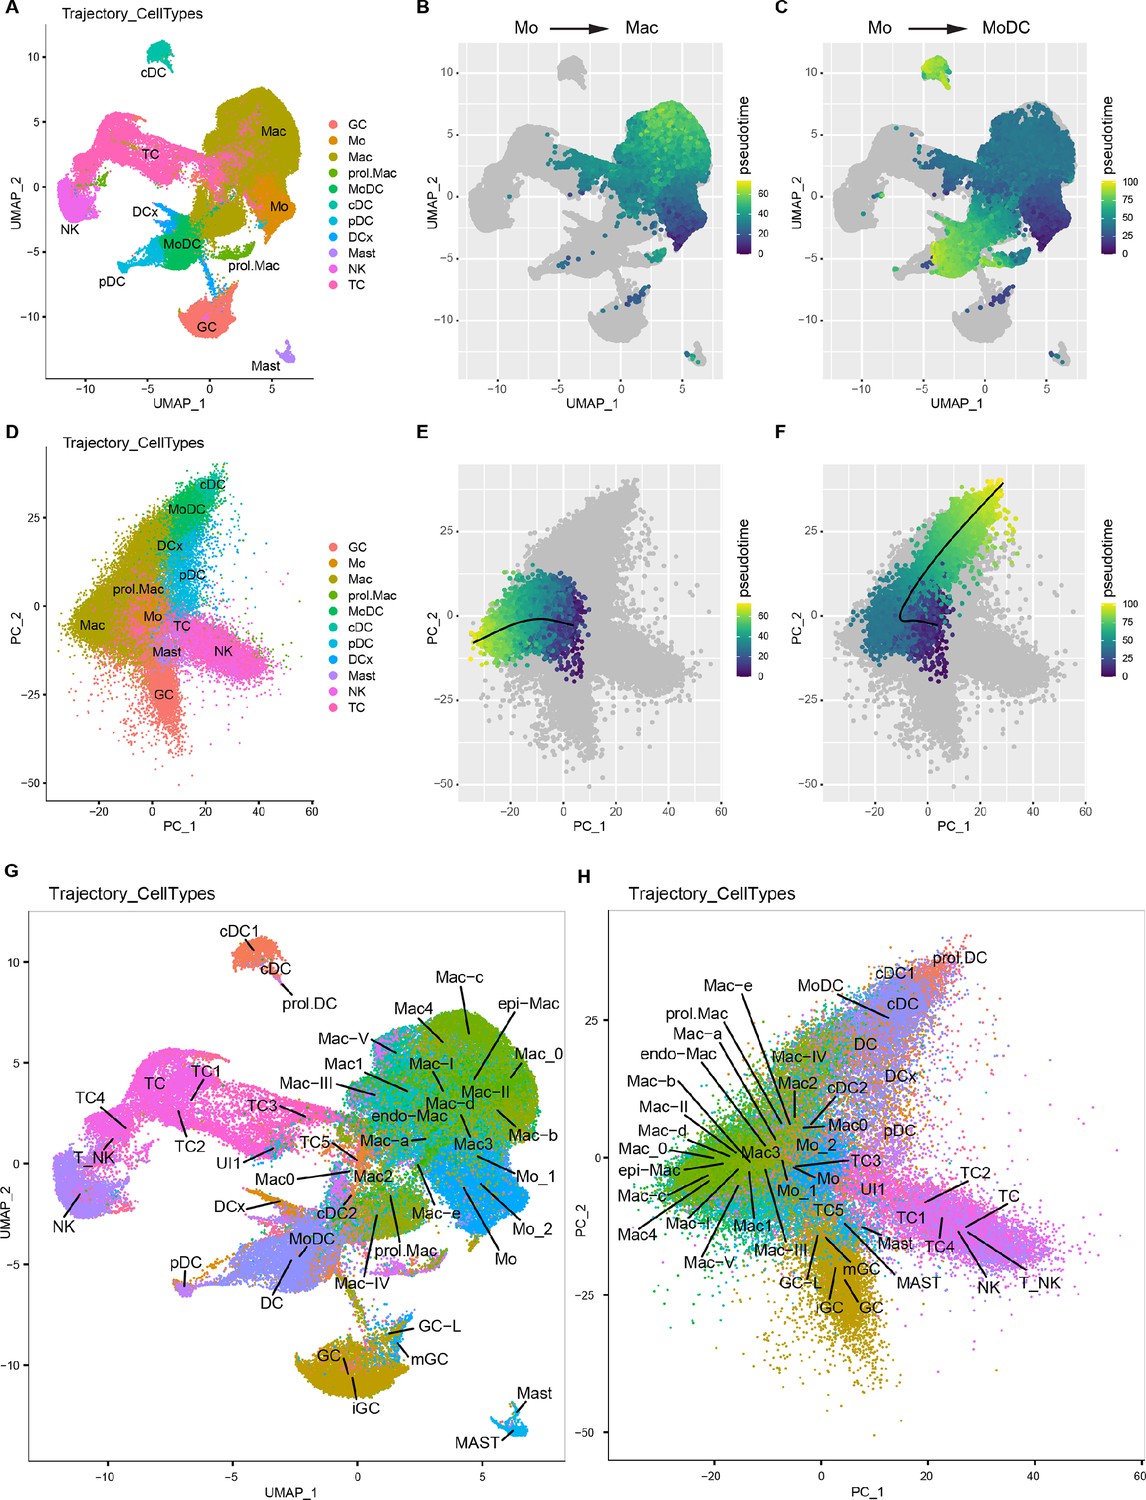
Tracking of myeloid cells before and after entering the injured nerve.
(A–C) UMAP embedding of integrated immune cells with simplified cluster labels. (D) Principal component analysis (PCA) of integrated immune cells using the same cluster labels as in (A). The first four principal components were used as input to SlingShot pseudotime analysis. (B) SlingShot pseudotime, for Mo to Mac trajectory, projected onto the UMAP. (E) Pseudotime projected onto the PCA showing the predicted trajectory, starting from Mo and differentiating toward Mac. (C) A separate trajectory, starting from Mo shows differentiation toward MoDC; pseudotime projected on UMAP. (F) Mo to MoDC pseudotime projected on PCA. (G) Integrated immune cell UMAP embedding with all cluster labels from each time poin analyzed. (H) Integrated immune cells PCA with all cluster labels from each time point analyzed. Abbreviations: GC, granulocytes [iGC and mGC (in blood), GC (1dpc, 3dpc, and 7dpc nerve)], Mo, monocytes [Mo_1 and Mo_2 (blood), Mo (1dpc, 3dpc, and 7dpc nerve)], Mac, macrophages [endo-Mac and epi-Mac (naïve nerve), (Mac-I, Mac-II, Mac-III, Mac-IV), Mac-V (1dpc nerve), Mac1, Mac2, Mac3, Mac4 (3dpc nerve), Mac-a, Mac-b, Mac-c, Mac-d, Mac-e (7dpc nerve)], MoDC (monocyte-derived dendritic cells), cDC (conventional dendritic cells), pDC, plasmacytoid dendritic cells, DCx (mature dendritic cells), DC (dendritic cells in blood), Mast (mast cells), TC (T cells), NK (natural killer cells), UI (unidentified).
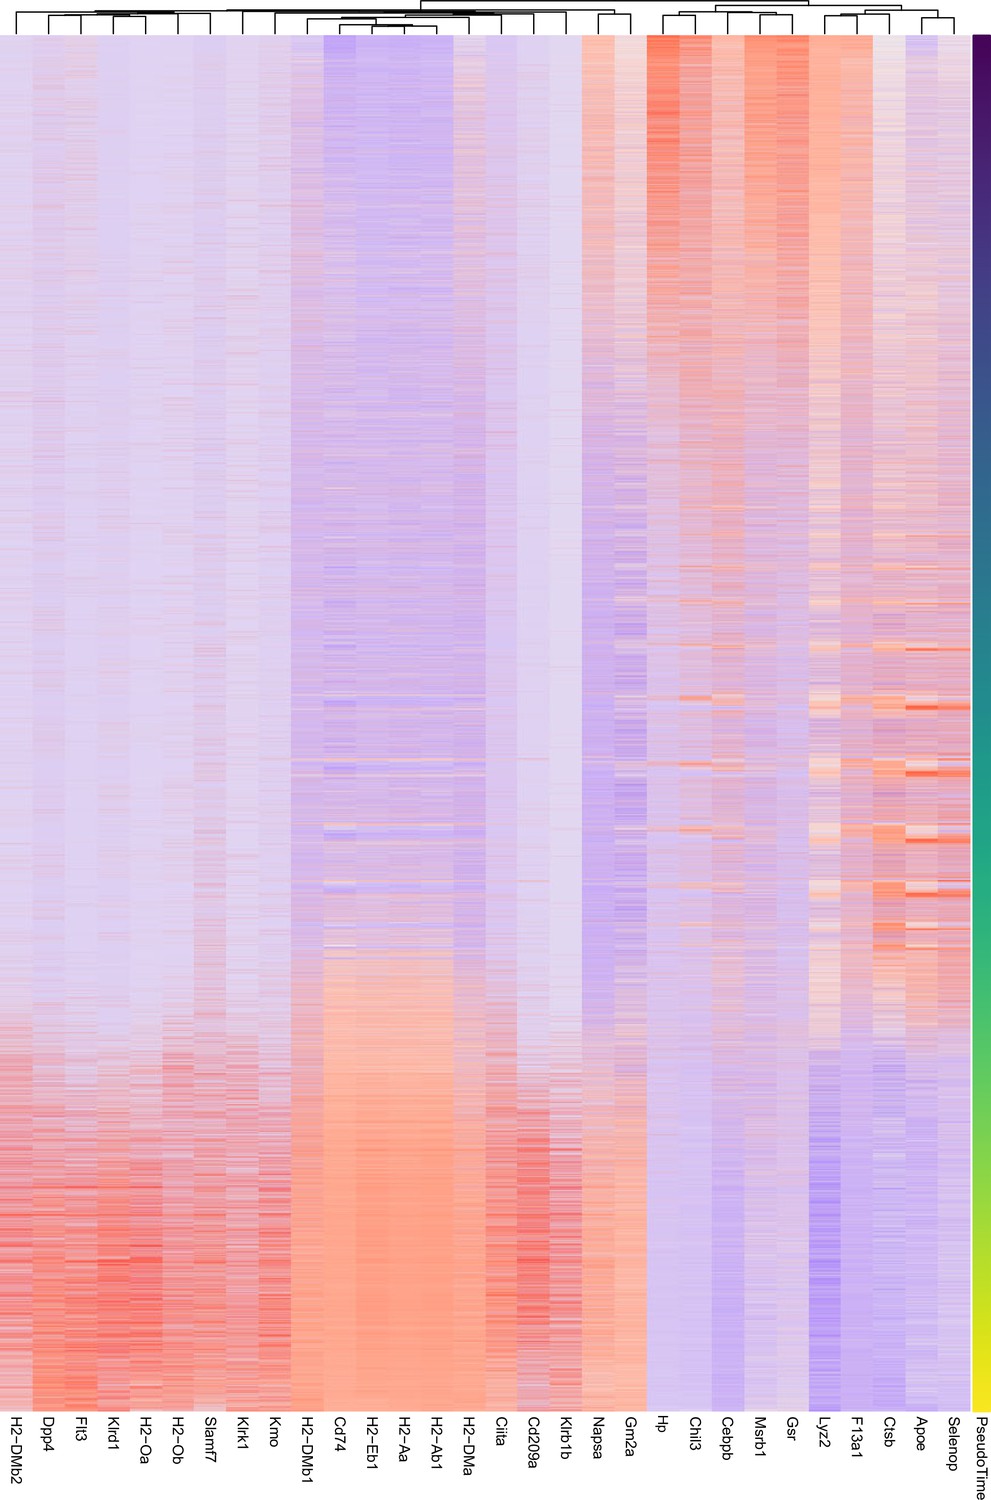
Figure 7—figure supplement 3
Heatmap showing the top 30 genes by importance in predicting pseudotime (Figure 7—figure supplement 2E) as determined by random forest analysis.
Colors represent the z-score calculated across genes.
Figure 7—figure supplement 4
Heatmap showing the top 30 genes by importance in predicting pseudotime (Figure 7—figure supplement 2F) as determined by random forest analysis.
Colors represent the Z-score calculated across genes.
Figure 8 with 1 supplement

Spatial differences in the immune landscape of the injured sciatic nerve.
(A) Schematic of workflow for analysis of wound tissue at the site of nerve injury and distal nerve tissue. Cartoon of a mouse lumbar spinal cord, dorsal root ganglia (DRGs), and major branches of the sciatic nerve. Nerve segments ~3 mm in length (injury or distal), marked with blue brackets, were harvested separately. Innate immune cells were captured with anti-CD11b magnetic beads and analyzed by scRNAseq. (B) UMAP plot of sciatic nerve myeloid cells captured at the injury site (left) and the distal nerve (right) at 3dpc. A total of 17,404 high-quality cells were subjected to unsupervised Seurat-based clustering, resulting in 13 cell clusters. (C) Bar graph of population size at the injury site versus distal nerve for 3d injured nerve immune cells. (D, E) Feature plots for Arg1 at 3dpc showing injury site and distal nerve (F, G). Feature plots for Cd38 at 3dpc showing injury site and distal nerve. Expression levels are color coded and calibrated to average gene expression. (H, I) Projection of the 3dpc 'whole nerve' reference data onto cells at the 3dpc injury site (H) and 3dpc distal nerve (I) onto 3dpc 'whole nerve' reference data. The y-axis shows the prediction score for each cell’s top predicted cell population. The number of cells assigned to each population is shown on top. (J, K) Quantification of gene expression by qRT-PCR in the 3d injured nerve injury site versus distal nerve (n = 3). p-values, *<0.05, **<0.001, ***<0.0001, Student’s t test. ns, not significant. (L) Longitudinal sections of naïve sciatic nerve stained for Gpnmb expression by RNAscope. (M) Longitudinal sections of 3d injured nerve stained for Gpnmb expression by RNAscope, proximal is to the left. Sections were counterstained with Hoechst. High power images of injury site (M’) and distal nerve (M’’) are shown. Scale bar: 200 μm (L, M’’).
Figure 8—figure supplement 1
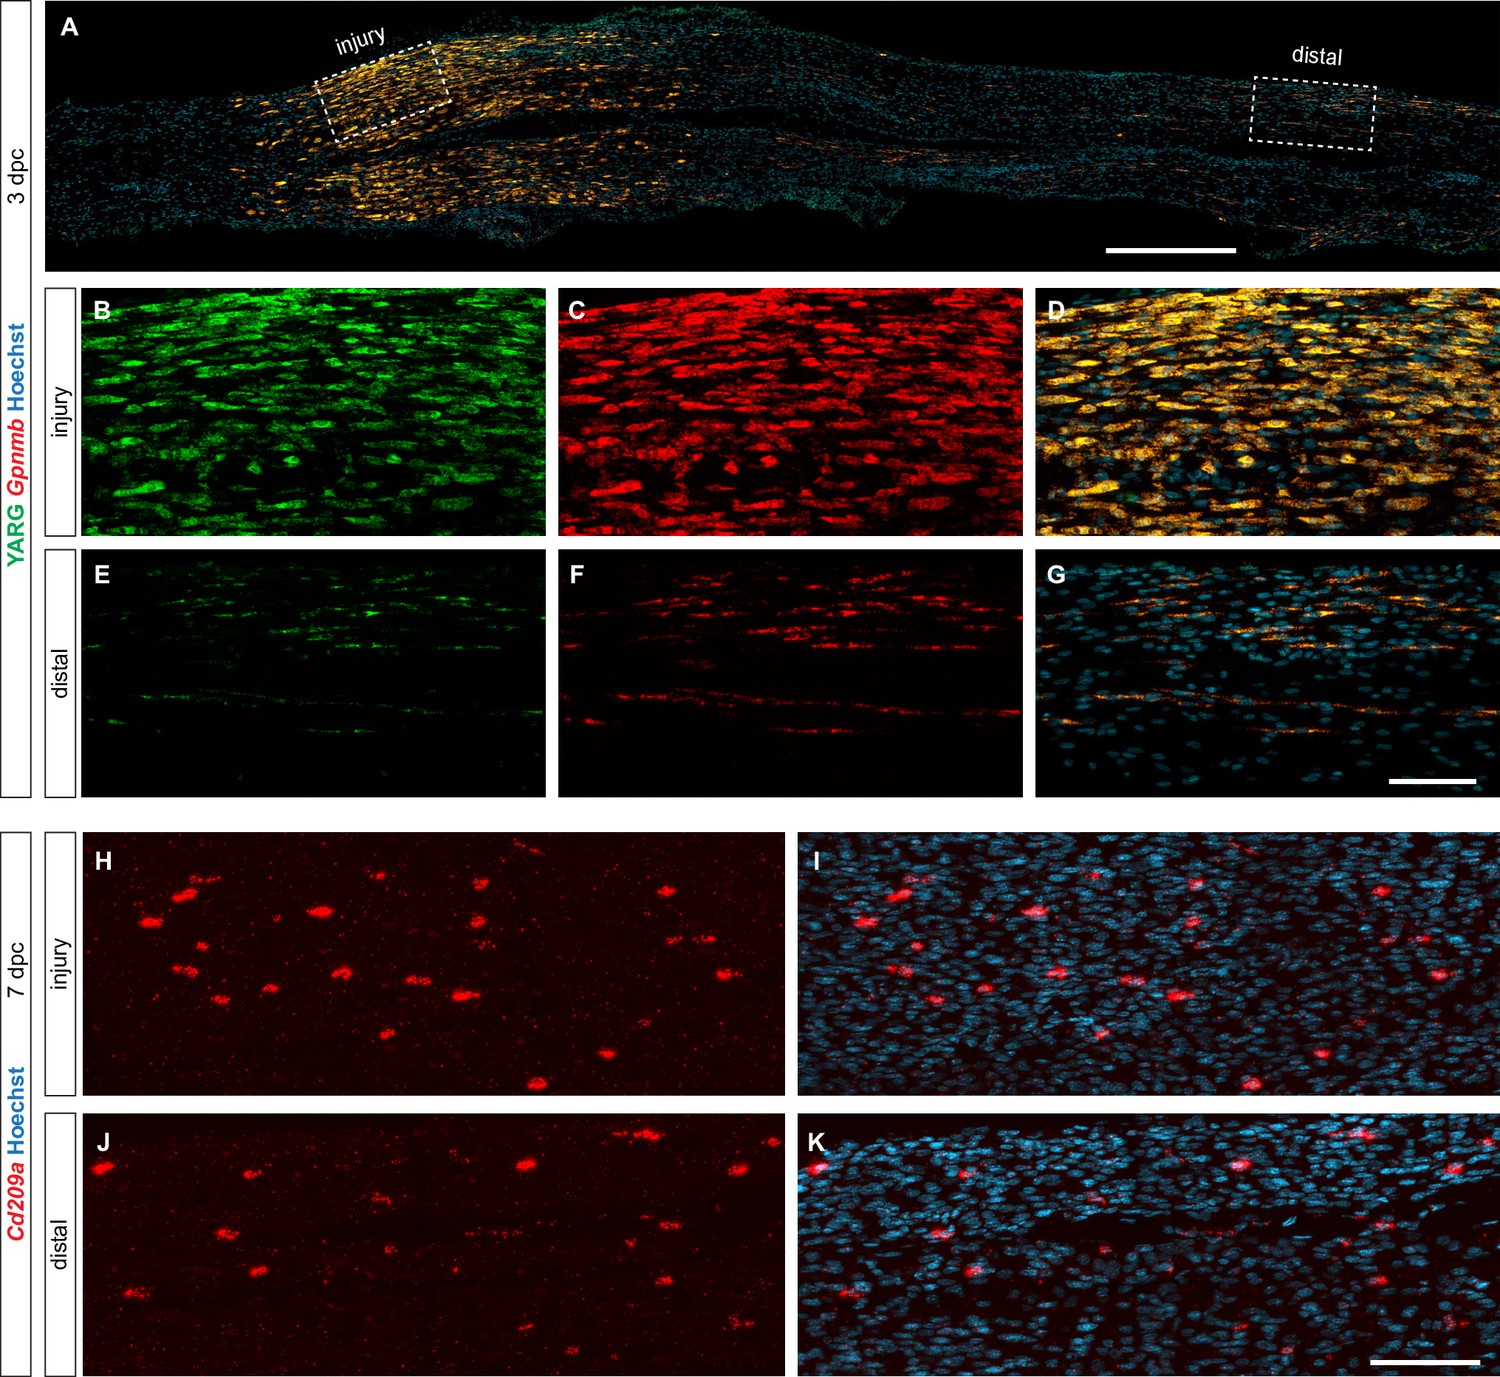
Location-specific distribution of Mac subpopulations in the injured sciatic nerve.
(A) Longitudinal section through 3dpc sciatic nerve trunk of Arg1-YFP (YARG) reporter mice, co-labeled for Gpnmb mRNA expression by RNAscope. Proximal is to the left. Boxes marked with dotted lines show regions at the injury site and within the distal nerve. Scale bar, 150 µm. (B–D) Higher magnification view of box at the injury site shown in (A). (B) Cells labeled green express the YFP under the Arg1 promoter, (C) cells labeled red are stained for Gpnmb transcript by RNAscope, and (D) cells labeled yellow show co-expression of Arg1 and Gpnmb. (E–G) Higher magnification view of dotted box in the distal nerve shown in (A). (E) Cells labeled green express the YFP under the Arg1 promoter, (F) cells labeled red are stained for Gpnmb transcript by RNAscope, and (G) cells labeled yellow show co-expression of Arg1 and Gpnmb. Scale bar, 50 µm. (H–K) Longitudinal section through 7dpc sciatic nerve trunk. MoDC are visualized by RNAscope with a probe specific for Cd209a. Nuclei are stained with Hoechst dye. (H, I) show nerve injury site. (J, K) show distal nerve. Scale bar, 50 µm.
Figure 9 with 1 supplement
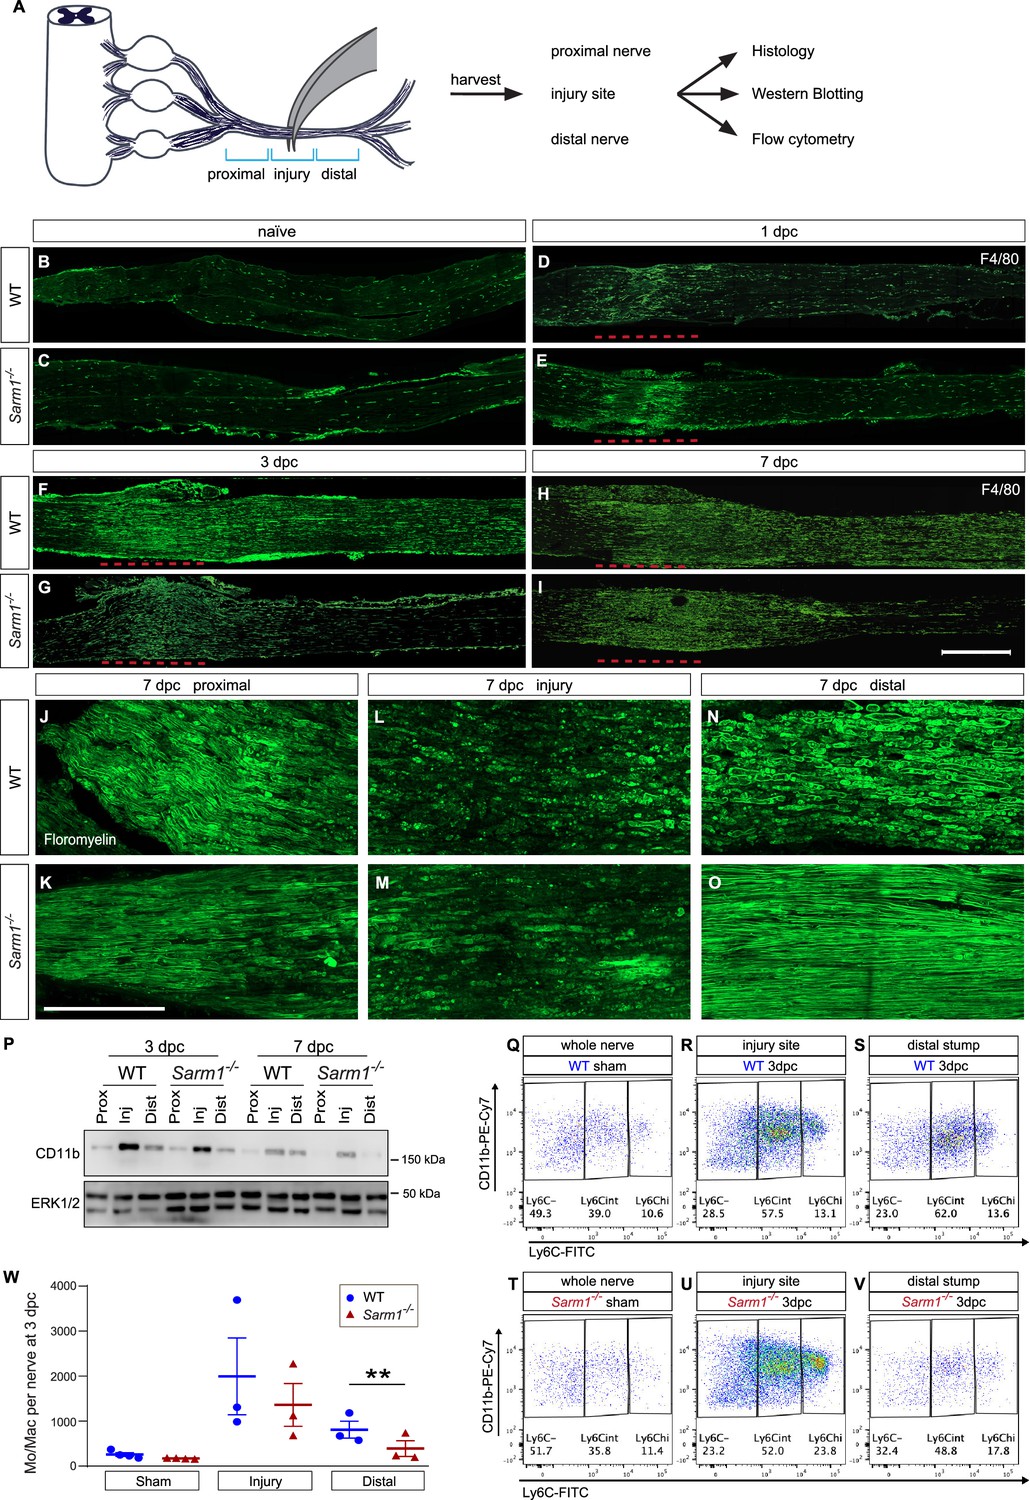
Nerve trauma causes Wallerian degeneration (WD)-independent nerve inflammation.
(A) Cartoon of a mouse lumbar spinal cord, dorsal root ganglia (DRGs), and major branches of the sciatic nerve. A nerve injury divides the nerve trunk into a proximal segment, the injury site, and distal segment, each marked with blue brackets. Nerve segments were harvested and subjected to analysis. (B–I) Longitudinal sciatic nerve sections from WT and Sarm1-/- mice, stained with anti-F4/80 for identification of Mac. Representative examples of (B, C) naïve nerve, (D, E), 1dpc (F, G), 3dpc, and at (H, I) 7dpc. Injury site is marked with a dashed red line, proximal is to the left. Scale bar, 500 µm. (J–O) Longitudinal sciatic nerve sections from WT and Sarm1-/- mice at 7dpc, stained with fluoromyelin. Representative images of proximal nerve, the injury site and distal nerve are shown. Scale bar, 200 µm. (P) Western blots of sciatic nerve segments collected at 3dpc and 7dpc from WT and Sarm1-/- mice. Nerves were divided into proximal, injury site, and distal segments and blots probed with anti-CD11b, and anti-ERK1/2. (Q–V) Flow cytometry dotplots for Mo/Mac of sham-operated WT and Sarm1-/- sciatic nerve trunks, the 3dpc nerve injury site and distal nerve. (W) Quantification of Mo/Mac (Ly6Chi + Ly6Cint + Ly6C-) in sham-operated mice, the 3dpc injury site, and 3dpc distal nerve of WT and Sarm1-/- mice. N = 3, with 3–5 mice per genotype per replica. Flow data are represented as mean ± SEM. Statistical analysis was performed in GraphPad Prism (v9) using two-way, paired t-test. **p<0.01.
-
Figure 9—source data 1
Western blots (LiCOR) of sciatic nerve segments probed with anti-CD11b and anti-Erk1/2.
- https://cdn.elifesciences.org/articles/80881/elife-80881-fig9-data1-v2.zip
Figure 9—figure supplement 1
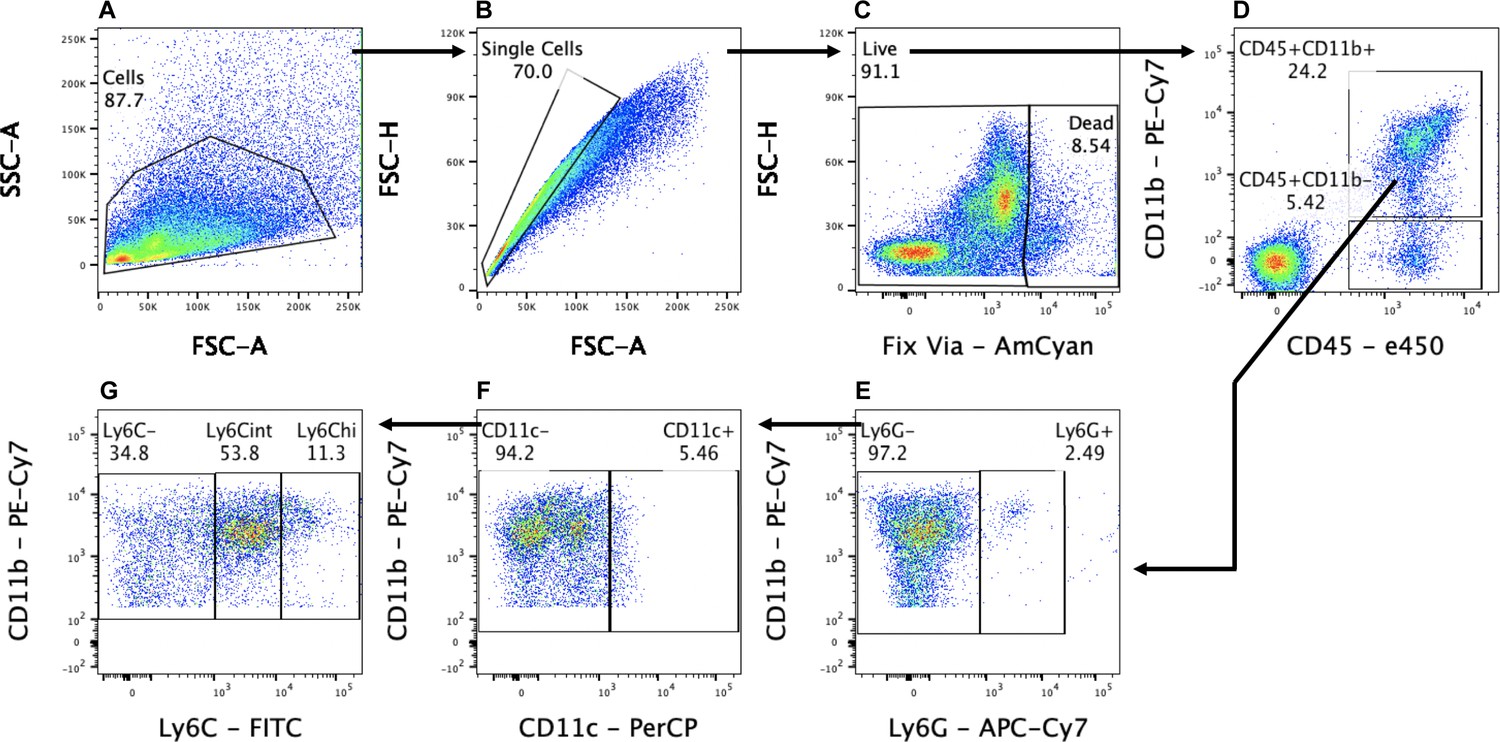
Gating strategy for flow cytometry.
(A) Cells were first gated with forward scatter (FSC-A) and side scatter (SSC-A) to exclude debris. (B) Cells were then gated with forward scatter height (FSC-H) and FSC-A to find single cells and to exclude doublets. (C) Live cells were isolated by negative staining for fixed viability dye (Fix Via). (D–G) Leukocytes (D) were analyzed as follows: lymphocytes were isolated as CD45+, CD11b-. Myeloid cells (CD45+, CD11b+) were further separated into Ly6G+ granulocytes (E). The remaining cells (CD45+, CD11b+, Ly6G-) were characterized as DC (F) (CD45+, CD11b+, CD11c+, Ly6G-), and Mo/Mac (G) (CD45+, CD11b+, CD11c-, Ly6G-) and further analyzed for Ly6C surface expression.
Figure 10 with 1 supplement
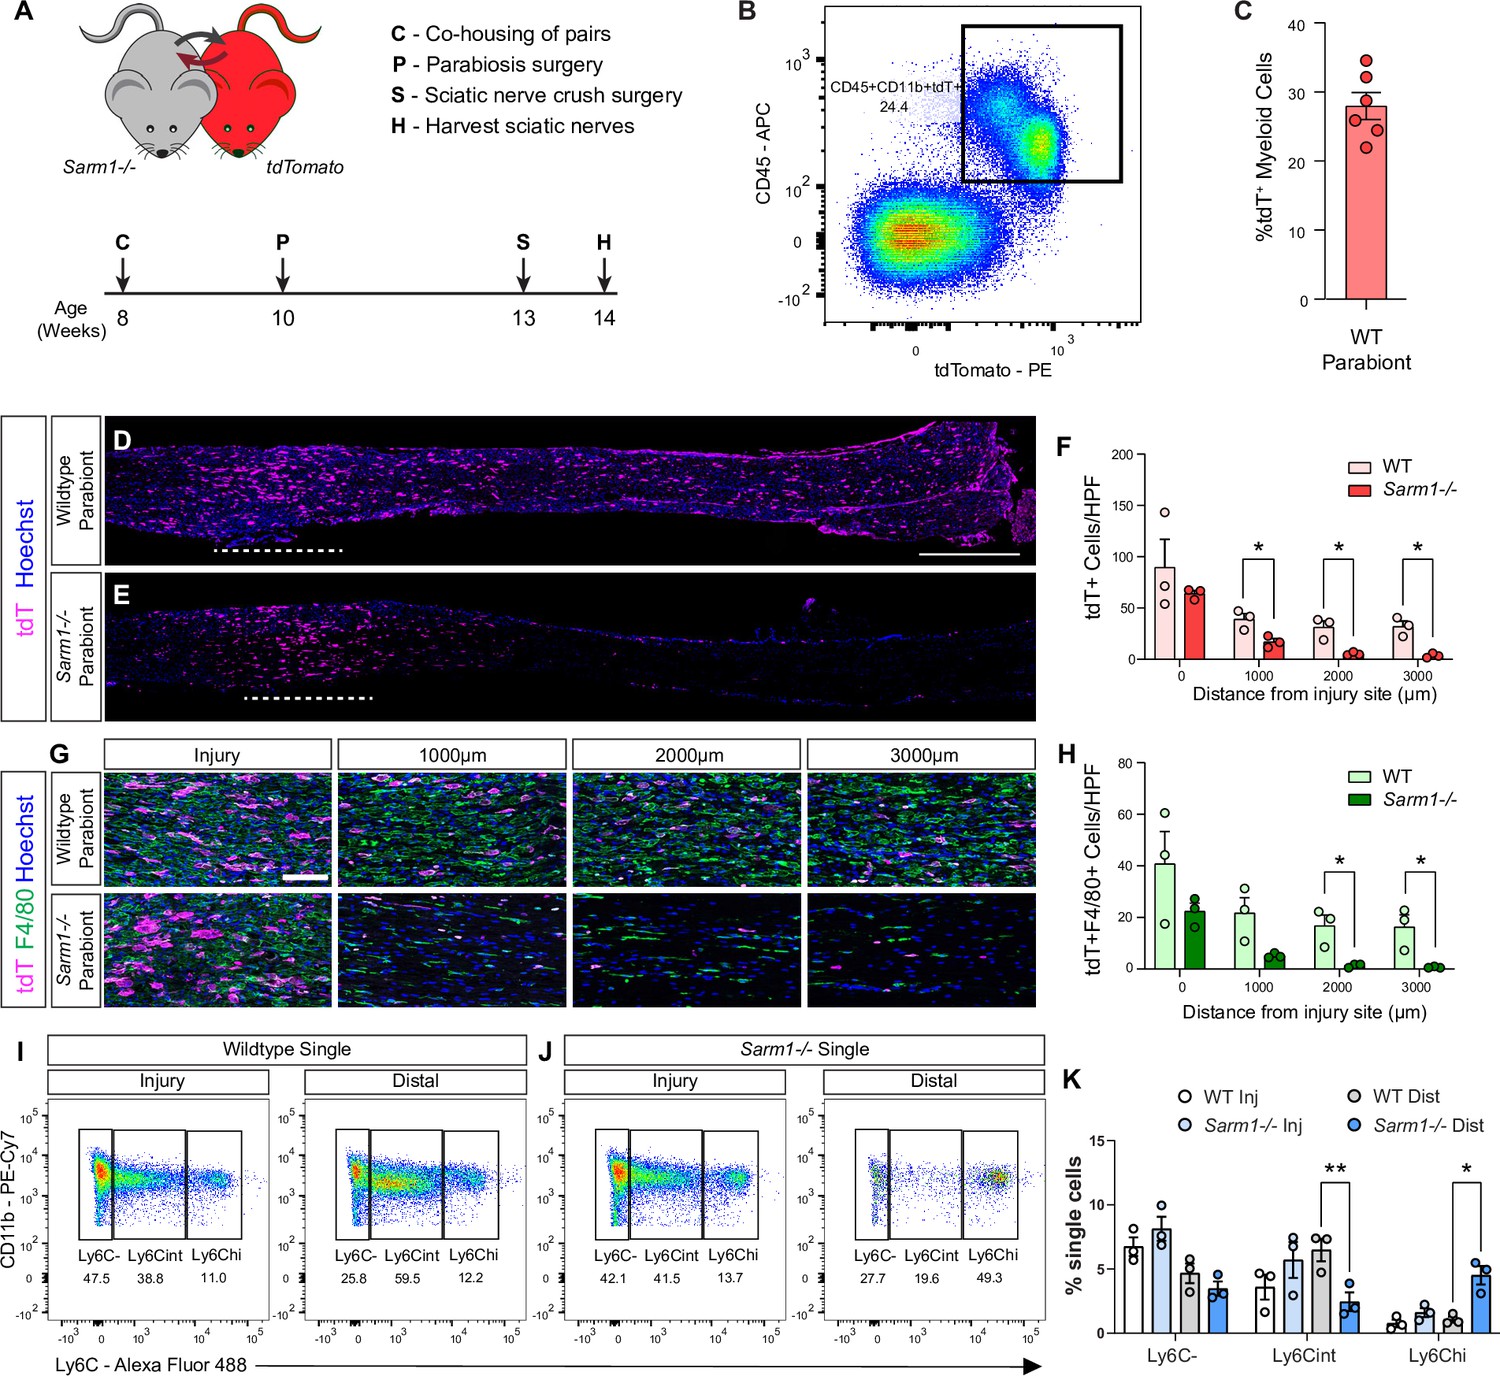
Evidence for Wallerian degeneration (WD)-dependent and WD-independent nerve inflammation.
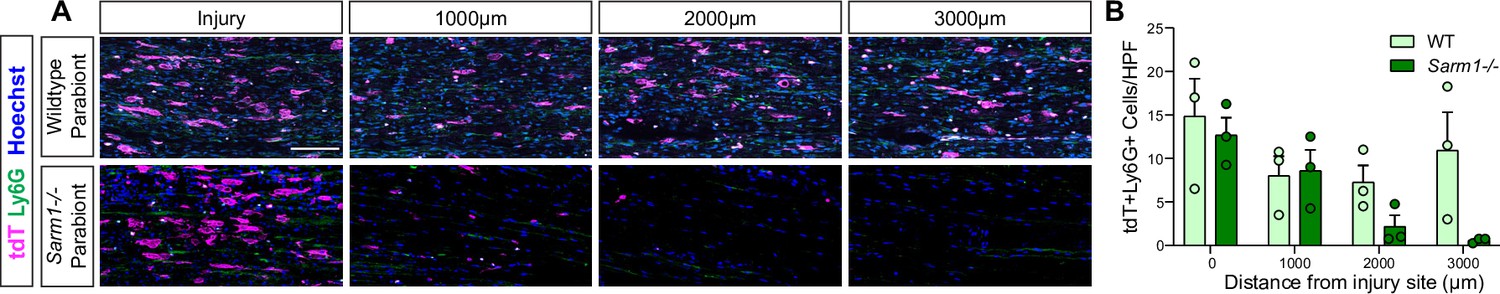
(A) Timeline for parabiosis experiments. After a 2-week co-housing period, 10-week-old WT or Sarm1-/- and tdTomato mice were surgically paired. (B) To assess chimerism, blood was harvested and analyzed by flow cytometry. Dotplot of tdT+ myeloid cells (CD45+CD11b+) is shown. (C) Quantification of tdT+ myeloid cells in host parabionts (n = 6), revealed chimerism of 28 ± 2%. (D, E) Bilateral SNC was performed 3 weeks after pairing and tissue harvested at 7dpc. Longitudinal sciatic nerve sections from (D) WT and (E) Sarm1-/- parabionts showing infiltrating tdT+ leukocytes (magenta). Nuclei (blue) were labeled with Hoechst dye. The nerve crush site is marked by the white dashed line, proximal is to the left. Scale bar, 500 μm. (F) Quantification of tdT+ cells per high power field (HPF, 500 μm × 250 μm) at the injury site (0 μm) and at 1000, 2000, and 3000 μm distal to the injury site. The average cell number ± SEM is shown, n = 3 mice per genotype, average of four HPF per two nerves. Student’s t test, *p<0.05. (G) HPF of sciatic nerves from WT and Sarm1-/- parabionts 7dpc taken from the injury site, 1000, 2000, and 3000 μm distal to the injury site showing infiltrating tdT+ leukocytes (magenta), F4/80+ macrophages (green), and nuclei (blue). Scale bar, 100 μm. (H) Quantification of tdT+F4/80+ cells per HPF ± SEM at indicated distances distal to the injury site, n = 3 mice, average of four HPF per two nerves. Student’s t test, *p<0.05. (I, J) Flow cytometric analysis of sciatic nerves from single (not part of parabiosis complex) WT and Sarm1-/- mice 7dpc. Sciatic nerve trunks were microdissected and separated in 3 mm injury site and distal nerve segments. Dotplots showing Mo/Mac maturation assessed by Ly6C surface staining, Mo (Ly6Chi), Mo/Mac (Ly6Cint), Mac (Ly6C-), previously gated as CD45+CD11b+Ly6G-CD11c- cells. (K) Quantification of Mo/Mac shown in panels (I) and (J) as a percentage of single cells ± SEM, n = 3, injury and distal sites were pooled from 5 mice per genotype per biological replicate. Two-way ANOVA with Tukey’s post-hoc test for multiple comparisons, *p<0.05, **p<0.01.
Figure 10—figure supplement 1
Neutrophils are reduced in the Sarm1-/- distal nerve.
Quantification of tdT, Ly6G double-positive neutrophils in the 7dpc nerve of host parabionts (n = 6). (A) High power field (HPF) of longitudinal sections of a WT and Sarm1-/- parabionts at 7dpc. Representative images taken from the injury site, 1000, 2000, and 3000 μm distal to the injury site. Infiltrating tdT+ leukocytes (magenta), Ly6G+ neutrophils (green), and nuclei (Hoechst) are labeled. Scale bar, 100 μm. (B). Quantification of tdT+Ly6G+ cells per (HPF) ± SEM at indicated distances distal to the injury site, n = 3 mice, an average of four HPF per two nerves. Student’s t test.
Tables
Appendix 1—key resources table
| Reagent type (species) or resource | Designation | Source or reference | Identifiers | Additional information |
|---|---|---|---|---|
| Antibody | Neurofilament heavy chain (chicken polyclonal) | Aves Lab | NFH | 1:750 |
| Antibody | Anti-chicken Cy3 (donkey polyclonal) | Jackson Immunoresearch | 703-165-155 | 1:200 |
| Antibody | Iba1 (rabbit polyclonal) | Wako Chemicals | 019-19741 | 1:500 |
| Antibody | F4/80 (rat IgG2b monoclonal) | Thermo Fisher Scientific | ma1-91124 | 1:500–1:1000 |
| Antibody | CD68 (rabbit polyclonal) | Abcam | ab125212 | 1:500 |
| Antibody | SCG10 (rabbit polyclonal) | Novus Biologicals | NBP149461 | 1:500–1:1000 |
| Antibody | CD11b (rabbit monoclonal) | Abcam | ab133357 | 1:200–1:1000 |
| Antibody | ERK1/2 (rabbit polyclonal) | Cell Signaling | 9102 | 1:5000 |
| Antibody | Anti-rabbit HRP (donkey polyclonal) | EMD Millipore | AP182P | 1:2000–1:10,000 |
| Antibody | CD16/32 (rat IgG2a monoclonal) | BD Pharmingen | 553141 | 1 µg/1 million cells/25 µl |
| Antibody | CD11b-PE-Cy7 (rat IgG2b monoclonal) | Thermo Fisher Scientific | 25-0112-82 | 1:200 |
| Antibody | Isotype Control-PE-Cy7 (rat-IgG2b monoclonal) | Thermo Fisher Scientific | 25-4031-82 | 1:100 |
| Antibody | CD45-e450 (rat-IgG2b monoclonal) | Thermo Fisher Scientific | 48-0451-82 | 1:100 |
| Antibody | CD45.1-e450 (mouse-IgG2a monoclonal) | BioLegend | 110721 | 1:100 |
| Antibody | Isotype Control-e450 (mouse-IgG2a monoclonal) | BioLegend | 400235 | 1:100 |
| Antibody | CD45.2-APC (mouse-IgG2a monoclonal) | BioLegend | 109813 | 1:100 |
| Antibody | Isotype Control-APC (mouse-IgG2a monoclonal) | BioLegend | 400221 | 1:100 |
| Antibody | Ly6G-APC-Cy7 (rat-IgG2a monoclonal) | BD Biosciences | 560600 | 1:100 |
| Antibody | CD11c-PerCP-Cy5.5 (ArmHam-IgG monoclonal) | Thermo Fisher Scientific | 45-0114-82 | 1:100 |
| Antibody | Isotype Control-PerCP-Cy5.5 (ArmHam-IgG monoclonal) | Thermo Fisher Scientific | 45-4888-80 | 1:100 |
| Antibody | Ly6C-FITC (rat-IgM monoclonal) | BD Biosciences | 553104 | 1:100 |
| Antibody | Isotype Control-FITC (rat-IgM monoclonal) | BD Biosciences | 553942 | 1:100 |
| Antibody | Iba1 (goat polyclonal) | Novus Biologicals | NB100-1028 | 1:200 |
| Antibody | Anti-goat Alexa Fluor 488 (donkey polyclonal) | Jackson Immunoresearch | 705-545-147 | 1:200 |
| Antibody | LDHA (rabbit polyclonal) | Cell Signaling Technology | 2558 | 1:300 |
| Chemical compound, drug | TOPRO pan-nuclear stain | Thermo Fisher Scientific | T3605 | 1:2000 |
| Chemical compound, drug | Fixable Viability Dye | Thermo Fisher Scientific | 65086614 | 1:500 |
| Chemical compound, drug | Proteinase K | New England Biolabs | P8107S | |
| Chemical compound, drug | 10 mM dNTP mix | Promega | C1141 | |
| Chemical compound, drug | 5X Green GoTaq Buffer | Promega | M791A | |
| Chemical compound, drug | GoTaq DNA polymerase | Promega | M3005 | |
| Chemical compound, drug | Buprenorphine | Par Pharmaceutical | NDC12496-0757-1 | |
| Chemical compound, drug | Ketamine | Par Pharmaceutical | NDC42023-115-10 | |
| Chemical compound, drug | Xylazine | Akorn | NDC59399-110-20 | |
| Chemical compound, drug | Fluriso (Isoflurane, USP) | Vet One | 501017 | |
| Chemical compound, drug | Rhodamine-conjugated dextran MW 3000 (Microruby) | Life Technologies | D-7162 | |
| Chemical compound, drug | Cholera toxin B (CTB) | Life Technologies | C34775 | |
| Chemical compound, drug | Puralube Eye ointment | Dechra | NDC-17033-211-38 | |
| Chemical compound, drug | N2 media supplement | Gibco | 17502048 | Cell culture |
| Chemical compound, drug | N1 media supplement | Sigma | N6530 | Cell culture |
| Chemical compound, drug | Leibovitz-15 (L-15) | Gibco | 21083-027 | Cell culture |
| Chemical compound, drug | Penicillin/Streptomycin | Life Technologies | 15140-122 | Cell culture |
| Chemical compound, drug | DMEM Ham’s F-12 | Gibco | 10565-018 | Cell culture |
| Chemical compound, drug | Fetal bovine serum | Atlanta Biologicals | S11550 | Cell culture |
| Chemical compound, drug | Cytosine arabinoside | Sigma-Aldrich | C1768 | Cell culture |
| Chemical compound, drug | Collagenase type 2 | Worthington Biochemical | LS004176 | Tissue digestion |
| Chemical compound, drug | PBS without calcium, magnesium | Gibco | 10010023 | Cell culture |
| Chemical compound, drug | Poly-L-lysine MW 70,000–150,000 | Sigma-Aldrich | P4707 | Cell culture |
| Chemical compound, drug | Laminin | Sigma-Aldrich | L2020 | Cell culture |
| Chemical compound, drug | Paraformaldehyde | Sigma-Aldrich | 158127-500G | |
| Chemical compound, drug | Triton-X100 | Sigma-Aldrich | T8787 | |
| Chemical compound, drug | Bovine serum albumin (BSA) heat shock fraction V | Fisher Scientific | BP1600 | |
| Chemical compound, drug | Hoechst 33342 | Invitrogen | H3570 | Nuclear dye |
| Chemical compound, drug | Tissue-Tek O.C.T. Compound | Electron Microscopy Sciences | 62550-01 | |
| Chemical compound, drug | β-Glycerophosphate | Sigma-Aldrich | G9422-100G | |
| Chemical compound, drug | Sodium orthovanadate (Na3VO4) | Sigma-Aldrich | S6508-10G | |
| Chemical compound, drug | Protease inhibitor cocktail | Sigma-Aldrich | P8340-5ML | |
| Chemical compound, drug | DC Protein Assay Kit | Bio-Rad | 5000111 | |
| Chemical compound, drug | 2× Laemmli sample buffer | Bio-Rad | 1610737 | |
| Chemical compound, drug | β-Mercaptoethanol | EMD Millipore | 6010 | |
| Chemical compound, drug | Blotting-grade blocker | Bio-Rad | 1706404 | |
| Chemical compound, drug | SuperSignal West Pico PLUS Chemiluminescent Substrate | Thermo Fisher Scientific | 34580 | |
| Chemical compound, drug | SuperSignal West Femto Maximum Sensitivity Substrate | Thermo Fisher Scientific | 34095 | |
| Chemical compound, drug | WesternSure PREMIUM Chemi Substrate | LI-COR Biosciences | 926-95000 | |
| Chemical compound, drug | Fixable Viability Dye eF506 | Thermo Fisher Scientific | 65-0866-14 | |
| Chemical compound, drug | TRIzol | Thermo Fisher Scientific | 15596026 | |
| Chemical compound, drug | Dispase | Sigma-Aldrich | D4693 | |
| Chemical compound, drug | Actinomycin D | Sigma-Aldrich | A1410 | |
| Chemical compound, drug | Percoll | Sigma-Aldrich | P4937 | |
| Chemical compound, drug | MACS buffer | Miltenyi | 130-091-376 | |
| Chemical compound, drug | CD45 MicroBeads | Miltenyi | 130-052-301 | |
| Chemical compound, drug | CD11b MicroBeads | Miltenyi | 130-049-601 | |
| Chemical compound, drug | Myelin removal Beads | Miltenyi | 130-096-733 | |
| Chemical compound, drug | LS Columns | Miltenyi | 130-042-401 | |
| Chemical compound, drug | Hanks balanced salt solution | Gibco | 14025092 | |
| Chemical compound, drug | Sucrose | Fisher Scientific | S5-500 | |
| Other | Superfrost Plus Microscope Slides | Fisher Scientific | 12-550-15 | For histology |
| Other | Zeiss Axio Observer Z1 | Zeiss | 491912-0049-000 | Microscope |
| Other | Zeiss Axiocam 503 mono camera | Zeiss | 426559-0000-000 | Microscope camera |
| Other | EC PlnN ×10 objective | Zeiss | 420341-9911-000 | Objective for microscope |
| Other | Motorized tissue homogenizer | RPI | 299200 | Homogenization of nerve tissue |
| Other | Fisher Scientific Sonic Dismembrator | Fisher Scientific | Model 500 | Western blot equipment |
| Other | photo spectrometer | Molecular Devices | SpectraMax M5e | Measurement of protein concentration |
| Other | LI-COR C-Digit | LI-COR Biosciences | CDG-001313 | Scanning of Western blot membranes |
| Other | 40 µm filter | BD Falcon | 352340 | Cell isolation |
| Other | 70 µm cell strainer | Corning | 352350 | Cell isolation |
| Chemical compound, drug | PVDF membrane | EMD Millipore | IPVH00010 | |
| Chemical compound, drug | Ammonium-chloride-potassium (ACK) Lysing Buffer | Gibco | A1049201 | Removal of erythrocytes |
| Commercial assay or kit | Myelin Removal Beads | Miltenyi | 130-096-731 | |
| Commercial assay or kit | MidiMACS separator | Miltenyi | 130-042-302 | |
| Other | LS Columns | Miltenyi | 130-042-401 | Cell sorting |
| Other | Hemacytometer | MilliporeSigma | Z359629 | Cell counting |
| Commercial assay or kit | Chromium Next GEM Chip G | 10X Genomics, Inc | NC1000127 | |
| Other | 10X Genomic Chromium Controller | 10X Genomics, Inc | GCG-SR-1 | Barcoding of cells for scRNA-sequencing |
| Commercial assay or kit | Chromium Next GEM Single Cell 3′ Kit v3.1 | 10X Genomics, Inc | 1000268 | |
| Commercial assay or kit | Chromium Next GEM Chip G Single Cell Kit | 10X Genomics, Inc | 1000127 | |
| Commercial assay or kit | Dual Index Kit TT Set A | 10X Genomics, Inc | 1000125 | |
| Chemical compound, drug | Dynabeads | 10X Genomics, Inc | 2000048 | |
| Chemical compound, drug | SPRIselect | Beckman Coulter | B23318 | |
| Other | NovaSeq Illumina 6000 | Illumina | N/A | DNA library sequencing |
| Other | Cryostat | Leica Biosystems | CM3050S | Tissue sectioning |
| Other | Confocal Microscope | Nikon | C1 | Imaging of tissue sections |
| Other | Confocal Microscope | Leica Biosystems | SP8 | Imaging of tissue sections |
| Commercial assay or kit | Proteome Profiler, Mouse XL Cytokine membranes (ELISA) | R&D Systems, Minneapolis, MN, USA | ARY028 | |
| Strain, strain background (Mus musculus) | Sarm1-/- C57BL/6 | Jackson Laboratories | Stock# 018069 | PMID:22678360 |
| Strain, strain background (M. musculus) | ROSA26-mTdt/mGFP C57BL/6 | Jackson Laboratories | Stock# 007576 | PMID:17868096; MGI: J:124702 |
| Strain, strain background (M. musculus) | Arg1-eYFP C57BL/6 | Jackson Laboratories | Stock# 015857 | PMID:17450126; MGI: J:122735; PMID:33263277 |
| Strain, strain background (M. musculus) | CD45.1 C57BL/6 | Jackson Laboratories | Stock# 002014 | PMID:11698303; MGI: J:109863; PMID:11994430; MGI: J:109854; PMID:12004082; MGI: J:109853 |
| Strain, strain background (M. musculus) | Wildtype, WT C57BL/6 | Taconics | B6NTac | |
| Sequence-based reagent | Neomycin Forward | Integrated DNA Technologies | N/A | 5’-CTTGGGTGGAGAGGCTATTC-3’ |
| Sequence-based reagent | Neomycin Reverse | Integrated DNA Technologies | N/A | 5’-AGGTGAGATGACAGGAGATC-3’ |
| Software, algorithm | WIS-Neuromath | Weizmann Institute of Science | Version 3.4.8 | PMID:23055261 |
| Software, algorithm | Image Studio Software | LI-COR Biosciences | Version 5.2.5 | |
| Software, algorithm | NovaSeq control software | Illumina | Version 1.6 | |
| Software, algorithm | Real Time Analysis (RTA) software | Illumina | Version 3.4.4 | |
| Software, algorithm | CellRanger | 10X Genomics, Inc | Version 3.1.0 | |
| Software, algorithm | Seurat | Satija Lab–New York Genome Center | Version 4.0.5 | |
| Software, algorithm | Seurat | https://github.com/satijalab/seurat; Srivastava and Hoffman, 2022; Hao et al., 2021 | Version 4.1.1.9006 | |
| Software, algorithm | R | r-project.org | Version 4.1.2 | |
| Software, algorithm | SlingShot | bioconductor.org | Version 2.2.1 | |
| Software, algorithm | Ranger | Comprehensive R Archive Network | Version 0.13.1 | |
| Software, algorithm | CellChat | https://github.com/sqjin/CellChat; Jin and CaoWei-UM, 2022; Jin et al., 2021 | Version 1.1.3 | |
| Software, algorithm | shiny | Rstudio.com | Version 1.7.1 | |
| Software, algorithm | Prism | GraphPad | Versions 7 and 8 | |
| Software, algorithm | Ingenuity pathway analysis | QIAGEN | Version 81348237 | |
| Software, algorithm | Imaris | Bitplane | ||
| Software, algorithm | Leica Application Suite (LAS X) | Leica | ||
| Software, algorithm | Zen Application Software | Zeiss | Pro 3.8 | |
| Other | SomnoSuite | Kent Scientific | SS-01 | Anesthesia |
| Other | Povidone-Iodine Prep Pad | PDI Healthcare | B40600 | Disinfection |
| Other | Alcohol Prep, Sterile, Md, 2 Ply | Covidien | 6818 | Disinfection |
| Other | Fine Forceps Dumont #55 Dumoxel | Roboz Surgical Instrument | RS-5063 | Surgical tool |
| Other | 7 mm Reflex Wound Clips | Cell Point Scientific | 203-1000 | Surgical tool |
| Other | Micro Friedman Rongeur | Roboz Surgical Instrument | RS-8306 | Surgical tool |
| Other | McPherson-Vannas Micro Dissecting Spring scissors | Roboz Surgical Instrument | RS-5600 | Surgical tool |
| Other | COATED VICRYL (polyglactin 910) Suture | Ethicon | J463G | Surgical suture |
| Other | Dumont #7 curved forceps | Fine Science Tools | 11271-30 | Surgical tool |
| Other | Miltex Halsted mosquito forceps | Integra LifeSciences | 724 | Surgical tool |
| Other | Nanofil 10 µl syringe | World Precision Instruments | NANOFIL | Small syringe |
| Other | 36g beveled nanofil needle | World Precision Instruments | NF36BV-2 | Perfusion |
| Other | Non-absorbable sutures | Ethicon | 640G | Surgical sutures for parabiosis |
| Other | Absorbable sutures | Ethicon | J463G | Surgical sutures |
| Sequence-based reagent | RNAscope Probe- Mm-Gpnmb-C3- Mus musculus glycoprotein (transmembrane) Gpnmb (Gpnmb) mRNA | ACD Bio | 489511-C3 | 1:50 |
| Sequence-based reagent | RNAscope Probe- Mm-Ccl8-C2-Mus musculus chemokine (C-C motif) ligand 8 (Ccl8) mRNA | ACD Bio | 546211-C2 | 1:50 |
| Sequence-based reagent | RNAscope Probe- Mm-Cd209a-C2- musculus CD209a antigen (Cd209a) mRNA | ACD Bio | 480311-C2 | 1:50 |
| Commercial assay or kit | RNAscope Multiplex Fluorescent Reagent Kit v2 | ACD Bio | 323100 | |
| Other | Model 1525 incubator | VWR Scientific | 1525 | RNAscope equipment |
| Other | ACD hybridization oven | ACD Bio | 321710 | RNAscope equipment |
| Chemical compound, drug | Hydrogen peroxide solution | ACD Bio | PN 322381 | |
| Chemical compound, drug | 10× antigen retrieval solution | ACD Bo | 322000 | |
| Chemical compound, drug | Protease Plus solution | ACD Bio | 322331 | |
| Chemical compound, drug | Cy3 | AKOYA Biosciences | NEL744001KT | 1:2000 |
| Chemical compound, drug | Cy5 | AKOYA Biosciences | NEL745001KT | 1:2000 |
| Chemical compound, drug | DAPI mounting media | Southern Biotech | 0100-20 | |
| Chemical compound, drug | RNAscope wash buffer | ACD Bio | 310091 | |
| Chemical compound, drug | Formalin (1:10) | Fisherbrand | 427-098 | |
| Antibody | PFKfb3 (rabbit monoclonal) | Cell Signaling Technology | 13123 | 1:300 |
| Antibody | PKM (rabbit polyclonal) | Abcam | ab137791 | 1:300 |
| Antibody | Sox10 (goat polyclonal) | R&D Systems | AF2864 | 1:300 |
| Sequence-based reagent | Spp1 Forward | This paper | PCR primer | AAGTCTAGGAGTTTCCAGGTTTC |
| Sequence-based reagent | Spp1 Reverse | This paper | PCR primer | GCTCTTCATGTGAGAGGTGAG |
| Sequence-based reagent | Gapdh Forward | This paper | PCR primer | AACTTTGGCATTGTGGAAGG |
| Sequence-based reagent | Gapdh Reverse | This paper | PCR primer | GGATGCAGGGATGATGTTCT |
| Sequence-based reagent | Chil3 Forward | This paper | PCR primer | AGCCCTCCTAAGGACAAAC |
| Sequence-based reagent | Chil3 Reverse | This paper | PCR primer | GGAATGTCTTTCTCCACAGATTC |
| Sequence-based reagent | Rlp13a Forward | This paper | PCR primer | GCTGCTCTCAAGGTTGTTC |
| Sequence-based reagent | Rlp13a Reverse | This paper | PCR primer | GTACTTCCACCCGACCTC |
| Sequence-based reagent | Hif1a Forward | This paper | PCR primer | CTGATGGAAGCACTAGACAAAG |
| Sequence-based reagent | Hif1a Reverse | This paper | PCR primer | CAATATTCACTGGGACTGTTAGG |
| Sequence-based reagent | Acod1 Forward | This paper | PCR primer | GGCACAGAAGTGTTCCATAAAG |
| Sequence-based reagent | Acod1 Reverse | This paper | PCR primer | GTGGGAGCCTGAAGTCTG |
| Sequence-based reagent | Il1b Forward | This paper | PCR primer | CTTCCAGGATGAGGACATGAG |
| Sequence-based reagent | Il1b Reverse | This paper | PCR primer | TCACACACCAGCAGGTTATC |
| Sequence-based reagent | Slc16a3 Forward | This paper | PCR primer | GCAGAAGCATTATCCAGATCTAC |
| Sequence-based reagent | Slc16a3 Reverse | This paper | PCR primer | GATTGAGCATGATGAGGGAAG |
| Sequence-based reagent | Ldha Forward | This paper | PCR primer | CATTGTCAAGTACAGTCCACAC |
| Sequence-based reagent | Ldha Reverse | This paper | PCR primer | TTCCAAGCCACGTAGGTC |
| Sequence-based reagent | Pkm Forward | This paper | PCR primer | CTGGATACAAAGGGACCTGAG |
| Sequence-based reagent | Pkm Reverse | This paper | PCR primer | CAGAGTGGCTCCCTTCTTC |
| Sequence-based reagent | Pgk1 Forward | This paper | PCR primer | GTGGAATGGCCTTTACCTTC |
| Sequence-based reagent | Pgk1 Reverse | This paper | PCR primer | GACAATCTTGGCTCCTTCTTC |
| Sequence-based reagent | Cd38 Forward | This paper | PCR primer | ACTGTCCCAACAACCCTATTAC |
| Sequence-based reagent | Cd38 Reverse | This paper | PCR primer | ATCACTTGGACCACACCAC |
| Sequence-based reagent | Pfkl Forward | This paper | PCR primer | CTGCTGAGCTACACAGAGG |
| Sequence-based reagent | Pfkl Reverse | This paper | PCR primer | CGTGTCCCTTGGTGAGAAG |
| Sequence-based reagent | Gatm Forward | This paper | PCR primer | TTGCTTTGATGCTGCTGAC |
| Sequence-based reagent | Gatm Reverse | This paper | PCR primer | CACTCGATGCCCAGGTAG |
| Chemical compound, drug | SYBR Green Fluorescein Master Mix | Thermo Scientific | 4364344 | |
| Other | QuantStudio 3 real-time PCR system | Applied Biosystems | A28567 | Genotyping |
| Other | Pestle motor mixer | RPI | 299200 | Tissue homogenization |
| Other | Nanodrop | Thermo Scientific | Measurement of nucleic acid concentration | |
| Commercial assay or kit | SuperScript III First-Strand Synthesis System kit | Invitrogen | 18080051 | |
| Chemical compound, drug | RIPA buffer | Sigma | R0278 | Supplemented with 50 mM BGP, 1 mM Na3VO4, and 1:100 PIC |
| Chemical compound, drug | DC protein assay | Bio-Rad | 5000111 | |
| Chemical compound, drug | β-Mercaptoethanol | Sigma | 60242 | |
| Chemical compound, drug | 2X Laemmli buffer | Bio-Rad | 1610737 | |
| Other | Immune-Blot PVDF membrane | BioRad | 1620260 | Western blotting |
| Chemical compound, drug | TBST blocking buffer | This paper | Buffer | 48.4 g Tris Base, 351.2 g NaCl, ddH2O 2 L, pH 7.4, 0.5% Tween- 20 with BSA 200 mg |
| Chemical compound, drug | Bovine serum albumin | Fisher | BP1600-100 | |
| Chemical compound, drug | SuperSignal West Pico PLUS Chemiluminescent Substrate | Thermo Fisher Scientific | 34580 |
Additional files
-
Supplementary file 1
Datasets included in injured sciatic nerve atlas (iSNAT).
The table shows newly generated and existing scRNAseq datasets used in this study. Columns show cell numbers before and after applying exclusion criteria, replicates, statistics on reading depth and sequence saturation. A total of 157,409 high-quality single-cell transcriptomes were analyzed from naïve mouse sciatic nerve, injured sciatic nerves, and peripheral blood mononuclear cells (PBMC). Some of the 3 day (3d) injured nerves were divided into injury site and distal nerve and sequenced separately. SN, sciatic nerve; UMI, unique molecular identifier.
- https://cdn.elifesciences.org/articles/80881/elife-80881-supp1-v2.docx
-
MDAR checklist
- https://cdn.elifesciences.org/articles/80881/elife-80881-mdarchecklist1-v2.docx
Download links
A two-part list of links to download the article, or parts of the article, in various formats.
Downloads (link to download the article as PDF)
Open citations (links to open the citations from this article in various online reference manager services)
Cite this article (links to download the citations from this article in formats compatible with various reference manager tools)
The injured sciatic nerve atlas (iSNAT), insights into the cellular and molecular basis of neural tissue degeneration and regeneration
eLife 11:e80881.
https://doi.org/10.7554/eLife.80881


