Single-cell transcriptomic atlas of lung microvascular regeneration after targeted endothelial cell ablation
- Ottawa Hospital Research Institute, Canada
- Sinclair Centre for Regenerative Medicine, Canada
- Department of Cellular and Molecular Medicine, University of Ottawa, Canada
Figures
Figure 1 with 1 supplement
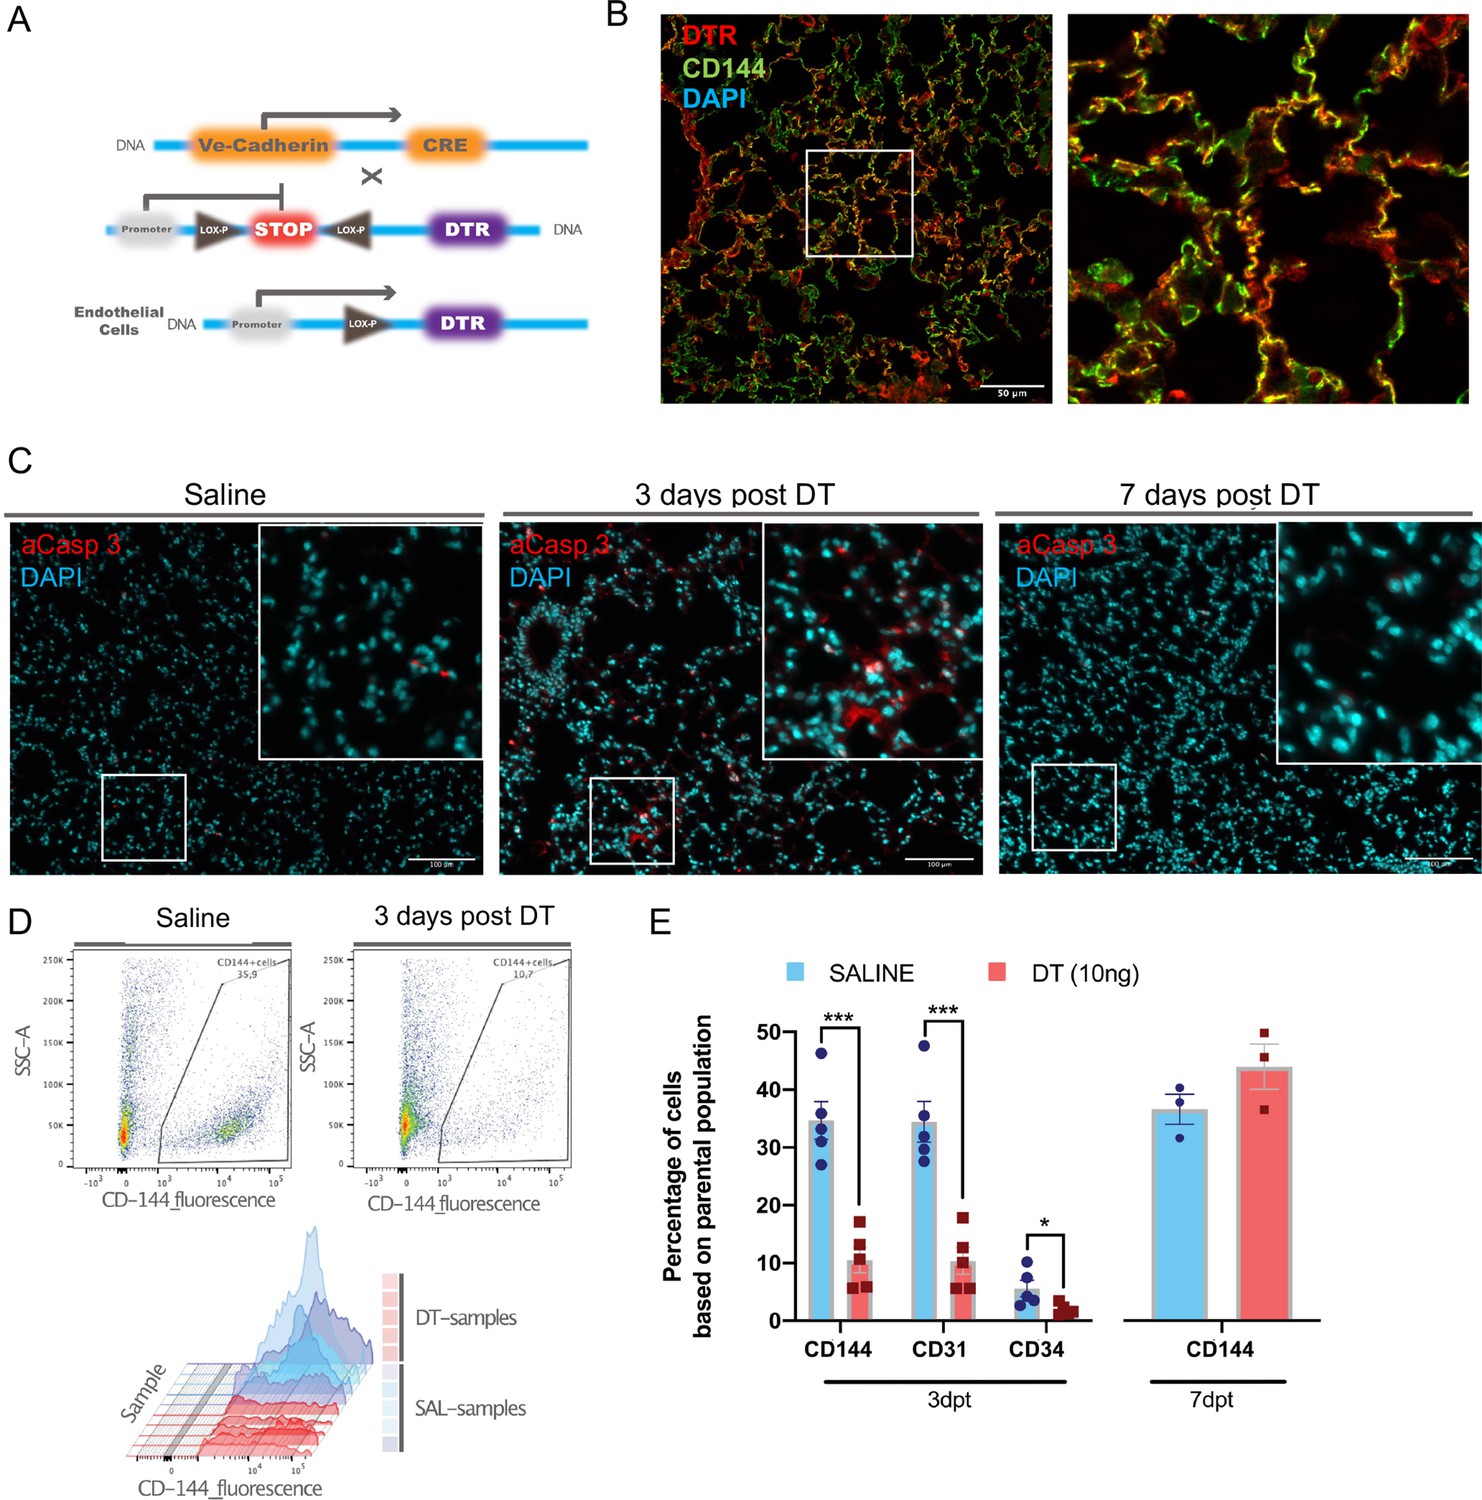
Establishment of the diphtheria toxin (DT)-induced endothelial cell (EC) ablation model.
(A) Transgenic mice harboring Cre recombinase cDNA downstream from a 2.5 kb fragment of the VE-Cadherin (Cdh5) mouse promoter (B6.FVB-Tg(Cdhn5-cre)7Milia) were crossed with mice with Cre-inducible expression of DTR (C57BL/6-Gt(ROSA)26Sortm1(HBEGF)Awai/J) giving rise to Cdh5-DTR binary transgenic mice. (B) Immunostaining for human diphtheria toxin receptor (DTR) (red) and ECs (anti-CD144, green) and merged image showing co-localization (yellow) in lung sections from Cdh5-DTR binary transgenic mice 3 days post intra-tracheal (IT) delivery of saline or DT (10 ng). Scale bar is 50μm. (C) Immunostaining for activated caspase 3 (aCasp-3, red) in lung sections from binary transgenic mice 3 or 7 days after treatment DT or saline (DAPI nuclear staining in blue). Scale bar is 100μm. (D) Representative plots of lung EC numbers assessed by flow cytometry (CD144) in binary transgenic mice 3 days after IT delivery of saline or DT. (E) Summary flow cytometric data showing the percent of total lung cells staining positive using CD144, CD31, or CD34 antibodies in DT-treated binary transgenic mice 3 or 7 days post-treatment (dpt) compared with saline. Data represented as mean ± SEM. n=5 for 3d timepoint, n=3 for 7d timepoint, multiple unpaired t-tests were performed with multiple comparisons using Holm-Sidak correction. More details are in Figure 1—figure supplement 1.
Figure 1—figure supplement 1
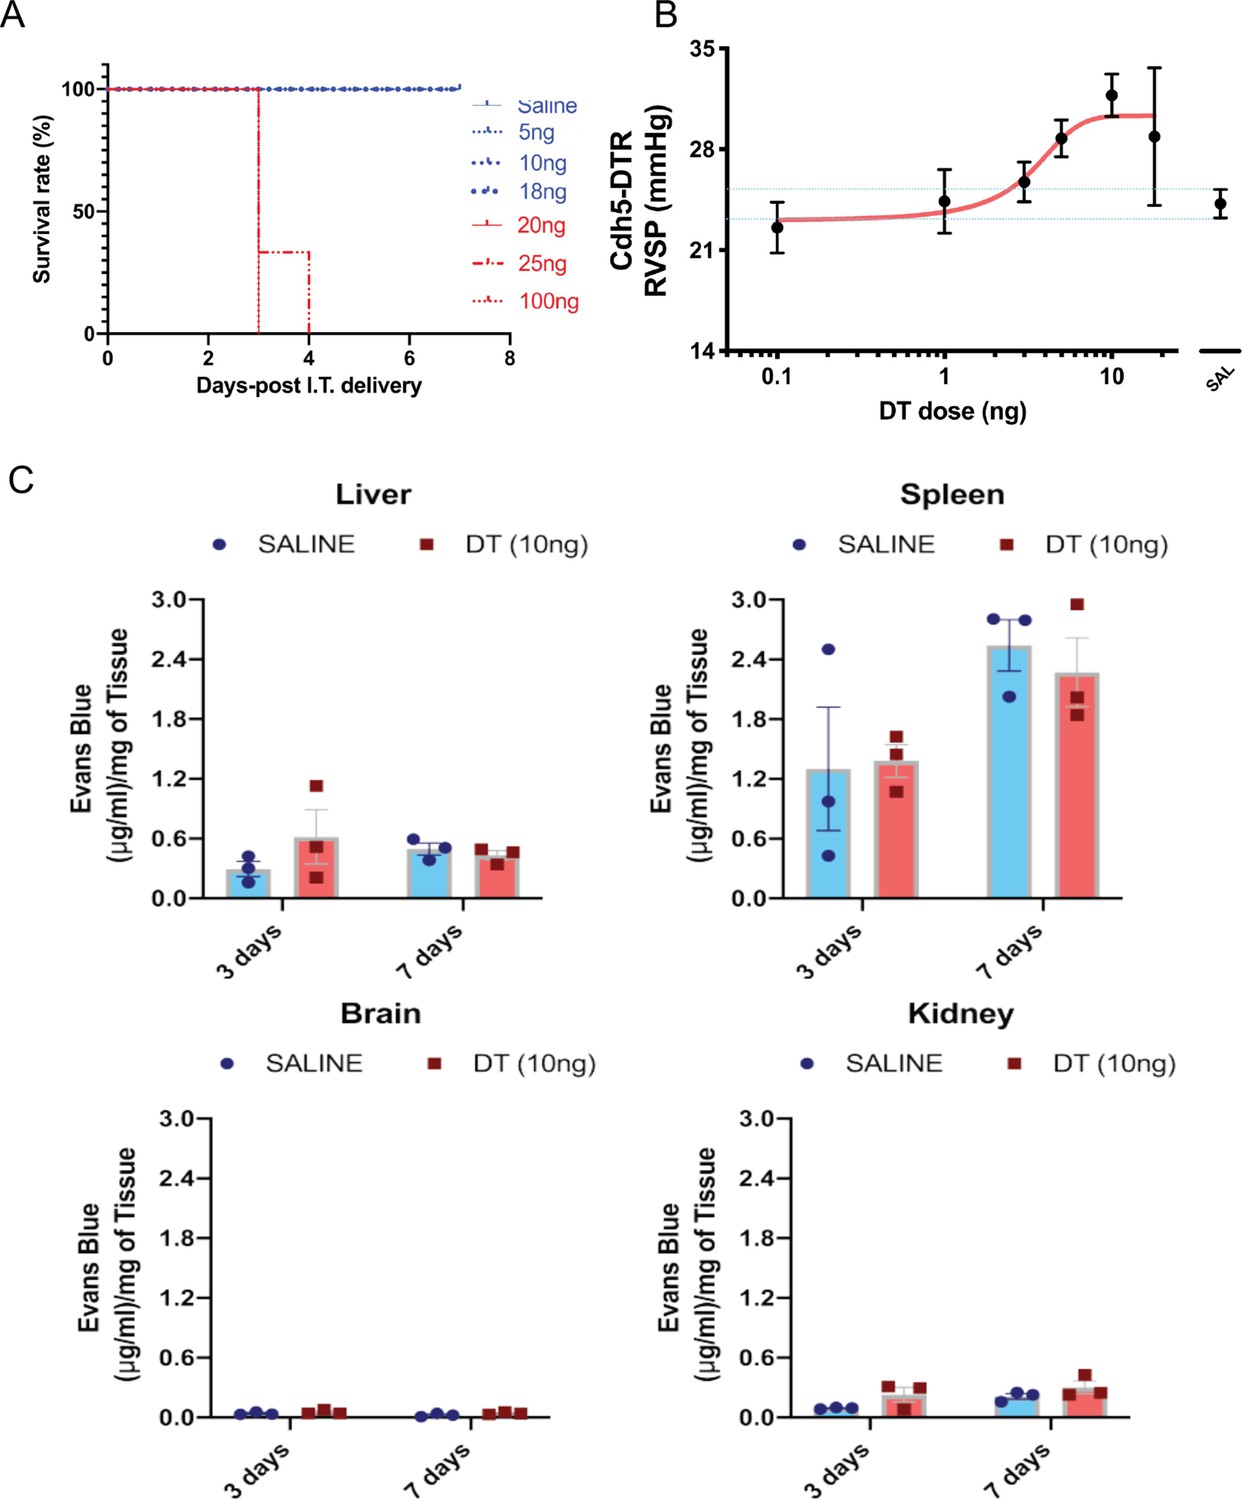
Sublethal dose of diphtheria toxin (DT) induces pulmonary hypertension and selective increase in lung permeability.
(A) Single intra-tracheal (IT) administration of DT at doses below 20 ng was compatible with survival to 7 days post-treatment. (B) Doses above 1 ng resulted in a dose-dependent increase in right ventricular systolic pressure (RVSP). (C) Vascular permeability as measured by Evans blue uptake remained unaltered following DT administration at 3 and 7 days in the liver, spleen, kidney, and brain. Data represented as mean ± SEM. An unpaired multiple t-tests with Holm-Sidak multiple comparisons method with alpha (0.05) was used. n = 3 biological replicates per group.
Figure 2
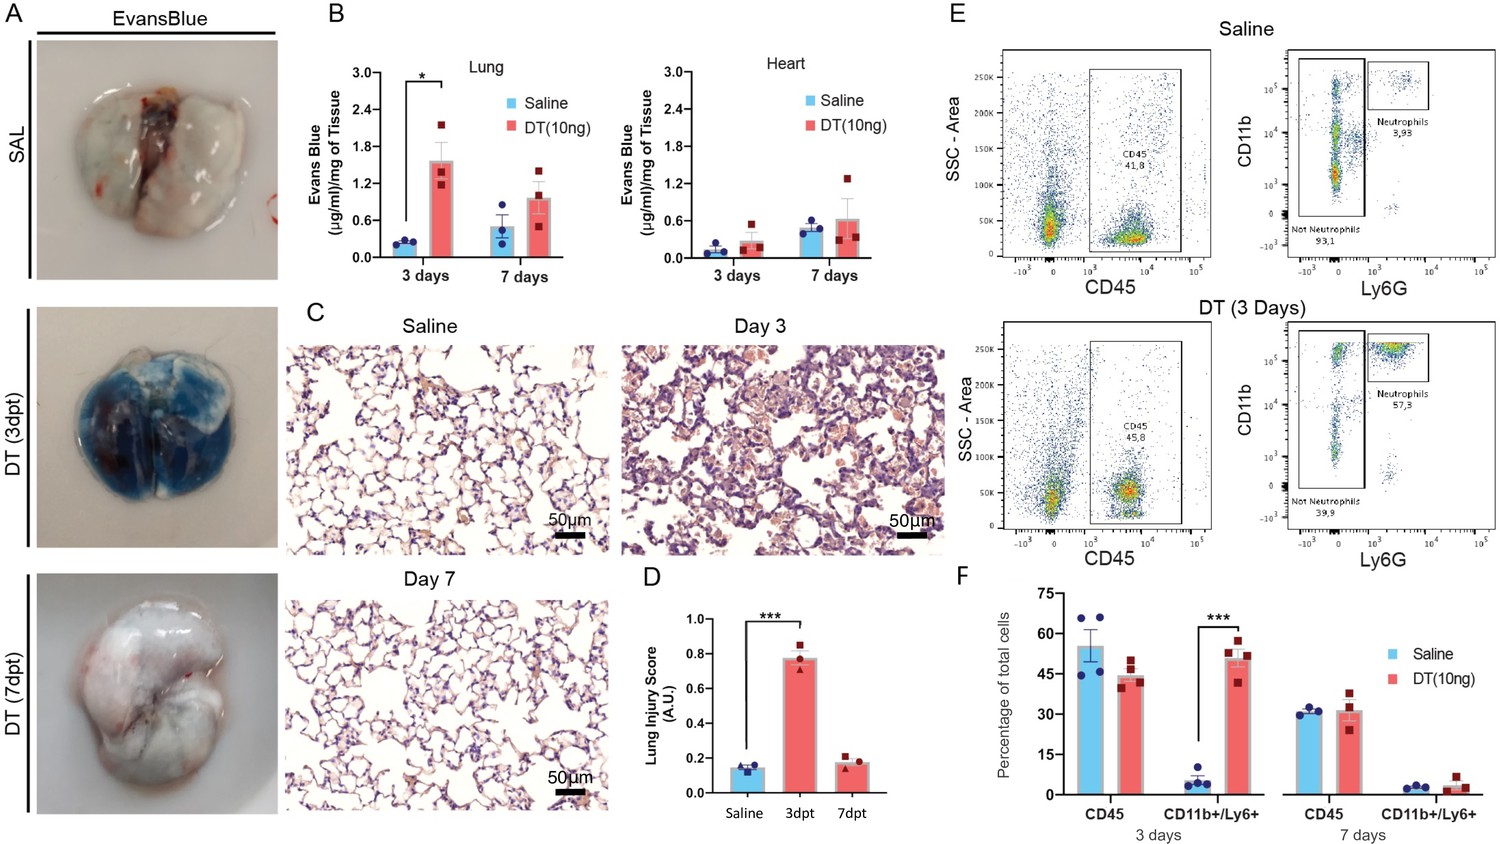
Diphtheria toxin (DT) administration results in an acute lung injury phenotype.
(A) Representative examples of Evans blue staining of lungs from binary transgenic mice. (B) Summary data showing a marked increase in Evans Blue lung content in binary transgenic mice treated with DT (10 ng) or saline at 3 and 7 days post-treatment (dpt). (C) Representative histological lung sections (H&E staining) from binary transgenic mice at 3 and 7 days post intra-tracheal (IT) administration of DT or saline with the corresponding summary data (D) for a validated lung injury score. (E) Representative examples of flow cytometry plots showing gating strategy for assessing CD11b/Ly6G positive leukocytes in lungs from binary transgenic mice 3 days after IT delivery of DT or saline with summary data (F) at 3 and 7 days post-treatment (dpt). Data represented as mean ± SEM. An unpaired multiple t-tests with Holm-Sidak multiple comparisons method with alpha (0.05) was used for the analysis of data presented in panels B and F, whereas one-way ANOVA corrected for multiple comparisons with Dunnett was conducted for panels D. n=3-4 biological replicates per group, *=p<0.05; **=p<0.01; ***=p<0.005. Scale bar is 50μm in panel C.
Figure 3 with 2 supplements
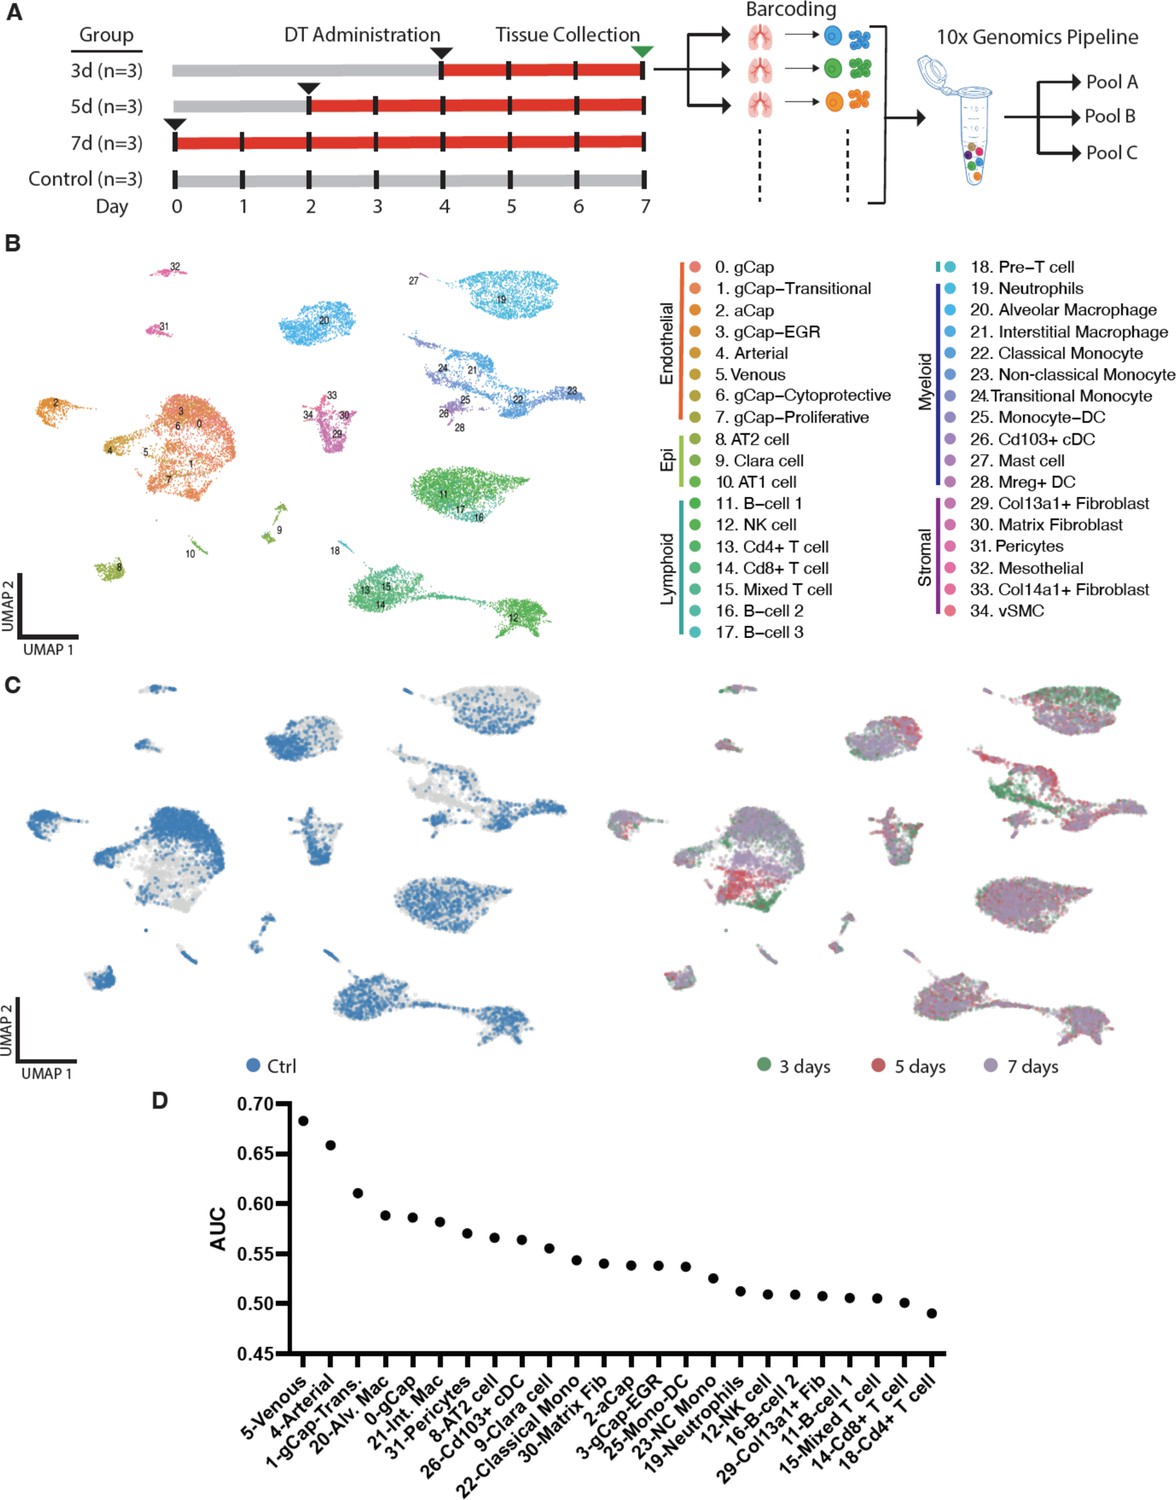
Multiplexed single-cell transcriptomic analysis after diphtheria toxin (DT)-induced lung endothelial cell (EC) ablation.
(A) Schematic of workflow showing the experimental design. Three separate cohorts (3, 5, and 7 days) of binary transgenic mice received DT (IT, 10 ng), and a fourth cohort of healthy animals served as a control, with the timing of DT delivery such that all mice were sacrificed on the same day. Three animals (biological replicates) were included per group. Lungs cells were immediately isolated and barcoded to identify individual donor animals, then pooled and subjected to library construction using 10x-Genomics Single-cell 3’ RNA sequencing kit v.3. Global plot of all lung cells at all time points using uniform manifold approximation and projection (UMAP). (B) 35 distinct populations were identified and could be assigned into five major categories: endothelial, epithelial stromal, myeloid, and lymphoid. (C) UMAP plots of global lung cells are shown for each mouse cohort: control (blue); day 3 (green), day 5 (red), and day 7 (purple) (C). (D) A machine learning model was used to predict cells that become more separable during treatment based on their molecular measurements (Skinnider and Lin, 2021; Skinnider et al., 2021). More details for this analysis are provided in Figure 3—figure supplements 1–2.
Figure 3—figure supplement 1
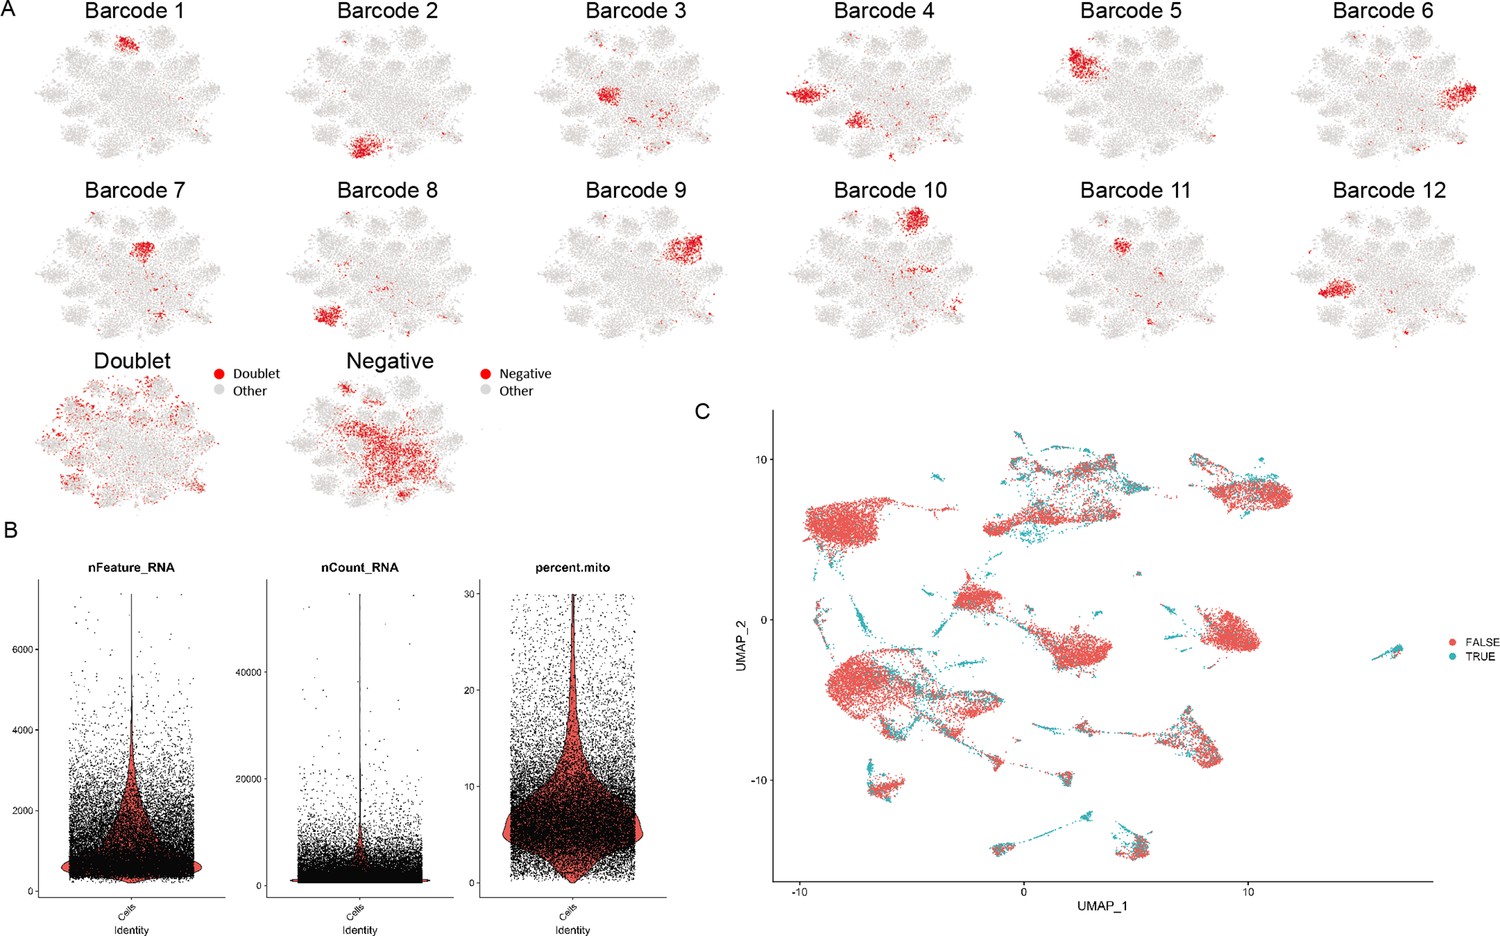
Quality control for single-cell RNA sequencing (scRNA-seq).
(A) All 12 barcodes were demultiplexed with a small number of cells with multiple barcodes (doublets) and a population lacking any barcode (negative). (B) Quality control was performed using the number of features, counts, and percentage of mitochondrial content as the cutoff. (C) A further computational method for doublet removal was conducted in addition to excluding doublets based on multiple barcode uptake.
Figure 3—figure supplement 2
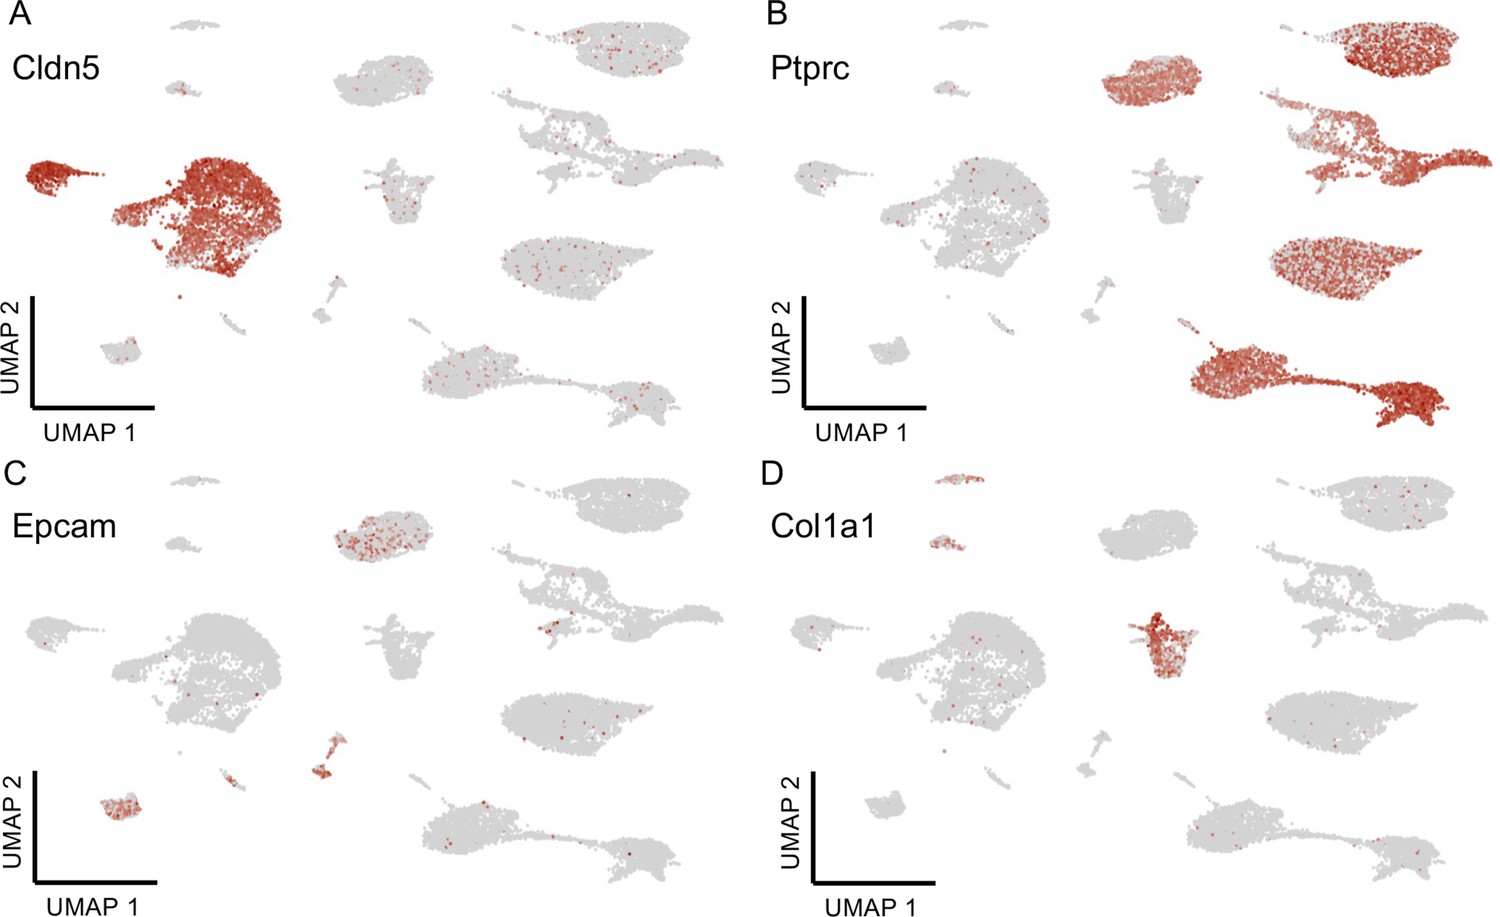
Major cell type classification.
Expression of selected genes characterizing the identity of the major lung cell clusters based on the Tabula Muris biological atlas, including (A) Cldn5 (endothelial), (B) Ptprc (immune), (C) Epcam (epithelial), and (D) Col1a (mesenchymal).
Figure 4 with 1 supplement
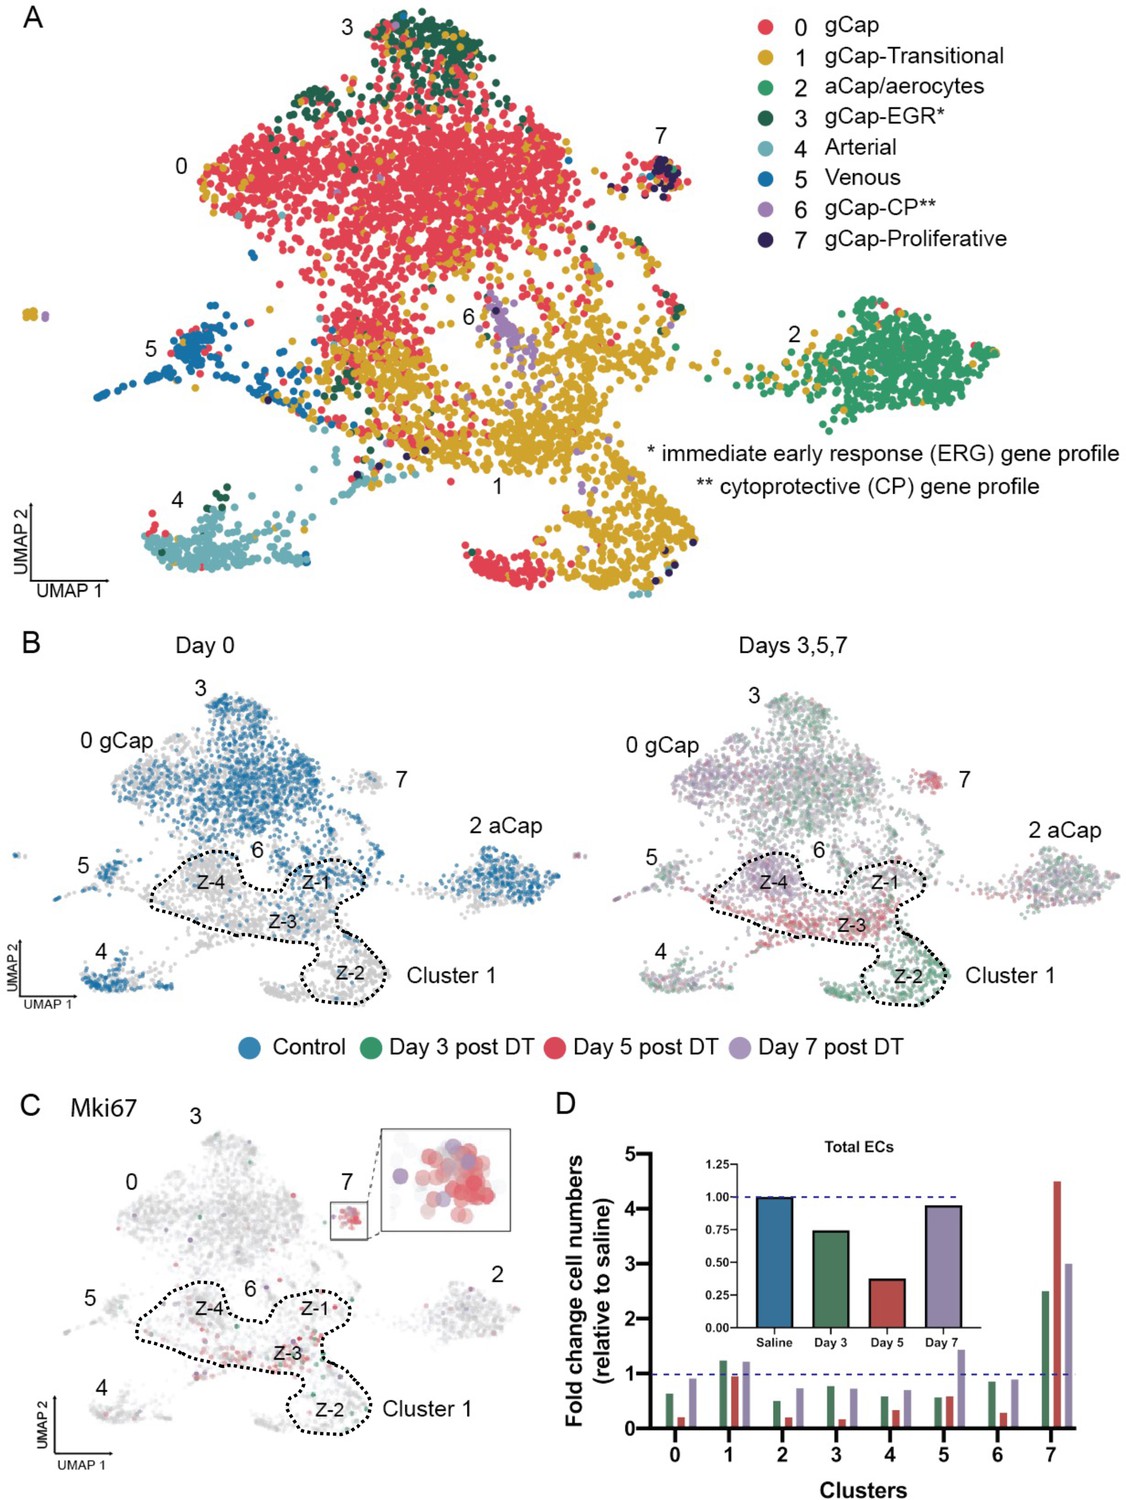
Endothelial cell populations in control and diphtheria toxin (DT)-treated binary transgenic diphtheria toxin receptor (DTR) mice.
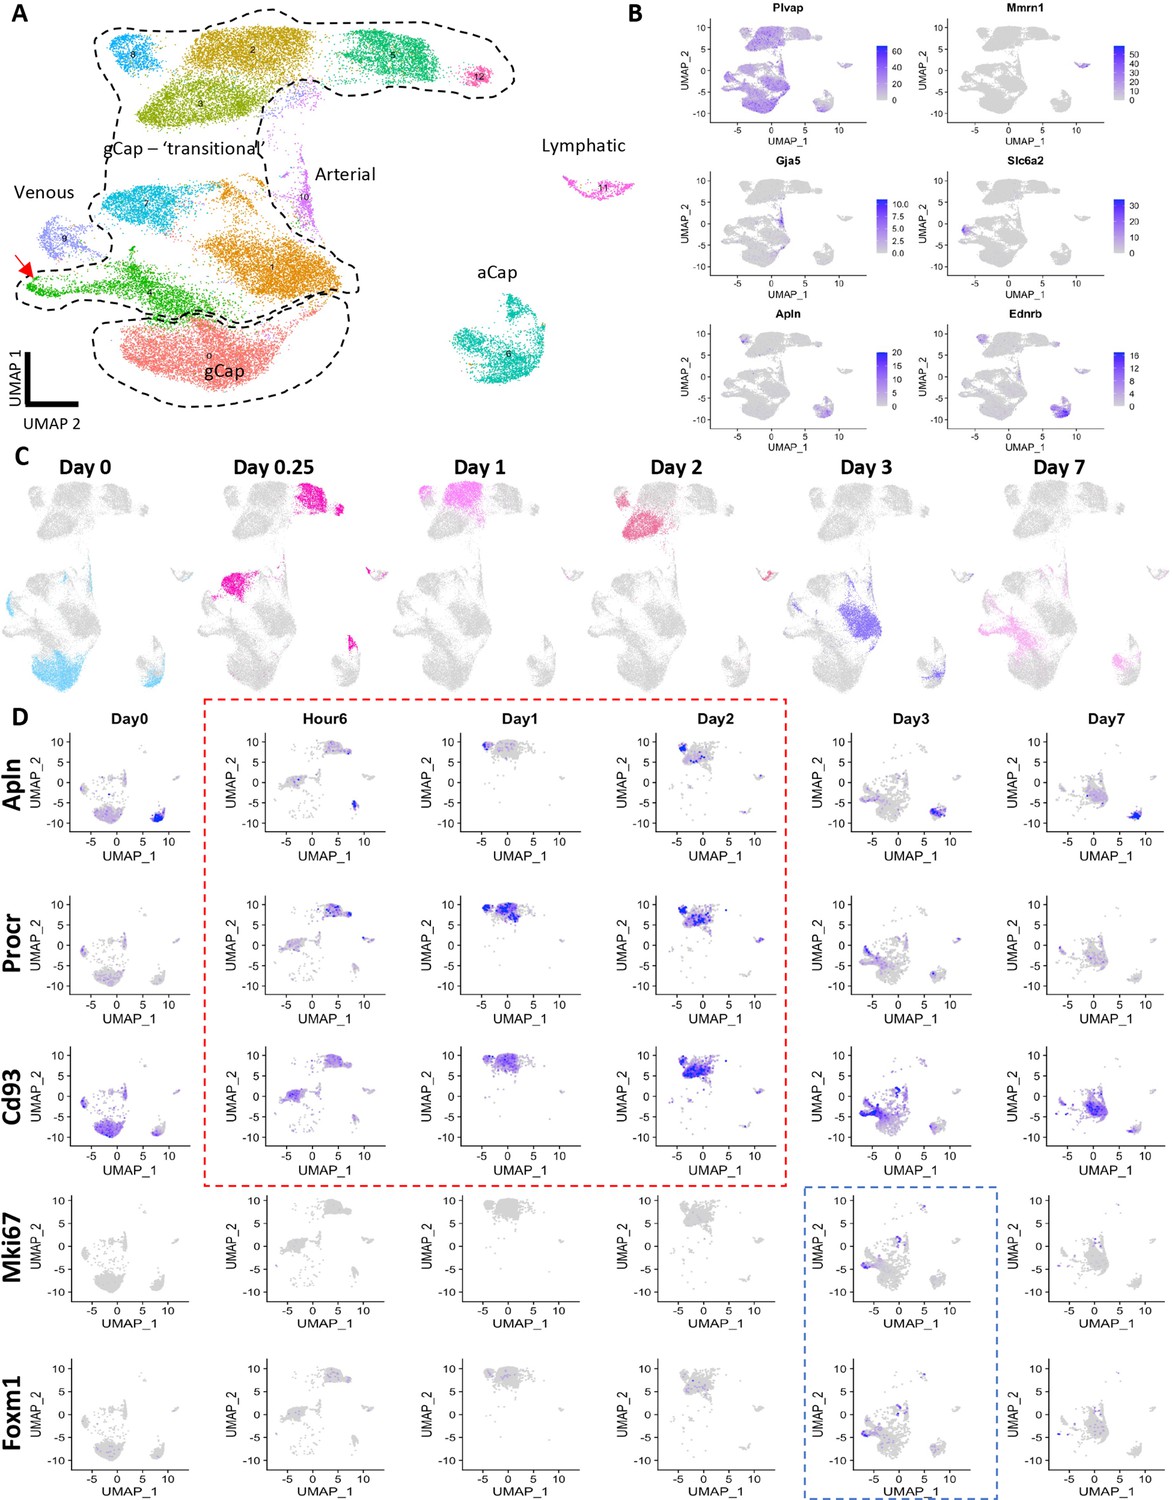
(A) Uniform manifold approximation and projection (UMAP) representation of the re-clustered endothelial populations for all cohorts produced eight distinct endothelial cell (EC) clusters. (B) The UMAP plots for each cohort are shown separately: control (blue); day 3 (green), day 5 (red), and day 7 (purple) The dotted line delineates Cluster 1 which was unique in that it consisted of four zones (Z-1 to Z-4) each specific to a single time cohort. (C) Cell proliferation, identified by Mki67 expression, was seen only at day 5 (red) in Zone 3 of Cluster 1 and Cluster 7. (D) Change in numbers of lung ECs in the three cohorts treated with DT (days 3, 5, and 7) are expressed as fold-change relative to control for all EC populations (insert) and numbers of ECs broken down for each EC cluster. Typical aerocytes (aCap) and general capillary (gCap) gene expression profiles are shown in Figure 4—figure supplement 1.
Figure 4—figure supplement 1
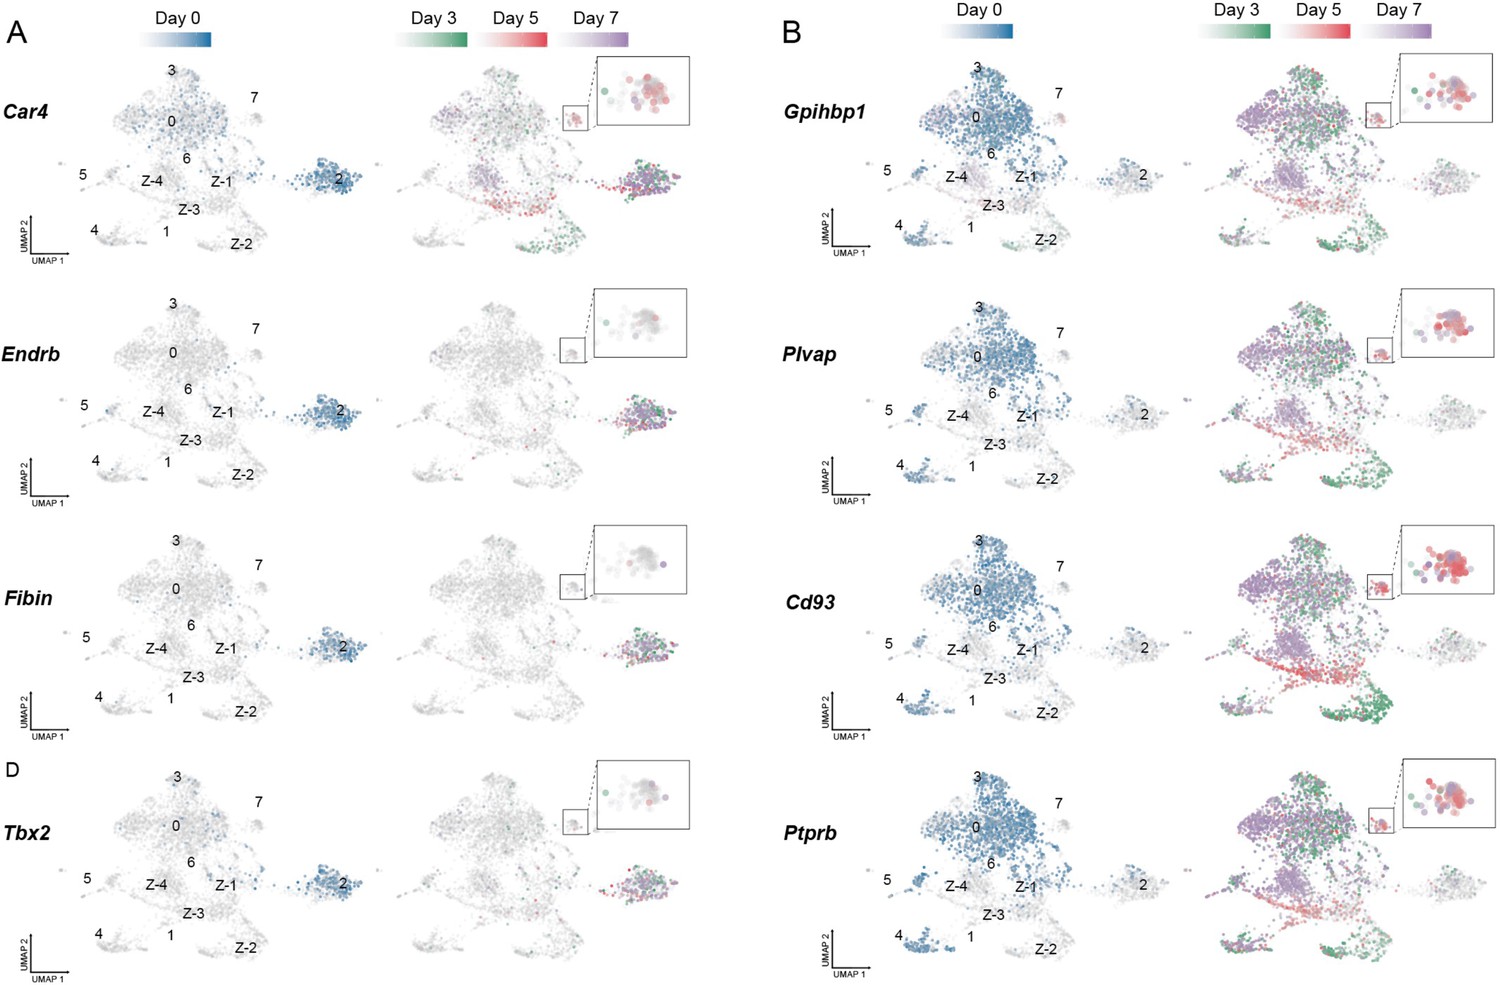
Aerocytes (aCap) and general capillary (gCap) genes in endothelial cells (EC) populations pre and post-injury.
Typical aCap ECs genes include: (A) Car4 (Carbonic Anhydrase 4); (B) Endrb (endothelin receptor type-B); (C) Fibin (Fin Bud Initiation Factor Homolog); and (D) Tbx2 (T-Box Transcription Factor 2). In contrast, gCap genes include: (E) Gpihbp1 (Glycosylphospha-tidylinositol Anchored High-Density Lipoprotein Binding Protein 1); (F) Plvap (Plasmalemma Vesicle Associated Protein); (G) Cd93; and (H) Ptprb (Protein Tyrosine Phosphatase Receptor Type B). Day 3 (green); day 5 (red), and day 7 (purple) with Cluster 7 enlarged in the insets.
Figure 5
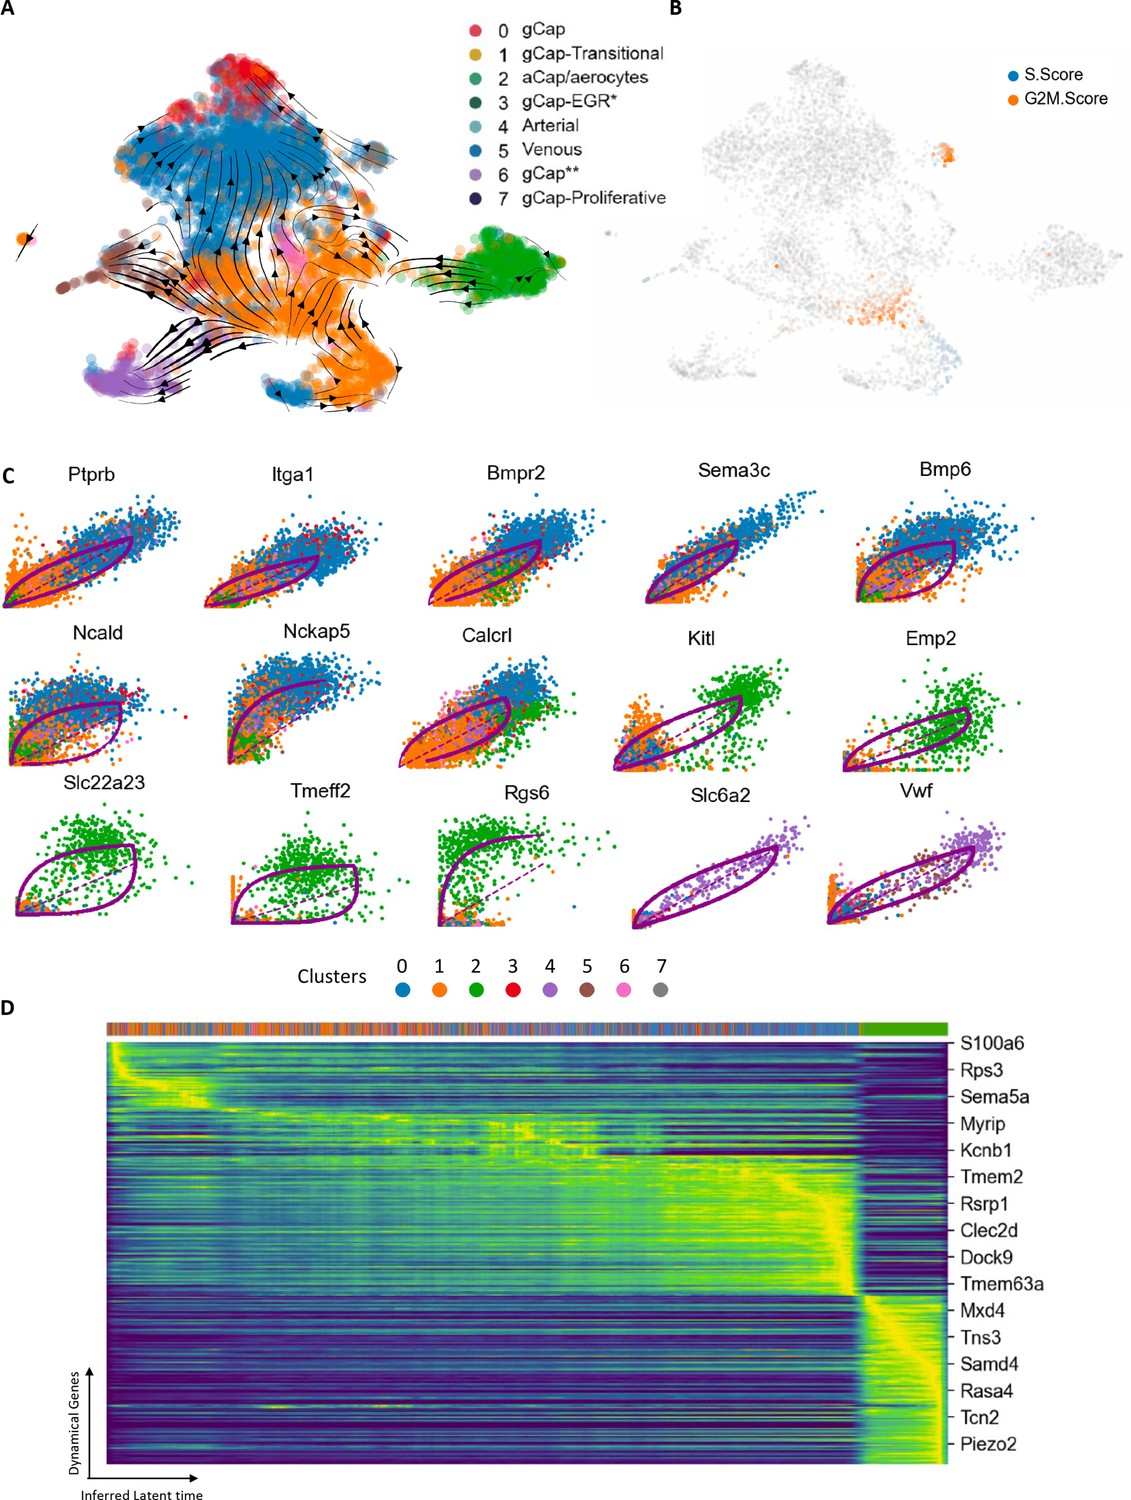
RNA velocity and trajectory analysis.
(A) This model showed a dynamic shift of endothelial cells (ECs) through Zones 2 and 3 of transitional Cluster 1 with strong vectors towards general capillary (gCap), arterial, and venous EC populations. (B) Zone 2 ECs of Cluster 1 exhibited evidence of DNA synthesis (blue), whereas cells in Zone 3, and proliferative cluster 7, showed increased G2M scores, consistent with their role in repopulating the lung microvasculature ECs. (C) Top 15 genes involved in specific transitions between clusters: eight genes implicated in the transition from Cluster 1 to Cluster 0; five genes for Cluster 1 to aCap ECs (Cluster 2), and two genes for Cluster 1 to venous ECs (Cluster 4). (D) Cascade of 300 top genes in the dynamical gene expression analysis. Horizontal ribbon on top identifies clusters by color coding according to the legend in panel A. Genes listed on the right was randomly selected. There was a clear progression of gene expression beginning with Cluster 1 (orange) and progressing through to Cluster 0 (blue) and finally Cluster 2 (green) at the end of the pseudotime cascade.
Figure 6 with 3 supplements
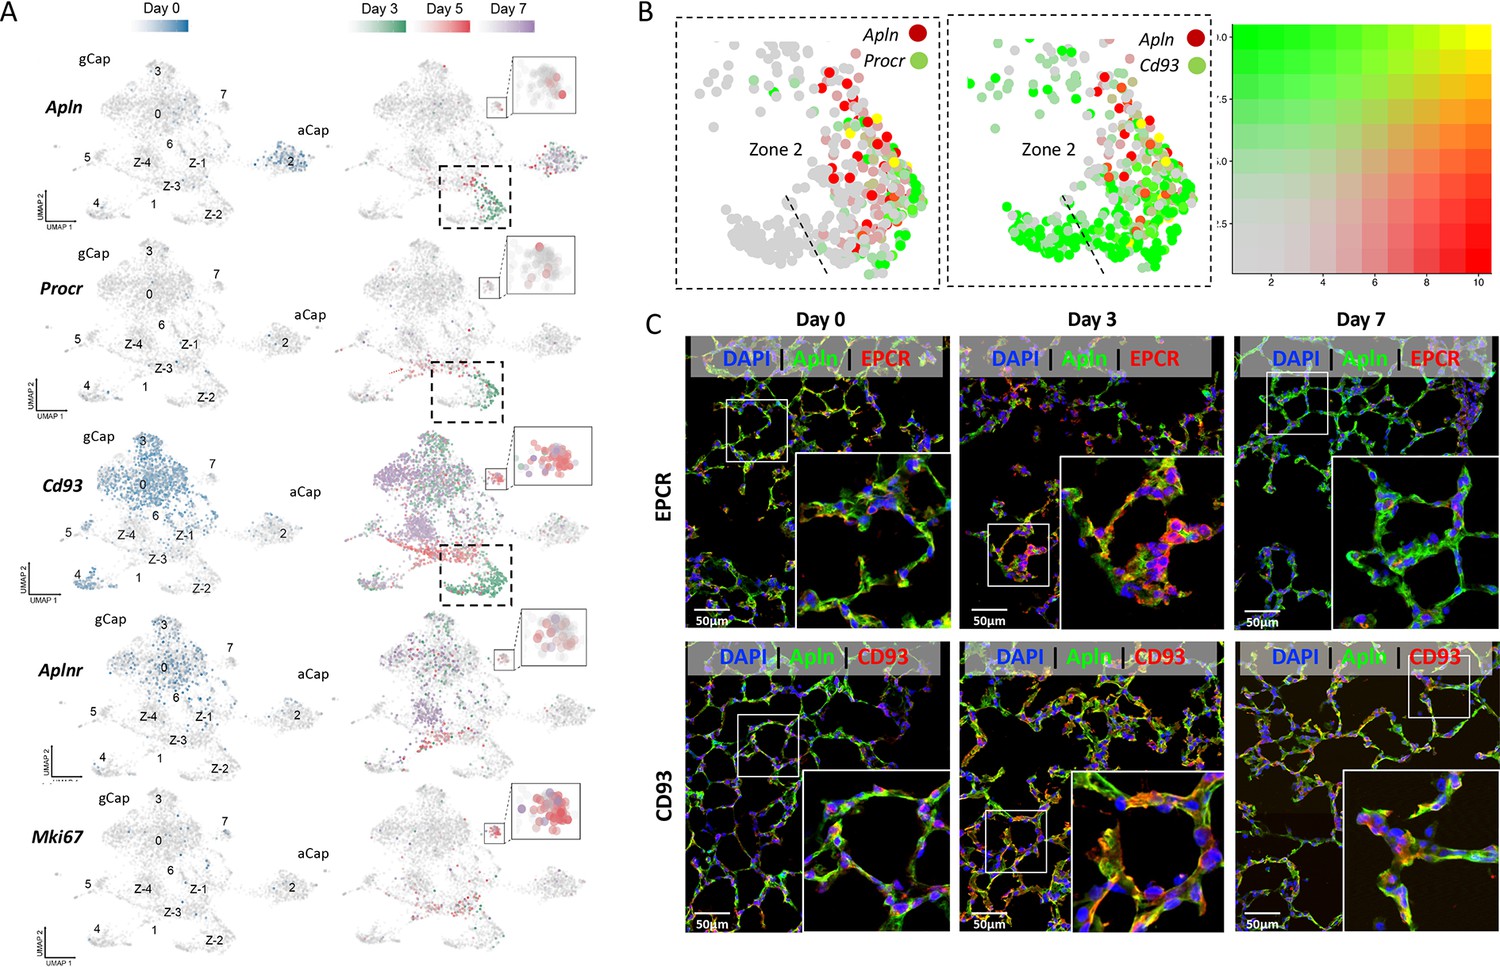
Apelin expression in a transitional general capillary (gCap) stem-like endothelial cell (EC) population at 3 days post-injury.
(A) Under basal conditions (day 0; blue color) Apln was only expressed by aCap ECs (aerocytes; Cluster 2), whereas Aplnr expression was seen in gCap ECs (Cd93 positive). 3 days after EC ablation (Green color), de novo apelin expression was apparent in gCap ECs of Zone 2, Cluster 1, together with Procr. At 5 days post-EC injury (Red color), Aplnr expression was seen in the adjacent Zone 3 of Cluster 1 and in Cluster 7. (B) Two-gene analysis of Zone 2 of Cluster 1 showing co-expression of Apln with Procr (left panel) and Cd93 (middle) at 3 days post-injury. Right panel shows 2-color scale with yellow indicating a complete overlap in expression and faded red/green partial overlap. (C) Immunofluorescence staining showing colocalization (yellow) of APLN, EPCR, and CD93 in Zone 2 of Cluster 1 only at 3 days post EC ablation. Scale bar is 50μm. More details in Figure 6—figure supplements 1–3.
Figure 6—figure supplement 1
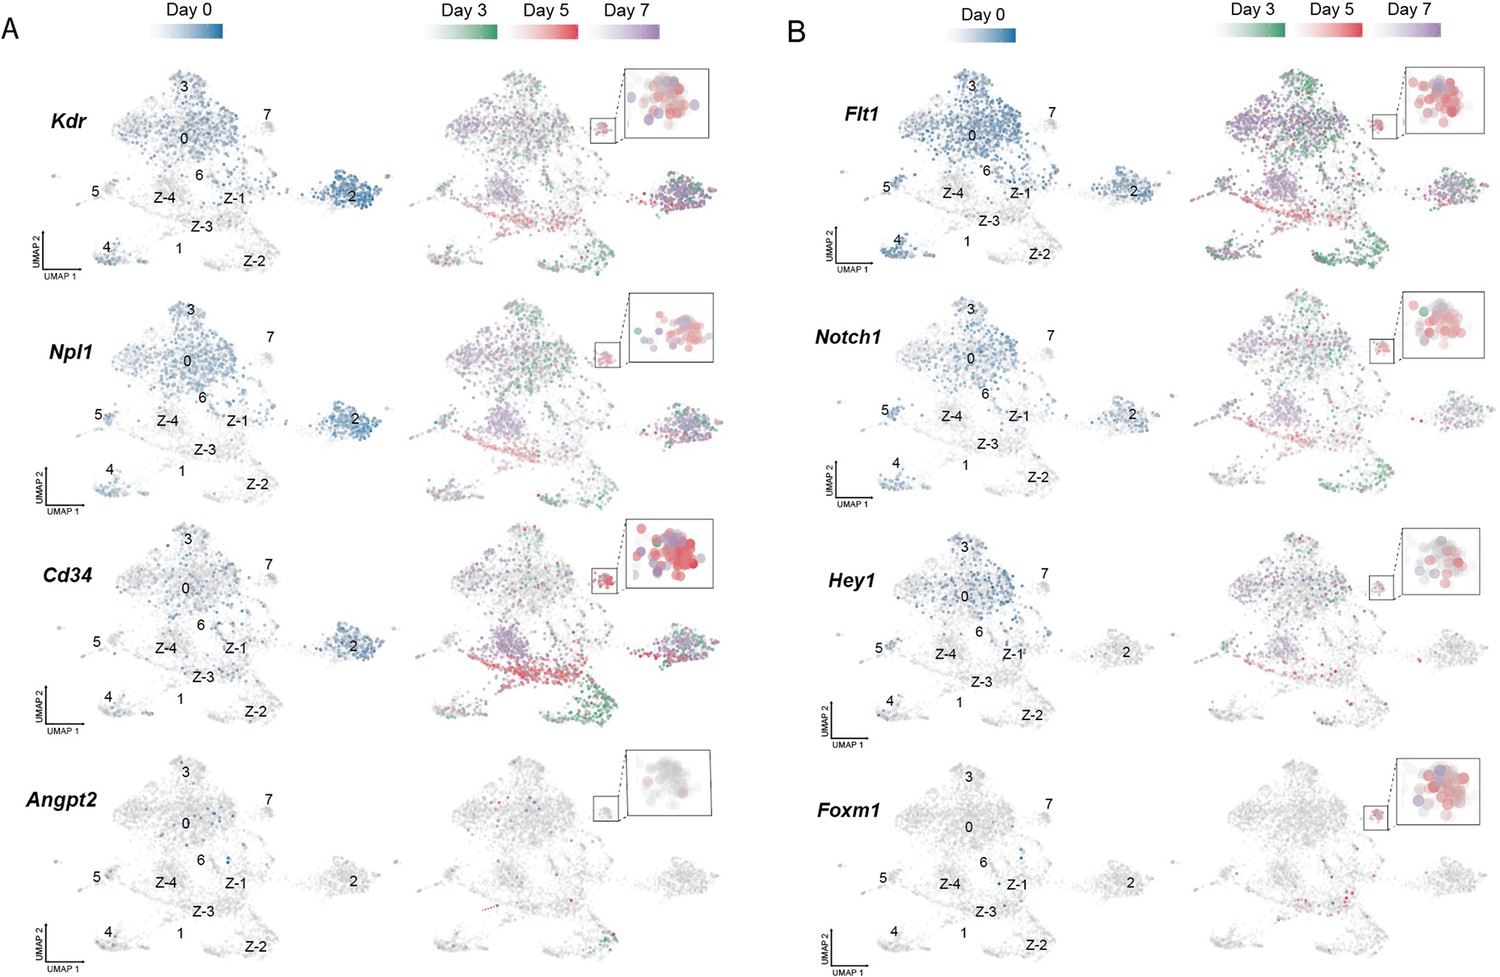
Temporal evolution of expression of tip and stalk cell genes pre and post-endothelial cell (EC) ablation.
(A) Pdgfb (Platelet Derived Growth Factor Subunit B), (B) Npl1 (Neuropilin 1), (C) Angpt2 (Angiopoietin 2), (D) Notch1 (Notch Receptor 1), and (E) Kit (KIT Proto-Oncogene, Receptor Tyrosine Kinase). Lung ECs from control mice (blue) are shown on the left and cells from the diphtheria toxin (DT)-treated cohorts are presented on the right: Day 3 (green); day 5 (red), and day 7 (purple) with Cluster 7 enlarged in the insets.
Figure 6—figure supplement 2
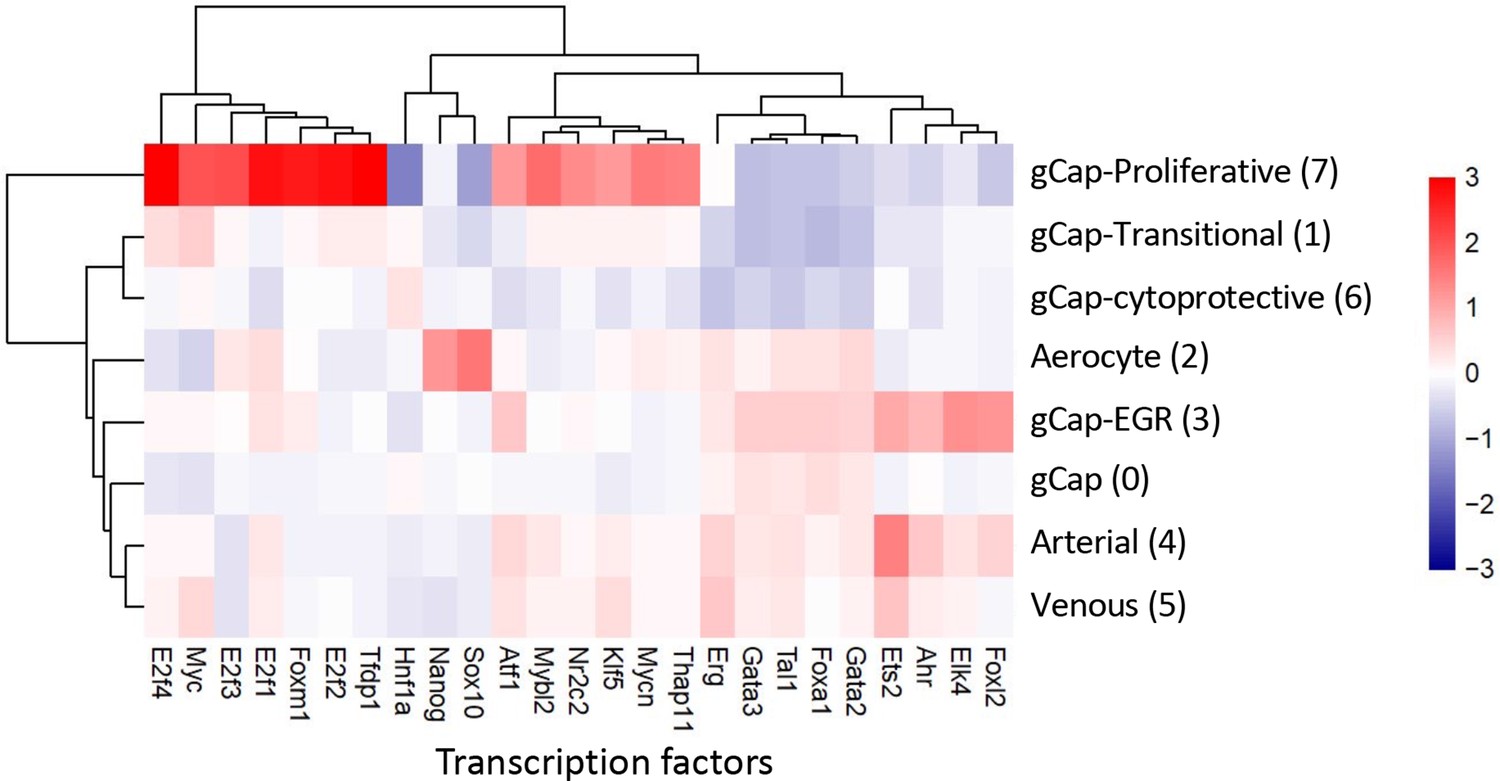
Unbiased inference of transcription factor (TF) activity based on known TF-gene set interactions (decoupleR) showing the top 25 significantly up- or down-regulated TFs.
Different endothelial cells (ECs) populations showed very distinct profiles with the gCap proliferative ECs (Cluster 7) exhibiting 13 activated TFs, including Tfdp1 (Transcription Factor Dp-1), E2f2 (E2F Transcription Factor 2), and Foxm1, among many others, and profound downregulation of Hnf1a (Hepatocyte Nuclear Factor 1-Alpha) and Sox10 (SRY-Box Transcription Factor 10). In contrast, aCap ECs (aerocytes) showed activation of only two TFs (Sox10 and Nanog). Cluster 3 gCap-EGR ECs and arterial Cluster 4 ECs showed a very similar pattern with activation of Foxl2 (Forkhead Box L2), Elk4 (ETS Transcription Factor ELK4), Ahr (Aryl Hydrocarbon Receptor), and Ets2 (ETS Proto-Oncogene 2) among others.
Figure 6—figure supplement 3
Serial single-cell transcriptomic analysis of a publicly available dataset endothelial cell (EC) gene expression in an endotoxin (LPS) model of acute lung injury (DOI: 10.1172/jci.insight.158079).
(A) Uniform manifold approximation and projection (UMAP) dimensionality reduction reveals 13 endothelial clusters. (B) The identity of these clusters is based on markers of general capillary (gCap), aerocytes (aCap), lymphatic, arterial, and venous endothelial cells (ECs). (C) Distribution of EC cultures over time showing that the eight distinct gCap EC clusters were each specific to a single timepoint, analogous to the zones within the transitional Cluster 1 in Figure 4. (D) Temporal pattern of expression of apelin (Apln), protein C receptor (Procr), and the gGap EC marker, Cd93. Red box highlights the period of co-expression Apln and Procr in gCap ECs. Blue box highlights the appearance of Foxm1 and Mki67 expressing proliferative ECs.
Figure 7 with 1 supplement
Differential gene expression and pathway enrichment analysis of endothelial sub-Clusters 1–7.
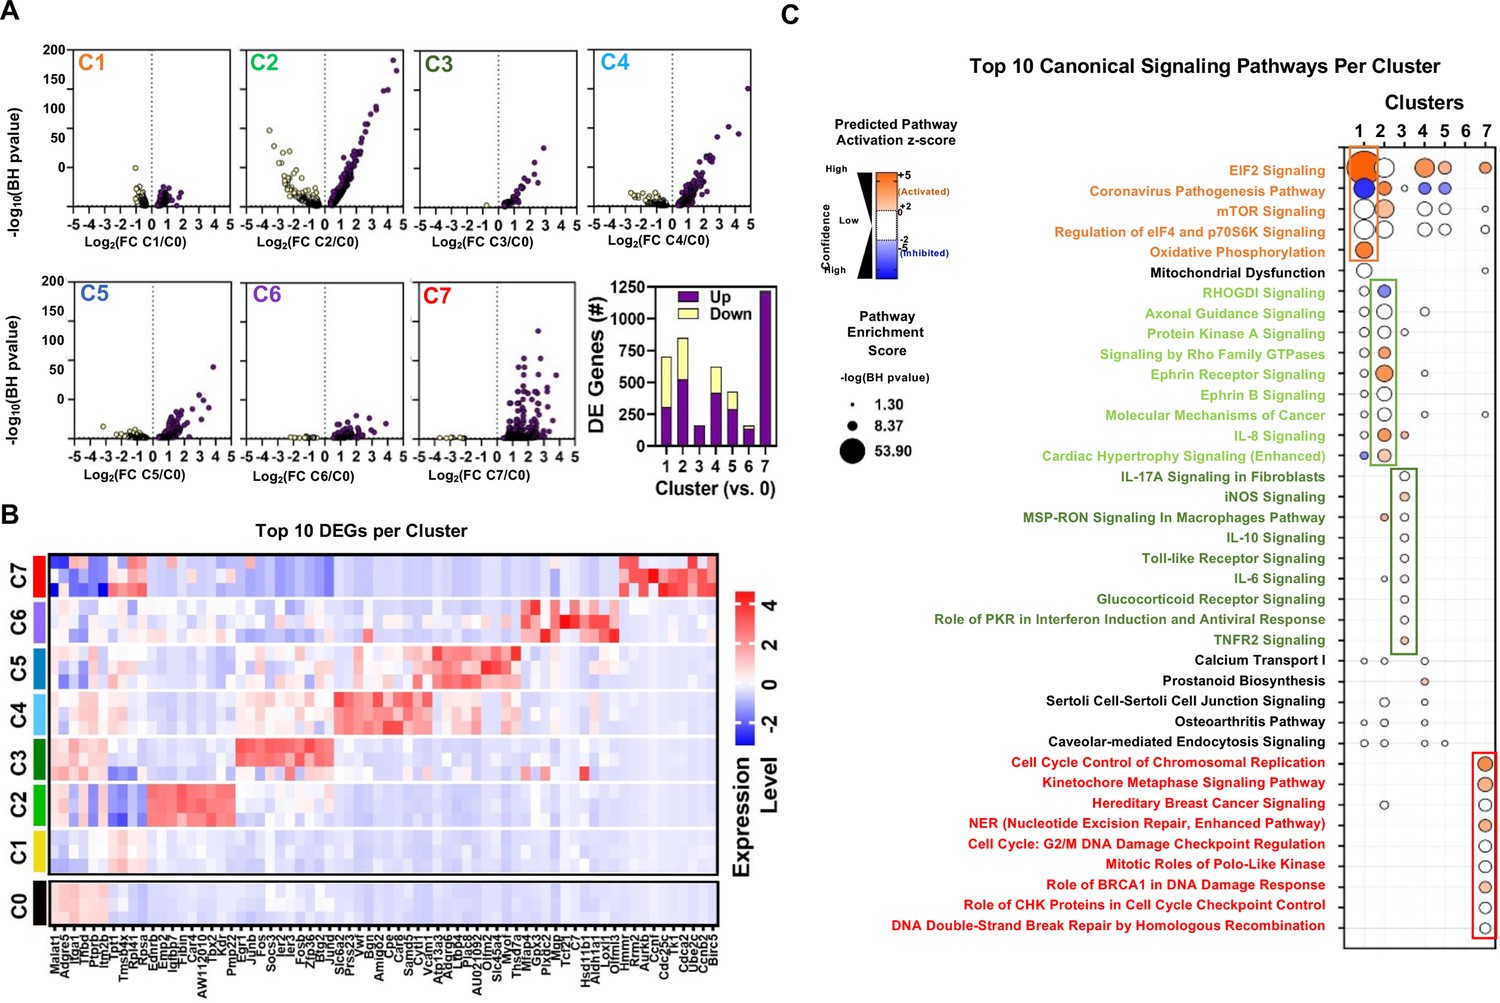
(A) Volcano plots showing the distribution of differentially expressed genes in Clusters 1–7 (C1 to C7) according to statistical significance (Benjamini-Hochberg (BH) adjusted p-value), magnitude and direction of fold change (FC) relative to Cluster 0 (at baseline time 0). Only genes that passed the false discovery rate threshold (FDR) <0.05 are shown. Bar chart summarizes the number of differentially expressed (DE) genes in each cluster (versus Cluster 0). Purple and yellow bars are stacked to show the proportion of genes that were upregulated and downregulated, respectively. (B) Heatmap shows expression levels of 68 genes representing the combined top 10 differentially expressed genes in Clusters 1–7 (versus Cluster 0) at baseline day 0. Mean expression levels (z-score of log-transformed normalized counts) are shown for n=3 mice/cluster. (C) Pathway enrichment analysis using DE gene sets from panel A with Ingenuity Pathway Analysis. Identity of 38 canonical signaling pathways representing the combined top 10 most significantly enriched pathways in each endothelial subcluster and the associated overlap between clusters. Of note, some pathways may be classified in more than one cluster. Circle size denotes the pathway enrichment score based on the BH-adjusted p-value. A minimum score of 1.3 (i.e. FDR <0.05) was used as an inclusion threshold. Z-score color denotes the predicted activation state of the pathway based on the degree of matching between the expected and observed pattern of gene expression changes. Only pathways with z-score >+2 (activated) or <−2 (inhibited) are shown in color to highlight confident predictions. White circles denote pathways in which the activation state cannot be confidently predicted. No pathways were significantly enriched in DE genes from Cluster 6 at FDR <0.05. The identities of all significantly enriched canonical pathways are presented in Figure 7—figure supplement 1.
Figure 7—figure supplement 1
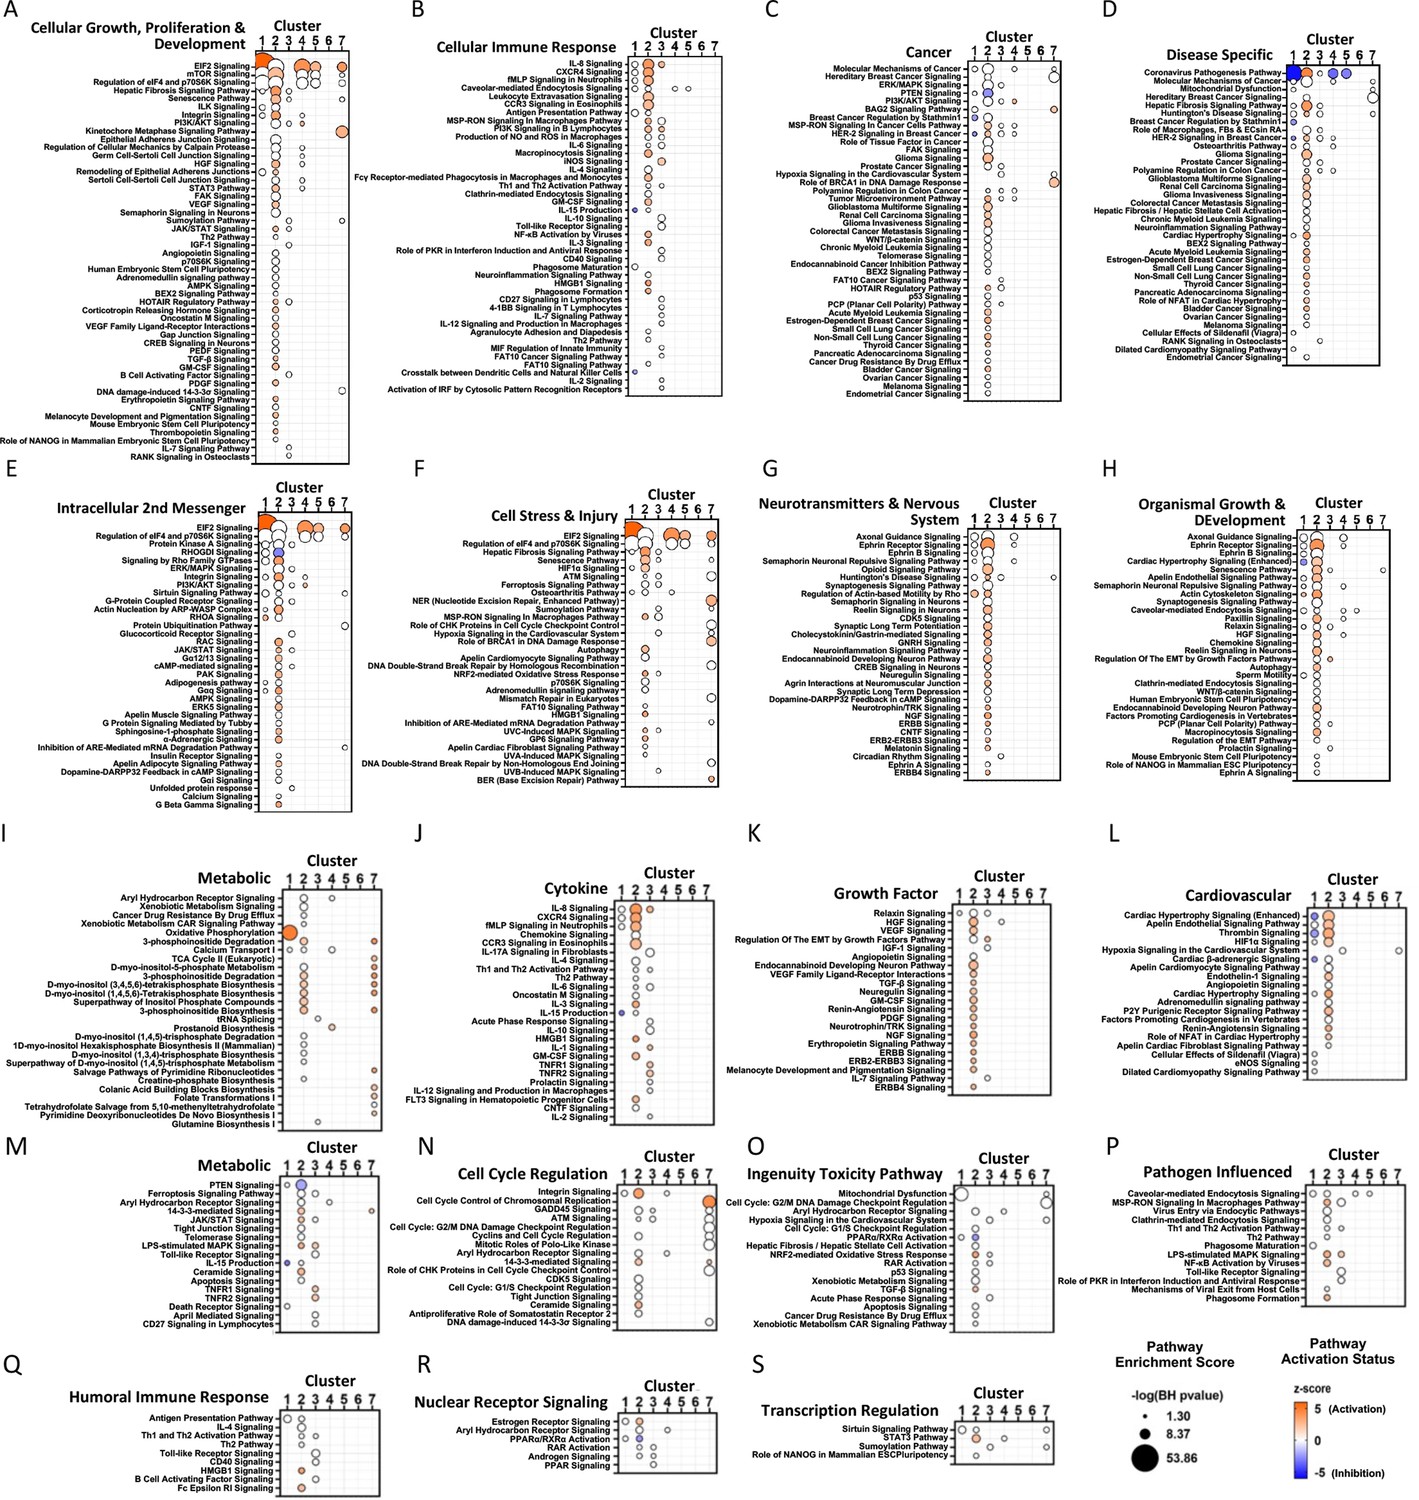
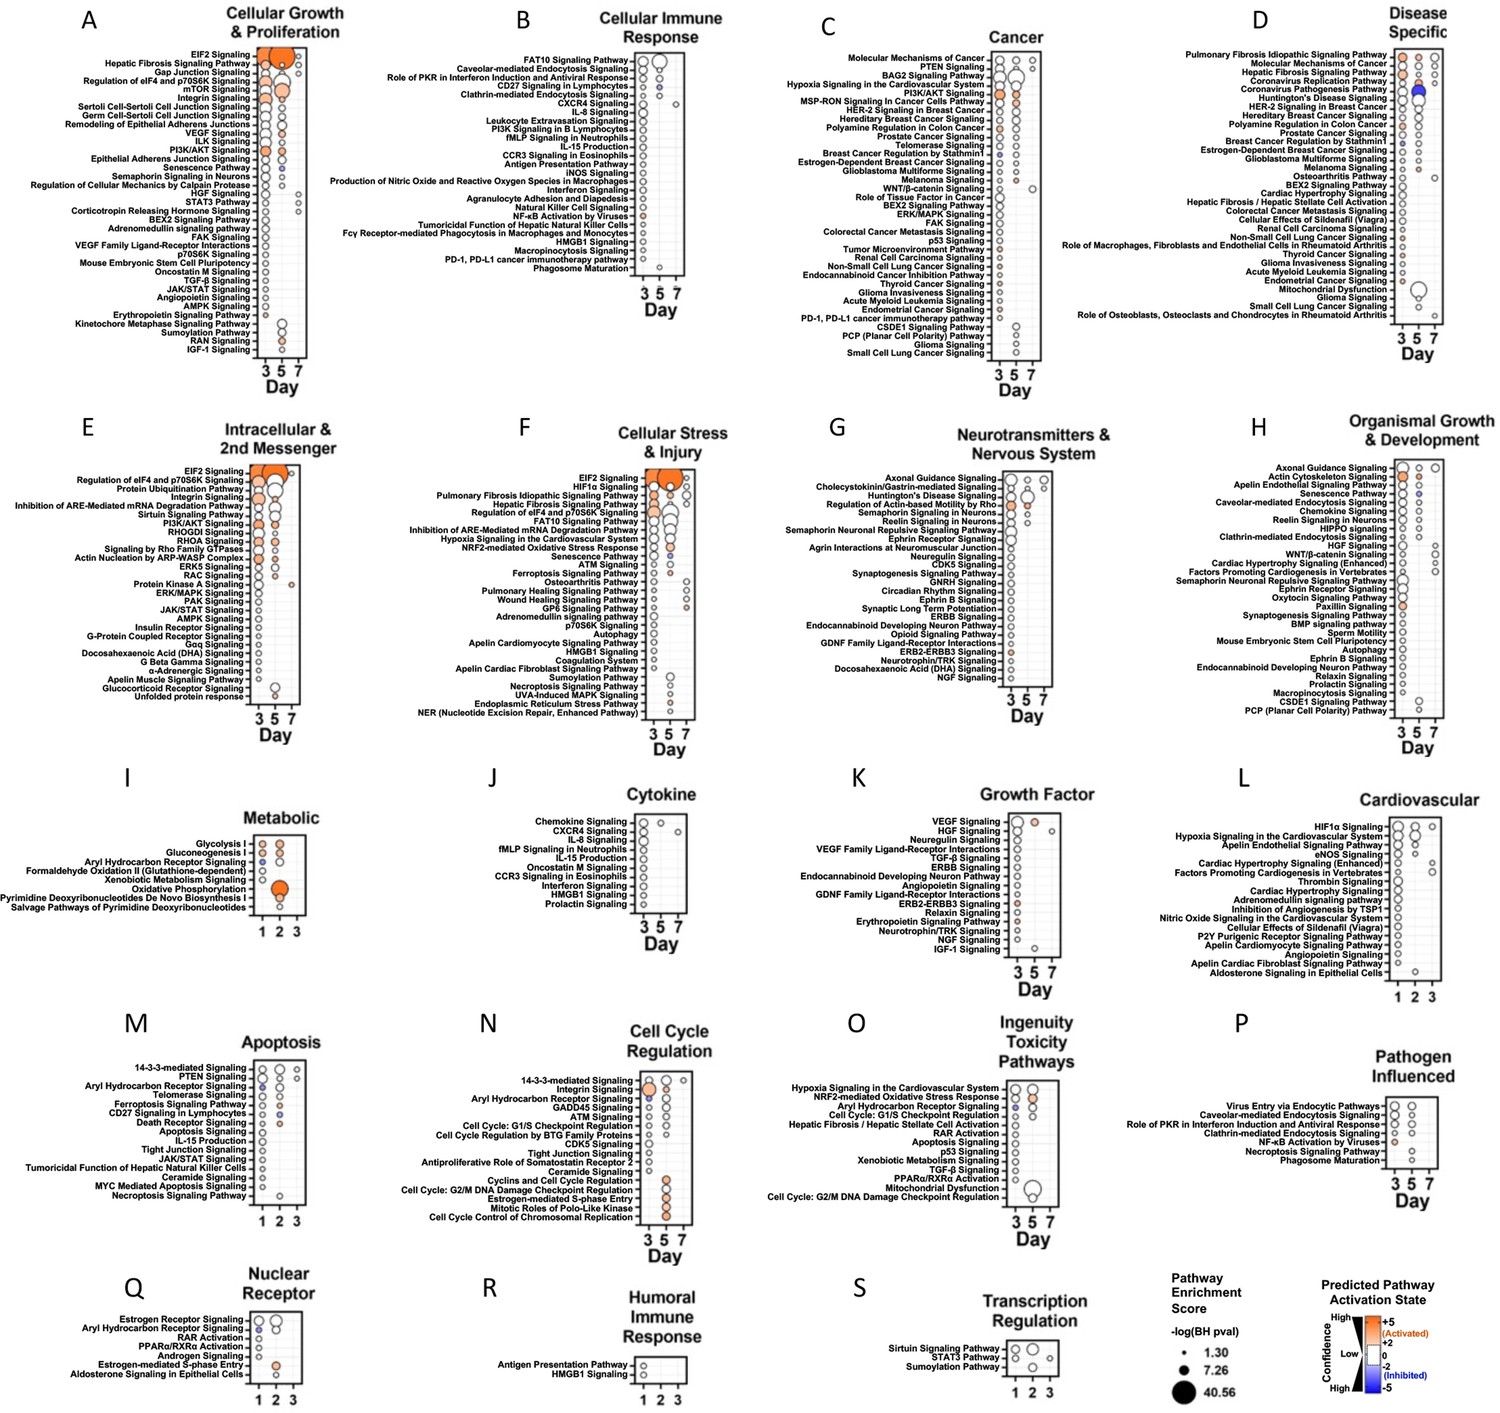
Pathway enrichment analysis of endothelial Clusters 1–7 via Ingenuity Pathway Analysis.
Each panel shows a predefined functional category and specific canonical signaling pathways that were significantly enriched in genes altered in each endothelial Cluster 1–7 (x-axis). Circle size denotes the pathway enrichment score based on the Benjamini-Hochberg (BH) corrected p-value. A minimum score of 1.3 (i.e. FDR <0.05) was used as an inclusion threshold. Z-score color denotes the predicted activation state of the pathway based on the degree of matching between the expected and observed pattern of gene expression changes. Only pathways with z-score >+2 (activated) or <−2 (inhibited) are shown in color to highlight confident predictions. White circles denote pathways in which the activation state cannot be confidently predicted. No pathways were significantly enriched in differentially expressed (DE) genes from Cluster 6 at the FDR <0.05 threshold.
Figure 8 with 2 supplements
Differential expression and pathway enrichment analysis of time-dependent changes in Zones 1–4 of endothelial Cluster 1.
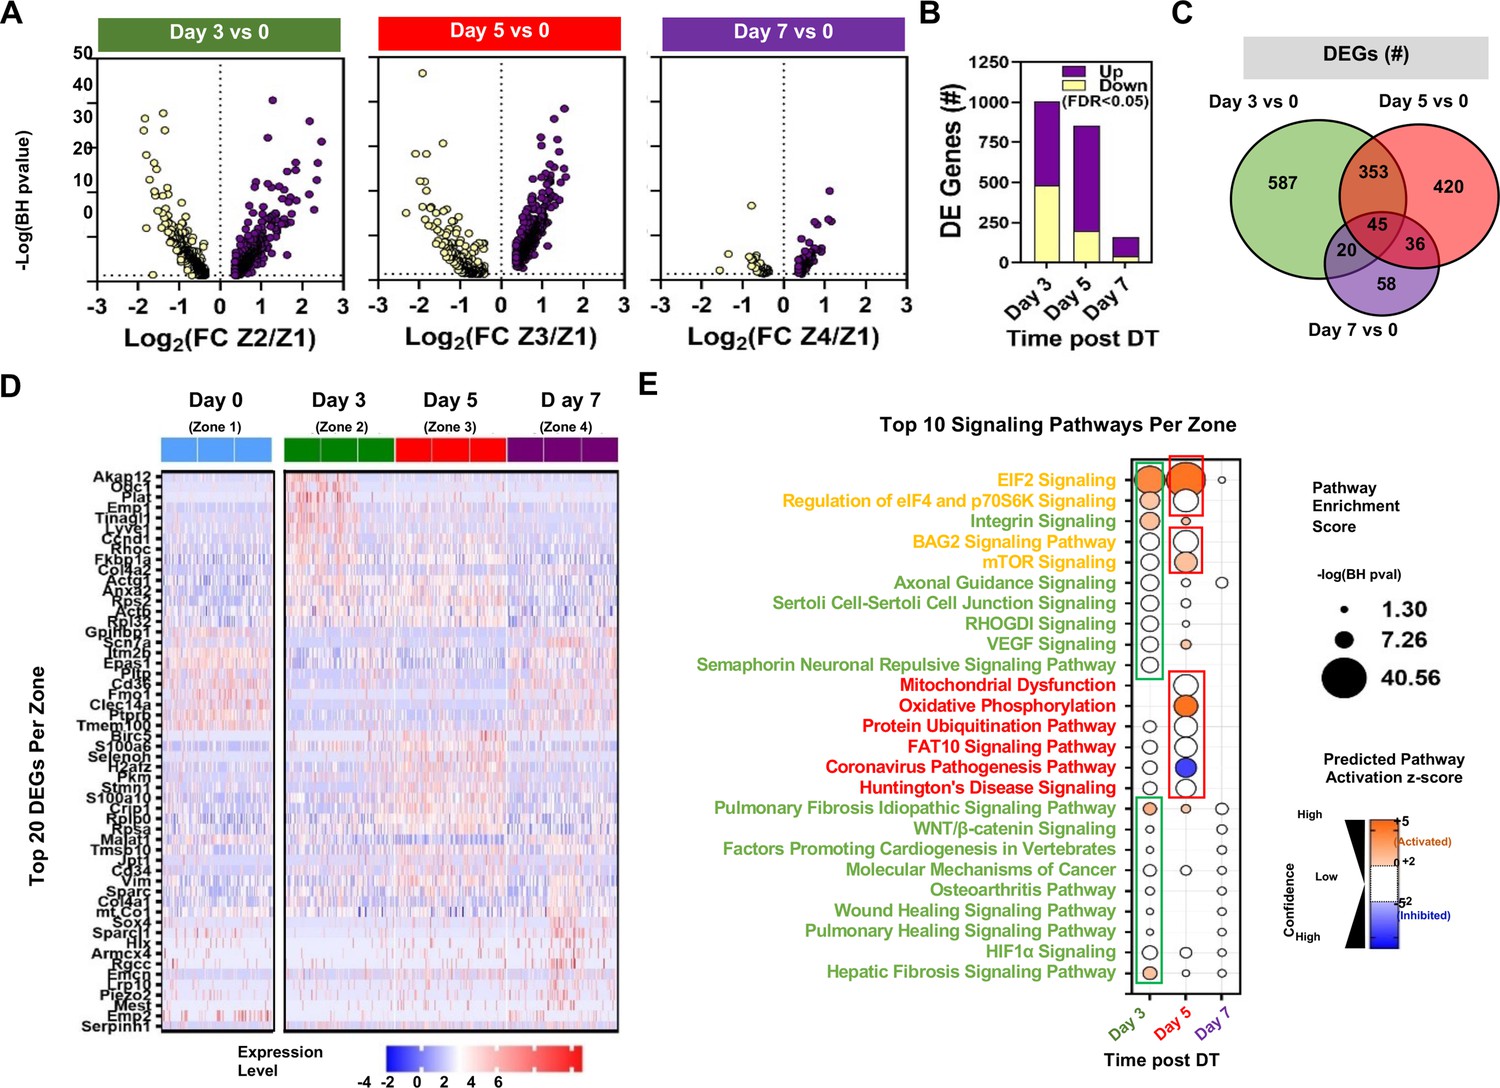
(A) Volcano plots showing the distribution of differentially expressed genes according to statistical significance, magnitude, and direction of fold change (FC) at different points following administration of diphtheria toxin (DT) in mice. Only genes that passed the false discovery rate (FDR) threshold <0.05 are shown (i.e. Enrichment score –log(BH p-value)>1.3). Zones 1, 2, 3, and 4 denote day 0, day 3, day 5, and day 7, respectively. (B) Summary of the number of differentially expressed (DE) genes in each comparison. Purple and yellow bars are stacked to show the proportion of genes that were upregulated and downregulated, respectively. (C) Venn diagram shows the degree of overlap in the identity of differentially expressed genes for each comparison. (D) Heatmap shows expression levels of 54 genes representing the top 20 differentially expressed genes at days 3, 5, and 7 versus day 0. Expression levels (z-score of log-transformed normalized counts) are shown for a sample of 50 cells from each mouse (n=3 mice/time point). (E) Pathway enrichment analysis using DE gene sets from panel B with Ingenuity Pathway Analysis. The top 10 signaling pathways (by enrichment score) are shown for each time zone. Circle size denotes the pathway enrichment score based on the Benjamini-Hochberg (BH) corrected p-value. A minimum score of 1.3 (i.e. FDR <0.05) was used as an inclusion threshold. Z-score color denotes the predicted activation state of the pathway based on the degree of matching between the expected and observed pattern of gene expression changes. Only pathways with z-score >+2 (activated) or <−2 (inhibited) are shown in color to highlight confident predictions. White circles denote pathways in which the activation state cannot be confidently predicted. The identities of all significantly enriched canonical pathways in Zones 1–4 of Cluster 1 are presented in Figure 8—figure supplement 1 with additional details in Figure 8—figure supplement 2.
Figure 8—figure supplement 1
Pathway enrichment analysis of time-dependent changes in endothelial Cluster 1 at days 3, 5, and 7 versus day 0.
Each panel shows a predefined functional category and specific canonical signaling pathways (y-axis) that were significantly enriched in genes altered at each time point (days 3, 5, and 7 versus day 0) in endothelial Cluster 1 (x-axis). Circle size denotes the pathway enrichment score based on the Benjamini-Hochberg (BH) corrected p-value. A minimum score of 1.3 (i.e. FDR <0.05) was used as an inclusion threshold. Z-score color denotes the predicted activation state of the pathway based on the degree of matching between the expected and observed pattern of gene expression changes. Only pathways with z-score >+2 (activated) or <−2 (inhibited) are shown in color to highlight confident predictions. White circles denote pathways in which the activation state cannot be confidently predicted. Of note, some canonical pathways may be classified in more than one category.
Figure 8—figure supplement 2
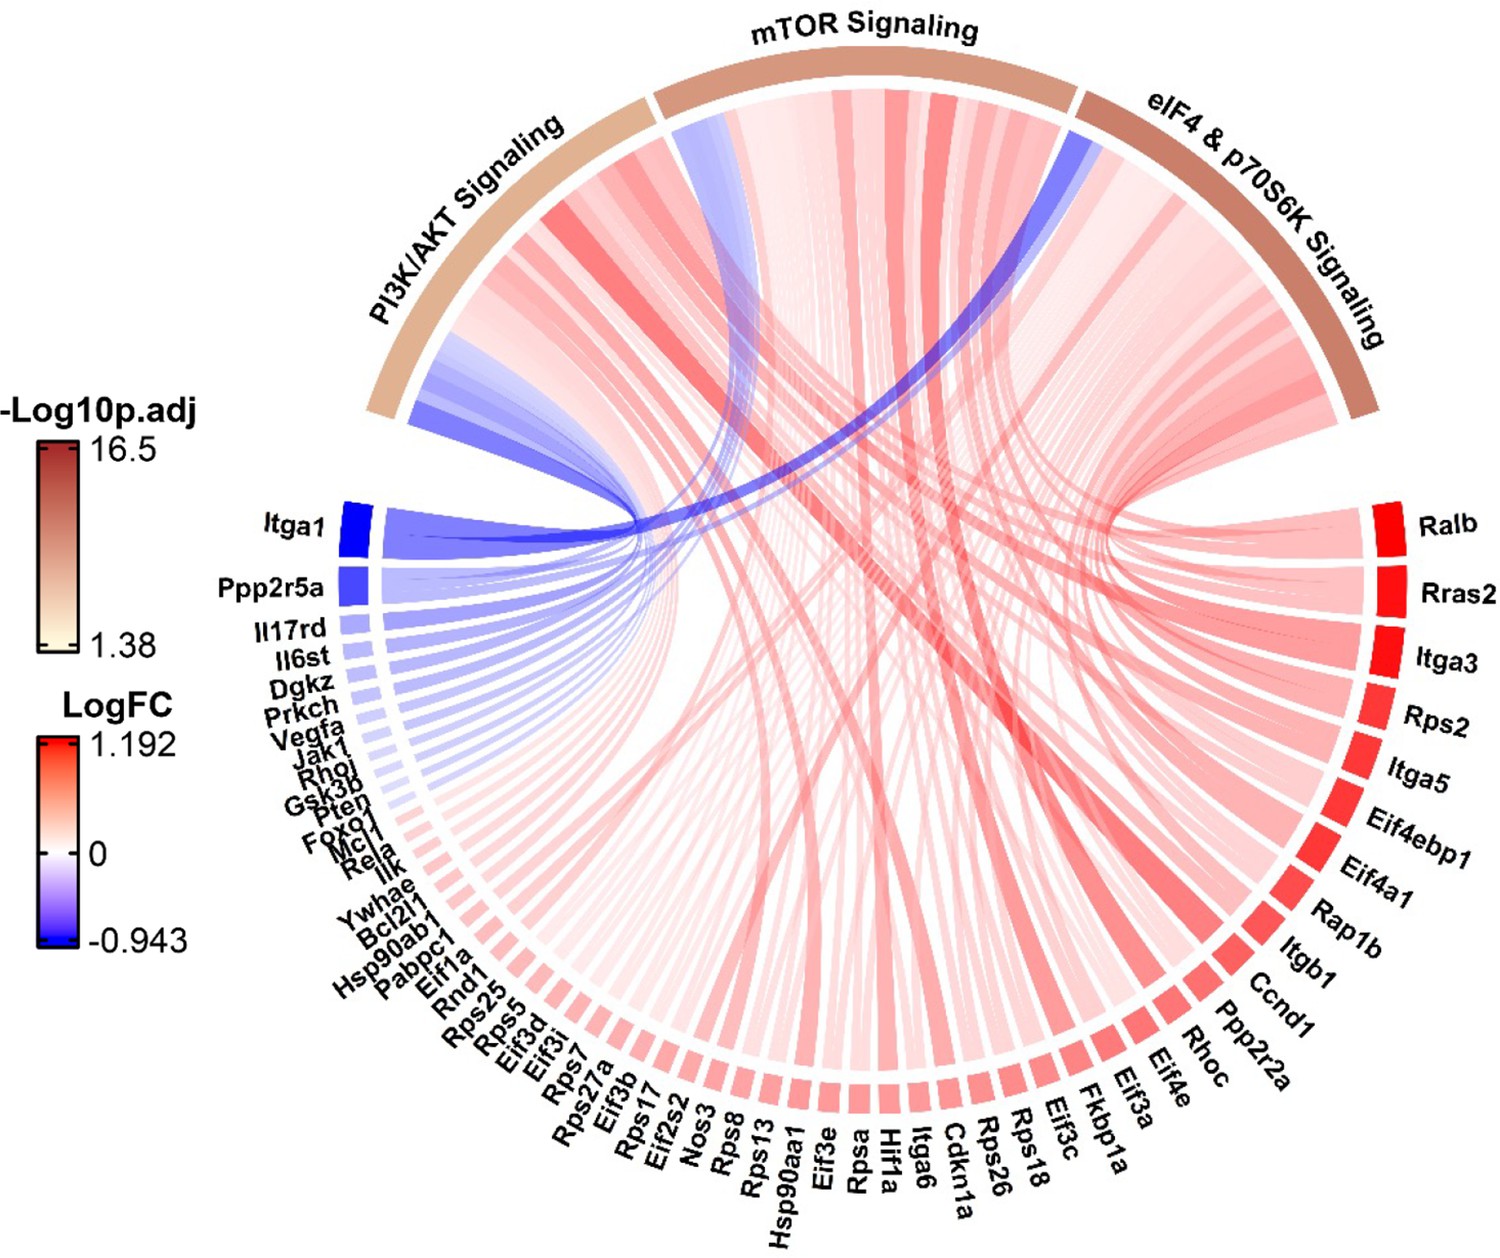
Chord diagram showing the activation or inhibition of genes in three canonical pathways involved in apelin signaling (PI3/Akt, mTor, Elf4/p70S6K) during the emergence of the apelin/Procr expressing general capillary (gCap) endothelial cells (ECs) at day 3.
Figure 9
Cell Signaling inferences using NicheNet.
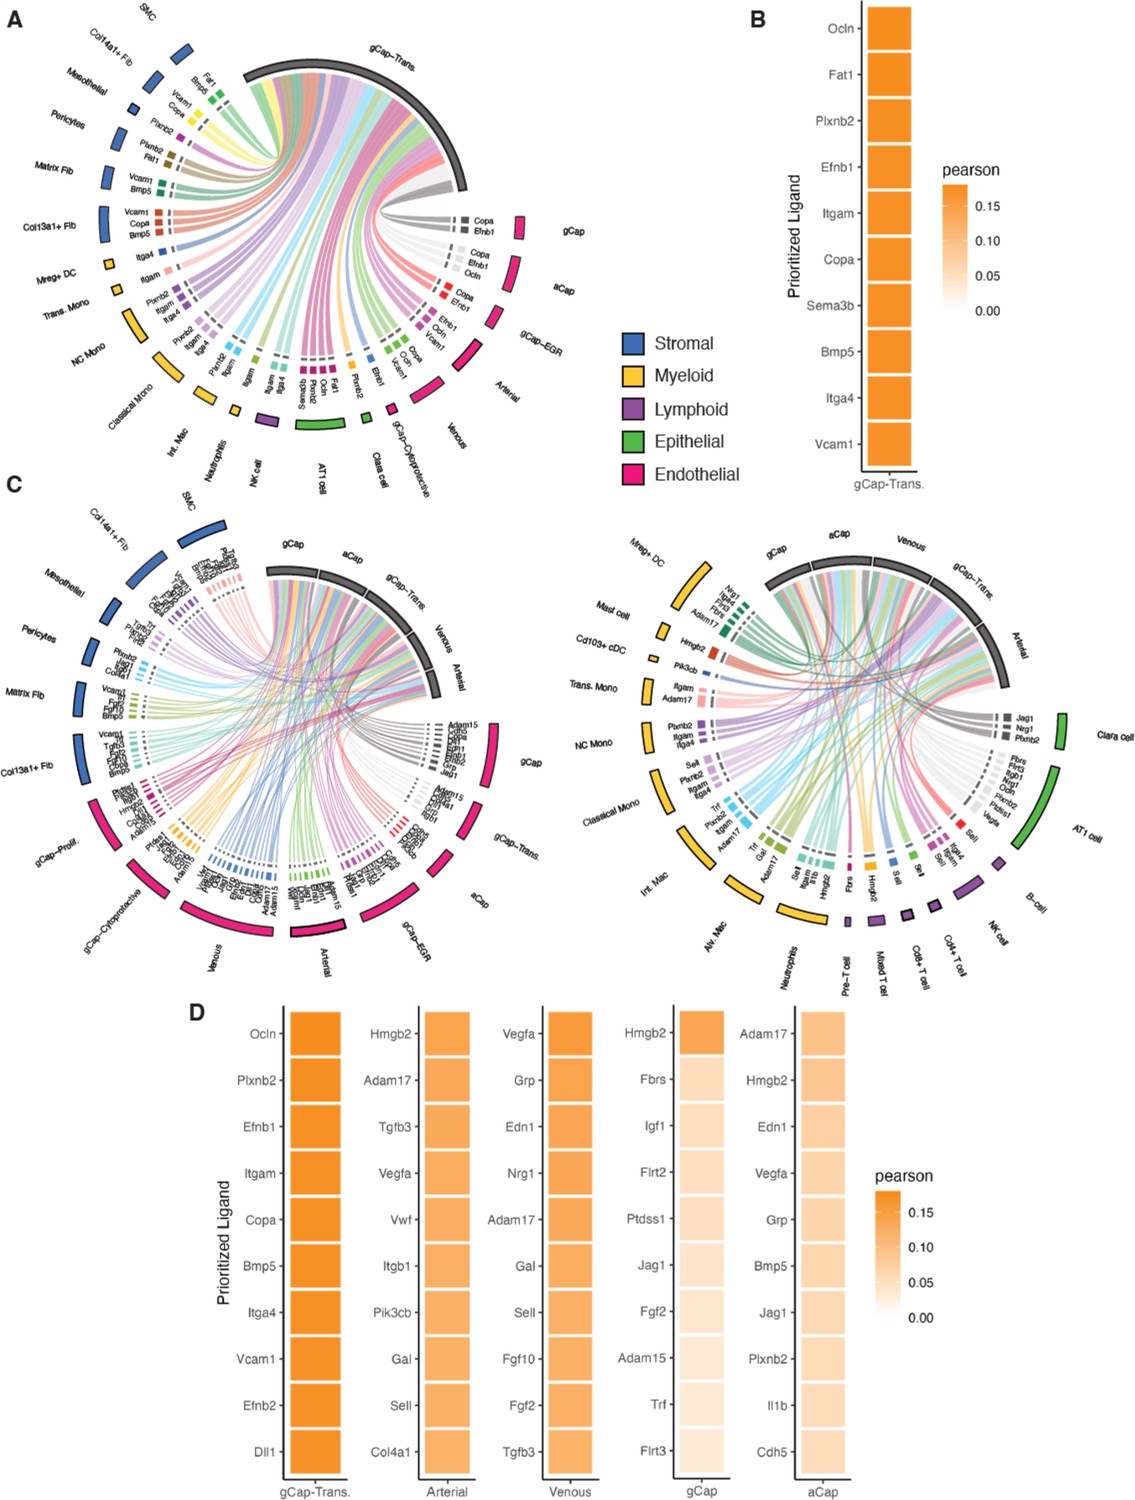
Circos plots showing color-coded sender populations (outer circle) indicating the 10 top genes signaling for each receiver population (shown in gray). (A) At day 3, only one population, general capillary (gCap)-transitional Cluster 1, met the criteria for a ‘receiver’ and this cluster received signals form 21 separate cell clusters representing five distinct cell populations (stromal, myeloid, lymphoid, epithelial, and endothelial). (B) Heatmap shows the Pearson’s correlation coefficients of the top 10 ligand-receptor interactions for the gCap endothelial cell (EC) receiver population. (C) At day 5, there was a substantially greater diversity in cell-cell interactions, with five endothelial receiver populations responding to signals from 31 cell clusters. (D) Heatmaps of Pearson’s correlation coefficients of the top 10 ligand-receptor interactions for each receiver population.
Figure 10
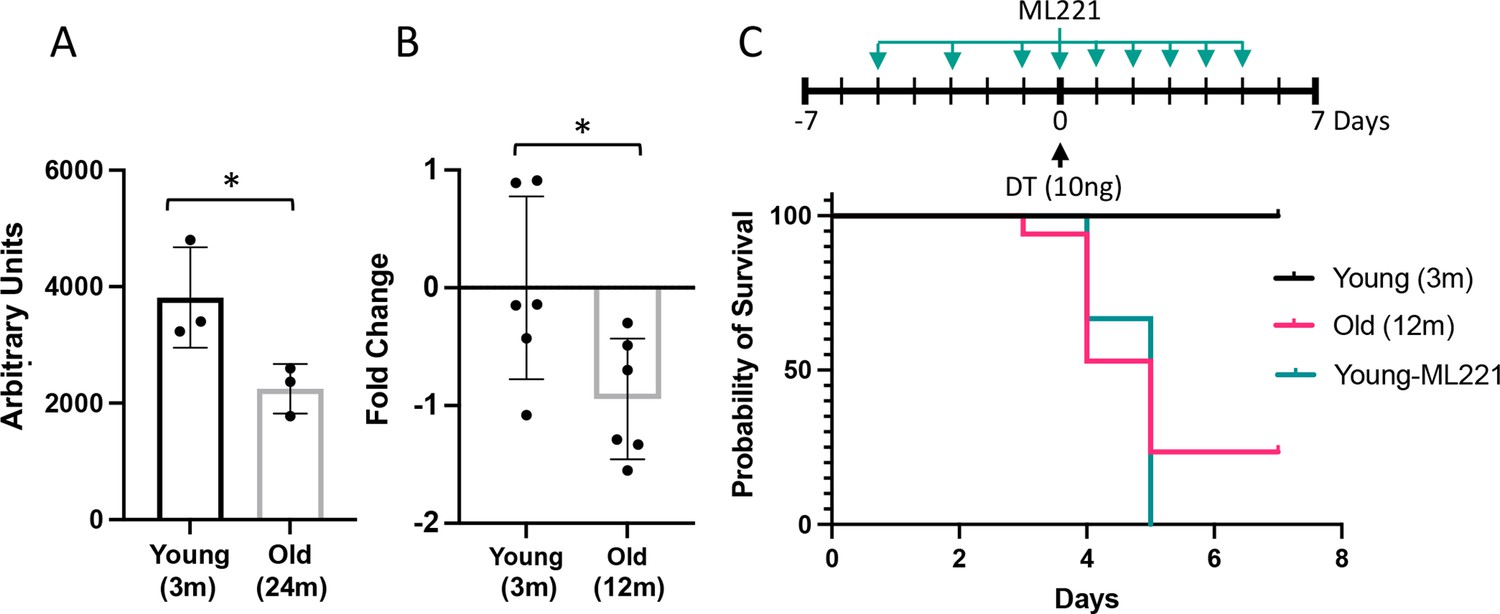
Impairment or inhibition of the apelin pathway leads to failure of recovery after endothelial cell (EC) ablation.
(A) Expression of apelin from a publicly available dataset (31) in young (3 months) versus old (24 months) mice (*=p<0.05, unpaired t-test). (B) Apelin expression assessed by qRT-PCR expressed as fold-change relative to mean value in young (3 months) Cdh5-DTR binary transgenic mice (*=p<0.05, unpaired t-test). (C) Survival after intra-tracheal (IT) instillation of diphtheria toxin (DT) of either 3 (Young) or 12-month-old (Old) Cdh5-DTR with or without administration of the apelin antagonist, ML221 (10 mg/kg IP). Survival of old mice or mice receiving ML221 was significantly different from young control mice (p<0.05, Mantel-Cox log-rank test). n=11 Young-DT, n=17 Old-DT, n=7 Young-DT+ML221, n=3 Control ML221. Data presented as mean ± SD.
Figure 11
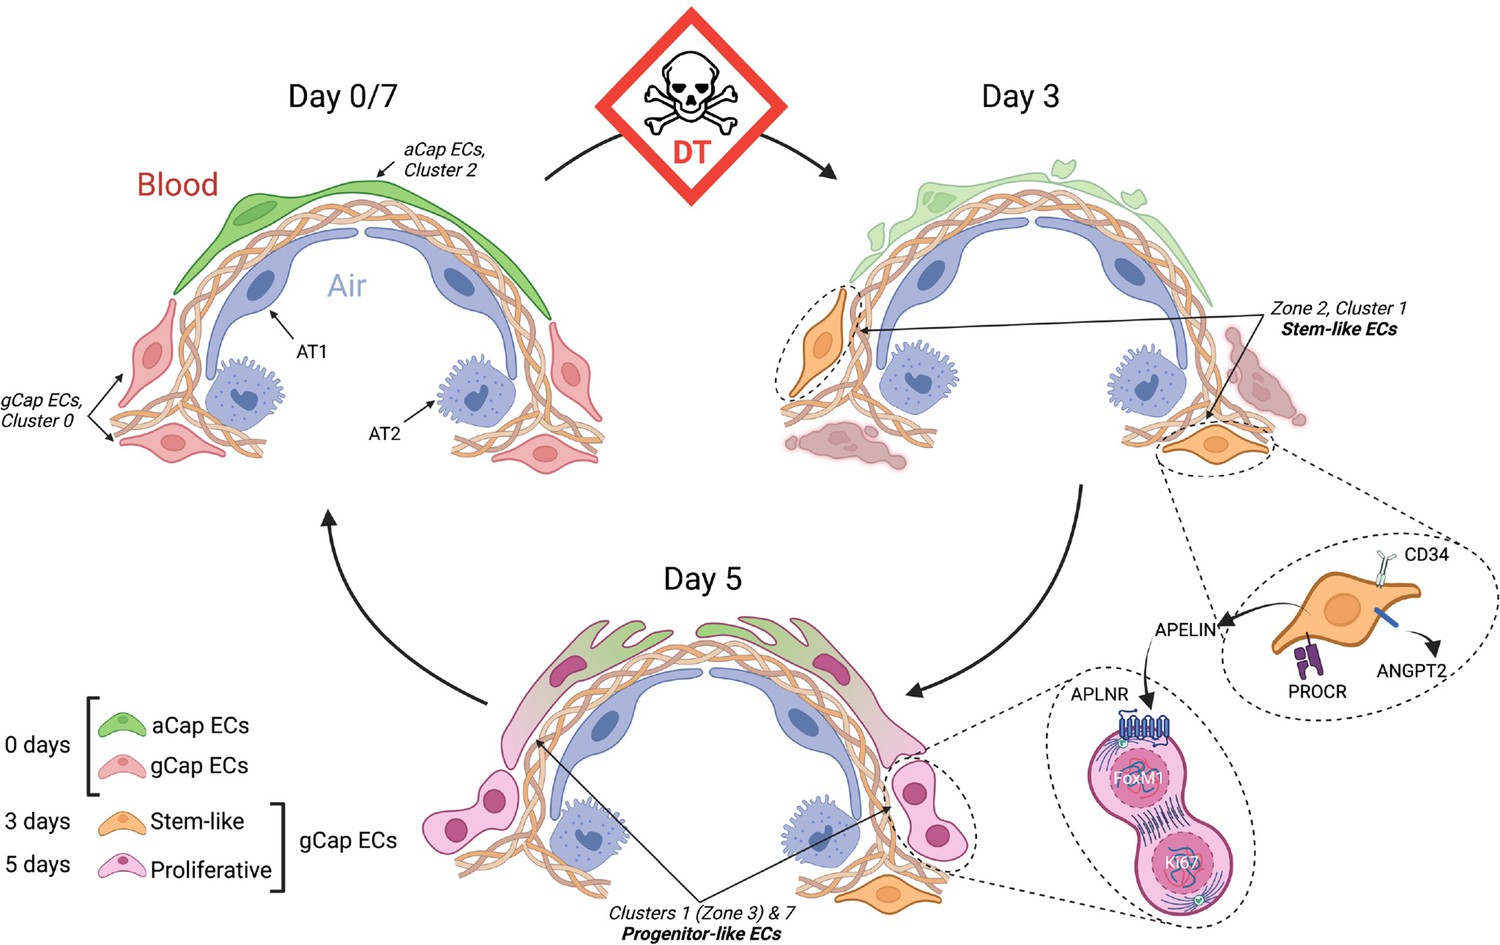
Schematic of endothelial cell (EC) populations contributing to microvascular repair.
At baseline (day 0), there are two main alveolar groups of capillary ECs: larger apelin-positive aerocytes (aCap) ECs, termed aerocytes, that play a key structural role in forming the air-blood barrier; and smaller apelin receptor-expressing general capillary (gCap) ECs, which are found in the thicker regions at the corners of the alveoli. After diphtheria toxin (DT)-induced EC ablation, there is a marked depletion of both EC populations and the appearance of novel transitional and transient populations. At day 3, there is the appearance of stem-like gCap ECs that paradoxically express apelin, but not its receptor, and are characterized by various stem and progenitor cell markers but show no evidence of proliferation. By day 5, these transition to ECs expressing Aplnr which have a strong proliferative phenotype, as evidenced by Forkhead box M1 (Foxm1) and Mki67 expression, and then rapidly replenish depleted EC pools, including aCap ECs, by day 7. This transition is orchestrated by the interaction of apelin with its receptor as a critical mechanism in lung microvascular regeneration after EC injury. AT1, alveolar type –1 epithelial cell; AT2, alveolar type-2 epithelial cell; APLNR, apelin receptor; ANGPT2, angipoietin 2; PROCR, protein C receptor.
Created with BioRender.com.
Author response image 1
Additional files
Download links
A two-part list of links to download the article, or parts of the article, in various formats.
Downloads (link to download the article as PDF)
Open citations (links to open the citations from this article in various online reference manager services)
Cite this article (links to download the citations from this article in formats compatible with various reference manager tools)
Single-cell transcriptomic atlas of lung microvascular regeneration after targeted endothelial cell ablation
eLife 12:e80900.
https://doi.org/10.7554/eLife.80900


