Ephrin-B1 regulates the adult diastolic function through a late postnatal maturation of cardiomyocyte surface crests
- INSERM, UMR 1297, Institut des Maladies Métaboliques et Cardiovasculaires, Université de Toulouse, France
- Department of Pediatric Cardiology, Centre Hospitalier Universitaire de Toulouse, France
- Department of Forensic Medicine, Centre Hospitalier Universitaire de Toulouse, Université de Toulouse, France
- Department of Cell Biology, University of Virginia School of Medicine, United States
- Université de Bordeaux, INSERM, Biologie des maladies cardiovasculaires, France
- Université de Montpellier, INSERM, CNRS, PhyMedExp, France
- IGDR UMR 6290, CNRS, Université de Rennes 1, France
- CARDIOMEDEX, France
- Department of Diabetology, Metabolic Diseases & Nutrition, Centre Hospitalier Universitaire de Toulouse, France
- Service des Maladies Cardiaques et Vasculaires, CHU de Bordeaux, France
- Department of Clinical Pharmacology, Centre Hospitalier Universitaire de Toulouse, France
Figures
Figure 1 with 8 supplements
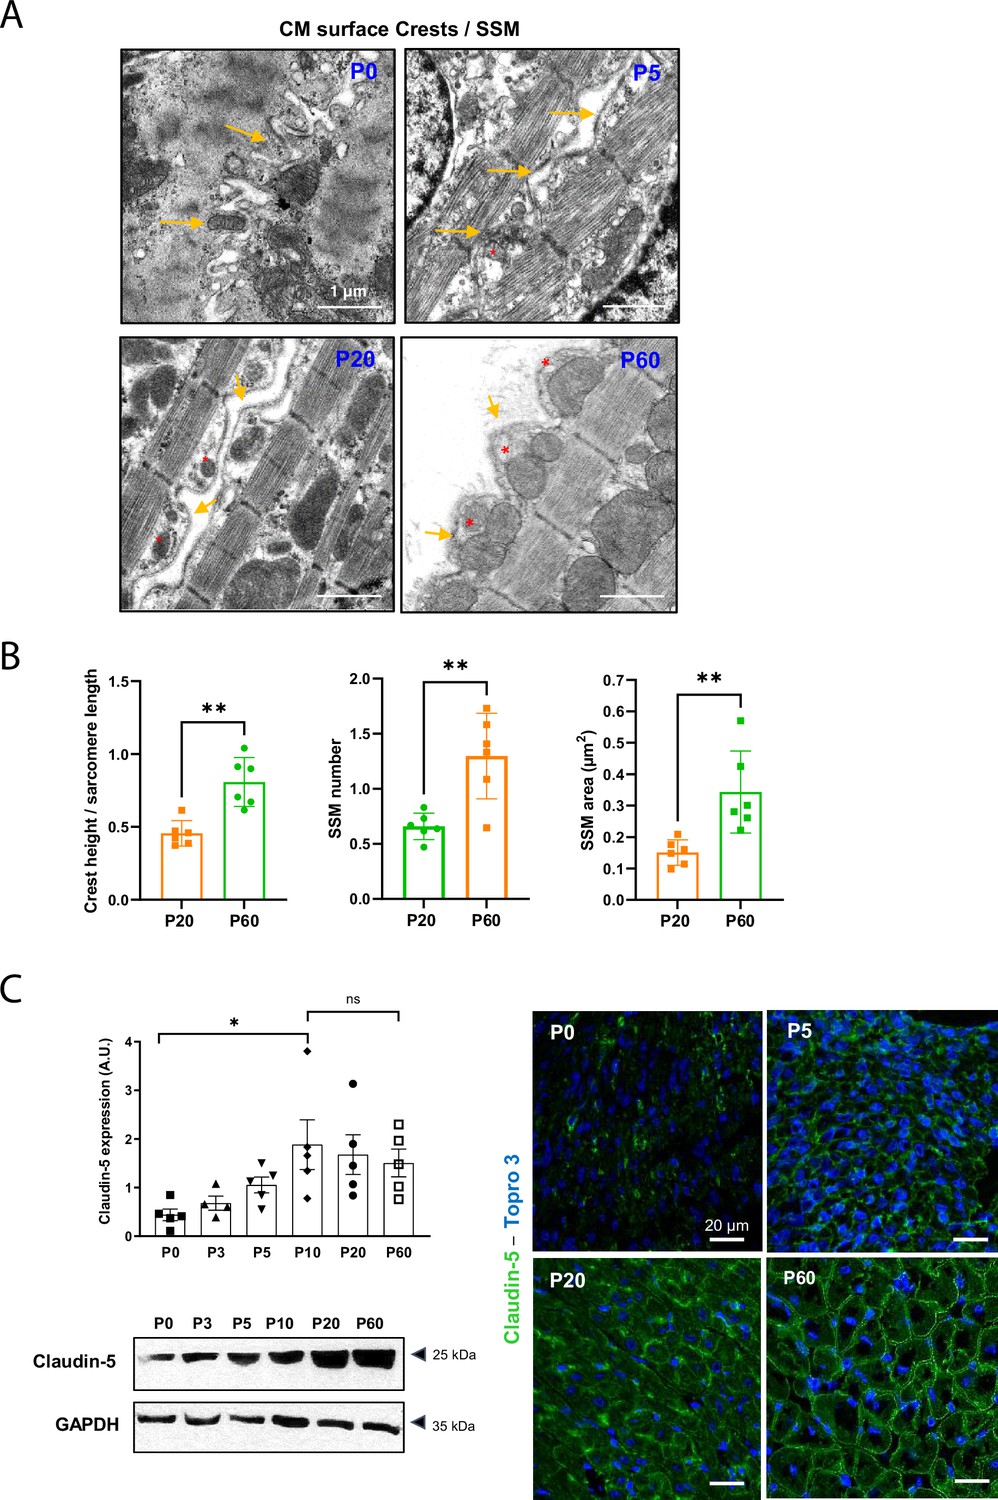
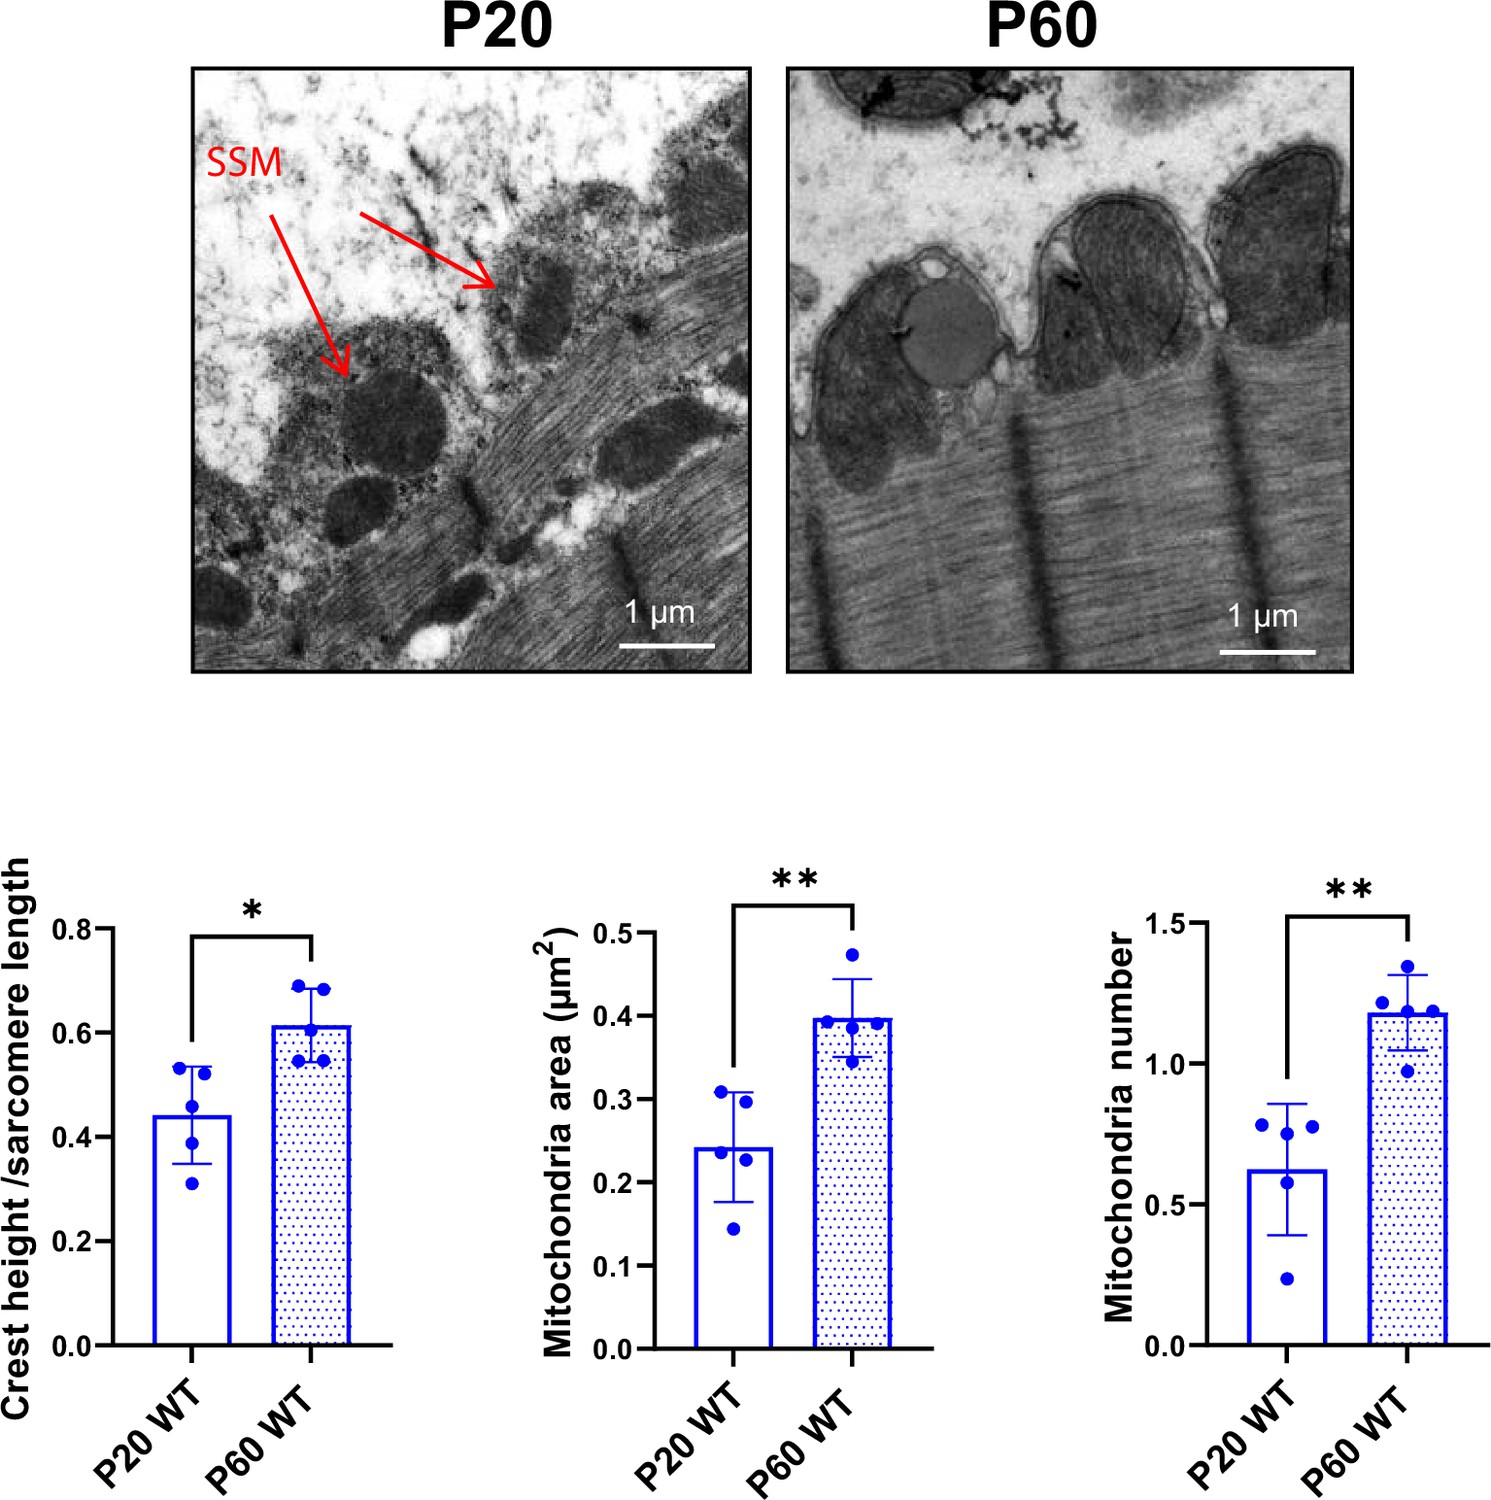
Cardiomyocyte (CM) surface crests mature after postnatal day 20 (P20).
(A) Transmission electron microscopy (TEM) micrographs showing representative CM surface crest relief (yellow arrows) and associated subsarcolemmal mitochondria (SSM) (red stars) during rat postnatal maturation at postnatal day 0 (P0), 5 (P5), 20 (P20), and 60 (P60). (B) Quantification of crest heights/sarcomere length (left panel), SSM number/crest (middle panel), and SSM area (right panel) from TEM micrographs obtained from P20- or P60 rat hearts (P20 or P60 n = 6 rats; 4–8 CMs/rat, ~70 crests/rat). (C) (Left panel) Western blot quantification of claudin-5 protein expression in heart tissue from P0 to P60 old rats (upper panel) and representative immunoblot (lower panel) (P0 n = 5, P3 n = 4; P5 n = 5, P10 n = 5, P20 n = 5, P60 n = 5); (right panel) immunofluorescent localization of claudin-5 in heart cryo-sections from P0, P5, P20, and P60 rats. Data are presented as mean ± SD. Unpaired Student’s t-test for two group comparisons and one-way ANOVA for claudin-5 Western -blot analysis, Tukey post-hoc test for six group comparisons with P0 as control. *p<0.05, **p<0.01. ns, not significant.
-
Figure 1—source data 1
Raw data of CM crest maturity quantified in P20 and P60 rats.
- https://cdn.elifesciences.org/articles/80904/elife-80904-fig1-data1-v1.xlsx
-
Figure 1—source data 2
Raw data of claudin-5 western blot (quantifications).
- https://cdn.elifesciences.org/articles/80904/elife-80904-fig1-data2-v1.xlsx
-
Figure 1—source data 3
Raw data of claudin-5 western-blot (Original films).
- https://cdn.elifesciences.org/articles/80904/elife-80904-fig1-data3-v1.pdf
Figure 1—figure supplement 1
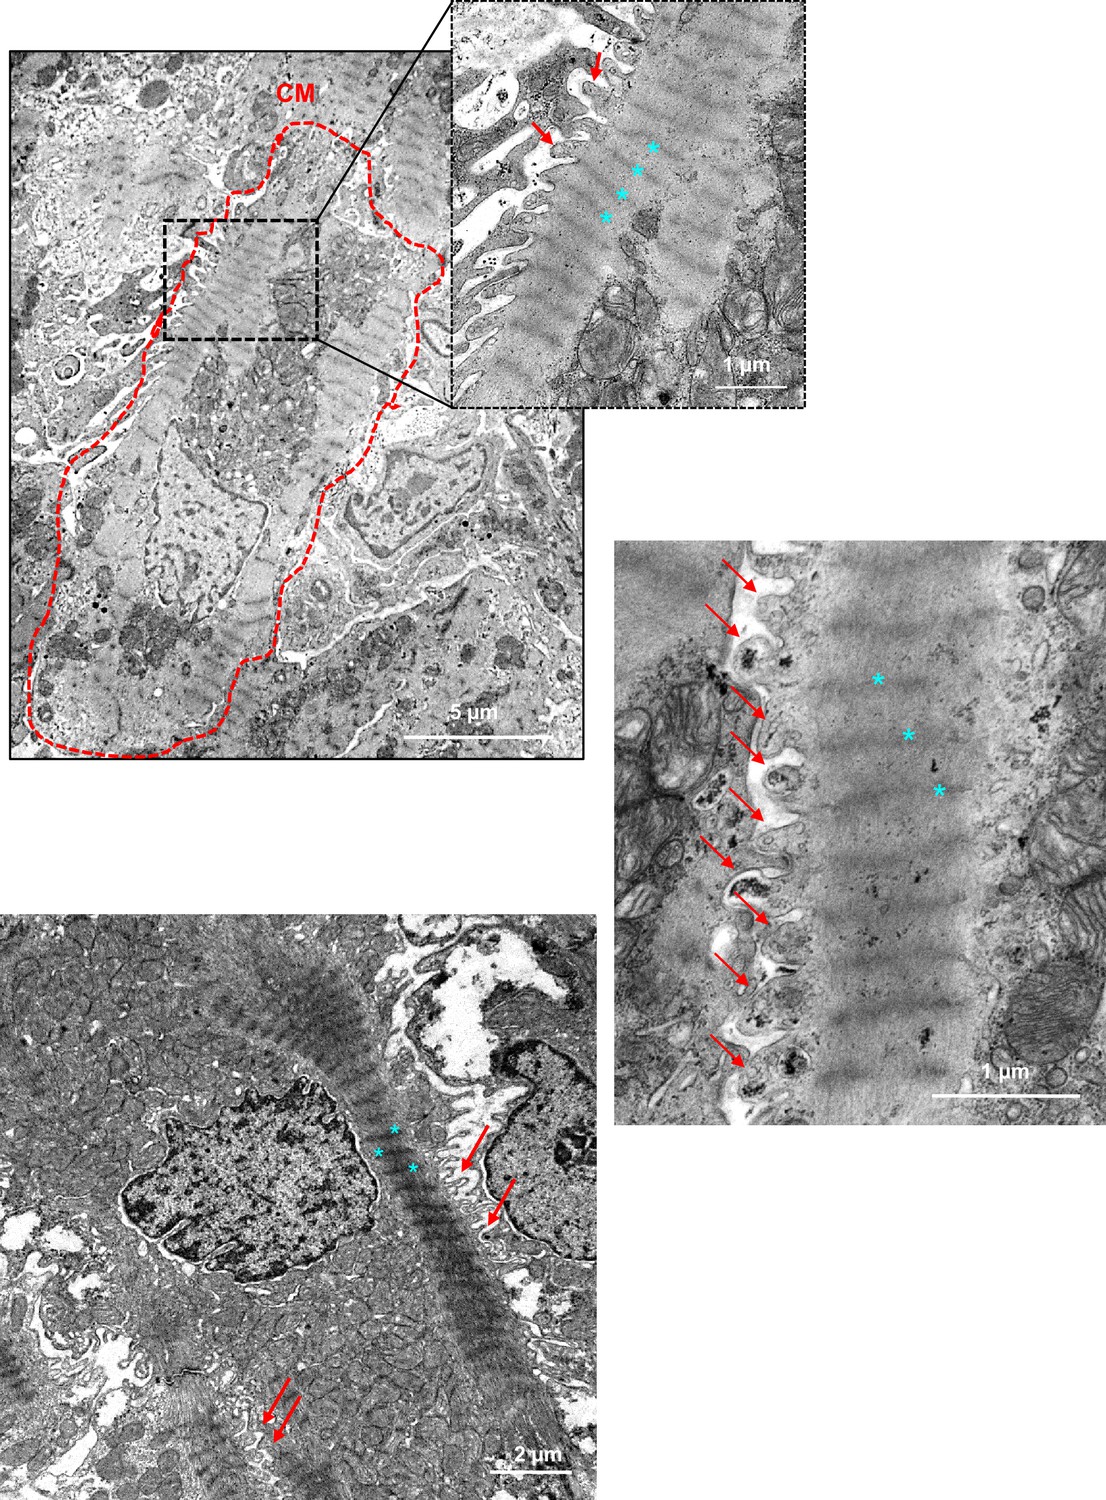
Ultrastructure of the neonatal cardiomyocyte (CM) at birth.
TEM micrographs showing representative CM within the cardiac tissue at postnatal day 0 (birth) with plasma membrane protrusions (red arrows) between two Z-lines (blue star = Z-lines).
Figure 1—figure supplement 2
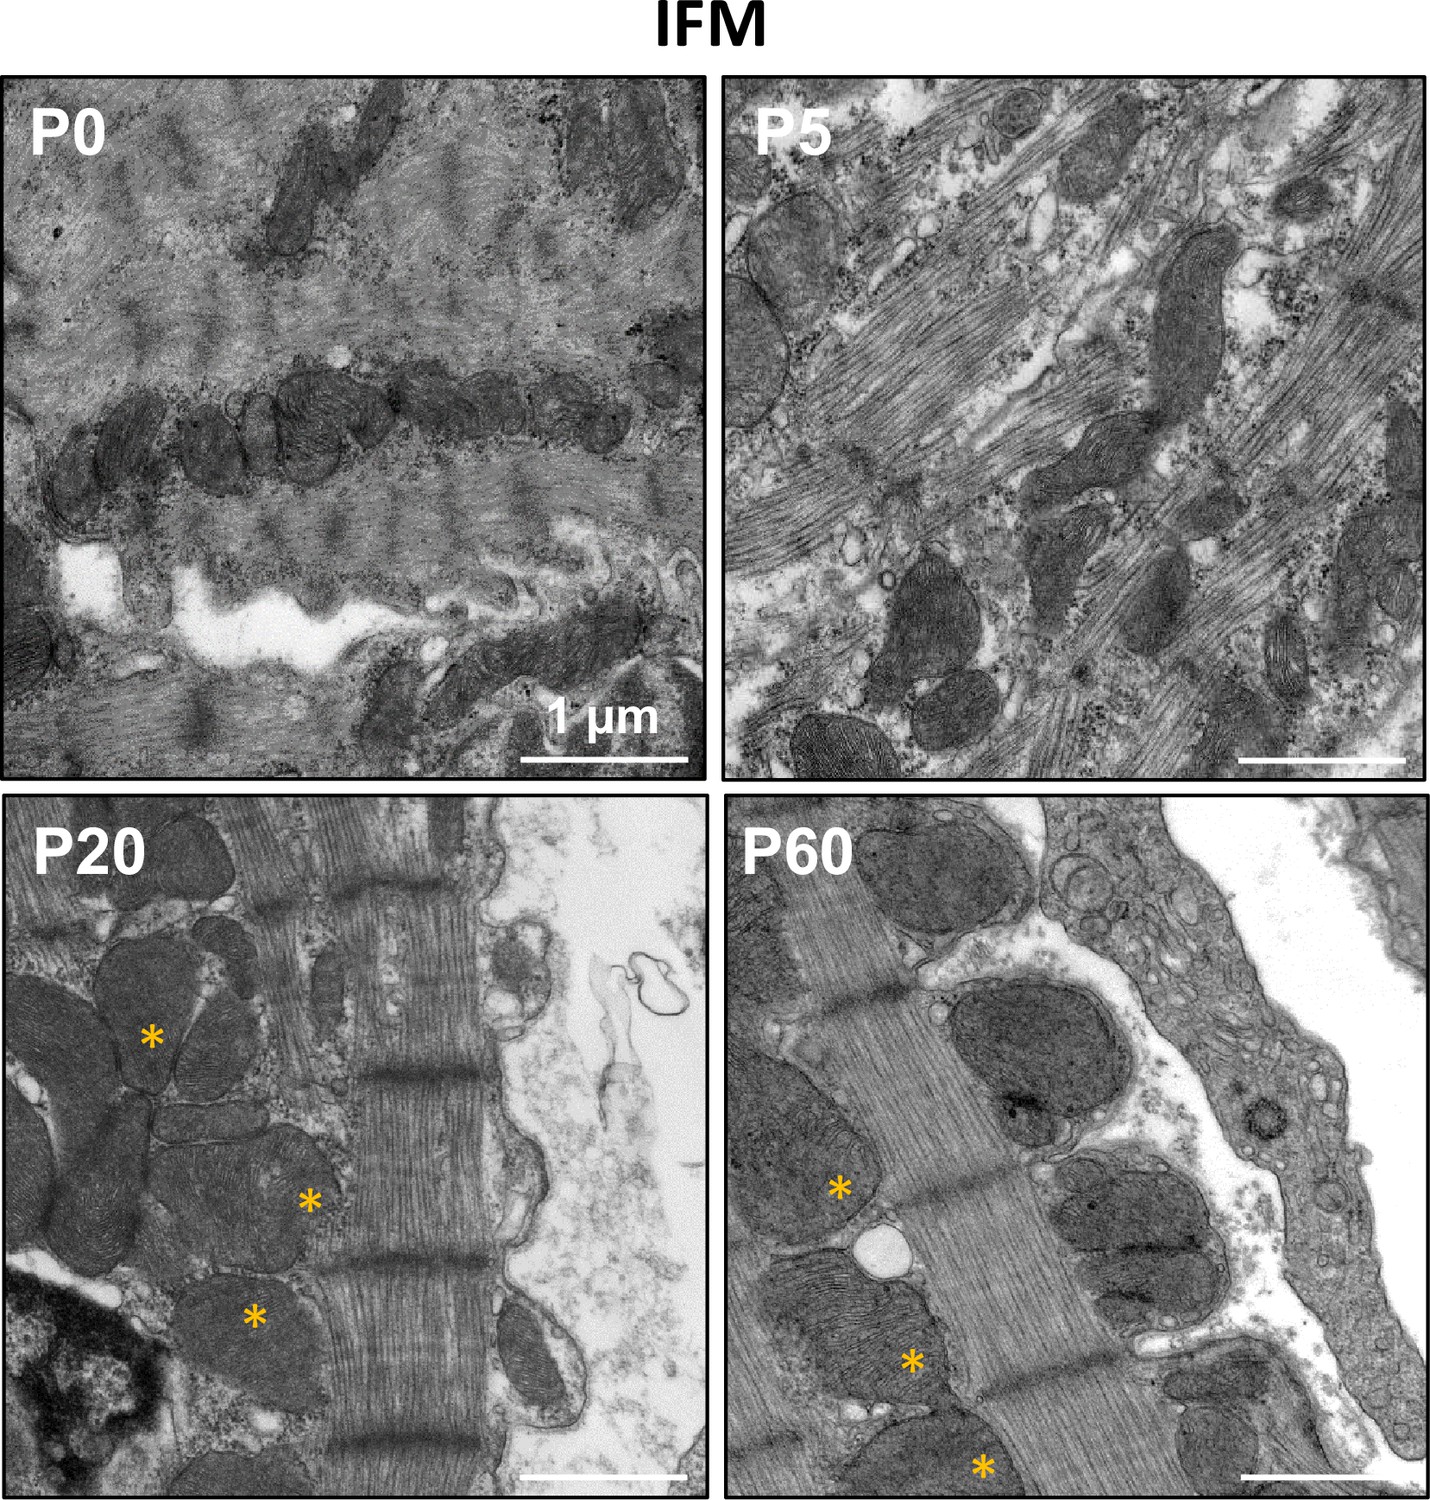
Interfibrillar mitochondria (IFM) during postnatal maturation.
TEM micrographs showing representative IFM (stars) during rat postnatal maturation at postnatal day 0 (P0), 5 (P5), 20 (P20), and 60 (P60).
Figure 1—figure supplement 3
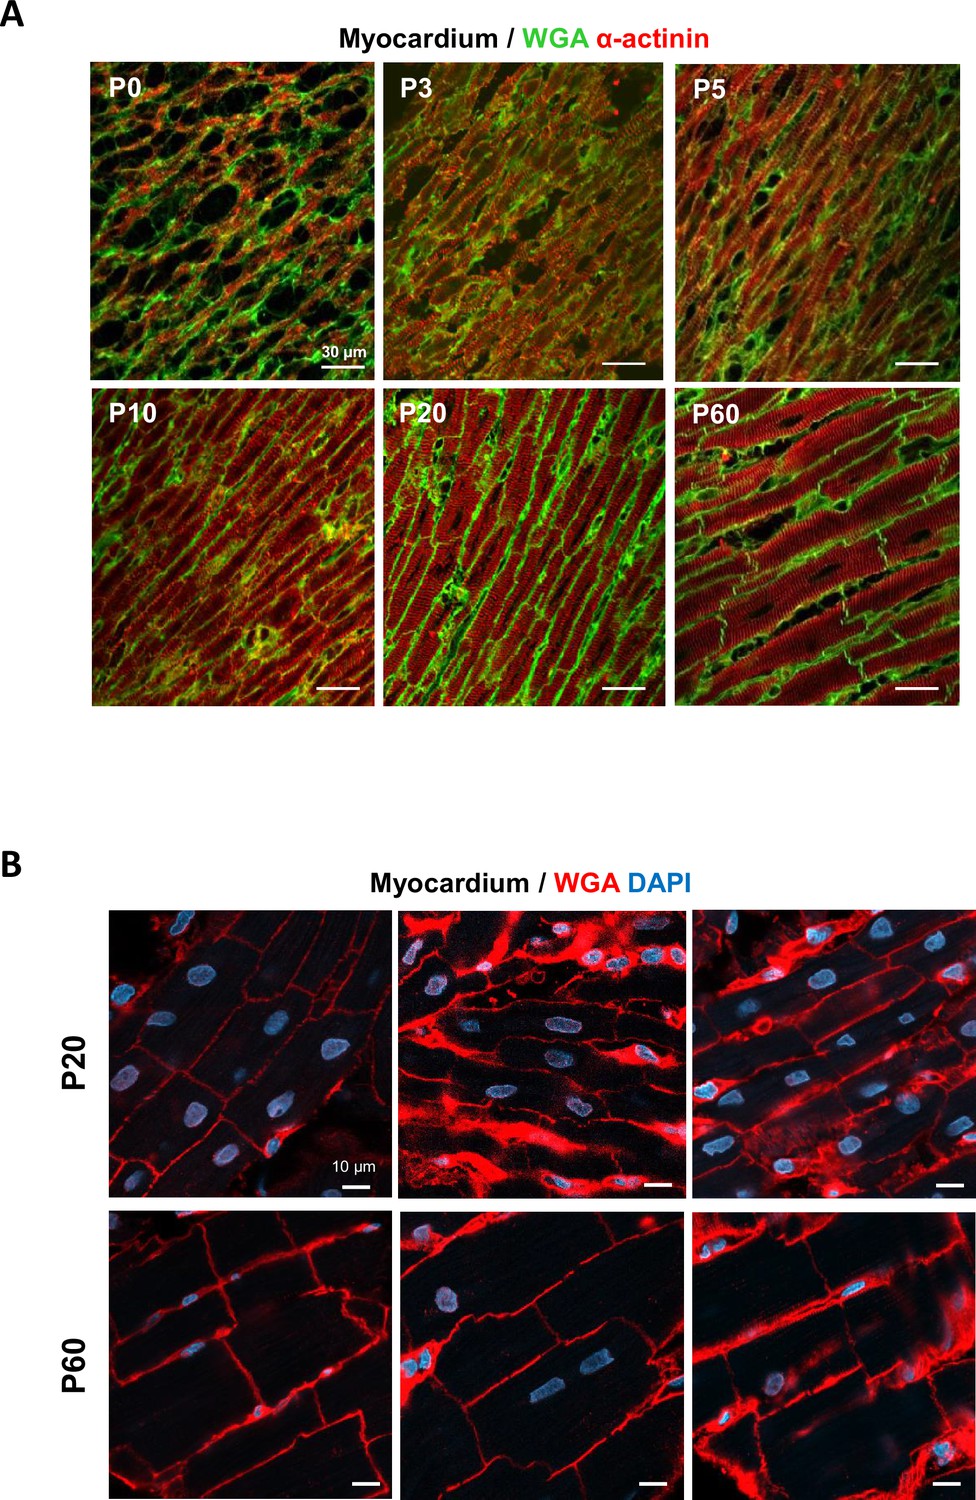
Maturation of cardiomyocyte (CM) morphology during the postnatal period.
Confocal immunofluorescent staining of cell membranes (wheat germ agglutinin-OG488 [WGA], green) and CMs (α-actinin, red) performed on paraffin-embedded longitudinal heart sections from rats of (A) varying postnatal ages (P0, P3, P5, P10, P20, P60) and showing (B) CM rod-shape heterogeneity in P20 tissues from left ventricular myocardium.
Figure 1—figure supplement 4
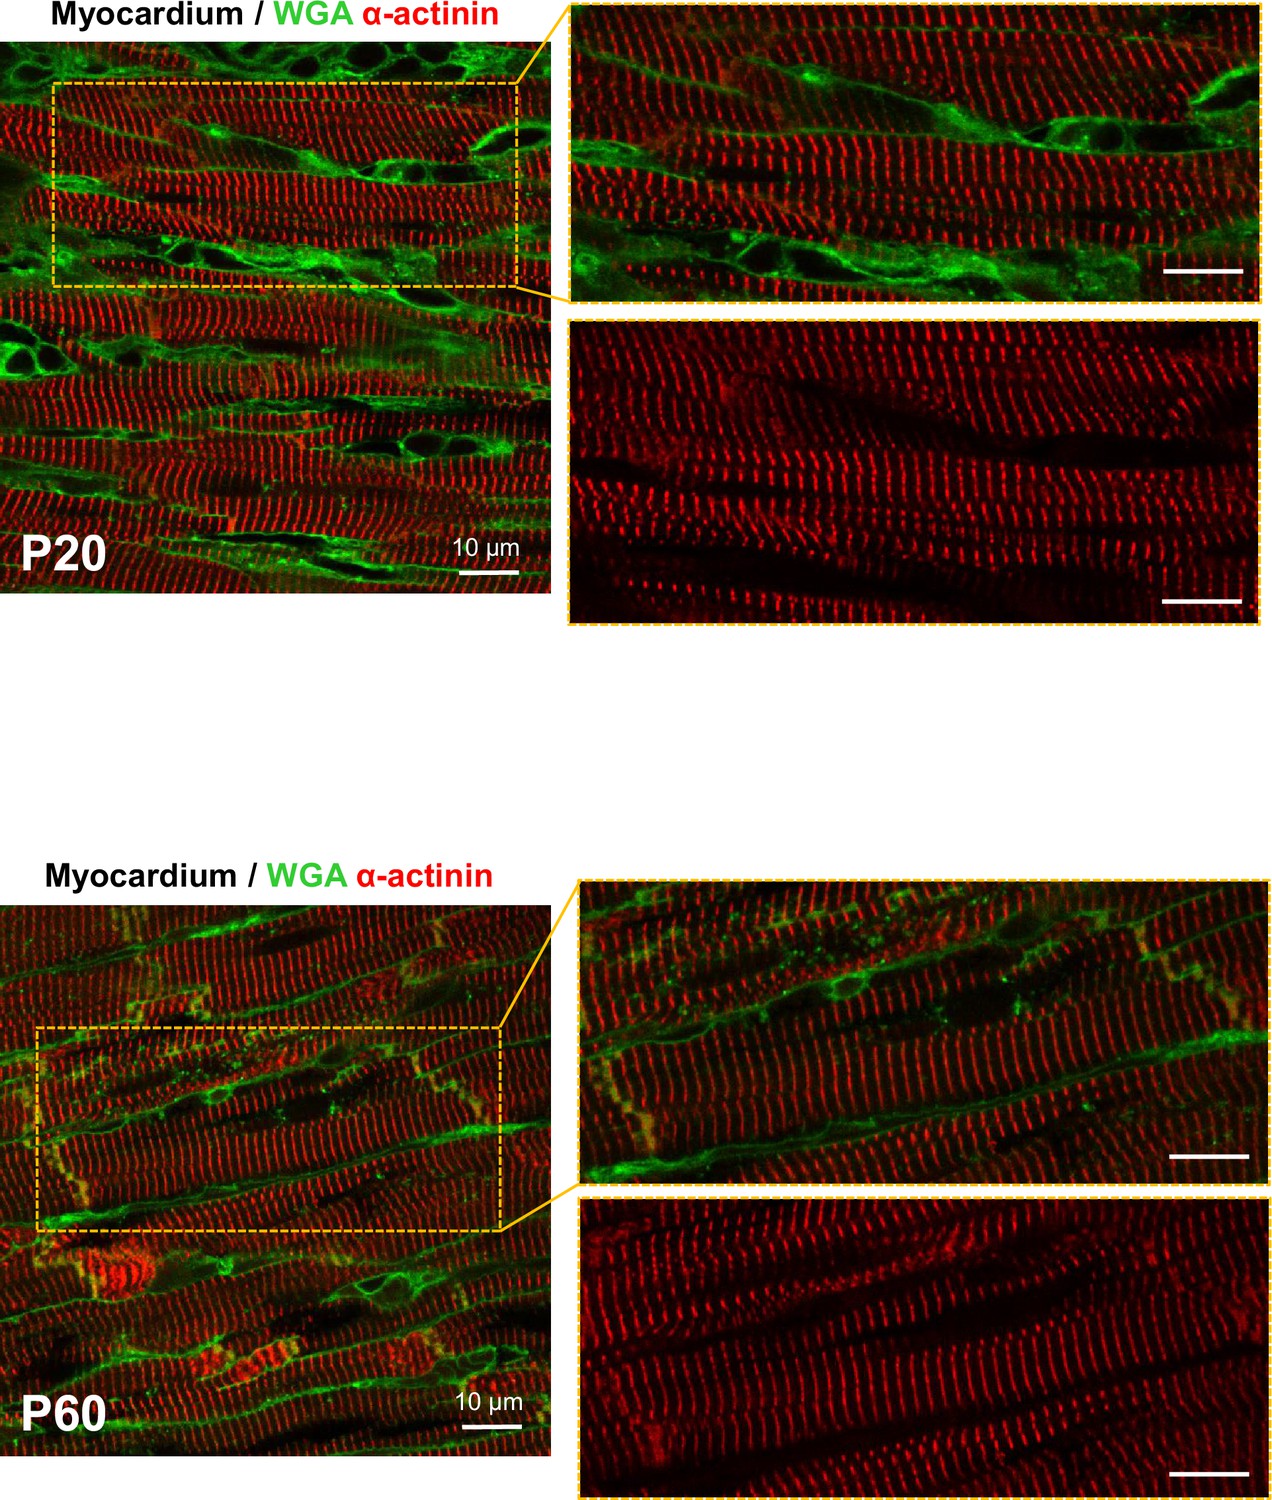
Organization of cardiomyocyte (CM) myofibrils during the postnatal period.
Confocal immunofluorescent staining of CM sarcomere Z-lines (α-actinin, red) and CMs cell surface (wheat germ agglutinin-OG488 [WGA], green) performed on PFA-fixed fresh biopsies from left ventricles of rats from varying postnatal ages (P20, P60).
Figure 1—figure supplement 5
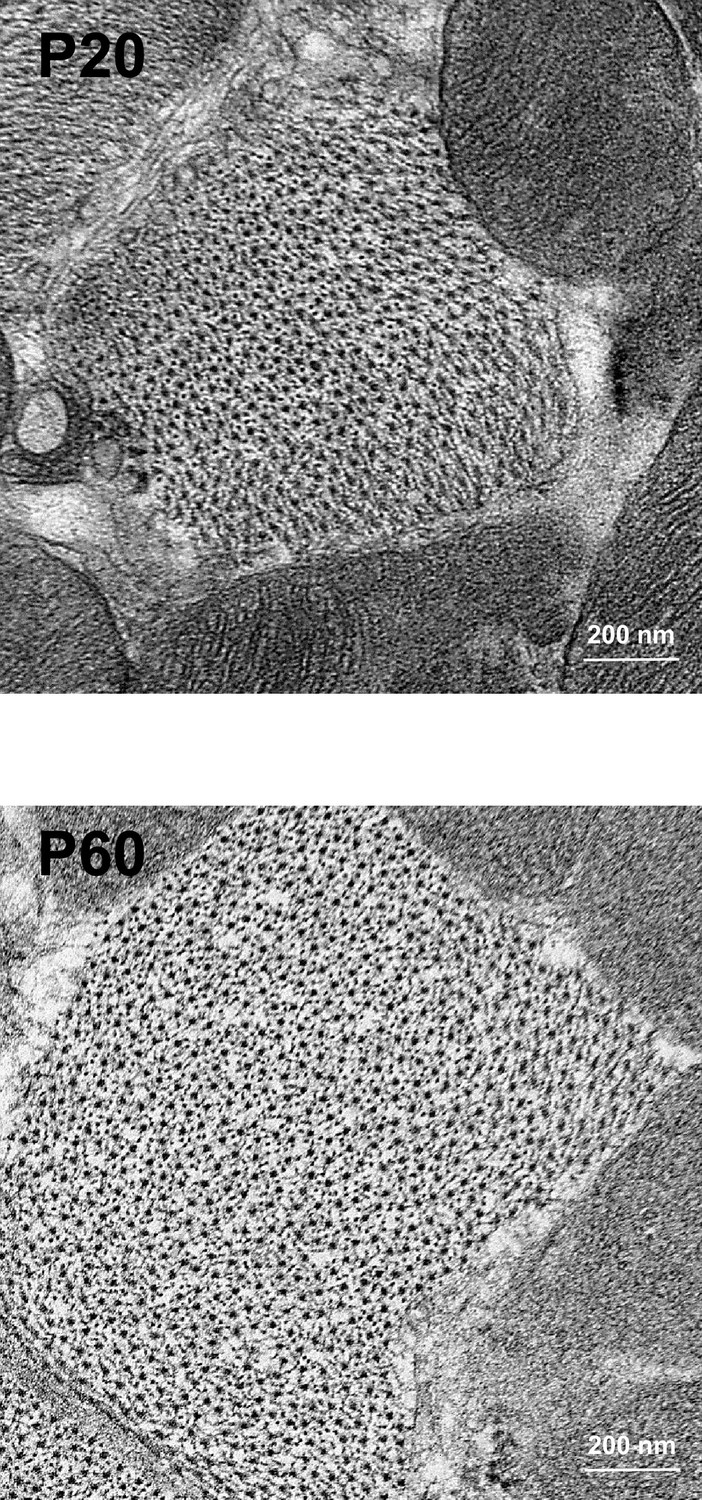
Cardiomyocyte (CM) surface crests mature after postnatal day 20 (P20) in mice.
Quantification of crest heights/sarcomere length (left panel), subsarcolemmal mitochondria (SSM) area (middle panel), and SSM number/crest (right panel) from TEM micrographs obtained from P20 or P60 S129/S4×C57BL/6 background mice (WT P20 n = 5, WT P60 n = 5 mice, ~60 crests per group) and illustrated above. Data are presented as mean ± SEM. Unpaired Student’s t-test for two group comparisons *p<0.05; **p<0.01.
-
Figure 1—figure supplement 5—source data 1
Raw data of CM crest maturation between P20 and P60 in mice quantified on TEM images.
- https://cdn.elifesciences.org/articles/80904/elife-80904-fig1-figsupp5-data1-v1.xlsx
Figure 1—figure supplement 6
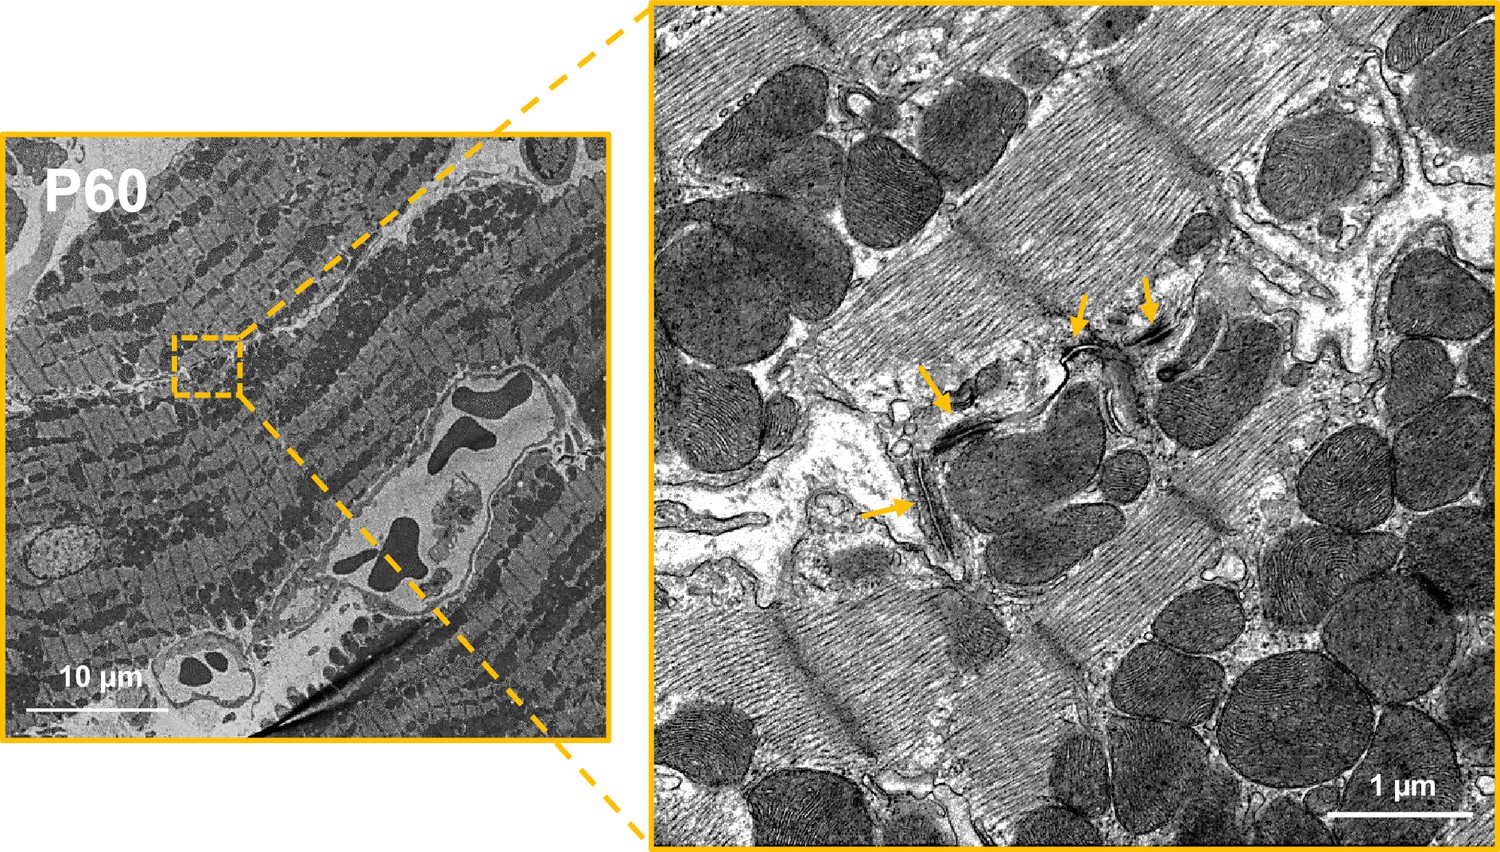
Neighboring cardiomyocytes (CMs) establish direct lateral physical contacts through crest–crest interactions only at the adult stage.
Illustrative TEM micrographs of P60 rat LV myocardium showing intermittent tight junctions (arrows) between the lateral surface crests of two adjacent CMs.
Figure 1—figure supplement 7
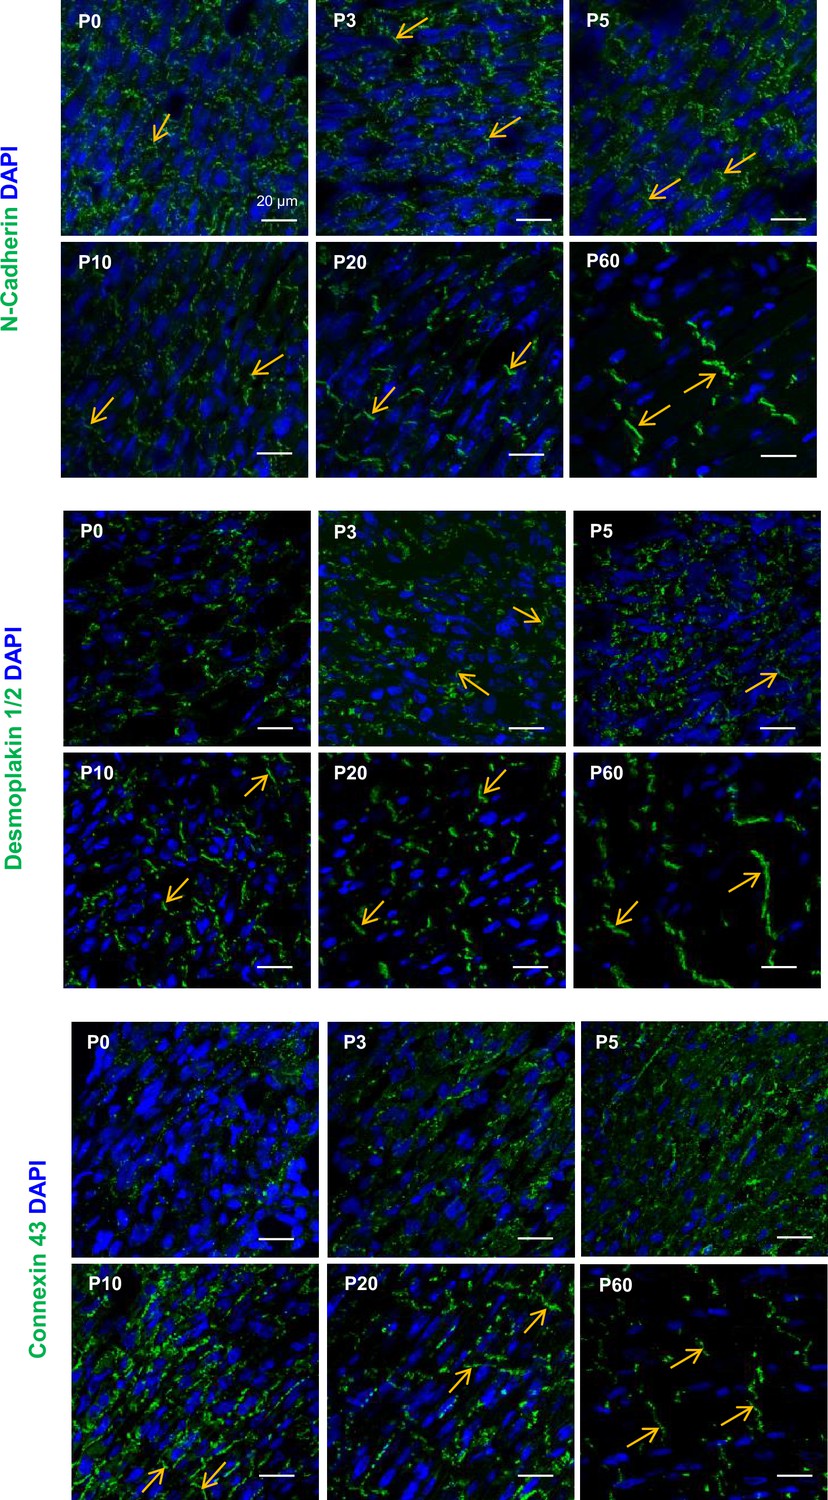
Maturation of the intercalated disk of cardiomyocytes (CMs) during the postnatal period.
Representative confocal immunofluorescent staining/imaging of N-cadherin (upper panels), desmoplakin (middle panels), and connexin-43 (lower panels) performed in heart transverse cryo-sections from P0, P5, P20, and P60 rats. DAPI staining = cell nuclei.
Figure 1—figure supplement 8
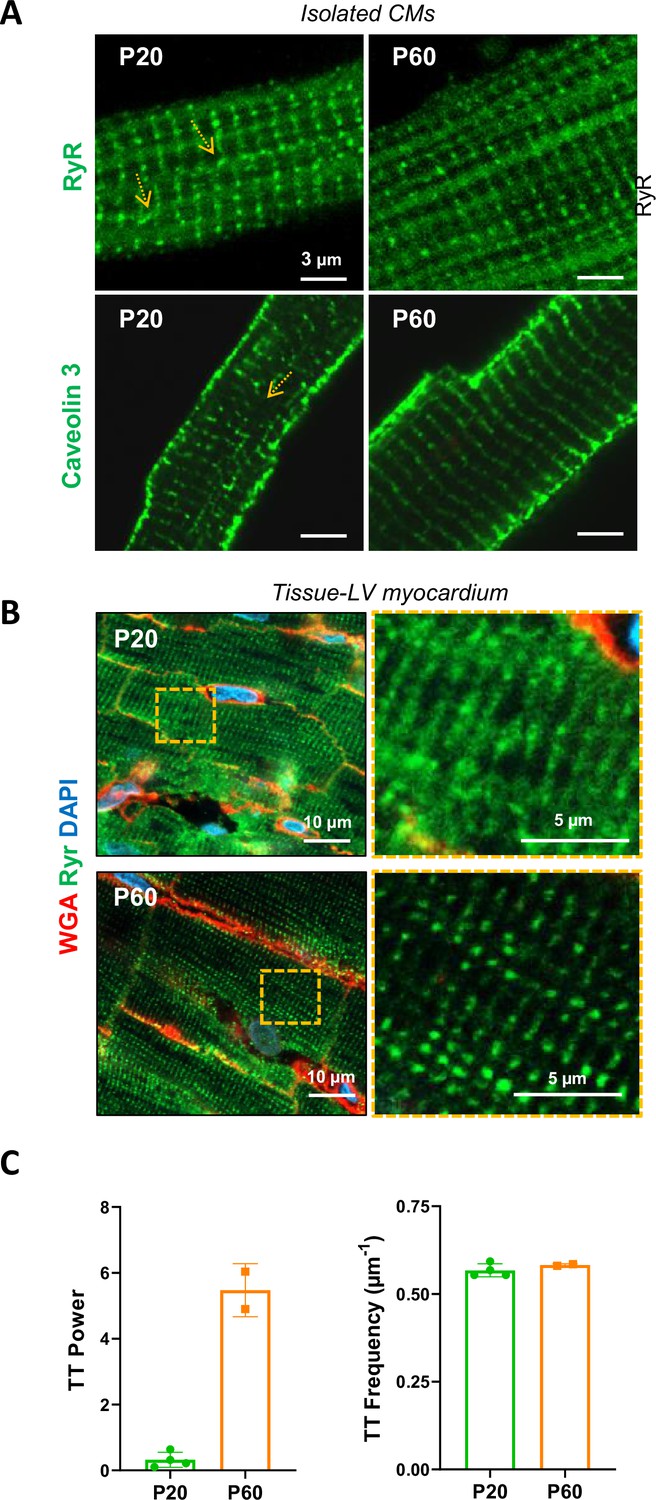
Organization of the T-tubule network during the late postnatal period.
Representative confocal immunofluorescent staining/imaging of ryanodine receptor (RyR) (upper panels) and Caveolin-3 (middle panels), as T-Tubule (TT) markers, in isolated cardiomyocytes (CMs) (A) or LV myocardial tissue (B) and showing a spatial misalignment (arrows) of these proteins in P20 rats compare to CMs from P60 rats. (C) Quantification of the TT regularity (along the periodic striation on sarcomere Z-lines) and frequency (periodicity on Z-lines) performed on LV myocardial tissue from P20 or P60 rat hearts (P20, n = 4 rats; P60 n = 2 rats;~5–20 CMs/rat).
-
Figure 1—figure supplement 8—source data 1
Raw data of TT power and TT frequency.
- https://cdn.elifesciences.org/articles/80904/elife-80904-fig1-figsupp8-data1-v1.xlsx
Figure 2 with 2 supplements
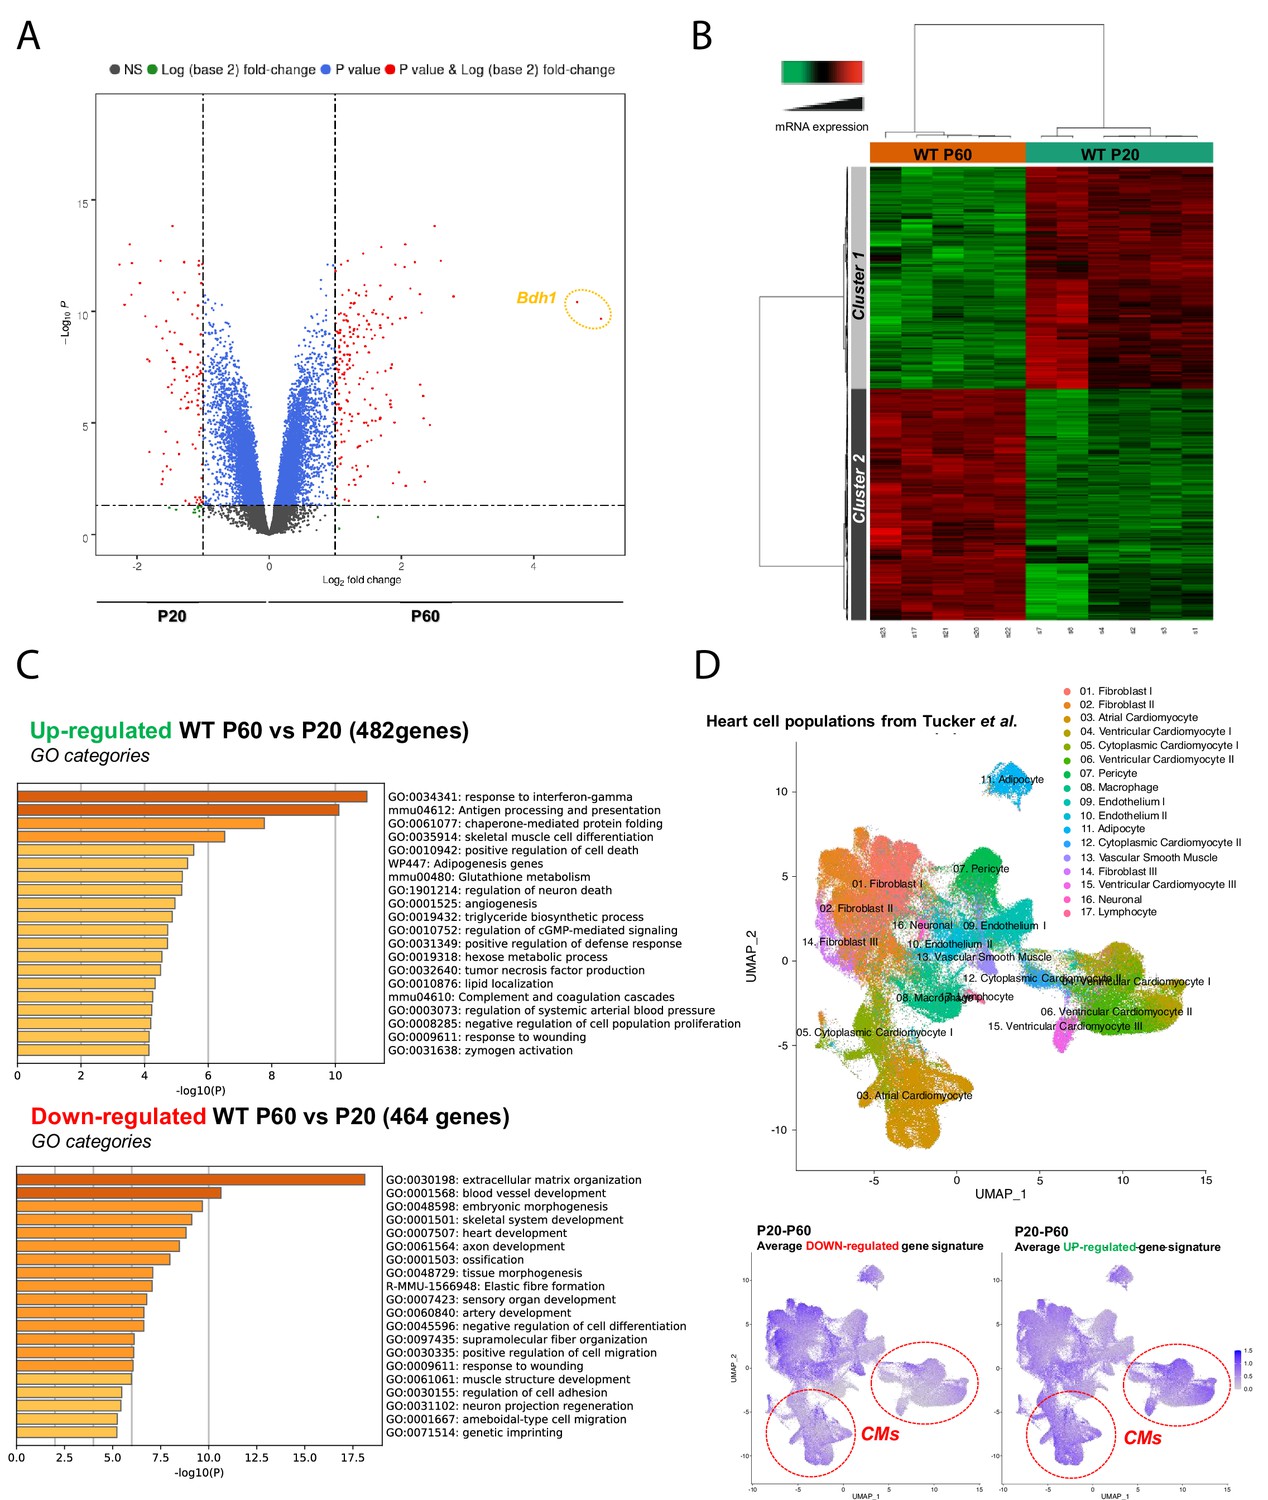
Late postnatal maturation stage between P20 and P60 of the mammalian heart confirmed by transcriptional analysis of left ventricular tissue.
(A) Volcano plot of differences in gene expression between P20 and P60 mice. Colors indicate p<0.05 and log (base 2) fold change >2 (red), p<0.05 and log (base 2) fold change <2 (blue) and nonsignificant (NS) (black). (B) Heatmap presenting data from a microarray experiment performed with heart samples (P20 n = 6, P60 n = 5). Hierarchical clustering is also shown, which allows the definition of two gene clusters (p≤0.05). (C) Gene ontology (GO) analysis of upregulated (upper panel) or downregulated (lower panel) genes between P60 and P20. The false discovery rate is provided for each category. (D) Uniform manifold approximation and projection (UMAP) plot displaying cellular diversity present in the human heart using Tucker et al.’s single-cell RNA-seq dataset. Each dot represents an individual cell. (Upper panel) Colors correspond to the cell identity provided by the authors. The average expression of downregulated- (left lower panel) or upregulated (right lower panel) gene signatures of left ventricles between P20 and P60 rats was calculated for each cell population and represented on the UMAP plot. Color key from gray to blue indicates relative expression level from low to high.
Figure 2—figure supplement 1
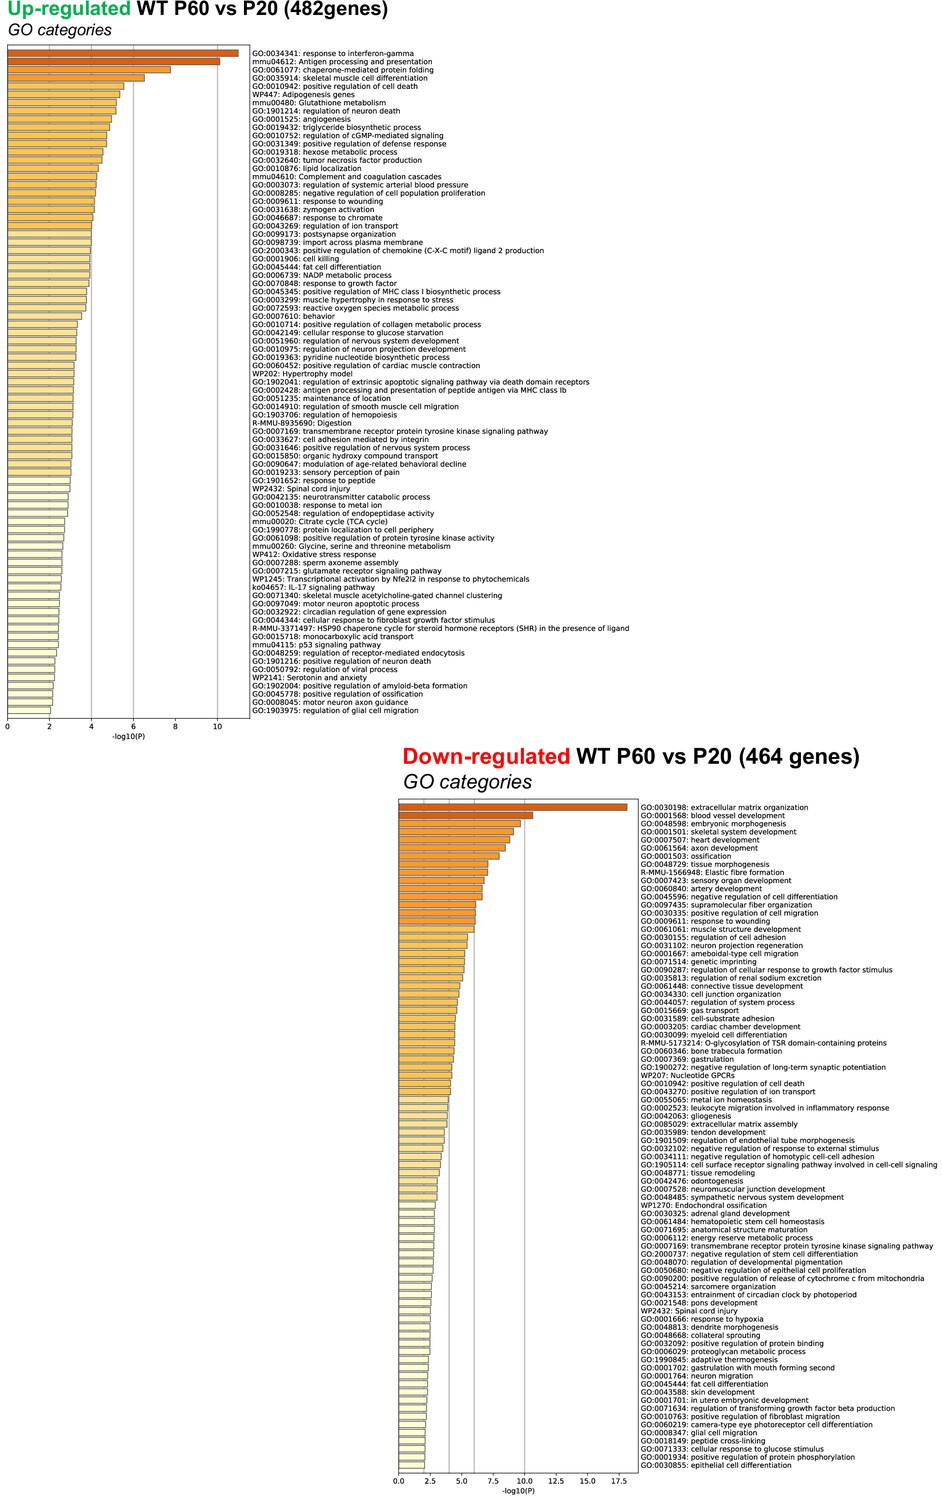
Signaling pathways upregulated or downregulated during the late postnatal period in left ventricles from WT mice.
Full gene ontology (GO) analysis of upregulated or downregulated genes between P60 and P20 in mouse left ventricles. The false discovery rate is provided for each category.
Figure 2—figure supplement 2
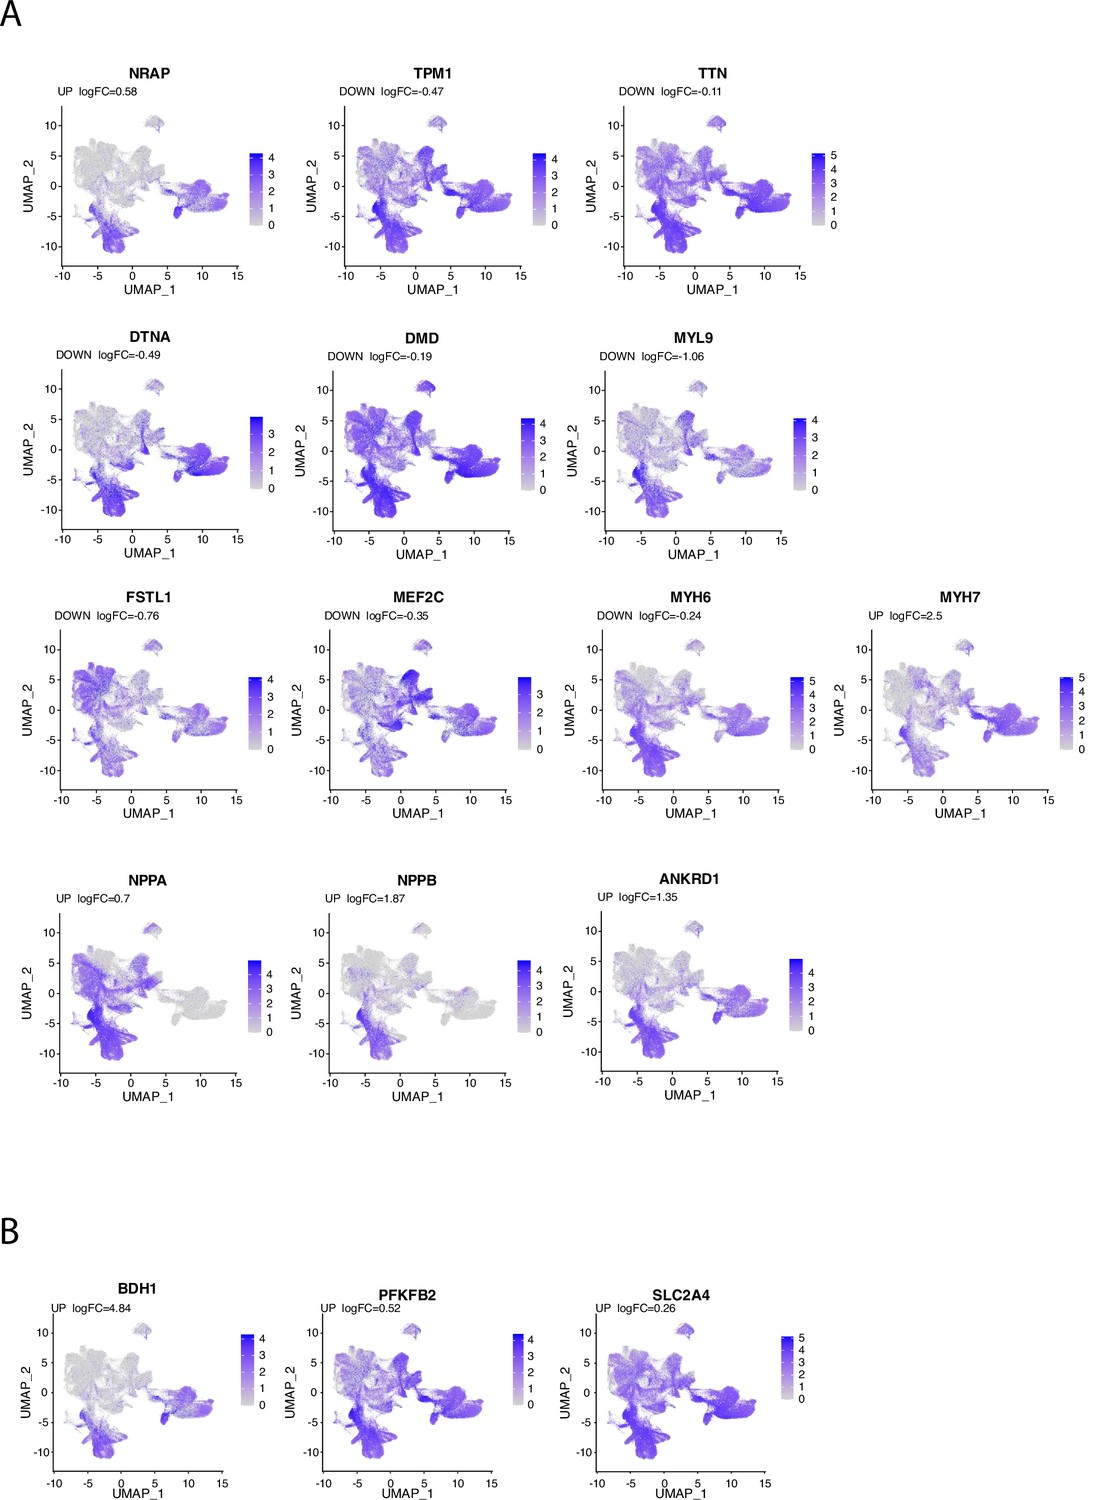
Regulation of cardiomyocyte (CM) and metabolic markers during the late postnatal period.
Expression level of transcriptomic markers of cardiomyocytes (A) or metabolic pathways (B) in the different cardiac cell populations are plotted onto the UMAP plot. Color key from gray to blue indicates relative expression level from low to high.
Figure 3
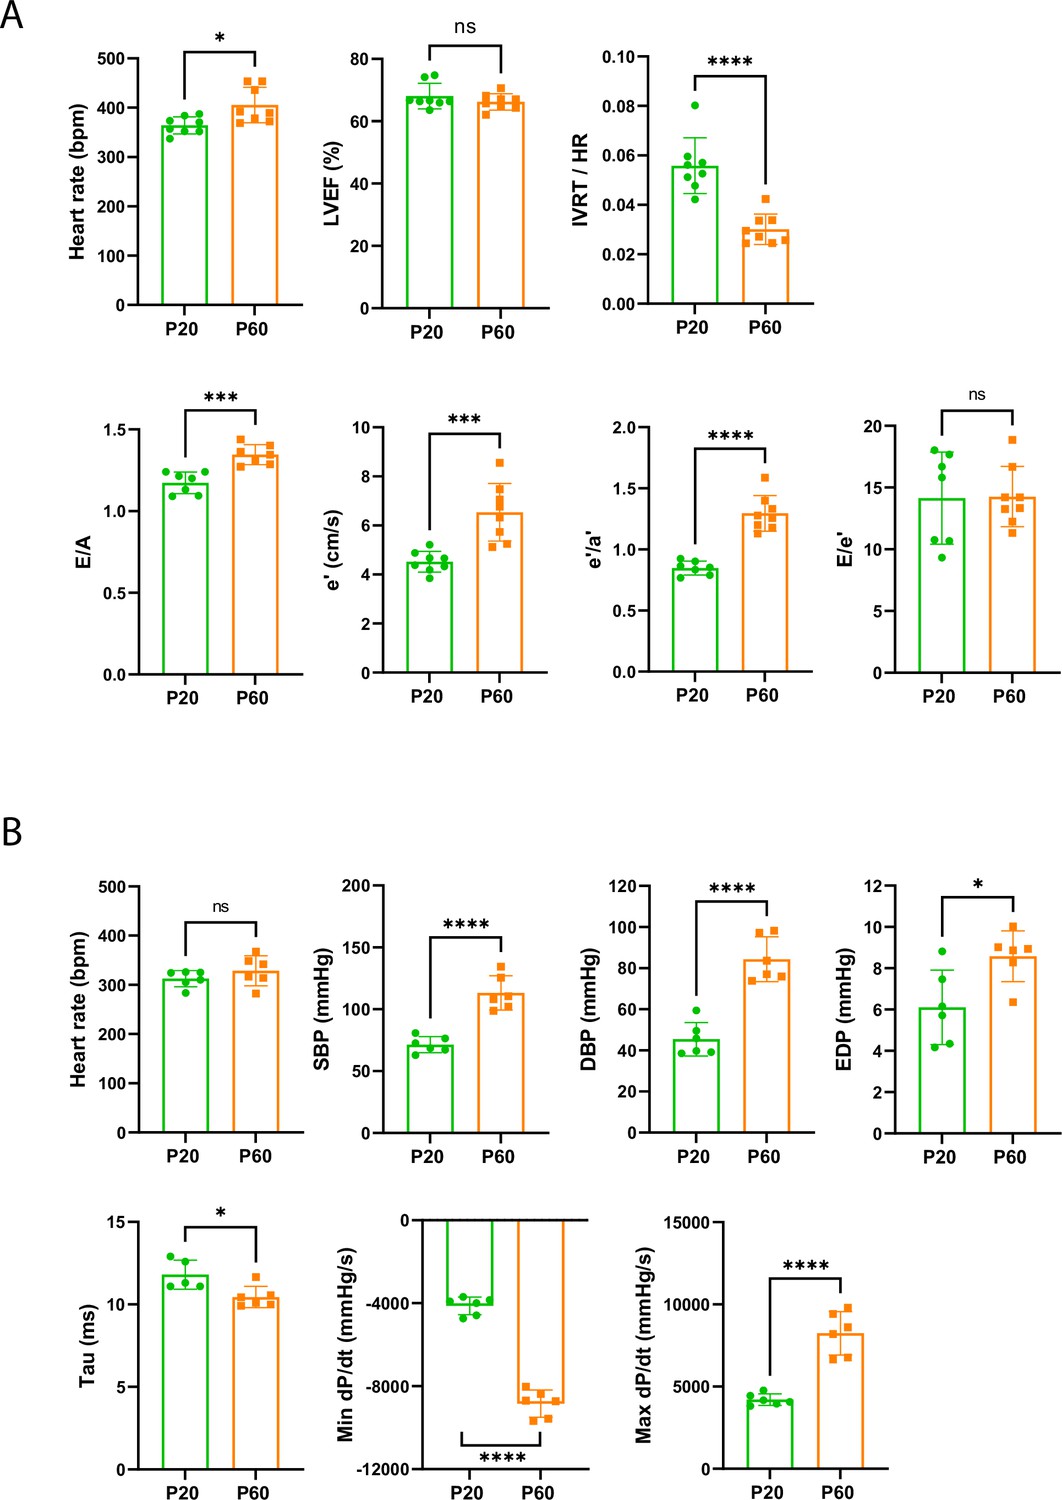
Late cardiac development is associated with the maturation of diastolic function.
(A) Echocardiography performed on P20 and P60 rats using M-mode, B-mode, Doppler flow, and tissular Doppler to measure systolic and diastolic function. Left ventricular ejection fraction (LVEF), isovolumetric relaxation time (IVRT), E/A ratio, e’ peak velocity, e’/a’ ratio, and E/e’ ratio were measured (P20 or P60 n = 8 rats). (B) Cardiac catheterization to assess the systolic and diastolic function of P20- or P60 rats. Systolic and diastolic blood pressure (SDB and DBP), end diastolic LV pressure (EDP), Tau and min and max dP/dt were measured (P20 or P60 n = 6 rats). Data are presented as mean ± SD. Unpaired Student’s t-test for two group comparisons *p<0.05, **p<0.01, ***p<0.001, ****p<0.0001 ns, not significant.
-
Figure 3—source data 1
Raw data of echocardiography/doppler measurements in P20 or P60 rats.
- https://cdn.elifesciences.org/articles/80904/elife-80904-fig3-data1-v1.xlsx
-
Figure 3—source data 2
Raw data of cardiac catheterization in P20 and P60 rats.
- https://cdn.elifesciences.org/articles/80904/elife-80904-fig3-data2-v1.xlsx
Figure 4 with 4 supplements
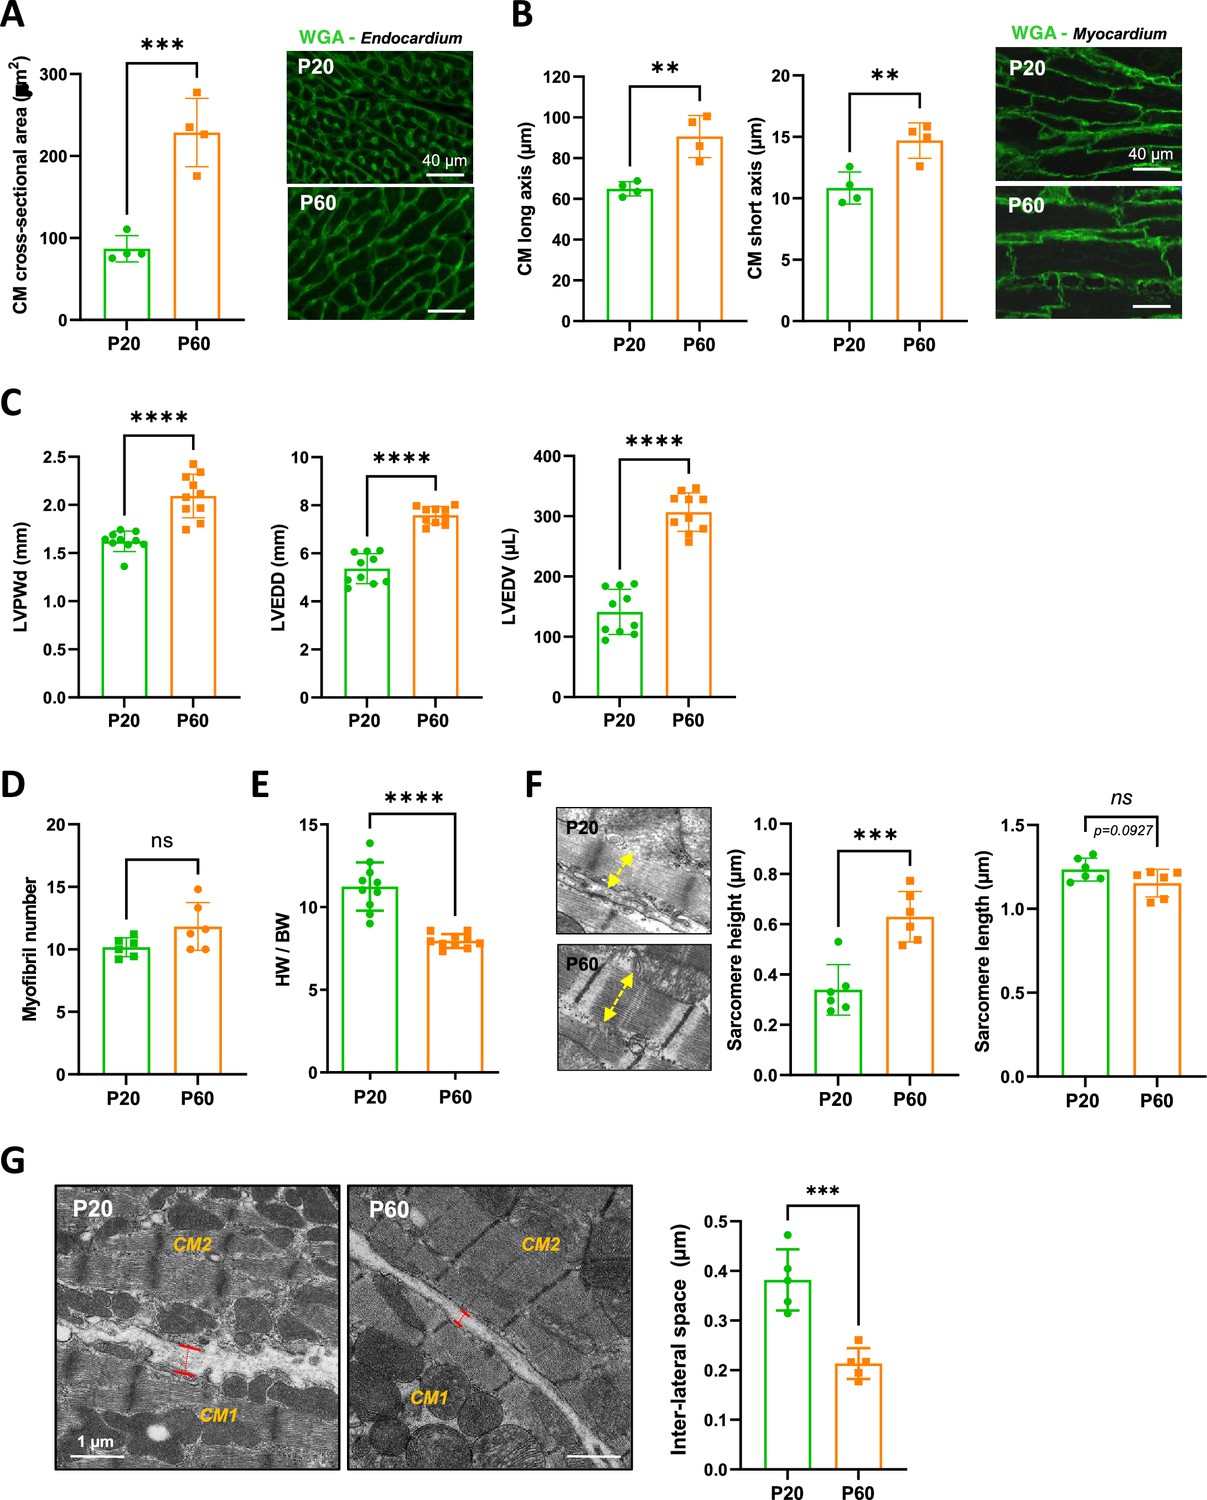
Evidence for a late postnatal maturation stage of the cardiomyocyte (CM) and the heart.
(A) (Left panel) CM area quantification from wheat-germ agglutinin (WGA)-stained heart cross-sections (endocardium) obtained from P20 and P60 rats (~400 CMs/rat; n = 4 rats per group), as illustrated in the right panel (B) (Left panel) CM long- and short-axis quantification from WGA-stained heart cross-sections (myocardium) obtained from P20 and P60 rats (~200 CMs/rat; n = 4 rats per group) and illustrated in the right panel. (C) Analysis of echocardiography-based morphometry of hearts from P20 and P60 rats (P20 or P60 n = 10 rats). (D) Myofibril number quantified on the longitudinal CM axis from TEM micrographs of cardiac tissue from P20 or P60 rats (P20 or P60 n = 6 rats; 4–8 CMs/rat). (E) Heart weight/body weight ratio of P20 or P60 rats (P20 or P60 n = 10 rats). (F) (Left panel) TEM micrographs showing representative sarcomere stretch (left arrows) from P20 to P60 rat; (right panel) quantification of sarcomere height (P20 or P60 n = 6 rats; 4–8 CMs/rat, ~35 sarcomeres/rat). (G) (Left panel) TEM micrographs showing representative lateral membrane space between two neighboring CMs (red arrows) in cardiac tissue from P20 or P60 rats; (right panel) quantification of the lateral membrane interspace (P20 or P60 n = 6 rats; 4–8 CMs/rat, ~35 lateral interspaces/rat). Data are presented as mean ± SD. Unpaired Student’s t-test for two group comparisons *p<0.05, **p<0.01, ***p<0.001, ****p<0.0001, ns, not significant.
-
Figure 4—source data 1
Raw data of CM area quantification.
- https://cdn.elifesciences.org/articles/80904/elife-80904-fig4-data1-v1.xlsx
-
Figure 4—source data 2
Raw data of CM long- and short- axis quantifications.
- https://cdn.elifesciences.org/articles/80904/elife-80904-fig4-data2-v1.xlsx
-
Figure 4—source data 3
Raw data of echocardiography-based morphometry of hearts.
- https://cdn.elifesciences.org/articles/80904/elife-80904-fig4-data3-v1.xlsx
-
Figure 4—source data 4
Raw data of CM myofribrils quantification in TEM images.
- https://cdn.elifesciences.org/articles/80904/elife-80904-fig4-data4-v1.xlsx
-
Figure 4—source data 5
Raw data of Heart weight/body weight ratios.
- https://cdn.elifesciences.org/articles/80904/elife-80904-fig4-data5-v1.xlsx
-
Figure 4—source data 6
Raw data of sarcomere height and length quantification.
- https://cdn.elifesciences.org/articles/80904/elife-80904-fig4-data6-v1.xlsx
-
Figure 4—source data 7
Raw data of lateral interspace quantifications.
- https://cdn.elifesciences.org/articles/80904/elife-80904-fig4-data7-v1.xlsx
Figure 4—figure supplement 1
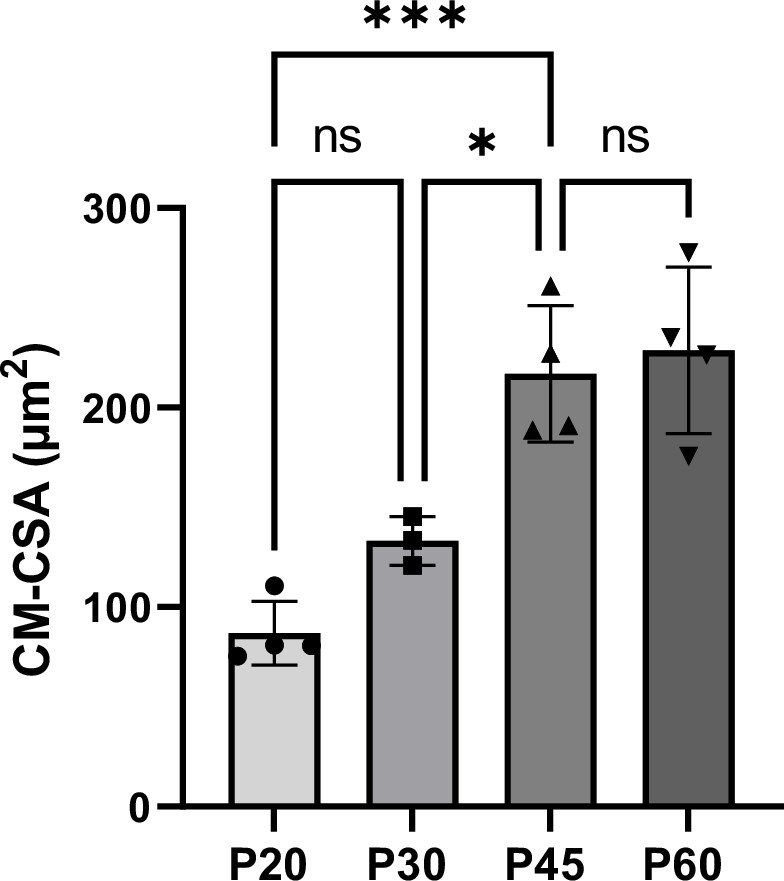
Kinetics of cardiomyocyte (CM) hypertrophy during the late postnatal period.
CM area (cross-sectional area [CSA]) quantified from wheat-germ agglutinin (WGA)-stained heart cross-sections (transverse) obtained from P20, P30, P45, and P60 old rats (P20 n = 4, P30 n = 3, P45 n = 4, P60 n = 4 rats ~400 CMs/rat). Data are presented as mean ± SD; one-way ANOVA with Tukey post-hoc test for four group comparisons *p<0.05, ***p<0.001, ns, not significant.
-
Figure 4—figure supplement 1—source data 1
Raw data of CM area quantifications.
- https://cdn.elifesciences.org/articles/80904/elife-80904-fig4-figsupp1-data1-v1.xlsx
Figure 4—figure supplement 2
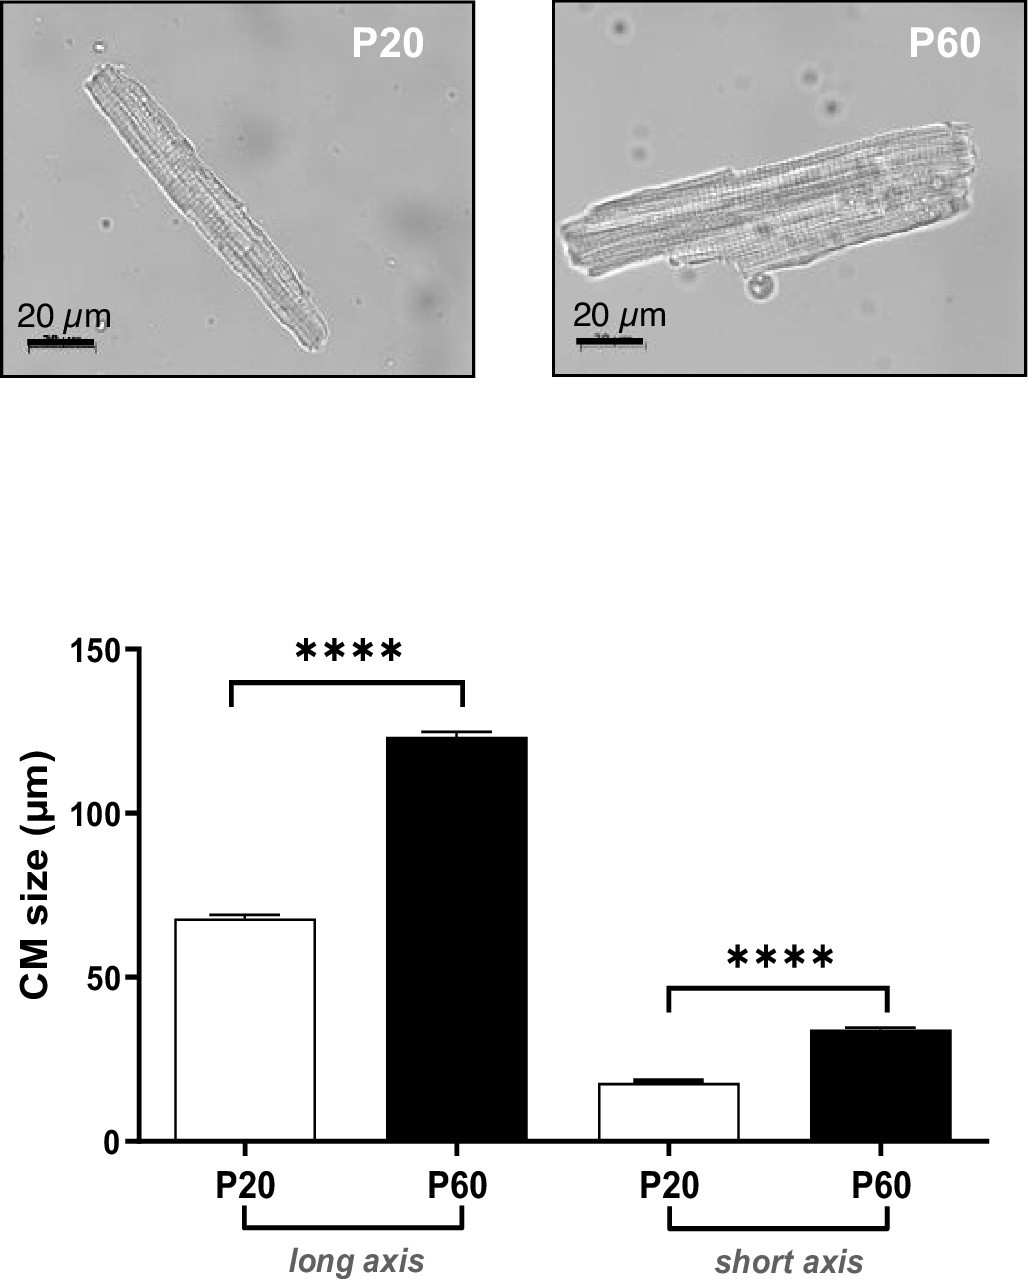
Late postnatal growth of isolated cardiomyocytes (CMs).
(Upper panels) Representative light microscopy photographs of isolated CMs from P20 and P60 rat hearts. (Lower panel) CM long- and short-axis lengths quantified on CMs isolated from P20- or P60-old rat hearts (~200 CMs/rat; n = 3–4 rats per group). Data are presented as mean ± SEM. Unpaired Student’s t-test for two group comparisons ****p<0.0001.
-
Figure 4—figure supplement 2—source data 1
Raw data of CM long an short axis quantifications.
- https://cdn.elifesciences.org/articles/80904/elife-80904-fig4-figsupp2-data1-v1.xlsx
Figure 4—figure supplement 3
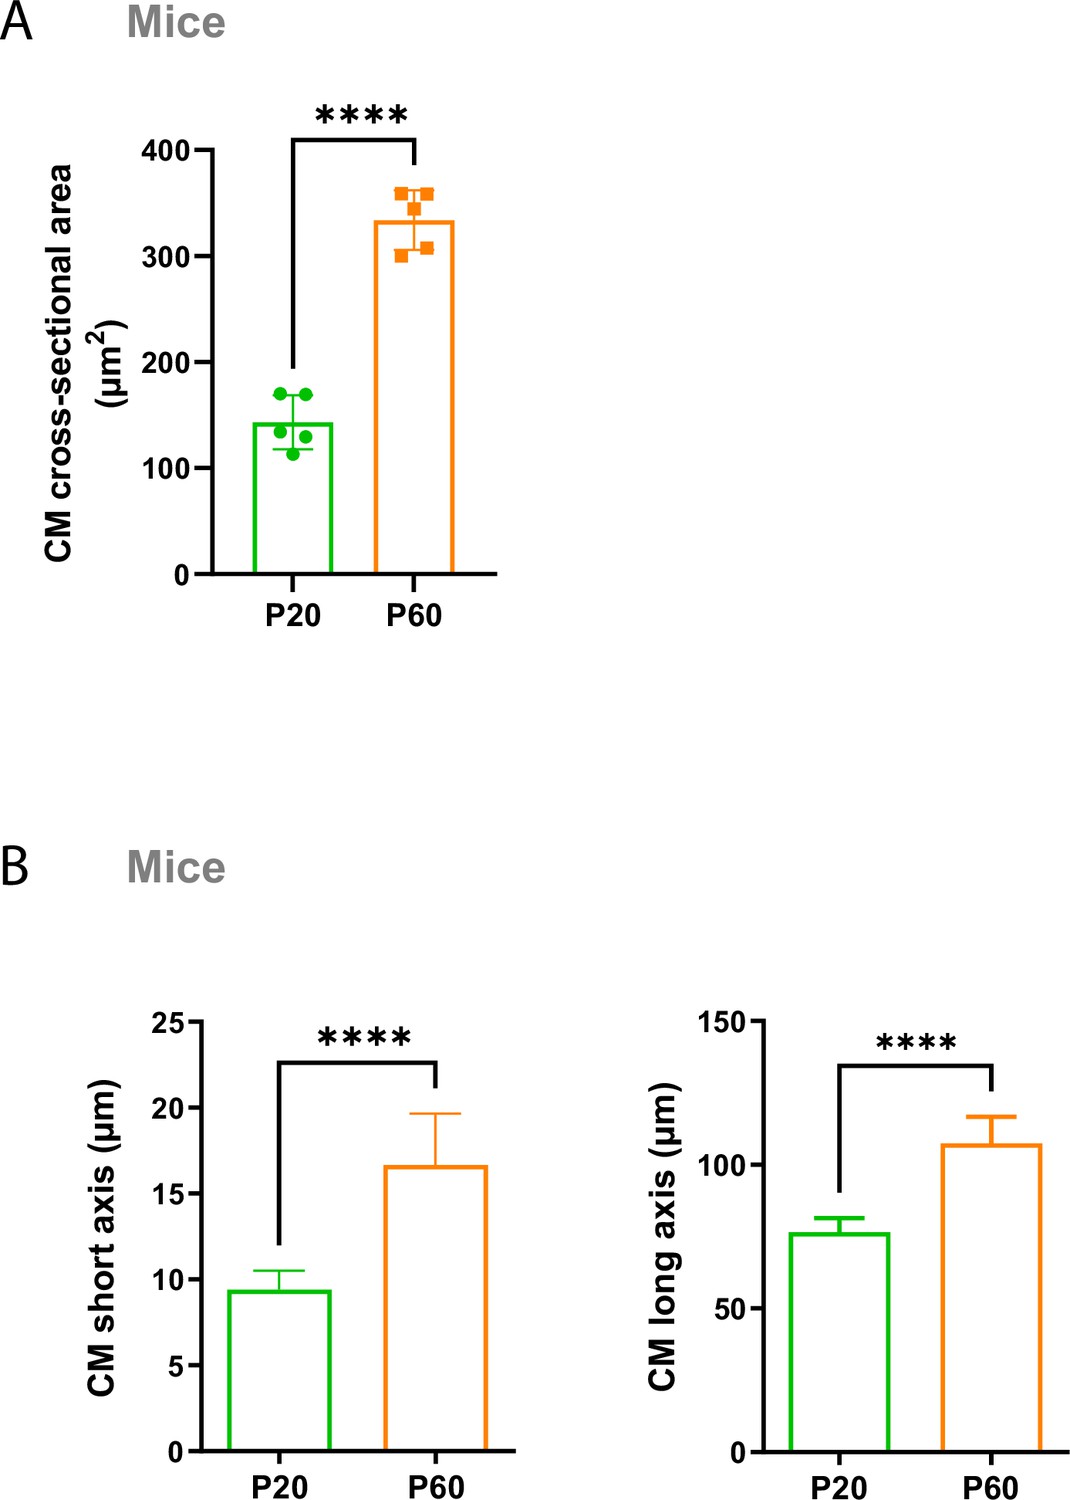
Hypertrophy of cardiomyocytes (CMs) in mice during the late postnatal period.
(A) CM area quantified from wheat-germ agglutinin (WGA)-stained heart cross-sections (transverse) obtained from P20 and P60 mice (~450 CMs/mouse; n = 5 mice per group); (B) CM long- and short axes quantified from WGA-stained heart cross-sections (myocardium) obtained from P20 and P60 mice (~120 CMs/mouse; n = 3 mice per group). Data are presented as mean ± SD. Unpaired Student’s t-test for two group comparisons ****p<0.0001.
-
Figure 4—figure supplement 3—source data 1
Raw data of CM area quantifications.
- https://cdn.elifesciences.org/articles/80904/elife-80904-fig4-figsupp3-data1-v1.xlsx
-
Figure 4—figure supplement 3—source data 2
Raw data of CM short and long axis quantifications.
- https://cdn.elifesciences.org/articles/80904/elife-80904-fig4-figsupp3-data2-v1.xlsx
Figure 4—figure supplement 4
Late postnatal maturation of the myofibrils.
Illustrative transversal TEM micrographs of rat LV myocardium showing larger distances between the thick myosin filaments at P60 than at P20.
Figure 5 with 1 supplement
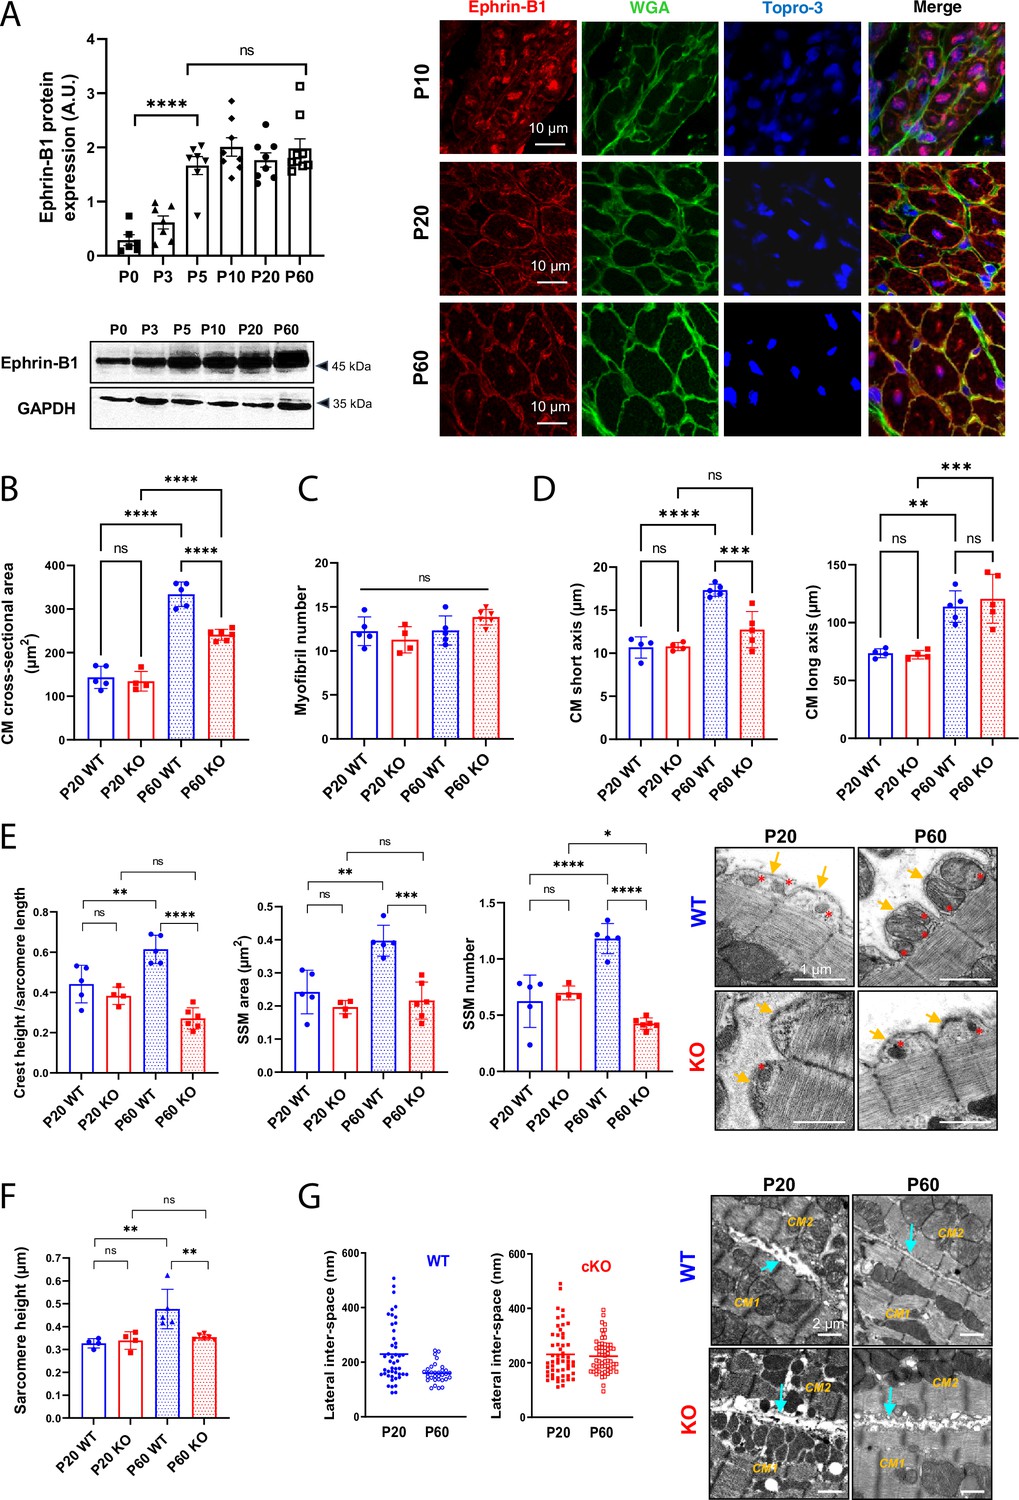
Efnb1-specific knockdown in the cardiomyocyte (CM) impairs the late maturation of CM surface crests.
(A) (Left panel) Western blot quantification of ephrin-B1 protein expression in heart tissue from P0 to P60 rats (upper) and representative immunoblot (lower) (P0 n = 6, P3 n = 7; P5 n = 7, P10 n = 8, P20 n = 8, P60 n = 8 rats); (right panel) immunofluorescent localization of ephrin-B1 (white arrows) in heart cryosection from P10, P20, and P60 old rats. At P10, ephrin-B1 (red) was mainly expressed in CM nuclei. At P20, ephrin-B1 is expressed at the CM lateral membrane but still highly in the CM cytoplasm while at P60, the protein is mainly expressed in the lateral membrane. Nuclei were stained using topro-3 (blue). (B) CM area quantification from WGA-stained heart cross-sections (endocardium) obtained from P20 or P60 Efnb1CM-speKO and WT mice (~120 CMs/mice; WT P20 n = 5, cKO P20 n = 4, WT P60 n = 5, cKO n = 6 mice). (C) Myofibril number quantification from TEM micrographs of cardiac tissue from P20 or P60-old Efnb1CM-speKO and WT mice (WT P20 n = 5, cKO P20 n = 4, WT P60 n = 5, cKO n = 6 mice; 4–8 CMs/mouse). (D) CM long and short axis quantified from WGA-stained heart cross-sections (myocardium) obtained from P20 or P60 Efnb1CM-speKO and WT mice (WT P20 n = 4, cKO P20 n = 4, WT P60 n = 5, cKO n = 5 mice; ~30 CMs/mouse). (E) Quantification of crest heights/sarcomere length (left panel), subsarcolemmal mitochondria (SSM) area (middle panel) and SSM number/crest (right panel) from TEM micrographs obtained from P20- or P60 Efnb1CM-speKO and WT mice (WT P20 n = 5, cKO P20 n = 4, WT P60 n = 5, cKO n = 5 mice, ~60 crests per group) and illustrated in the right panel (arrow = surface crest; red star = SSM). (F) Quantification of sarcomere heights from TEM micrographs obtained from P20 or P60 Efnb1CM-/- KO and WT mouse hearts (P20 WT n = 4, P20 cKO n = 4, P60 WT n = 5; P60 cKO n = 6 mice; 4–8 CMs/mouse, ~50 sarcomeres/mouse). (G) (Left panels) Quantification of the lateral membrane interspace between two neighboring CMs from TEM micrographs obtained from P20 or P60 Efnb1CM-/- KO and WT mouse hearts (P20 WT n = 1, P20 cKO n = 2, P60 WT n = 3; P60 cKO n = 3 mice; ~40 lateral membrane spaces/mouse) and (right panel) representative TEM. One-way ANOVA, Tukey post-hoc test for six group comparisons with P0 as control. ****p<0.0001 for ephrin-B1 Western blot analysis. Data are presented as mean ± SD. Unpaired Student’s t-test for two group comparisons or two-way ANOVA with Tukey post-hoc test for four group comparisons *p<0.05, **p<0.01, ***p<0.001, ****p<0.0001. ns, not significant.
-
Figure 5—source data 1
Raw data of ephrin-B1 quantification in western-blot.
- https://cdn.elifesciences.org/articles/80904/elife-80904-fig5-data1-v1.xlsx
-
Figure 5—source data 2
Raw data of CM area quantifcations.
- https://cdn.elifesciences.org/articles/80904/elife-80904-fig5-data2-v1.xlsx
-
Figure 5—source data 3
Raw data of myofibril number quantications.
- https://cdn.elifesciences.org/articles/80904/elife-80904-fig5-data3-v1.xlsx
-
Figure 5—source data 4
Raw data of CM long and short axis quantifications.
- https://cdn.elifesciences.org/articles/80904/elife-80904-fig5-data4-v1.xlsx
-
Figure 5—source data 5
Raw data of CM crest maturity quantified in P20 and P60 WT or KO mice.
- https://cdn.elifesciences.org/articles/80904/elife-80904-fig5-data5-v1.xlsx
-
Figure 5—source data 6
Raw data of sarcomere heights quantified in P20 and P60 WT or KO mice.
- https://cdn.elifesciences.org/articles/80904/elife-80904-fig5-data6-v1.xlsx
-
Figure 5—source data 7
Raw data of lateral interspace quantified in P20 and P60 WT or KO mice.
- https://cdn.elifesciences.org/articles/80904/elife-80904-fig5-data7-v1.xlsx
-
Figure 5—source data 8
Original film from western-blot analysis of ephrin-B1 expression.
- https://cdn.elifesciences.org/articles/80904/elife-80904-fig5-data8-v1.pdf
Figure 5—figure supplement 1
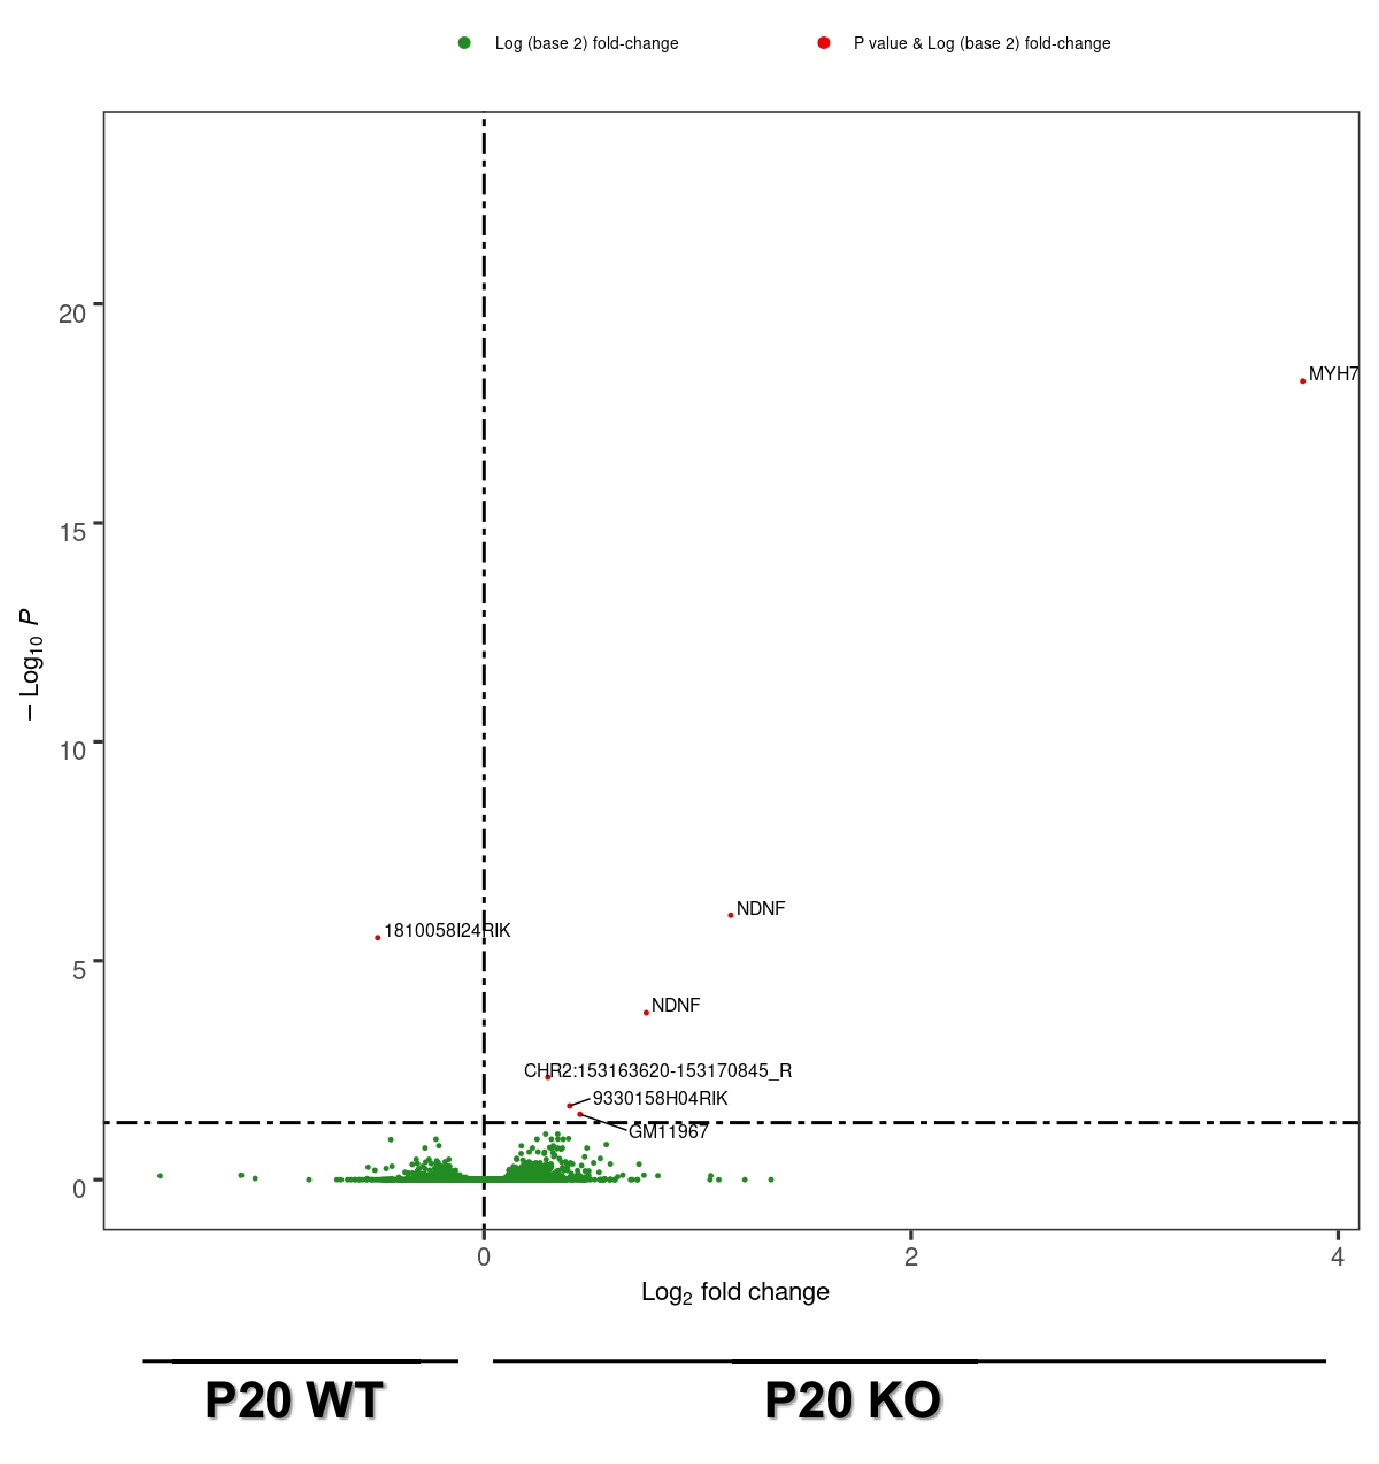
Left ventricle transcriptome differences between P20 Efnb1CM-/-KO and WT mice.
Volcano plot of differences in gene expression between P20 WT and P20 Efnb1CM-/-KO mice (cKO) mice. Colors indicate p<0.05 and log (base 2) fold change >1 (red), and nonsignificant (green) (n = 6 mice/group).
Figure 6
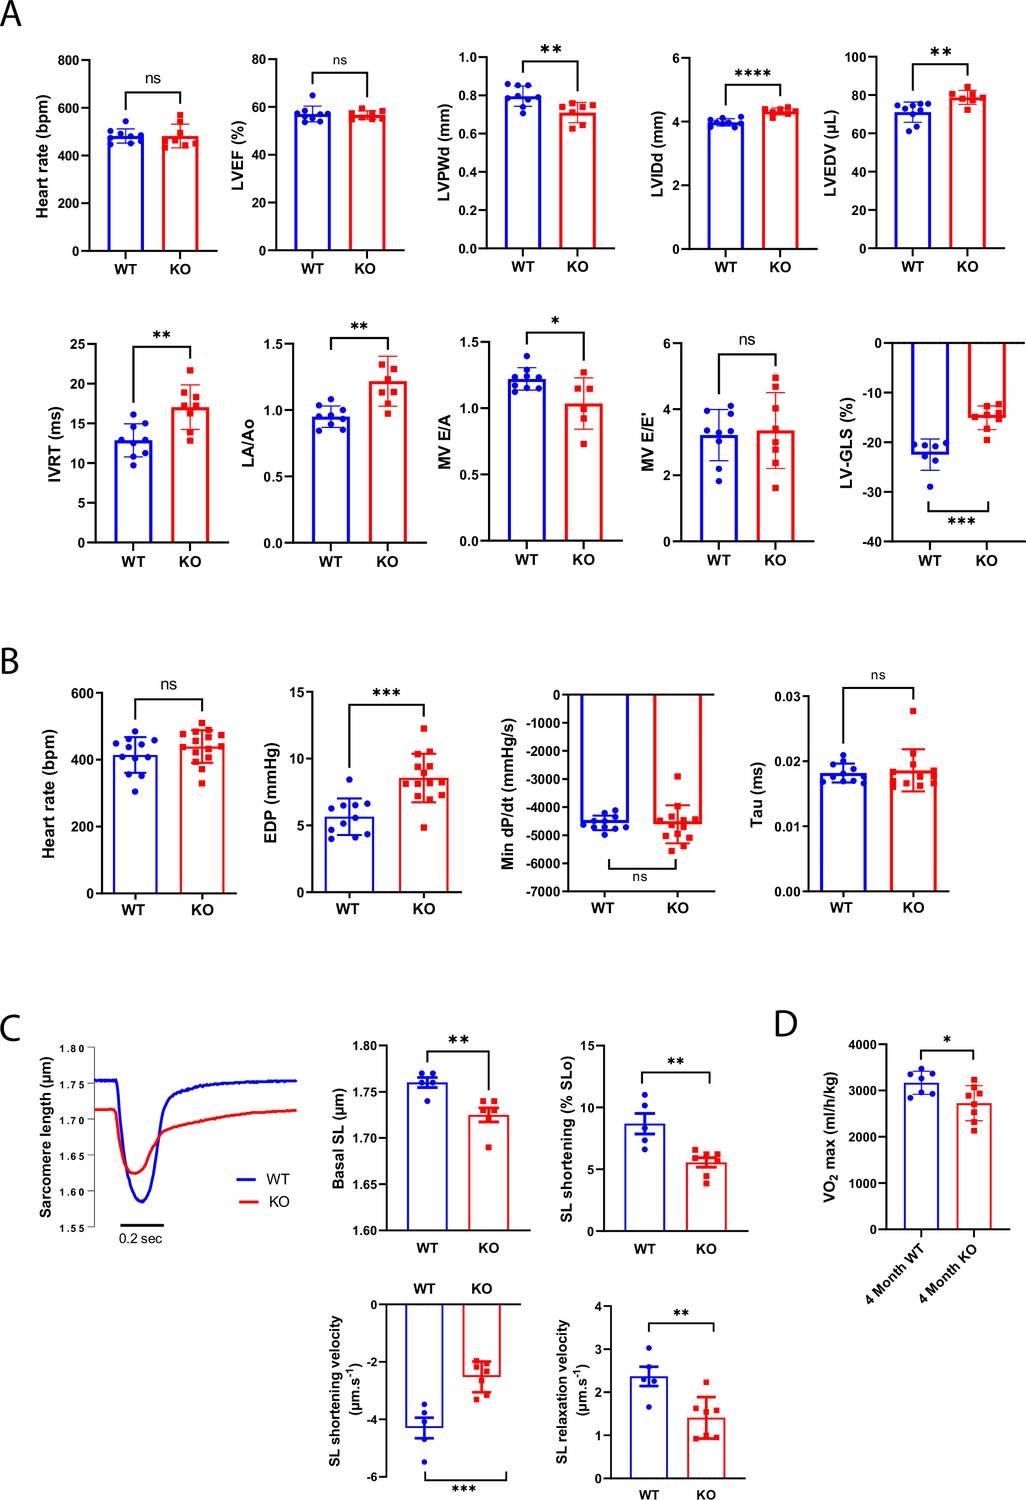
Constitutive Efnb1-specific knockdown in the cardiomyocyte (CM) impairs diastolic function.
(A) Echocardiography performed on P60 Efnb1CM-/-KO or WT mice with 2D, TM, Doppler flow, and tissular Doppler analysis to measure morphometry, systolic and diastolic function. Left ventricular ejection fraction (LVEF), interventricular septum wall thickness in diastole (IVSd), left ventricular internal diameter end diastole (LVIDd), left ventricular end-diastolic volume (LVEDV), isovolumetric relaxation time (IVRT), left atrium/aorta ratio (LA/Ao), E/A ratio, e’ peak velocity, e’/a’ ratio, and E/e’ ratio were measured (WT n = 9, cKO n = 8 mice). (B) Cardiac catheterization to assess diastolic function of P60 Efnb1CM-/-KO or WT mice, measuring end diastolic LV pressure (EDP), Tau, and min dP/dt (WT n = 12, cKO n = 14 mice). (C) (Lleft panel) Representative contraction evoked by electrical field stimulation as measured from sarcomere length (SL) shortening in isolated CMs (left ventricles) from P60 Efnb1CM-speKO or WT mice; (middle panel) basal sarcomere length (SL); (right panel) sarcomere length (SL) shortening during contraction; (lower-left panel) sarcomere length shortening velocity; (lower-right panel) sarcomere length relaxation velocity (WT n = 5, cKO n = 7 mice). (D) Treadmill exercise tolerance assay assessed by the VO2max measured from 4-month-old Efnb1CM-speKO or WT mice (WT n = 7, cKO n = 8 mice). Data are presented as mean ± SD. Unpaired Student’s t-test for two group comparisons *p<0.05, **p<0.01, ***p<0.001. ****p<0.0001. ns, not significant.
-
Figure 6—source data 1
Raw data of echocardiography/doppler analysis in P60 WT or KO mice.
- https://cdn.elifesciences.org/articles/80904/elife-80904-fig6-data1-v1.xlsx
-
Figure 6—source data 2
Raw data of measurements from LV cardiac catherization in P60 WT and KO mice.
- https://cdn.elifesciences.org/articles/80904/elife-80904-fig6-data2-v1.xlsx
-
Figure 6—source data 3
Raw data of contraction measurements after electrical stimulation of isolated CMs.
- https://cdn.elifesciences.org/articles/80904/elife-80904-fig6-data3-v1.xlsx
-
Figure 6—source data 4
Raw data of VO2max measurements in treadmill exercise tolerance assay.
- https://cdn.elifesciences.org/articles/80904/elife-80904-fig6-data4-v1.xlsx
Figure 7 with 1 supplement
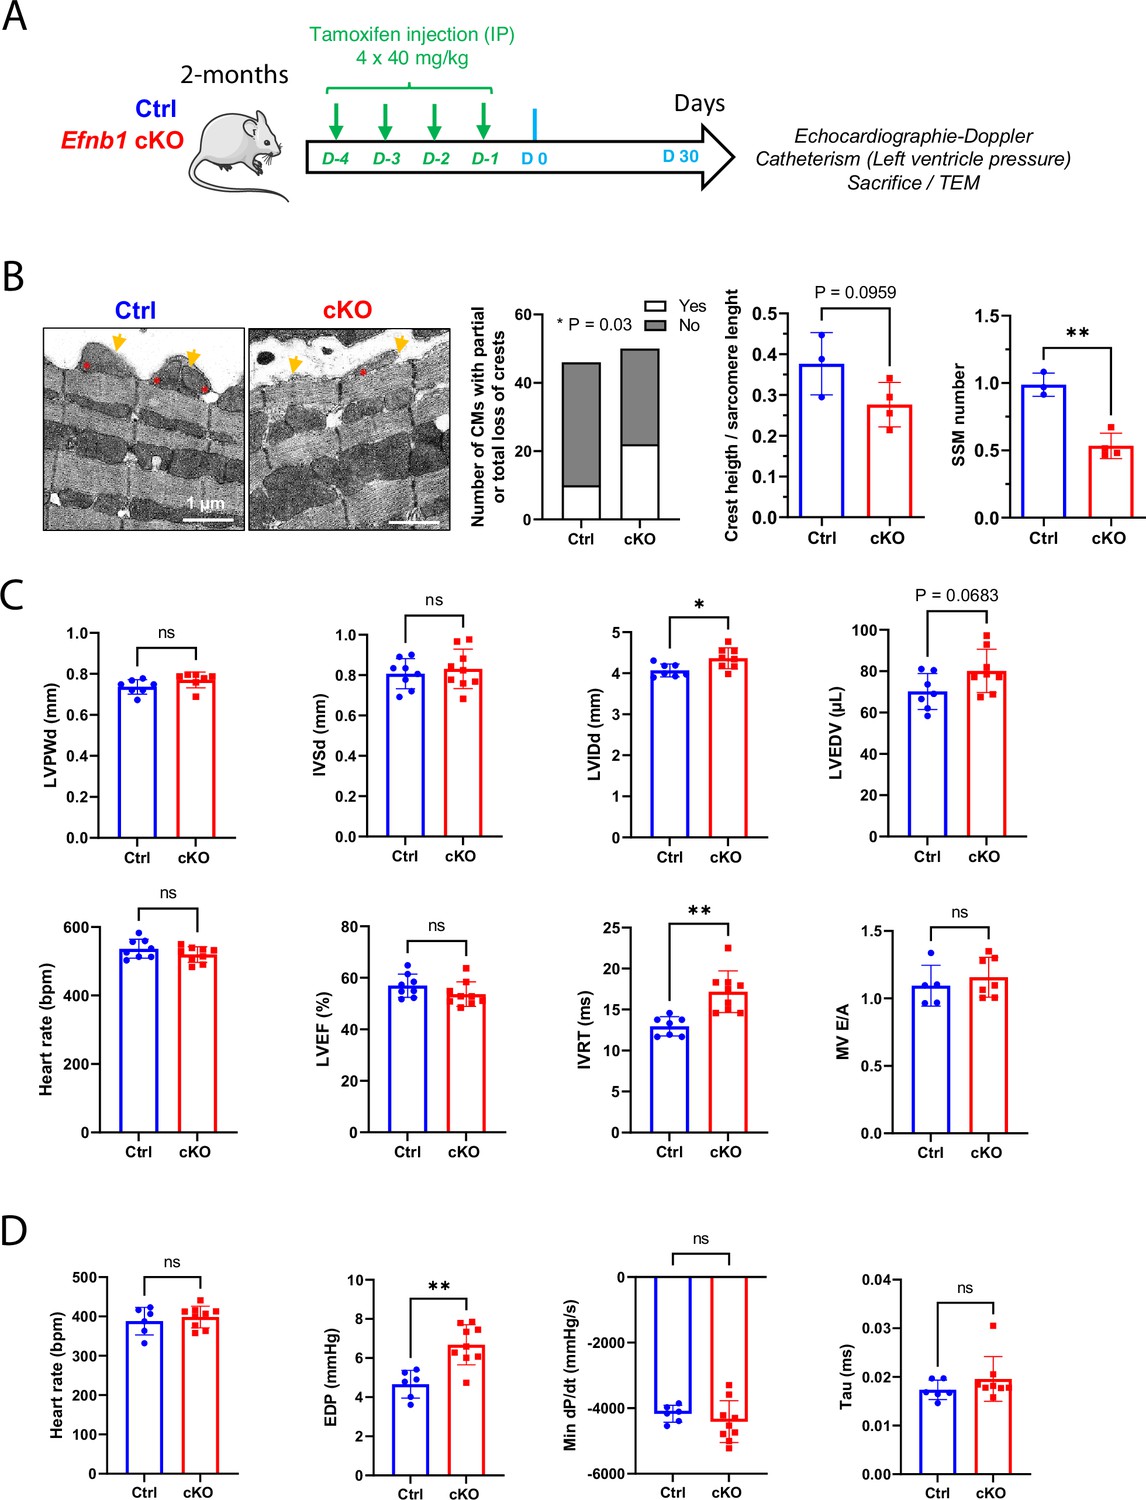
Conditional Efnb1-specific knockdown in the cardiomyocyte (CM) at the adult stage impairs CM crest maturation and the diastolic function.
(A) Two-month-old Ctrl (Efnb1flox/flox-αMHC-Cre-) and Efnb1 cKO (Efnb1flox/flox-αMHC-Cre+) mice were treated with tamoxifen for four consecutive days and subjected 1 month later to echocardiography, measurements of left ventricle pressures and phenotyping of CM surface crests from left ventricles. (B) Qualitative evaluation of CM number exhibiting total or partial subsarcolemmal mitochondria (SSM loss) (left panel), quantification of crest heights/sarcomere length (middle panel), and SSM number/crest (right panel) from TEM micrographs obtained from Ctrl or Efnb1 cKO (Ctrl n = 3, cKO n = 4 mice; ~60 crests per group) and illustrated in the left panel (arrow = surface crest; asterisk = SSM). (C) Echocardiography performed on Ctrl or Efnb1cKO mice with 2D, TM, Doppler flow, and tissular Doppler analysis to measure morphometry, systolic and diastolic function. Left ventricular ejection fraction (LVEF), left ventricular posterior wall thickness in end diastole (LVPWd), interventricular septum wall thickness in end diastole (IVSd), left ventricular internal diameter end diastole (LVIDd), left ventricular end-diastolic volume (LVEDV), and isovolumetric relaxation time (IVRT) (WT n = 8, cKO n = 9 mice). (D) Cardiac catheterization to assess diastolic function of Ctrl or Efnb1 cKO mice, measuring end diastolic LV pressure (EDP), Tau, and min dP/dt (Ctrl n = 6, cKO n = 9 mice). Fisher’s exact test for (B, left panel). Data are presented as mean ± SD. Unpaired Student’s t-test for two group comparisons *p<0.05, **p<0.01. ns, not significant.
-
Figure 7—source data 1
Raw data of CM crest maturity quantified in control and cKO mice.
- https://cdn.elifesciences.org/articles/80904/elife-80904-fig7-data1-v1.xlsx
-
Figure 7—source data 2
Raw data of echocardiography/doppler analysis in adult control or cKO mice.
- https://cdn.elifesciences.org/articles/80904/elife-80904-fig7-data2-v1.xlsx
-
Figure 7—source data 3
Raw data of measurements from LV cardiac catherization in control and cKO mice.
- https://cdn.elifesciences.org/articles/80904/elife-80904-fig7-data3-v1.xlsx
Figure 7—figure supplement 1
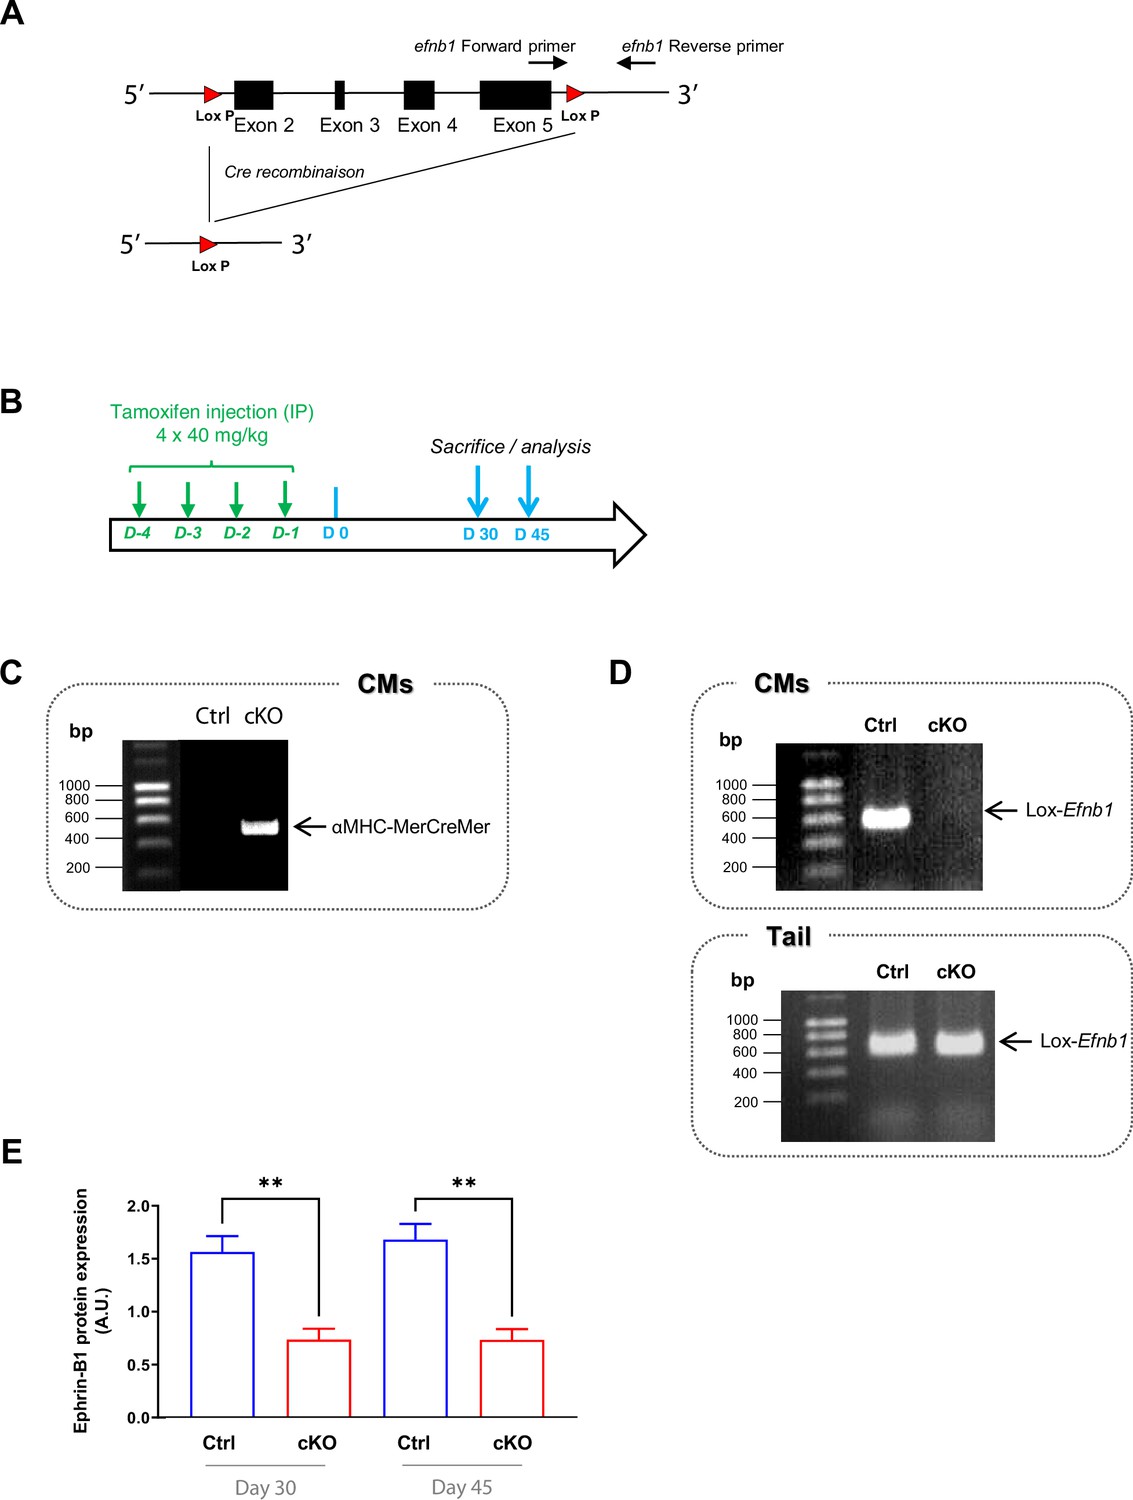
Characterization of αMHC-MerCreMer+/--Efnb1flox/flox mice (cardiomyocyte [CM]-specific inducible conditional Efnb1 KO, Efnb1 cKO).
(A) Exons 2–5 from ephrin-B1 encoding gene (Efnb1) are flanked by 2 loxP sites. The primers bind before and after the 3’ LoxP. (B) To promote the expression of the inducible αMHC-Cre specifically in CMs, 2 month-old Efnb1flox/flox-αMHC-Cre+ (cKO) and Efnb1flox/flox-αMHC-Cre- (Ctrl) received intraperitoneal (IP) injections of 40 mg/kg tamoxifen during consecutive 4 days. Mice were euthanized 30 or 45 days after the last tamoxifen injection. (C–, D). PCR analysis of genomic DNA from tail or isolated CMs from Efnb1 cKO or Ctrl mice. (C) αMHC-Mer-Cre-Mer amplification was only detected in isolated CMs from cKO mice. (D) Upper panel demonstrates specific deletion of Efnb1 in isolated CMs from cKO mice only 5 days after tamoxifen injection. Lower panel shows that Efnb1 deletion did not occur in tail tissue from cKO mice, demonstrating that Efnb1 deletion occurred specifically in CMs after tamoxifen injection. (E) Western blot analysis of ephrin-B1 protein expression in isolated CMs from Ctrl and Efnb1 cKO mice 30 or 45 days following tamoxifen injection. Ephrin-B1 expression was decreased by ~50% in CMs from cKO mice compared to WT littermate mice 30 days post-tamoxifen injection and the decrease remains constant after 45 days. Data are presented as mean ± SEM. n = 3–4 mice per lineage group for each time point, one-way ANOVA with Sidak’s multiple-comparisons test, **p<0.01.
-
Figure 7—figure supplement 1—source data 1
Raw data of ephrin-B1 expression quantified in western-blot.
- https://cdn.elifesciences.org/articles/80904/elife-80904-fig7-figsupp1-data1-v1.xlsx
Figure 8
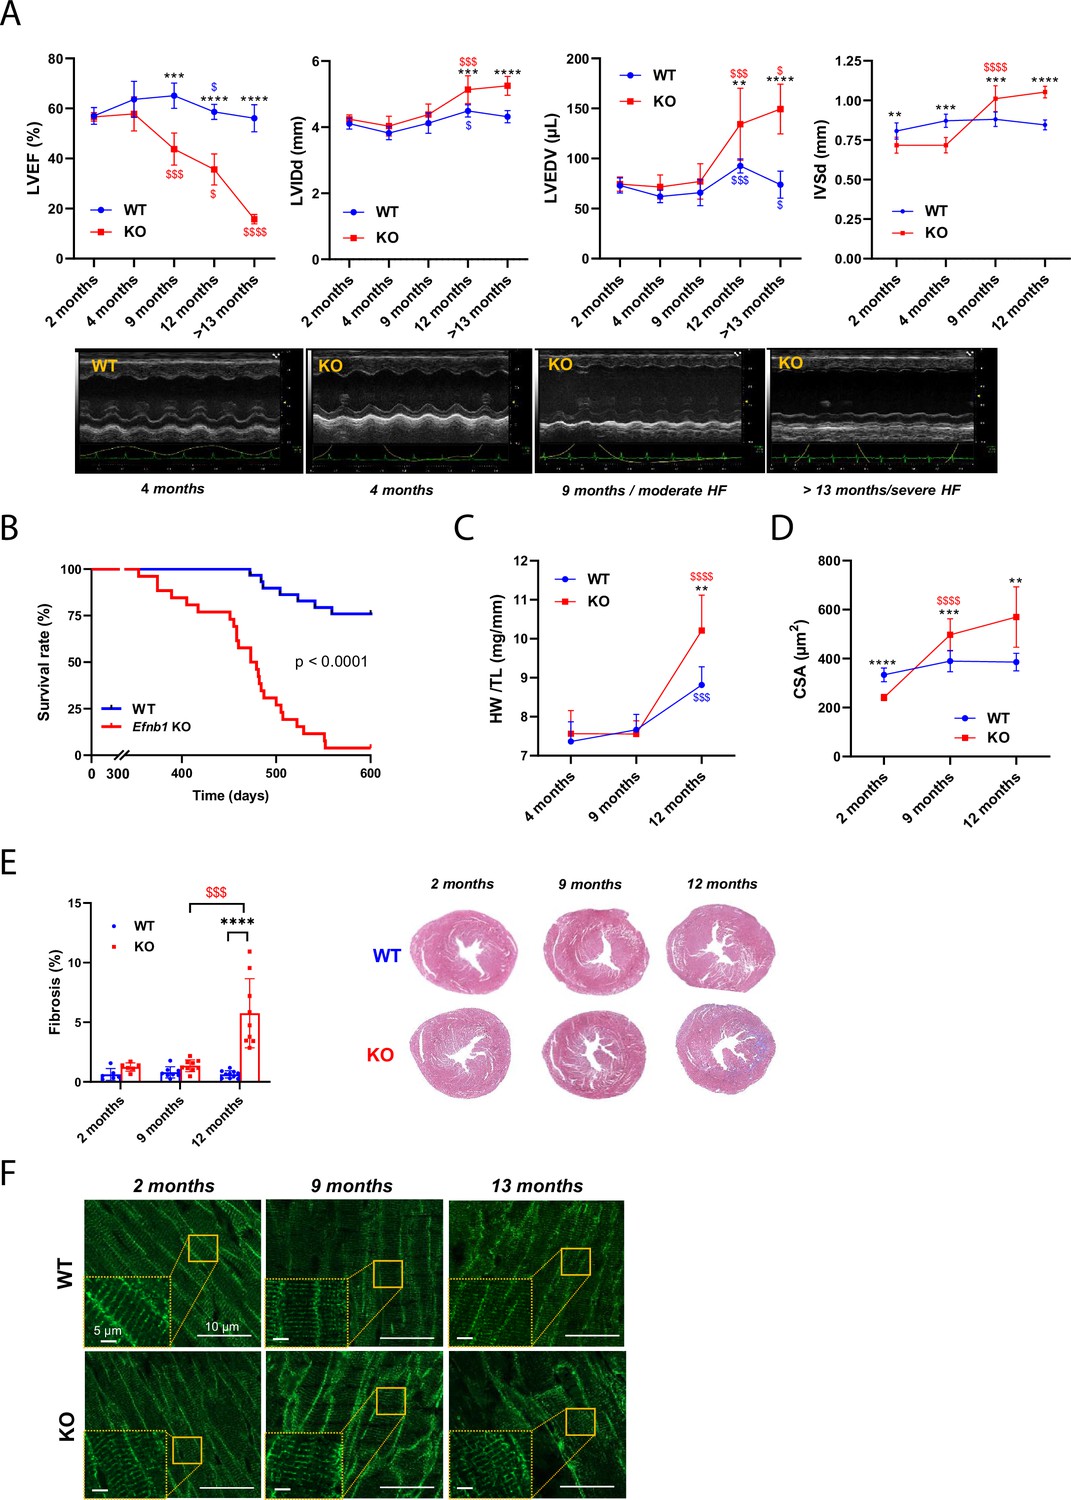
Efnb1CM-/- KO mice switch progressively from heart failure with preserved ejection fraction (HFpEF) to heart failure with reduced ejection fraction (HFrEF).
(A) (Upper panels) Longitudinal echocardiography to assess morphometry and systolic function of Efnb1CM-/-KO and WT mice over time. Left ventricular ejection fraction (LVEF), left ventricular internal diameter end diastole (LVIDd), left ventricular end diastolic volume (LVEDV), and interventricular septum wall thickness in diastole (IVSd) were measured in 2-, 4-, 9-, 12- and >13-month-old mice (WT 2 months n = 9, 4 months n = 4, 9 months n = 9, 12 months n = 9, >13 months n = 9 mice; cKO 2 months n = 8, 4 months n = 4, 9 months n = 8, 12 months n = 8, >13 months n = 5 mice). (Lower panels) Representative images of left ventricular M-mode echocardiography from WT compared to Efnb1CM-/-KO mice, which show progressive LV dilatation and systolic function decline in the KO mice. (B) Kaplan–Meier survival plots for WT (blue) and Efnb1CM-/-KO mice (red) (starting populations; WT n = 26, cKO n = 30 mice). Survival analysis was performed by log-rank test. (C) Heart weight/tibia length ratios from WT and Efnb1CM-/-KO mice (WT 4 months n = 6, 9 months n = 8, 12 months n = 8 mice; cKO 4 months n = 6, 9 months n = 9, 12 months n = 8 mice). (D) CM area quantification from WGA-stained heart cross-sections (endocardium) from Efnb1CM-/-KO or WT mice (~120 CMs/mouse; WT 2 months n = 5, 9 months n = 9, 12 months n = 8 mice; cKO 2 months n = 6, 9 months n = 9, 12 months n = 8 mice). (E) (Left panel) Cardiac fibrosis quantification from Masson’s trichrome staining of transverse sections from WT and Efnb1CM-/-KO mice hearts (2 months n = 6, 9 months n = 8, 12 months n = 9 mice) and (right panels) representative images. (F) Representative immunofluorescent staining of T-tubules (caveolin-3) in paraffin-embedded heart sections from Efnb1CM-/-KO and WT mice. Data are presented as mean ± SD. One-way ANOVA with Tukey post-hoc test for longitudinal group comparisons of WT or cKO mice (each age compared with the preceding one), $p<0.05, $$p<0.01, $$$p<0.001, $$$$p<0.0001. Unpaired Student’s t-test to compare WT and cKO groups. *p<0.05, **p<0.01, ***p<0.001, ****p<0.0001. Only significant results are presented.
-
Figure 8—source data 1
Raw data of echocardiographic measurements.
- https://cdn.elifesciences.org/articles/80904/elife-80904-fig8-data1-v1.xlsx
-
Figure 8—source data 2
Raw data of Kaplan-Meier survival plots.
- https://cdn.elifesciences.org/articles/80904/elife-80904-fig8-data2-v1.xlsx
-
Figure 8—source data 3
Raw data of heart weight/tibia length ratios.
- https://cdn.elifesciences.org/articles/80904/elife-80904-fig8-data3-v1.xlsx
-
Figure 8—source data 4
Raw data of CM area quantification.
- https://cdn.elifesciences.org/articles/80904/elife-80904-fig8-data4-v1.xlsx
-
Figure 8—source data 5
Raw data of cardiac fibrosis quantification.
- https://cdn.elifesciences.org/articles/80904/elife-80904-fig8-data5-v1.xlsx
Figure 9
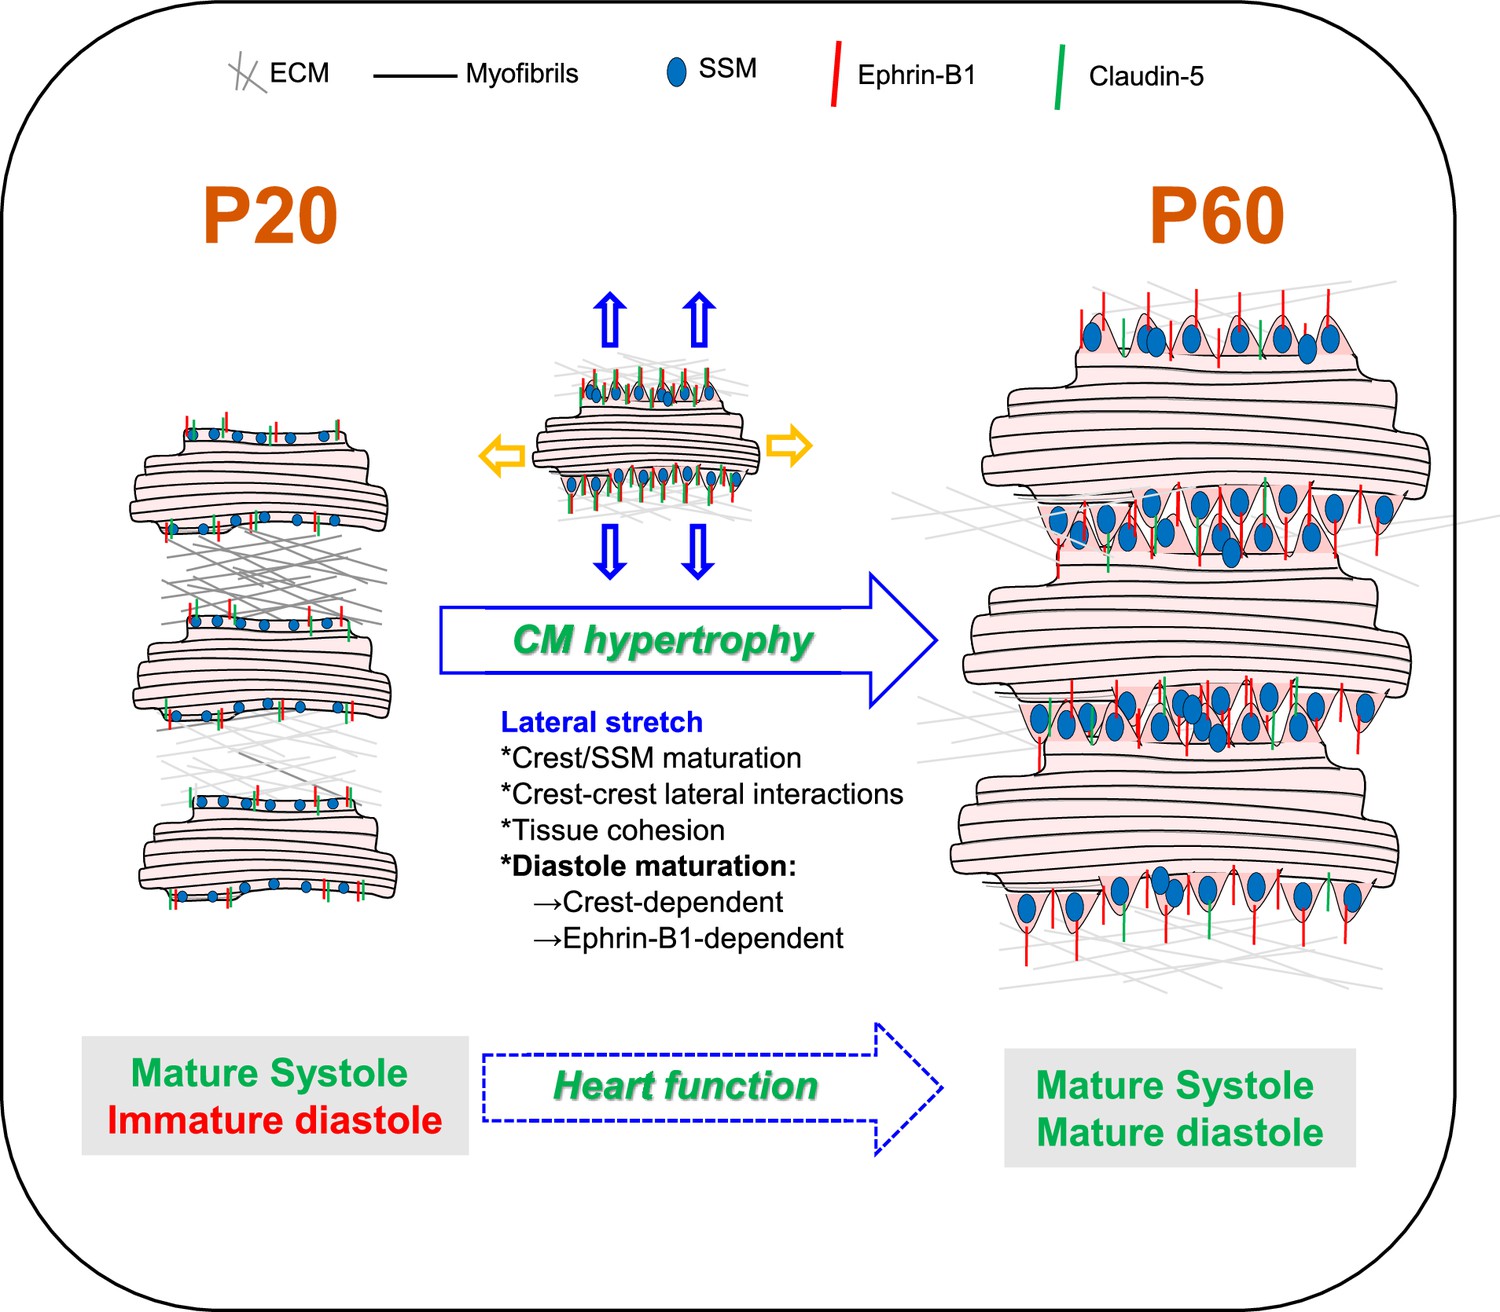
Schematic illustration of cardiomyocyte (CM) surface crest maturation between P20 and P60 supporting the setting of the adult diastolic function.
At postnatal day 20 (P20), cardiomyocytes express low levels of ephrin-B1 and its claudin-5 partner at the lateral surface and surface crests/subsarcolemmal mitochondria (SSM) are still immature. CMs do not interact with neighboring CMs at their lateral surfaces. After P20, CMs undergo substantial hypertrophy relying on elongation of both their long and short axes. From the short-axis standpoint, the hypertrophy is independent from myofibril addition but relies on the maturation of the CM surface architecture. Hence, at P60, the increase in ephrin-B1/claudin-5 expression at the lateral membrane promotes crest–SSM swelling but also crest–crest interactions between neighboring CMs most likely leading to a lateral stretch of the CM. This ephrin-B1-dependent lateral maturation of the CM surface allows maturation of the diastolic function.
Additional files
Download links
A two-part list of links to download the article, or parts of the article, in various formats.
Downloads (link to download the article as PDF)
Open citations (links to open the citations from this article in various online reference manager services)
Cite this article (links to download the citations from this article in formats compatible with various reference manager tools)
Ephrin-B1 regulates the adult diastolic function through a late postnatal maturation of cardiomyocyte surface crests
eLife 12:e80904.
https://doi.org/10.7554/eLife.80904


