Cervical cancer screening improvements with self-sampling during the COVID-19 pandemic
- Center for Cervical Cancer Elimination, F46, Pathology and Cancer Diagnostics, Medical Diagnostics Karolinska, Karolinska University Hospital and Division of Cervical Cancer Elimination, CLINTEC, Karolinska Institutet, Sweden
- Regional Cancer Center of Stockholm-Gotland, Cancer Screening Unit, Sweden, Sweden
Figures
Figure 1
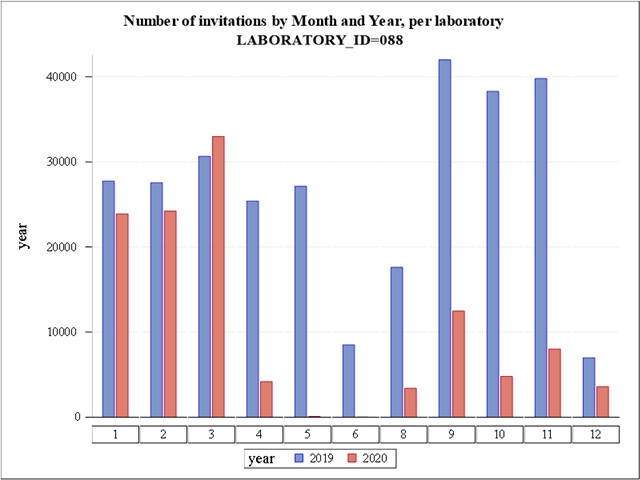
Number of invitations to cervical cancer screening in Stockholm by month and year.
LabID 088 is Karolinska University Hospital (Stockholm region). Numbers on the X-axis refer to calendar month.
Figure 2
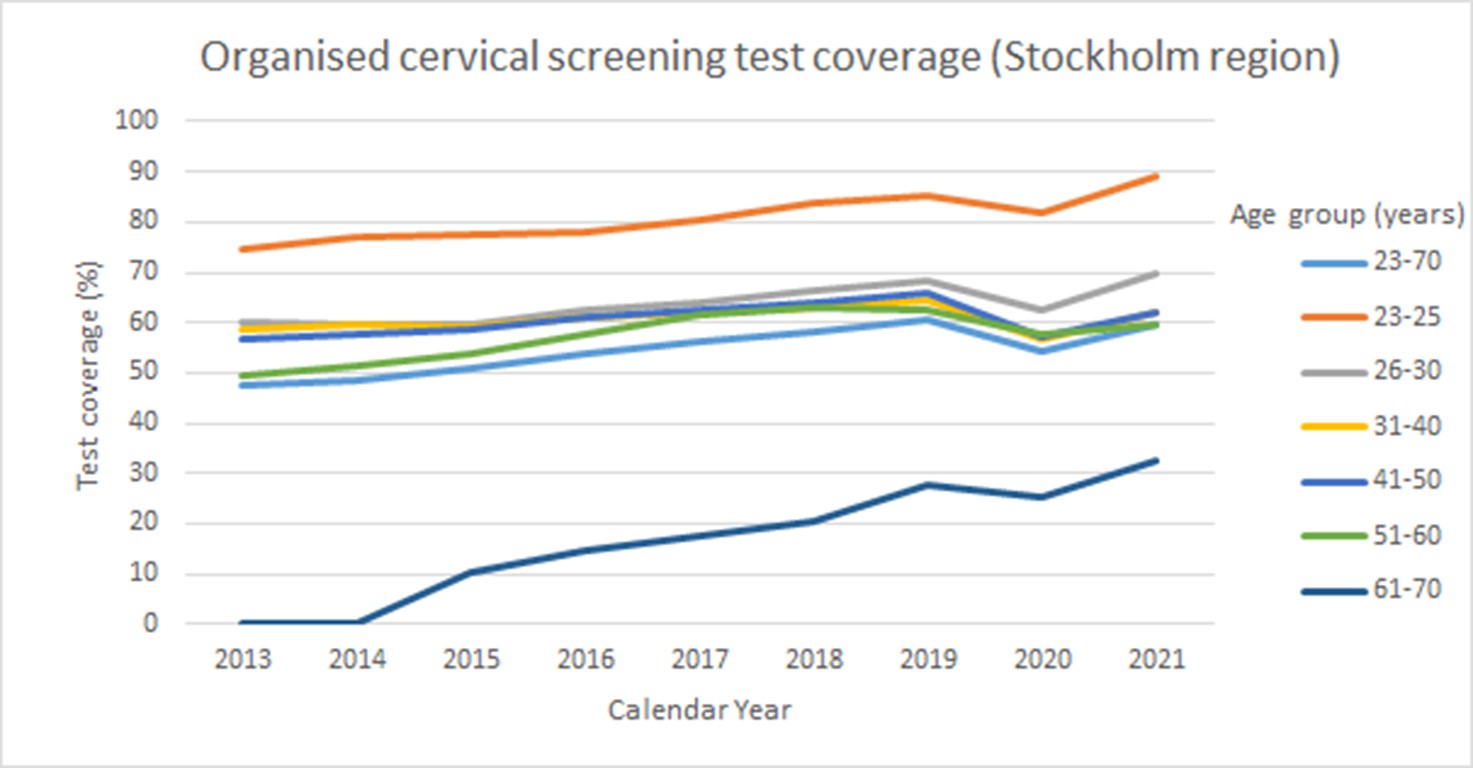
Test coverage of organized cervical screening among women in the Stockholm Gotland region, Sweden between the years 2013 and 2021.
Tables
Table 1
Test coverage of organized cervical screening (% of total population tested) in the Stockholm and Gotland region during 2013–2021 stratified by age group.
The target age group of the program was 23–60 years of age until 2015 and 23–70 years of age from 2015 onwards. Program cancellation due to the COVID-19 pandemic occurred in April 2020 and the switch to primary screening with self-sampling was implemented in March 2021.
| Test coverage (%) | |||||||
|---|---|---|---|---|---|---|---|
| Age group (years) | |||||||
| Year | 23–70 | 23–25 | 26–30 | 31–40 | 41–50 | 51–60 | 61–70 |
| 2013 | 47.7 | 74.7 | 60.0 | 58.6 | 56.9 | 49.3 | 0.25 |
| 2014 | 48.7 | 77.2 | 59.7 | 59.5 | 57.6 | 51.5 | 0.27 |
| 2015 | 51.1 | 77.3 | 59.8 | 59.2 | 58.8 | 53.9 | 10.3 |
| 2016 | 54.0 | 78.2 | 62.5 | 61.0 | 61.0 | 57.7 | 14.7 |
| 2017 | 56.2 | 80.6 | 64.2 | 62.3 | 62.4 | 61.6 | 17.4 |
| 2018 | 58.2 | 83.6 | 66.5 | 63.1 | 64.2 | 63.1 | 20.3 |
| 2019 | 60.5 | 85.4 | 68.2 | 64.6 | 65.9 | 62.7 | 27.9 |
| 2020 | 54.3 | 81.7 | 62.3 | 56.7 | 57.2 | 57.6 | 25.4 |
| 2021 | 59.6 | 88.9 | 69.6 | 62.3 | 62.2 | 59.6 | 32.6 |
Table 2
Test coverage of organized cervical screening stratified by mode of index sampling (clinician taken samples or self-sampling) in the Stockholm Gotland region during 2013–2021 stratified by age group.
| Absolute test coverage (%) from index samples taken by clinician | |||||||
|---|---|---|---|---|---|---|---|
| Age class | |||||||
| Year | 23–70 | 23–25 | 26–30 | 31–40 | 41–50 | 51–60 | 61–70 |
| 2013 | 47.7 | 74.7 | 60.0 | 58.6 | 56.9 | 49.3 | 0.25 |
| 2014 | 48.7 | 77.2 | 59.7 | 59.5 | 57.6 | 51.5 | 0.27 |
| 2015 | 51.1 | 77.3 | 59.8 | 59.2 | 58.8 | 53.9 | 10.3 |
| 2016 | 54.0 | 78.2 | 62.5 | 61.0 | 61.0 | 57.7 | 14.7 |
| 2017 | 56.2 | 80.6 | 64.2 | 62.3 | 62.4 | 61.6 | 17.4 |
| 2018 | 58.2 | 83.6 | 66.5 | 63.1 | 64.2 | 63.1 | 20.3 |
| 2019 | 60.0 | 85.4 | 68.2 | 64.1 | 65.3 | 61.9 | 27.5 |
| 2020 | 53.1 | 81.7 | 62.3 | 55.7 | 55.5 | 55.4 | 24.2 |
| 2021 | 41.0 | 86.8 | 46.2 | 41.3 | 39.5 | 42.7 | 19.8 |
| Absolute test coverage (%) from index sample taken by self-sampling | |||||||
| Age class | |||||||
| Year | 23–70 | 23–25 | 26–30 | 31–40 | 41–50 | 51–60 | 61–70 |
| 2013 | 0.00 | 0.00 | 0.00 | 0.00 | 0.00 | 0.00 | 0.00 |
| 2014 | 0.00 | 0.00 | 0.00 | 0.00 | 0.00 | 0.00 | 0.00 |
| 2015 | 0.00 | 0.00 | 0.00 | 0.00 | 0.00 | 0.00 | 0.00 |
| 2016 | 0.00 | 0.00 | 0.00 | 0.00 | 0.00 | 0.00 | 0.00 |
| 2017 | 0.00 | 0.00 | 0.00 | 0.00 | 0.00 | 0.00 | 0.00 |
| 2018 | 0.00 | 0.00 | 0.00 | 0.00 | 0.00 | 0.00 | 0.00 |
| 2019 | 0.46 | 0.00 | 0.00 | 0.49 | 0.60 | 0.78 | 0.37 |
| 2020 | 1.22 | 0.00 | 0.00 | 0.48 | 1.64 | 2.26 | 1.16 |
| 2021 | 18.6 | 2.17 | 23.4 | 21.0 | 22.7 | 16.9 | 12.8 |
Table 3
Absolute test coverage (%) of organized cervical screening due to attendance of prior long-time non-attenders stratified by mode of index sampling (clinician taken samples or self-sampling) in the Stockholm Gotland region during 2013–2021 stratified by age group.
| Absolute test coverage (%) attributable to previous long-time non-attenders* giving clinician taken samples | |||||||
|---|---|---|---|---|---|---|---|
| Age class | |||||||
| Year | 23–70 | 23–25 | 26–30 | 31–40 | 41–50 | 51–60 | 61–70 |
| 2013 | 4.09 | Na | 3.01 | 8.79 | 4.45 | 3.47 | 0.02 |
| 2014 | 4.26 | Na | 3.08 | 9.21 | 4.74 | 3.50 | 0.03 |
| 2015 | 4.54 | Na | 3.04 | 9.58 | 5.09 | 3.73 | 0.57 |
| 2016 | 4.95 | Na | 3.01 | 10.2 | 5.62 | 4.19 | 0.93 |
| 2017 | 5.30 | Na | 3.31 | 10.7 | 5.89 | 4.60 | 1.20 |
| 2018 | 5.71 | Na | 3.81 | 11.3 | 6.15 | 5.01 | 1.49 |
| 2019 | 5.76 | Na | 3.83 | 11.5 | 5.89 | 4.91 | 1.81 |
| 2020 | 5.11 | Na | 3.61 | 10.2 | 4.96 | 4.30 | 1.49 |
| 2021 | 3.57 | Na | 2.40 | 7.14 | 3.19 | 3.24 | 1.13 |
| Absolute test coverage (%) attributable to previous long-time non-attenders* giving self-samples | |||||||
| Age class | |||||||
| Year | 23–70 | 23–25 | 26–30 | 31–40 | 41–50 | 51–60 | 61–70 |
| 2013 | 0.00 | Na | 0.00 | 0.00 | 0.00 | 0.00 | 0.00 |
| 2014 | 0.00 | Na | 0.00 | 0.00 | 0.00 | 0.00 | 0.00 |
| 2015 | 0.00 | Na | 0.00 | 0.00 | 0.00 | 0.00 | 0.00 |
| 2016 | 0.00 | Na | 0.00 | 0.00 | 0.00 | 0.00 | 0.00 |
| 2017 | 0.00 | Na | 0.00 | 0.00 | 0.00 | 0.00 | 0.00 |
| 2018 | 0.00 | Na | 0.00 | 0.00 | 0.00 | 0.00 | 0.00 |
| 2019 | 0.46 | Na | 0.00 | 0.49 | 0.59 | 0.77 | 0.00 |
| 2020 | 1.21 | Na | 0.00 | 0.48 | 1.62 | 2.24 | 1.14 |
| 2021 | 3.86 | Na | 1.53 | 5.83 | 4.55 | 4.08 | 2.70 |
-
*
Long-time non-attenders are defined as women who have no history of any screening samples (neither by organized nor disorganized screening) prior to the index organized screening sample for 7.5 years (for those aged 23–49 years old) or 9.5 years (for those aged 50–70 years old).
Table 4
Proportion (%) of the test coverage attributable to previous long-time non-attenders stratified by mode of index sampling (clinician taken samples or self-sampling) in the Stockholm Gotland region during 2013–2021 stratified by age group.
| Proportion (%) of test coverage (clinician taken index samples) attributable to previous long-time non-attenders* | |||||||
|---|---|---|---|---|---|---|---|
| Age class | |||||||
| Year | 23–70 | 23–25 | 26–30 | 31–40 | 41–50 | 51–60 | 61–70 |
| 2013 | 8.59 | na | 5.01 | 15.0 | 7.82 | 7.03 | 10.0 |
| 2014 | 8.76 | na | 5.15 | 15.5 | 8.23 | 6.81 | 9.63 |
| 2015 | 8.88 | na | 5.08 | 16.2 | 8.65 | 6.92 | 5,52 |
| 2016 | 9.17 | na | 4.83 | 16.7 | 9.21 | 7.25 | 6.31 |
| 2017 | 9.42 | na | 5.16 | 17.2 | 9.44 | 7.48 | 6.93 |
| 2018 | 9.81 | na | 5.73 | 17.9 | 9.58 | 7.94 | 7.36 |
| 2019 | 9.59 | na | 5.62 | 17.9 | 9.02 | 7.94 | 6.56 |
| 2020 | 9.62 | na | 5.80 | 18.4 | 8.93 | 7.77 | 6.17 |
| 2021 | 8.72 | na | 5.19 | 17.3 | 8.08 | 7.58 | 5.70 |
| Proportion (%) of test coverage (self-sampled index samples) attributable to previous long-time non-attenders* | |||||||
| Age class | |||||||
| Year | 23–70 | 23–25 | 26–30 | 31–40 | 41–50 | 51–60 | 61–70 |
| 2021 | 20.7 | na | 6.54 | 27.8 | 20.0 | 24.1 | 21.0 |
-
*
Long-time non-attenders are defined as women who have no history of any screening samples (including via both organized and disorganized screening) prior to the index organiszed screening sample for 7.5 years (for those aged 23–49 years old) or 9.5 years (for those aged 50–70 years old).
Additional files
Download links
A two-part list of links to download the article, or parts of the article, in various formats.
Downloads (link to download the article as PDF)
Open citations (links to open the citations from this article in various online reference manager services)
Cite this article (links to download the citations from this article in formats compatible with various reference manager tools)
Cervical cancer screening improvements with self-sampling during the COVID-19 pandemic
eLife 12:e80905.
https://doi.org/10.7554/eLife.80905


