Ubiquitination drives COPI priming and Golgi SNARE localization
- Department of Biological Sciences, Vanderbilt University, United States
- Department of Cell and Developmental Biology, Vanderbilt University, United States
- Department of Chemistry, University of Massachusetts Amherst, United States
Figures
Figure 1 with 2 supplements
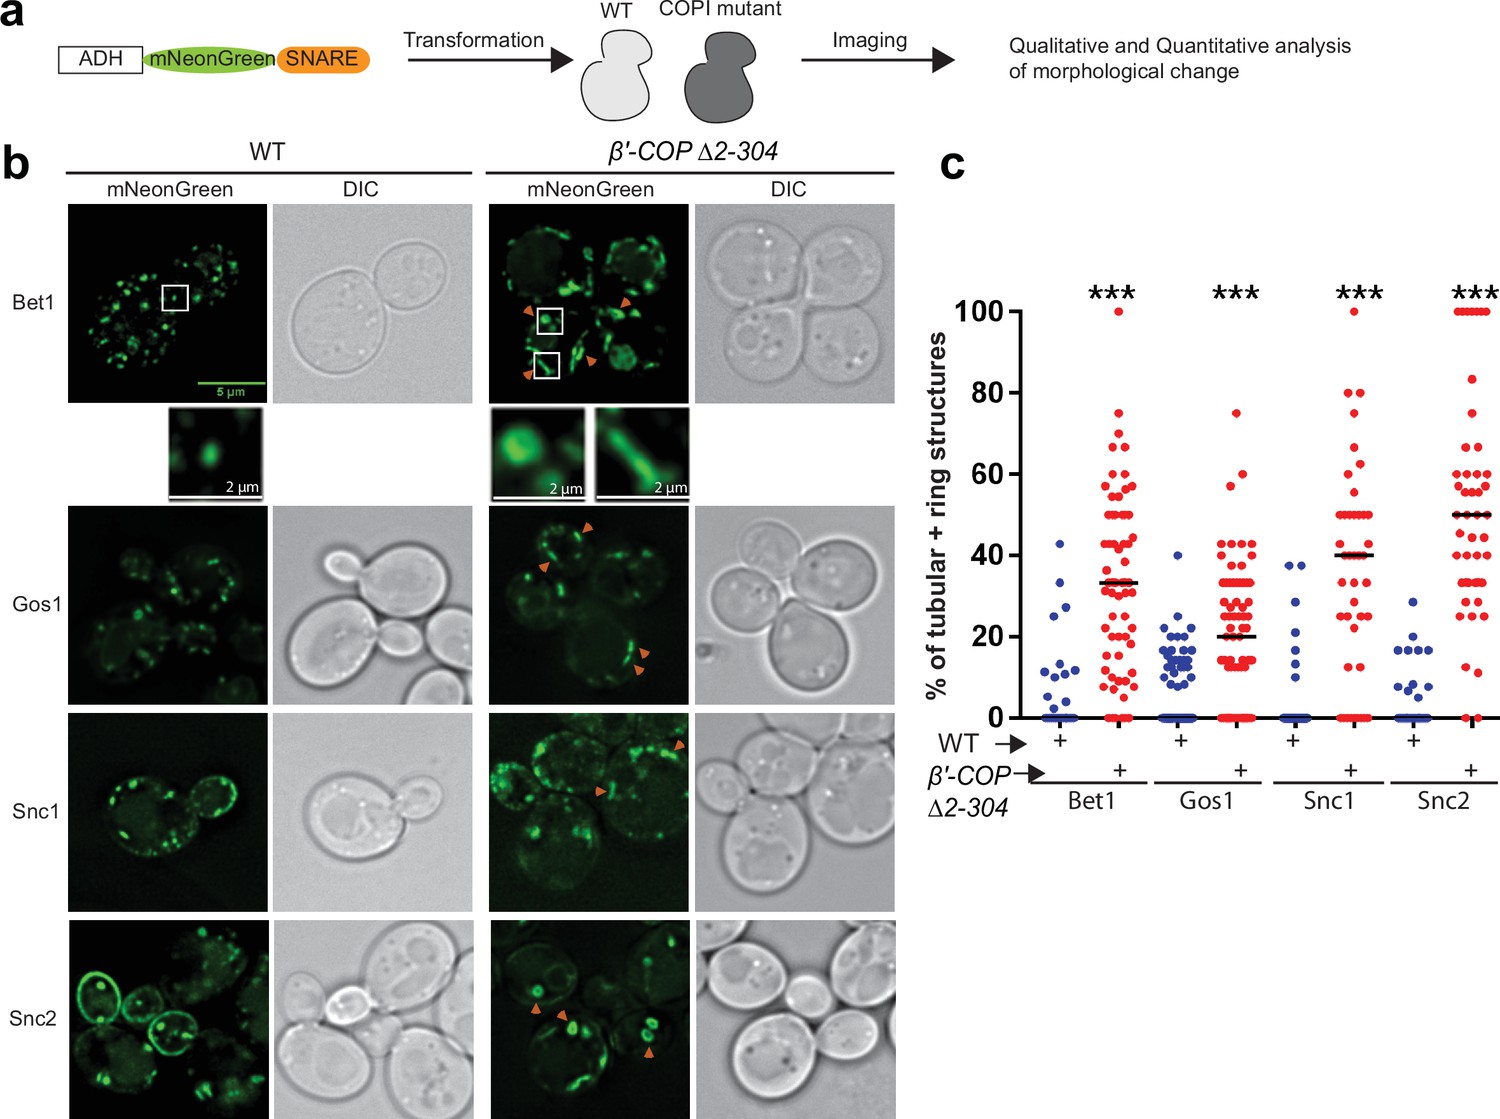
SNARE localization to morphologically aberrant structures in COPI mutants.
(a) Schematics of the experimental setup wherein SNAREs are individually tagged with mNeonGreen and expressed under constitutive ADH promoter in Saccharomyces cerevisiae wild-type (WT) cells or in cells with a deleted N-terminal WDR of β′-COP (Δ2–304). (b, c) Live-cell imaging shows significant differences in the appearance of SNAREs Bet1, Gos1, Snc1, and Snc2 where elongated tube- and ring-like structures (orange arrowheads) are seen in β′-COP Δ2–304 cells compared to control cells with full-length β′-COP (WT). Tubes were defined by having a long axis (length) at least twice as long as the short axis. The rings were defined as spherical structures having a larger diameter than a normal puncta and with a dimly fluorescent center. Data in (c) are the percentage of structures per cell optical section that are rings and tubules. The remainder of the fluorescent structures are punctae. Statistical differences were determined using a one-way analysis of variance (ANOVA) on the means of the three biological replicates (***p < 0.001). Scale bars represent 5 µm in the full panels and 2 µm for the insets. Full panel images are all scaled equally.
Figure 1—figure supplement 1
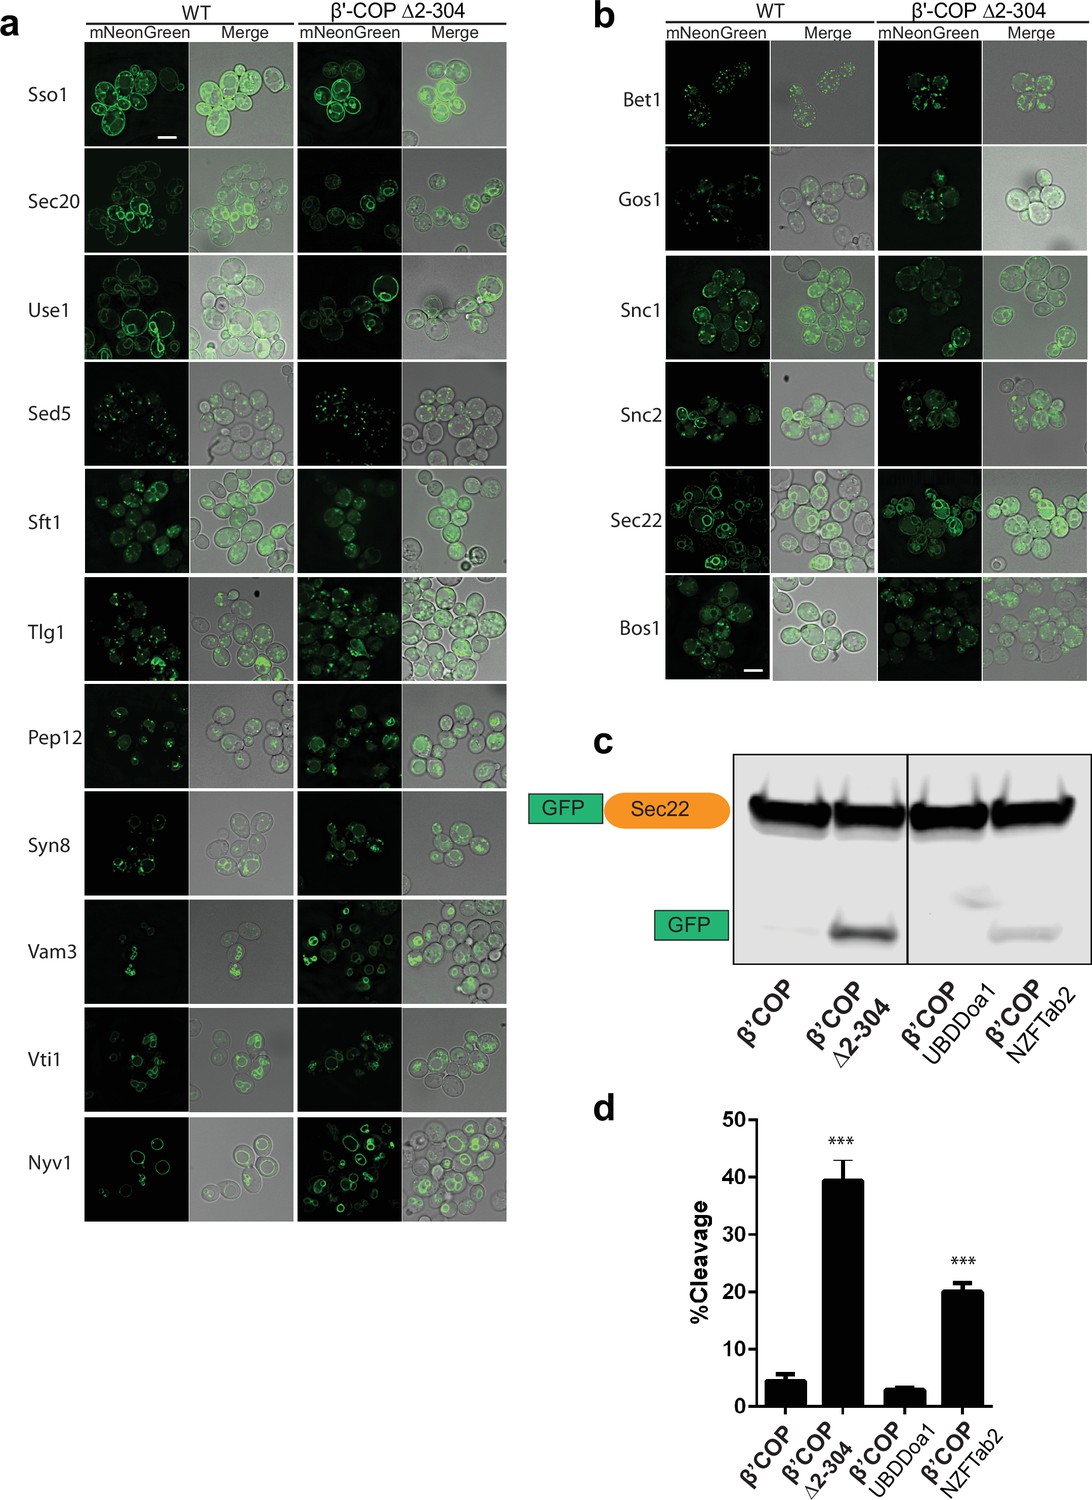
Localization of six SNAREs is perturbed in β′-COP Δ2–304 mutant.
Panels show live-cell imaging data for corresponding SNAREs tagged with mNeonGreen in Saccharomyces cerevisiae wild-type (WT) cells or in COPI mutant in which the N-terminal ubiquitin-binding domain of β′-COP is deleted (β′-COP Δ2–304). (a) No significant morphological changes are seen for eleven SNAREs in β′-COP Δ2–304 cells compared to WT cells. (b) Bet1 and Gos1 were observed in punctate structures in WT cells; however, in β′-COP Δ2–304 Bet1 and Gos1 were additionally seen in morphologically aberrant elongated tube- and ring-like structures. Snc1 and Snc2 are localized to plasma membrane in WT cells; however, in β′-COP Δ2–304 Snc1 and Snc2 are internalized to morphologically aberrant elongated tube- and ring-like structures. Compared to their localization in WT cells, Sec22 and Bos1 are partially mislocalized to vacuole in β′-COP Δ2–304 cells. Scale bar represents 5 µm. All images are scaled equally. (c) Western blot data using anti-GFP antibody wherein GFP-tagged Sec22 is expressed in WT cells, β′-COP Δ2–304 cells or in cells where the N-terminal WDR of β′-COP is replaced with general ubiquitin-binding domain Doa1 (β′-COP UBDDoa1) or the K63-polyUb-specific UBD, NZFTab2 (β′-COP NZFTab2). Compared to WT cells, in β′-COP Δ2–304 GFP-Sec22 is mislocalized to vacuoles resulting in its cleavage and the release of free GFP. The mislocalization of GFP-Sec22 is cells in COPI mutant is rescued by the replacement of β′-COP-UBD with the UBD of Doa1 and partially with the UBD of Tab2. (d) Quantitation of the free GFP signal divided by the total (GFP-Sec22 + GFP) was done on three biological replicates and statistical differences were determined using a one-way analysis of variance (ANOVA) (***p < 0.001).
Figure 1—figure supplement 2
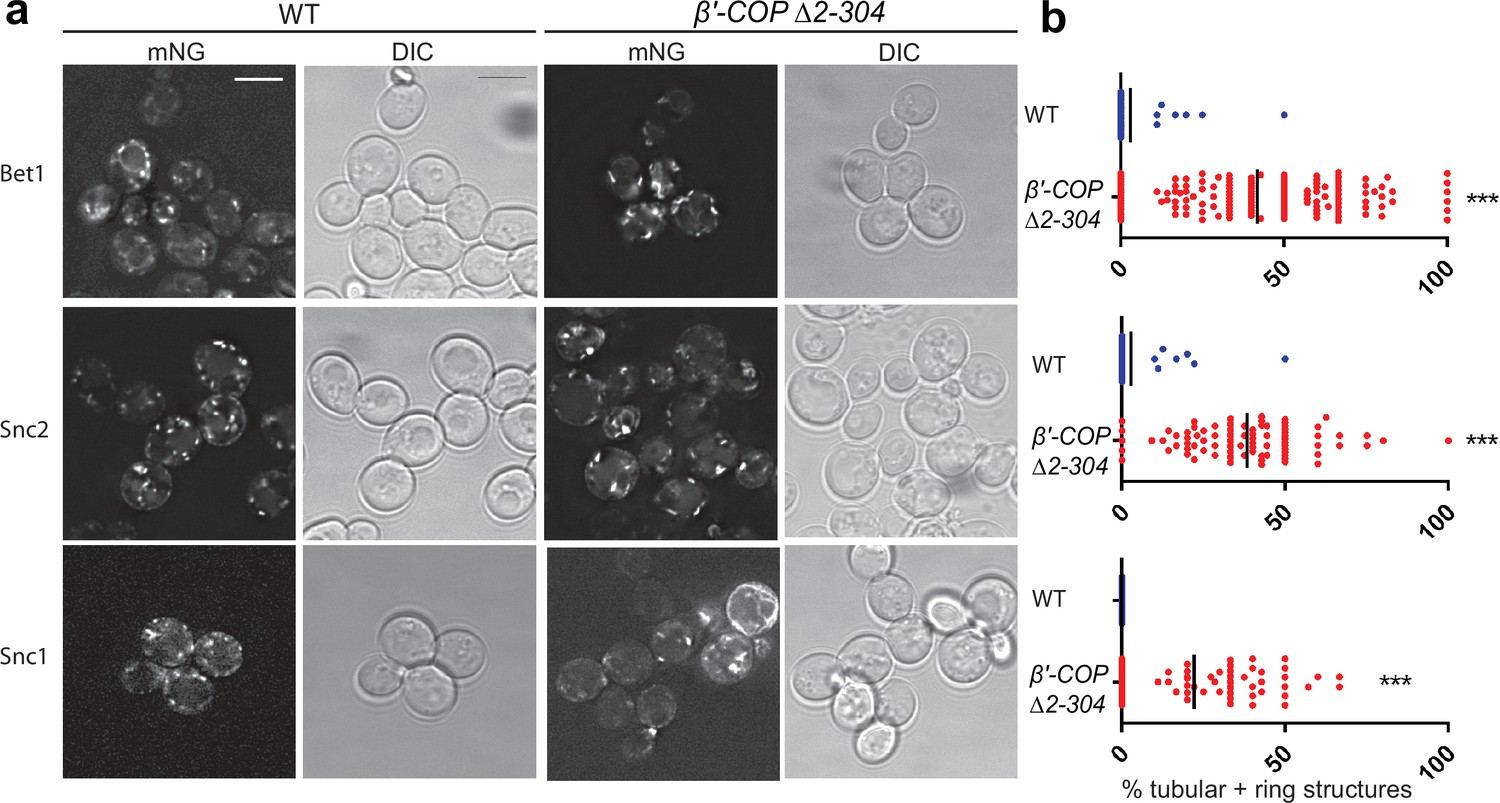
Bet1, Snc1, and Snc2 localization to aberrant membranes in β′-COP Δ2–304 mutants is independent of expression level.
(a, b) mNeonGreen- (mNG) tagged SNAREs were expressed under control of the CUP1 promoter, a weaker inducible promoter compared to constitutively expressed stronger ADH promoter, in wild-type (WT) cells or in β′-COP Δ2–304 cells. The morphological changes seen for Bet1, Snc2, and Snc1 in β′-COP Δ2–304 wherein SNAREs are mislocalized to elongated tube- and ring-like structures compared to WT cells when the SNAREs expressed under the CUP1 promoter are similar to those observed when expressed under the ADH promoter. Statistical differences were determined using a one-way analysis of variance (ANOVA) on the means of the three biological replicates (***p < 0.001). Scale bar represents 5 µm. All images are scaled equally.
Figure 2 with 4 supplements
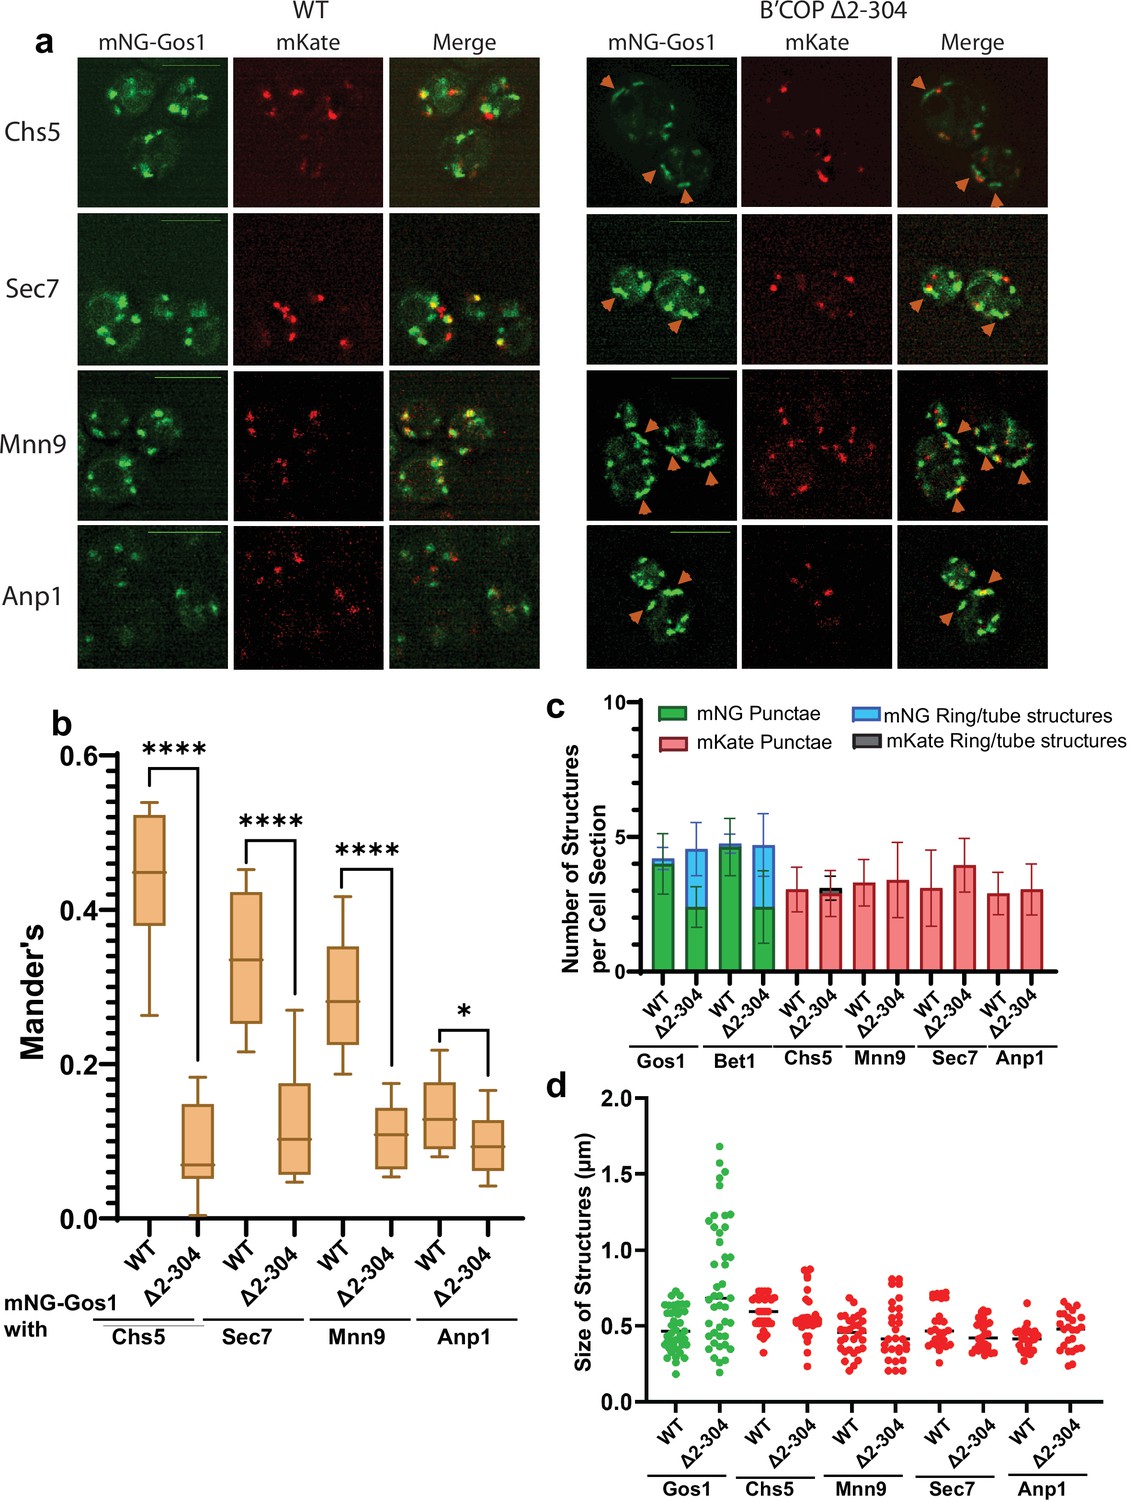
mNG-Gos1 accumulates in tube-like sequestration compartments lacking Golgi markers in β′-COP Δ2–304 cells.
(a, b) Colocalization analysis of mNG-Gos1 with two late Golgi markers Chs5-mKate, Sec7-mKate and two early Golgi markers, Mnn9-mKate and Anp1-mKate indicates a general loss of mNG-Gos1 from early and late Golgi in β′-COP Δ2–304 cells compared to wild-type (WT) cells. Gos1 accumulates in tube-like structures (orange arrowheads) in the COPI mutant. Scale bars represent 5µm. Statistical analysis was done on means using three biological replicates, t-test (****p ≤ 0.0001,*p < 0.05, Ns p > 0.05). (c) The abundance of mNG-tagged Gos1 and Bet1 tube- or ring-like structures is increased β′-COP Δ2–304 cells compared to WT cells, but the total number of fluorescent structures is unchanged. The number and appearance of mKate-tagged Chs5, Sec7, Mnn9, and Anp1 structures are not altered in β′-COP Δ2–304 cells compared to WT cells. (d) The average size and size distribution of intracellular structures for mNG-Gos1 are significantly increased in β′-COP Δ2–304 cells compared to WT control but the average size and size distribution of mKate-tagged Chs5, Sec7, Mnn9, and Anp1 structures are not altered in β′-COP Δ2–304 cells compared to WT control.
Figure 2—figure supplement 1
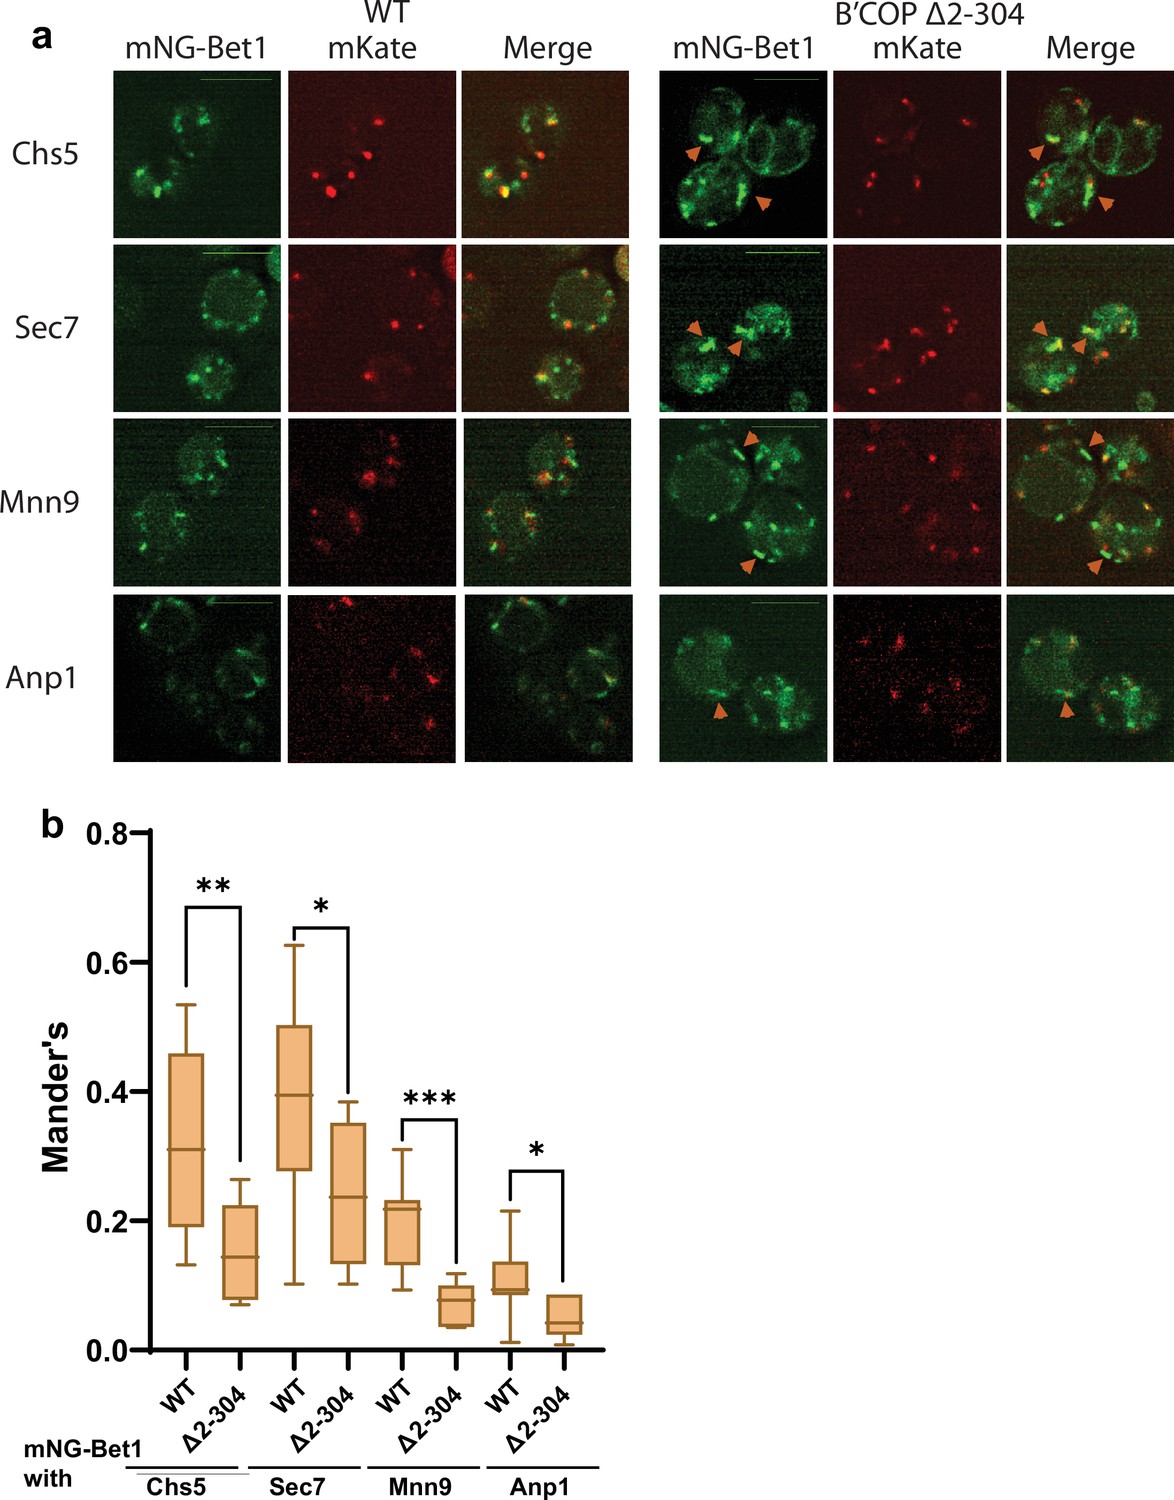
Colocalization analysis of mNG-Bet1 indicates loss of Bet1 from early and late Golgi compartments in β′-COP Δ2–304 cells.
Colocalization analysis of mNG-Bet1 with two late Golgi markers Chs5-mKate, Sec7-mKate and two early Golgi markers Mnn9-mKate, Anp1-mKate indicates partial loss of Bet1 from early and late Golgi compartments in β′-COP Δ2–304 cells compared to wild-type (WT) cells. Statistical analysis was done on means using three biological replicates, t-test (***p<0.001, **p<0.01 *p<0.05, Ns p > 0.05). mNG-Bet1 accumulated in tube- or ring-like structures in COPI mutant but the punctate pattern of four Golgi markers was unchanged between WT and β′-COP Δ2–304 cells. Scale bar represents 5 µm.
Figure 2—figure supplement 2
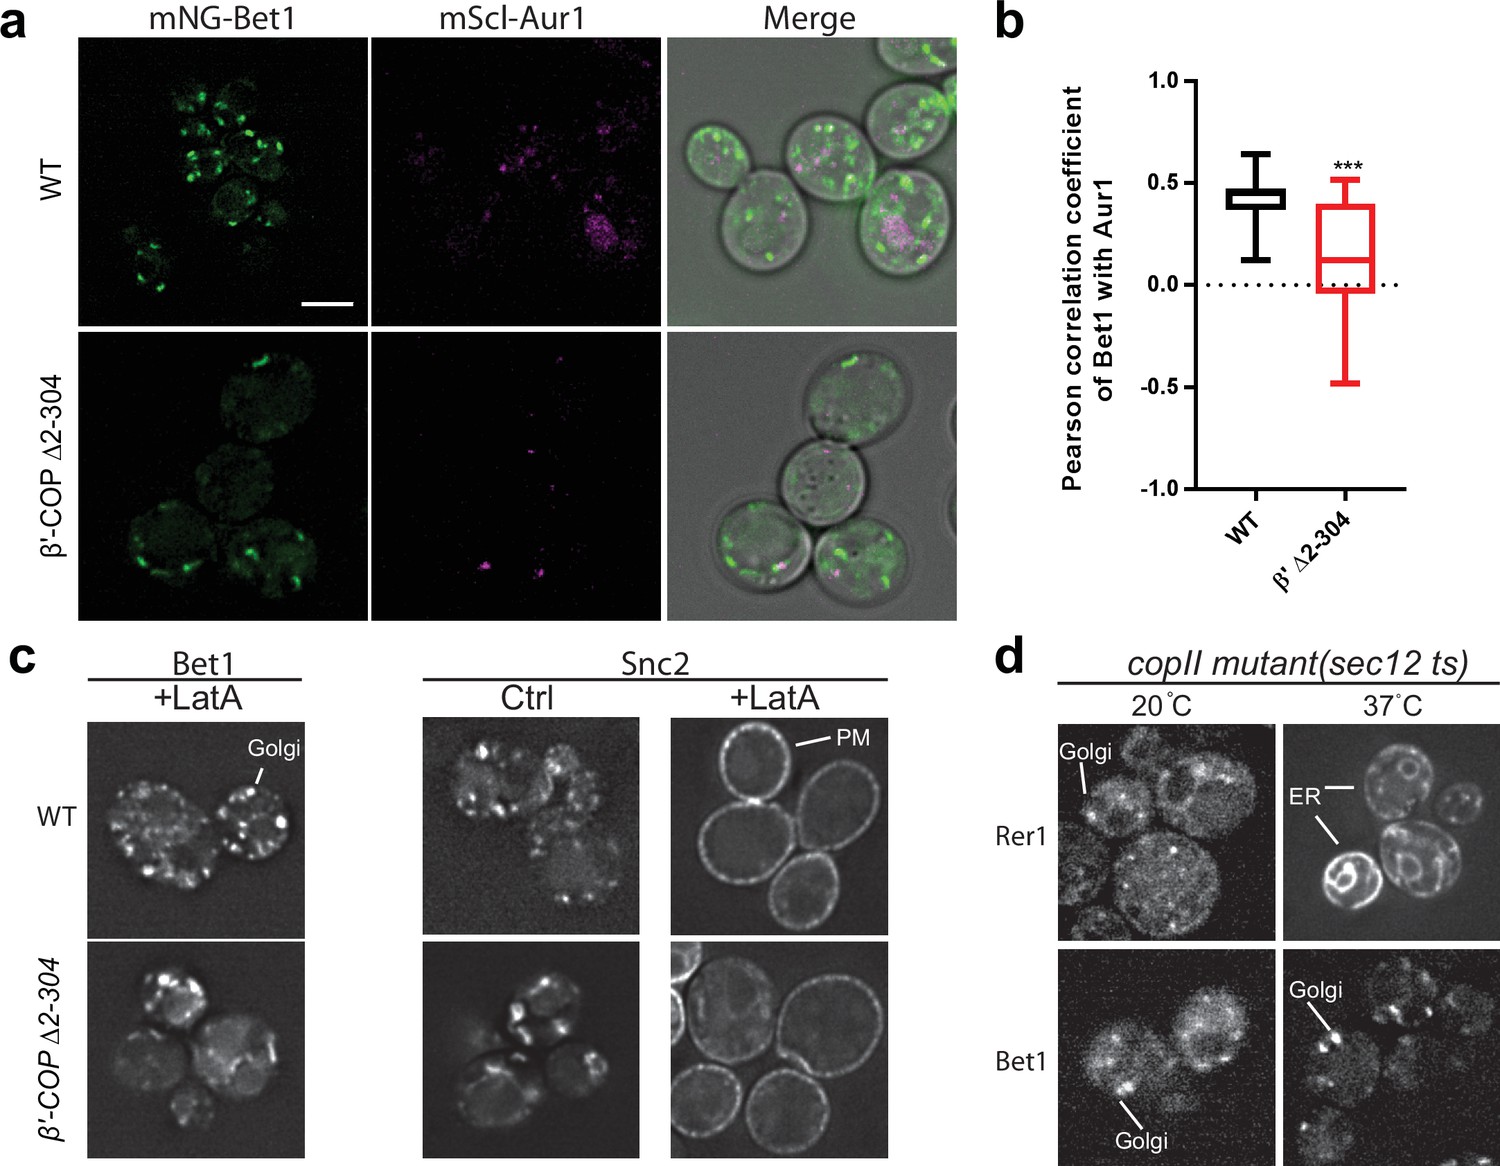
Bet1 localizes to medial Golgi and does not transit the plasma membrane or ER.
Panels a, c, and d show live-cell imaging data in Saccharomyces cerevisiae. (a, b) Deletion of the N-terminal WD40 propeller of β′-COP (Δ2–304) causes significantly less Bet1 colocalizing with Aur1 (***p<0.001). (c) Latrunculin A (LatA) treatment for 1 hr to inhibit endocytosis does not result in entrapment of Bet1 at plasma membrane (PM) in wild-type (WT) or β′-COP Δ2–304 cells. This is in contrast to Snc2, which is trapped at PM following LatA treatment. Thus, Snc2 cycles between the Golgi/endosomes and the plasma membrane while Bet1 follows a different trafficking itinerary. (d) Bet1 is localized to the Golgi in a COPII mutant (sec12 ts) at both permissive and nonremissive temperatures. This is in contrast to Rer1, which normally cycles between the ER and Golgi and is trapped in the ER of COPII mutants at nonpermissive temperatures. These data imply that Bet1 is primarily recycled from late Golgi to early Golgi compartments by COPI. Scale bar represents 5 µm. All images are scaled equally.
Figure 2—figure supplement 3
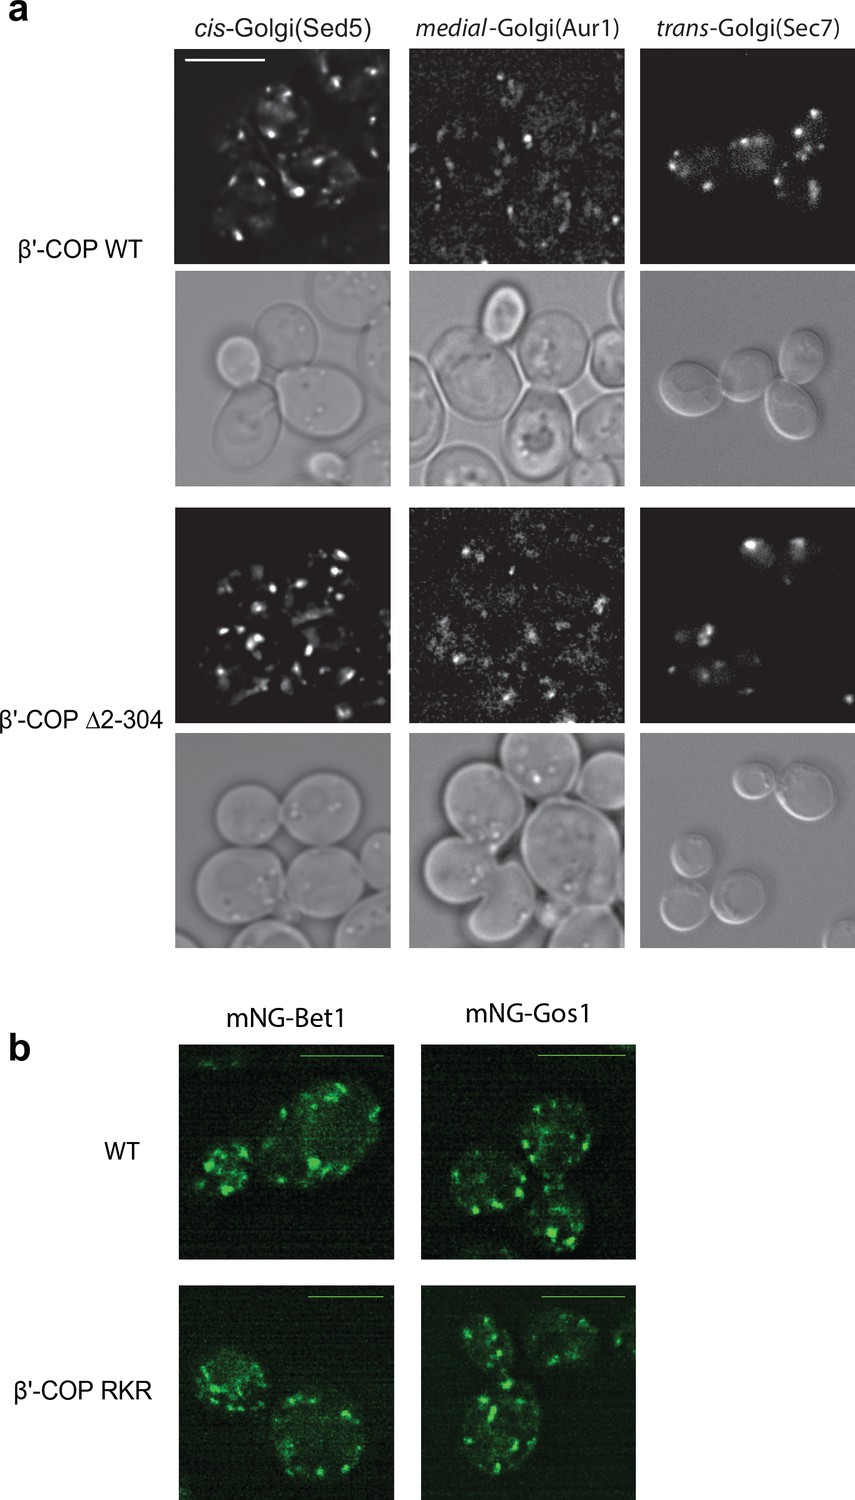
cis, medial, and trans-Golgi network morphology is normal in β′-COP Δ2–304 cells and Bet1 and Gos1 localize normally in β′-COP RKR cells.
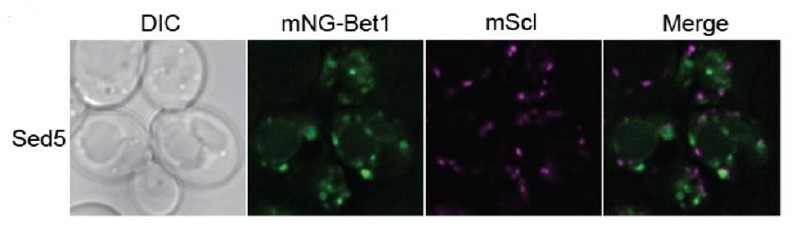
(a) No apparent changes are observed in the morphology of Golgi membranes containing cis-, medial-, and trans-Golgi network markers, Sed5, Aur1, and Sec7, respectively, in β′-COP Δ2–304 cells compared to wild-type (WT) cells. (b) The appearance and localization of mNG-Bet1 and mNG-Gos1 puncta are not observably different in WT or in β′-COP RKR cells which are defective in binding dilysine cargo through β′ arm. Scale bar represents 5 µm. All images are scaled equally.
Figure 2—figure supplement 4
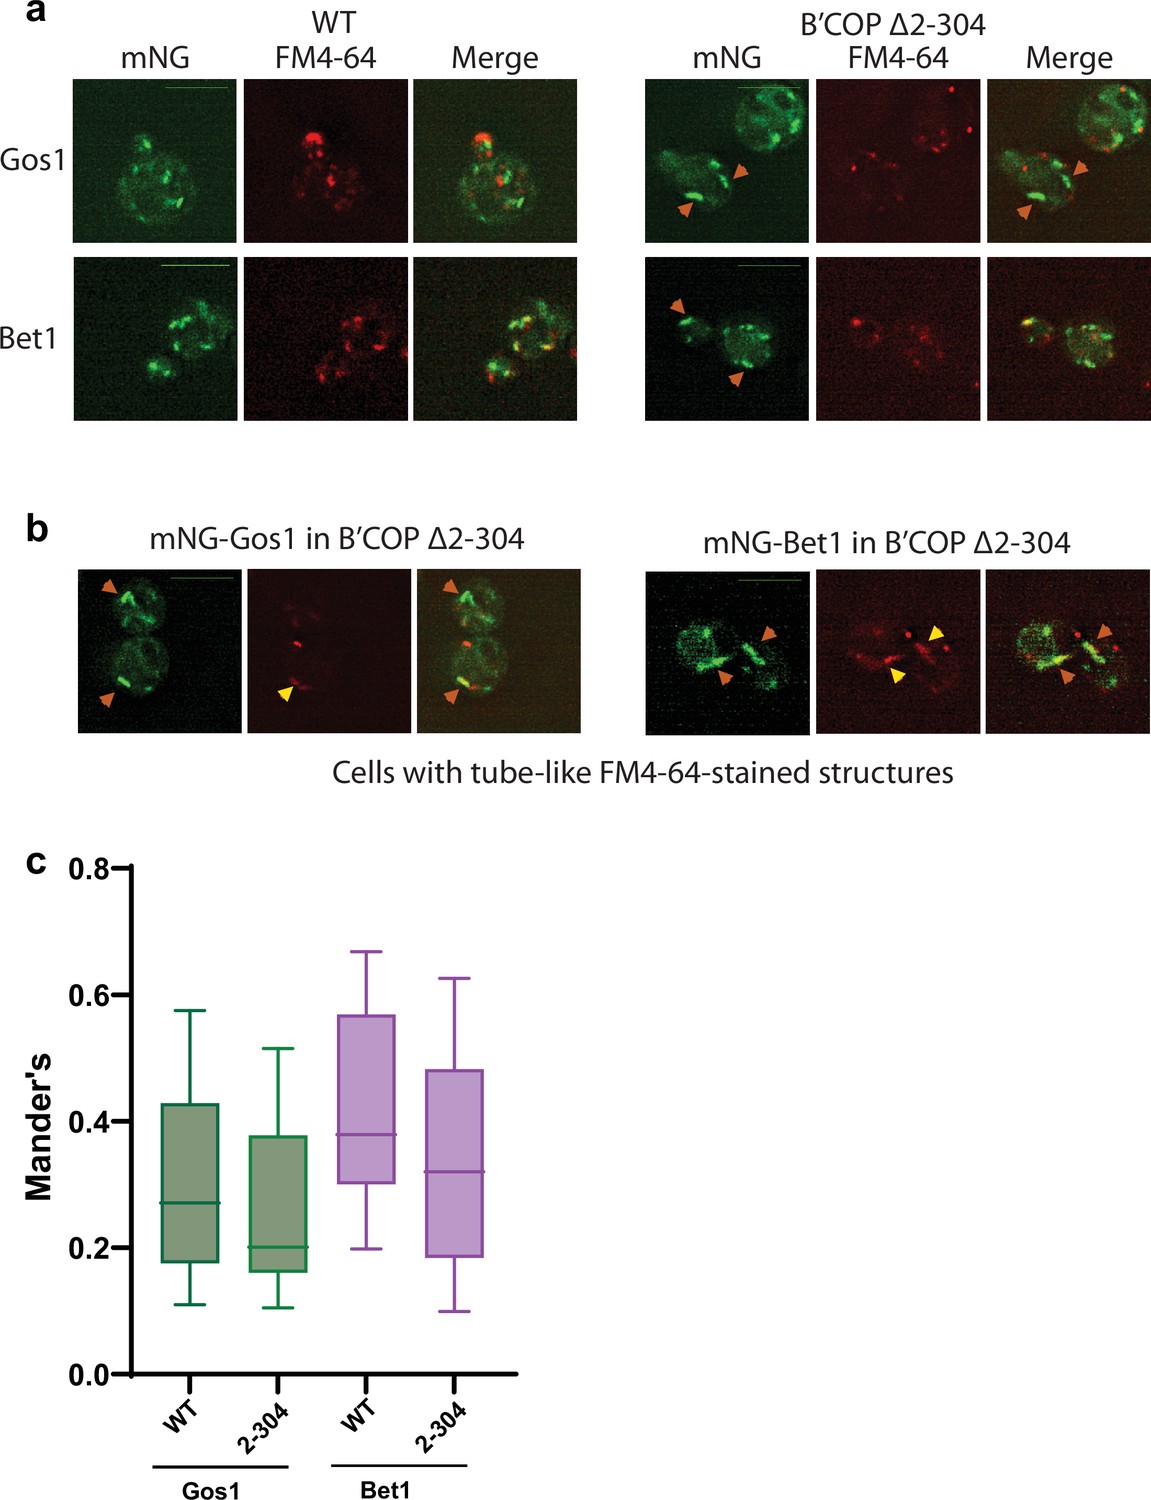
Aberrant structures to which mNG-Gos1 and -Bet1 accumulate in COPI mutant are not predominantly endosomal structures.
(a, c) Colocalization of mNG-Gos1 or Bet1 with FM4-64 stained endosomes is not significantly different in wild-type (WT) or β′-COP Δ2–304 cells, whereas mNG-Gos1 and -Bet1 are seen accumulating in tube- or ring-like structures. (b) A small subset of tube-like mNG-Gos1 and -Bet1 structures are stained with FM4-64 (yellow arrowheads) where the morphology of FM-4-64-positive structures is different between WT and β′-COP Δ2–304 cells. Scale bar represents 5 µm.
Figure 3 with 2 supplements
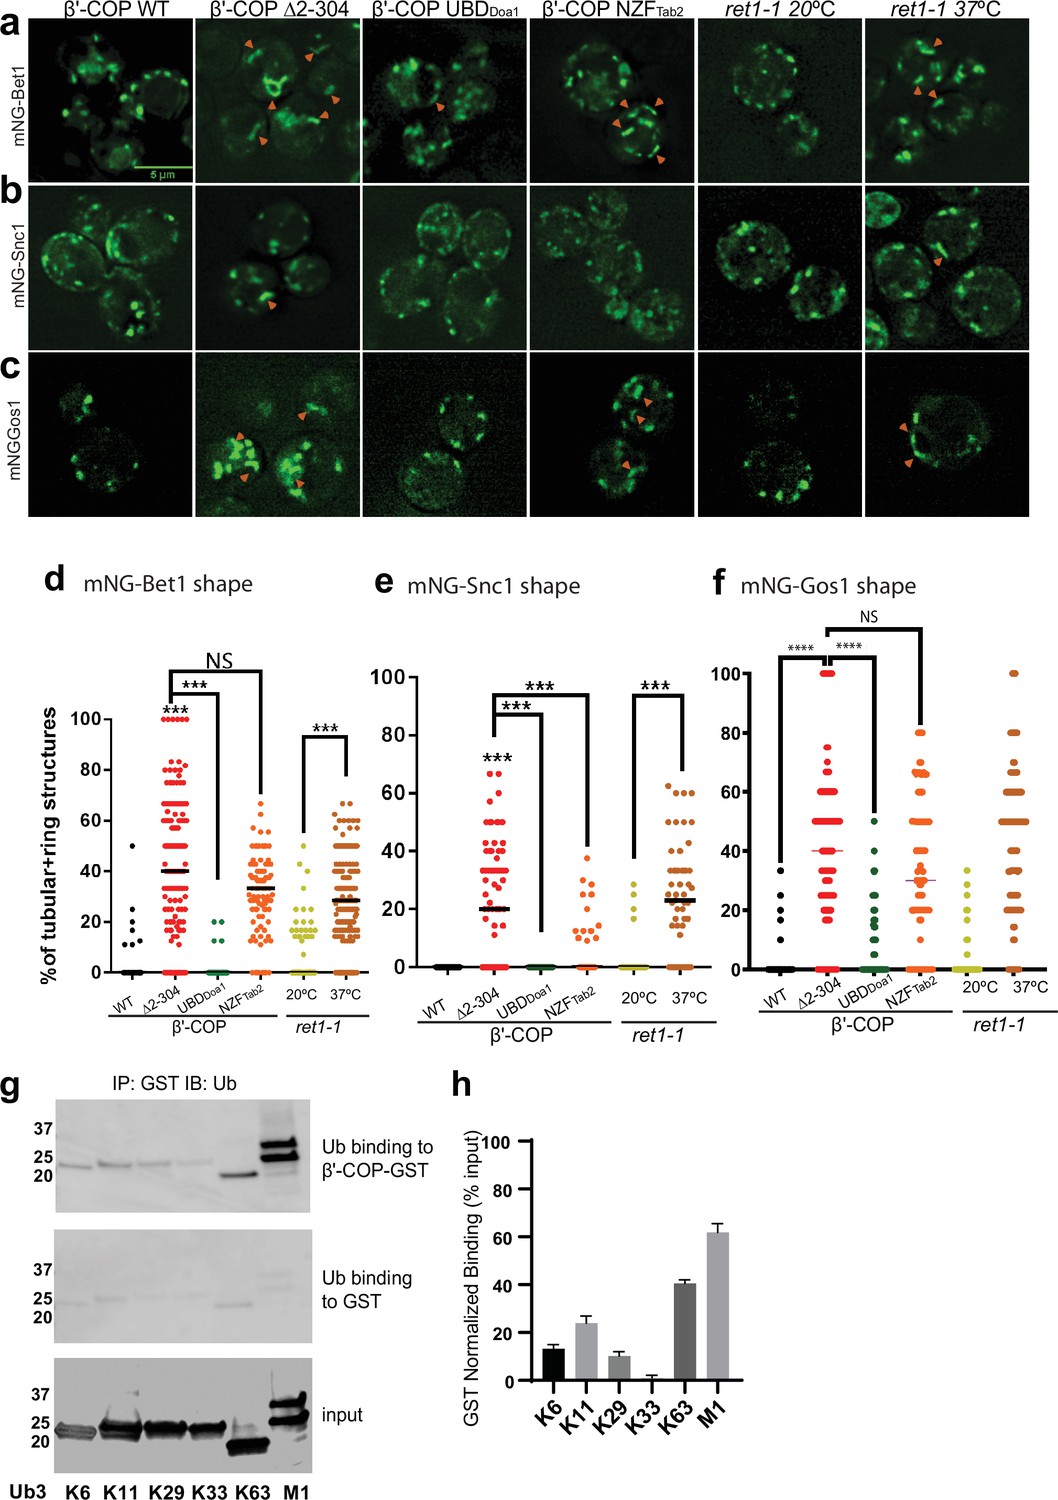
β′-COP binding to ubiquitin is critical for proper SNARE localization.
Deletion of the N-terminal ubiquitin-binding WDR of β′-COP (∆2–304) leads to mislocalization of (a) mNG-Bet1, (b) mNG-Snc1, and (c) mNG-Gos1 into elongated tubular and ring-like structures (orange arrowheads). This phenotype is rescued by the replacement of the N-terminal ubiquitin-binding WDR of β′-COP by the general ubiquitin-binding domain Doa1 (β′-COP UBDDoa1) (Figure 3—figure supplement 1). The replacement of N-terminal UBD of β′-COP with K63-specific UBD, NZFTab2 (β′-COP NZFTab2) rescues the mislocalization phenotype for Snc1 but not for Bet1, Gos1, and Snc2 (Figure 3—figure supplement 2). The mislocalization of Bet1 and Snc1 observed in β′-COP Δ2–304 cells comparable to COPI inactivation phenotype observed for ret1-1 at nonpermissive temperatures. (d–f) Statistical differences were determined using a one-way analysis of variance (ANOVA) on the means of the three biological replicates (****p<0.0001, ***p < 0.001). (g) GST-β′-COP (1–604) binds linear and K63-linked triUb and to some extent to K6, K11, and K29 triUb relative to the GST-only control. 0.5 mM of GST and GST-tagged WDR proteins immobilized glutathione beads were incubated 250 nM Ub3 for corresponding linkages. (h) Quantitation of Ub3 polymers binding (GST-only background subtracted) relative to input. The values represent mean ± standard error of the mean (SEM) from three independent binding experiments. Scale bar represents 5 µm.
Figure 3—figure supplement 1
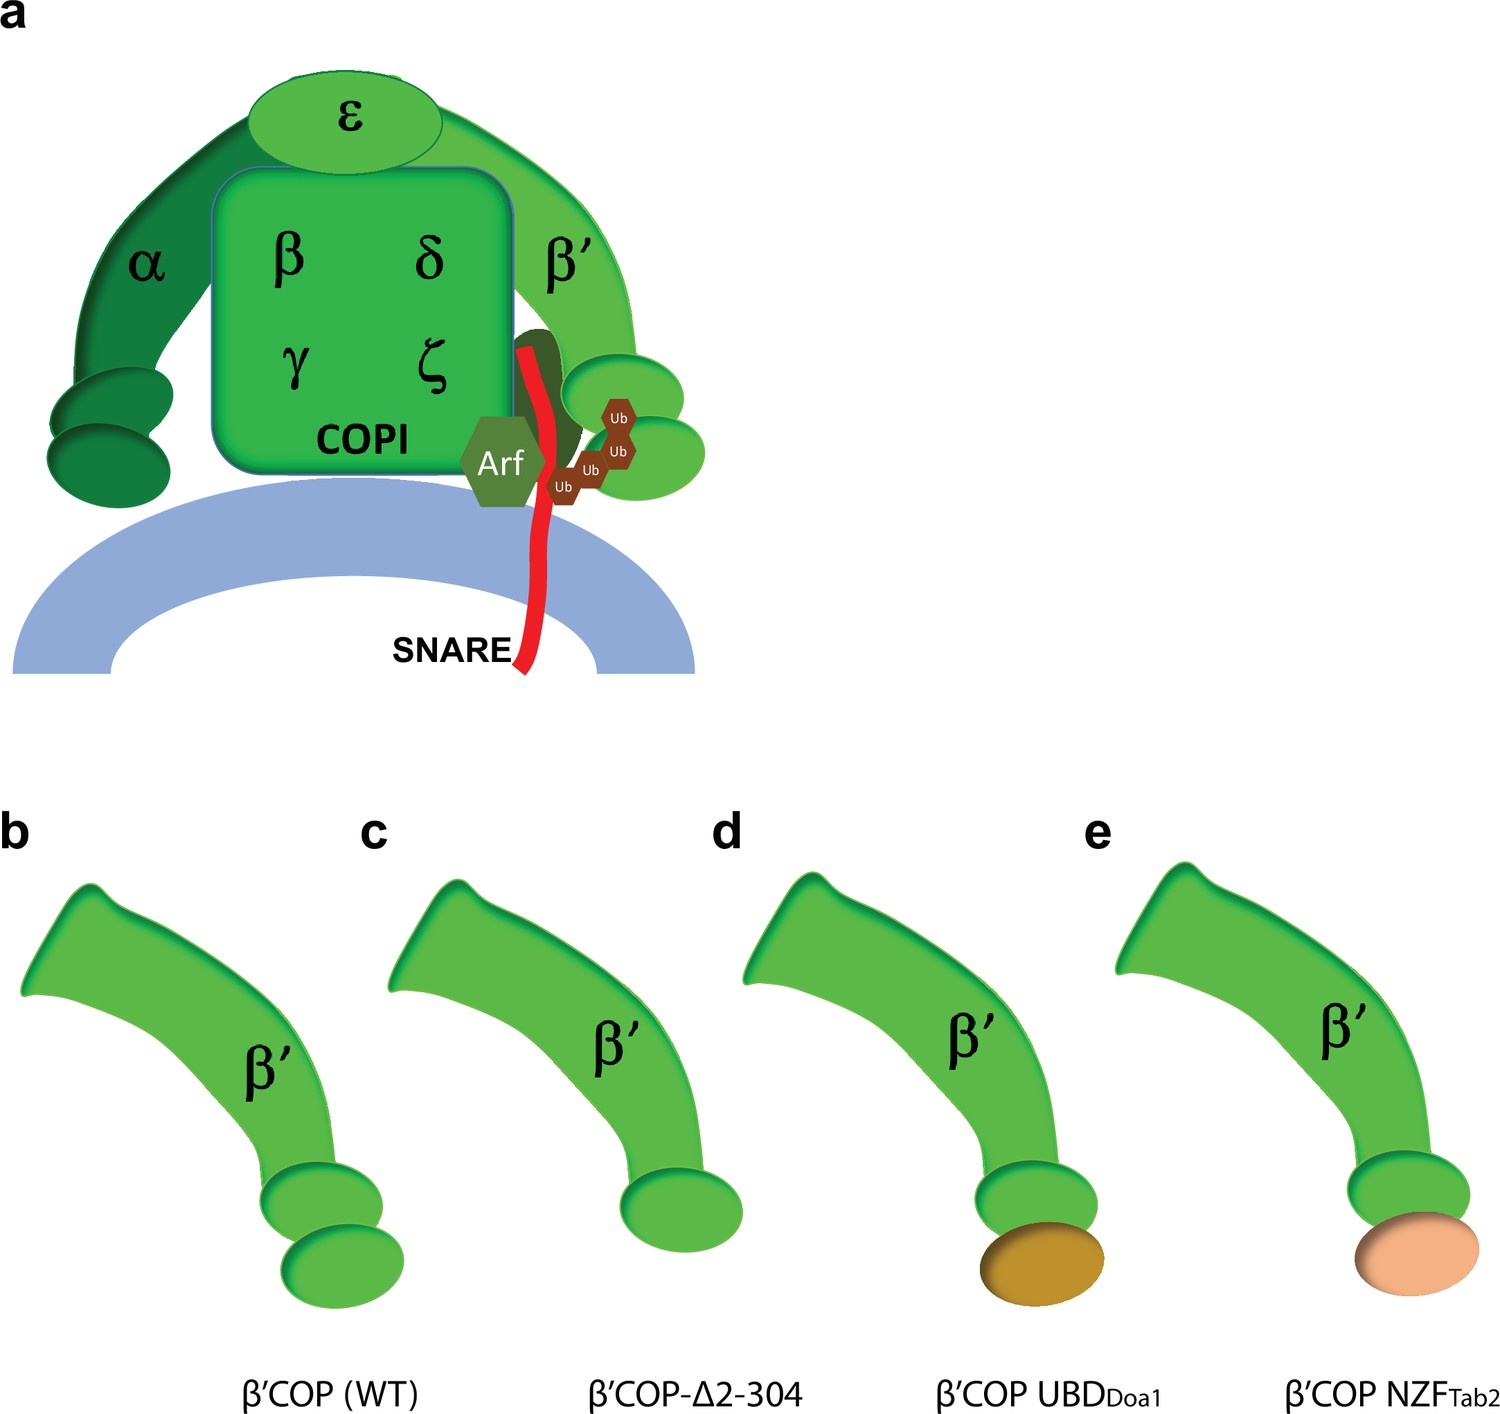
COPI model figure with β′-COP constructs that differ in their ability to recognize and bind ubiquitin linkages.
(a) COPI model figure depicting all COPI subunits, the N-terminal WDR of β′-COP that binds ubiquitin, key components of COPI coat complex including Arf, ArfGAP (dark oval behind the SNARE), and a SNARE (red). (b–e) β′-COP constructs that differ in their ability to recognize and bind polyubiquitin linkages. The N-terminal WDR of β′-COP (b) is deleted to generate β′-COP Δ2–304 (c) or replaced with a general ubiquitin-binding domain from Doa1 that can bind any polyubiquitin linkage (β′-COP UBDDoa1) (d) or the K63-polyUb-specific UBD, NZFTab2 (β′-COP NZFTab2) (e).
Figure 3—figure supplement 2
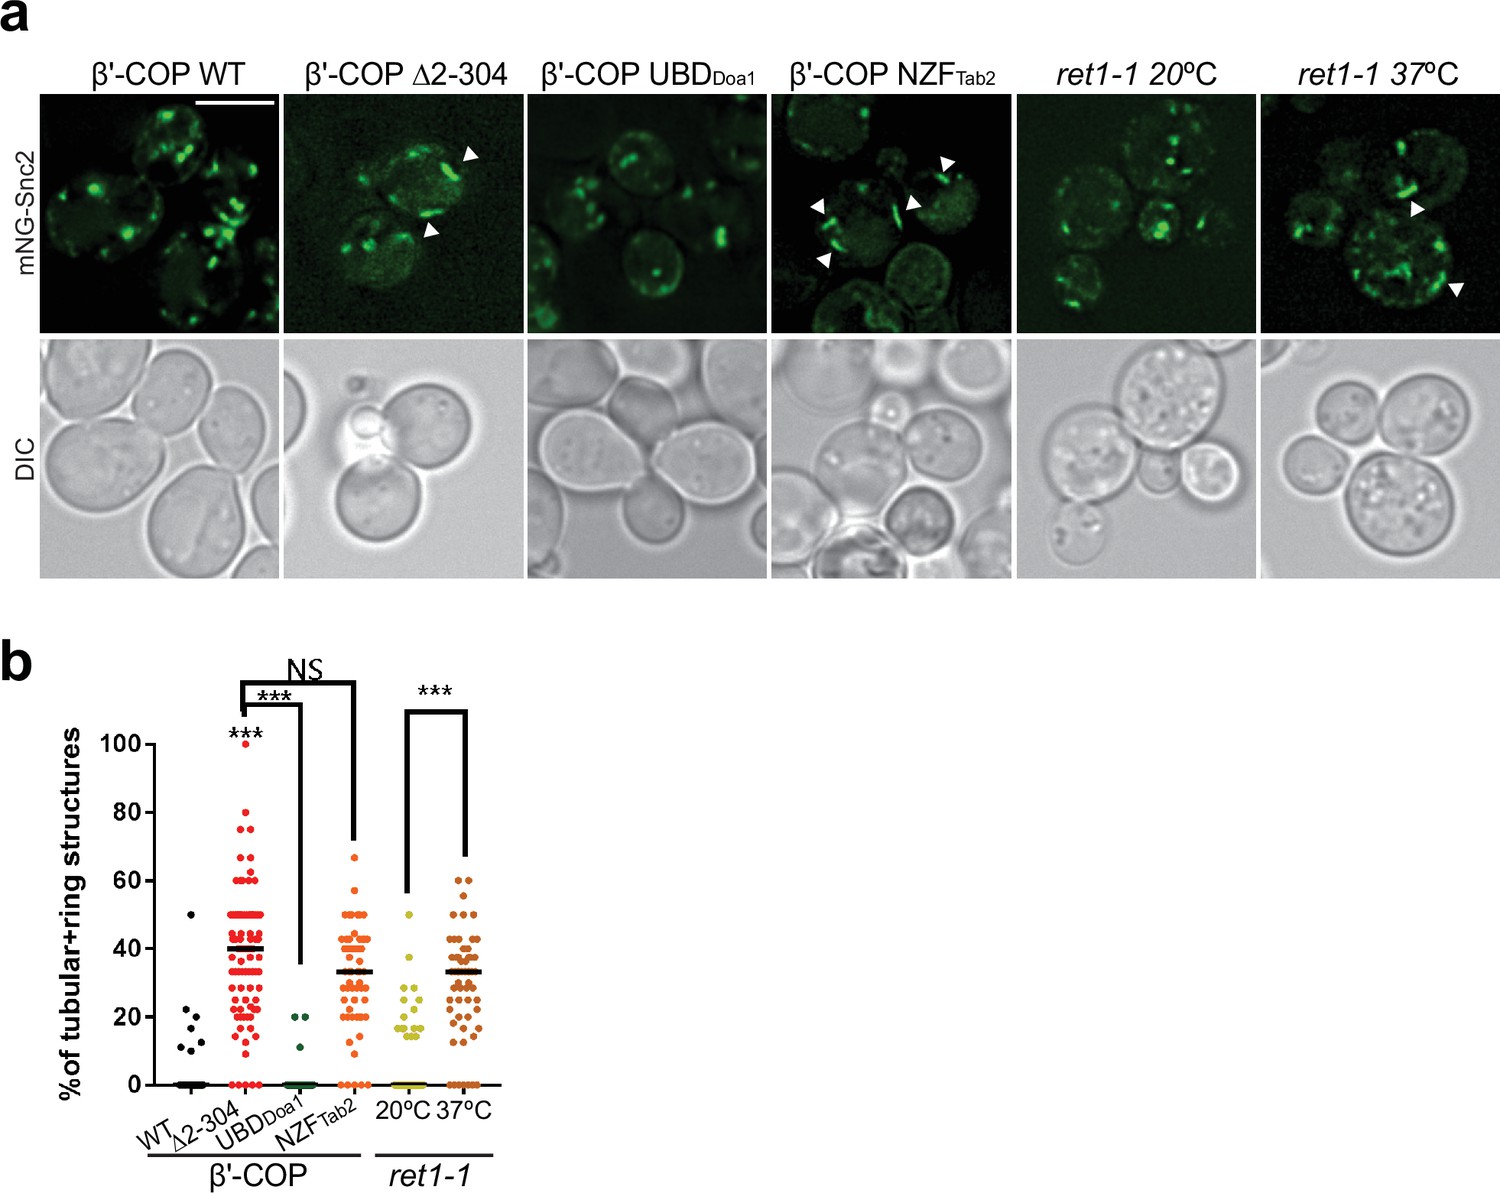
The ability of β′-COP to bind ubiquitin is critical for the proper localization of Snc2.
(a, b) Deletion of the N-terminal ubiquitin-binding WDR of β′-COP leads to accumulation of mNG-Snc2 into elongated tubular and ring-like structures (white arrowheads). This phenotype is rescued by the replacement of the N-terminal ubiquitin-binding WD4R of β′-COP by the general ubiquitin-binding domain Doa1 (β′-COP UBDDoa1) but not when replaced with the K63-specific UBD, NZFTab2 (β′-COP NZFTab2). The mislocalization of Snc2 observed in Δ2–304 cells is comparable to COPI inactivation phenotype observed for ret1-1 at nonpermissive temperatures. Statistical differences were determined using a one-way analysis of variance (ANOVA) on the means of the three biological replicates (***p < 0.001). Scale bar represents 5 µm.
Figure 4

Deubiquitinase fusion to COPI subunits causes SNARE mislocalization.
mNG-tagged Bet1 and Gos1 were imaged in cells in which a deubiquitinase domain (DUB) was fused to the C-terminus of α- and β′-COP to generate αCOP-DUB and β′-COP-DUB, respectively, along with catalytically dead controls αCOP-DUB* and β′-COP-DUB*. (a, b) Cells carrying COPI-DUB fusion were larger in size compared to wild-type (WT) cells as well as catalytically dead controls . (a, c) Significant accumulation of Bet1 and Gos1 in the elongated tube- or ring-like or enlarged punctate structures (orange arrows) was observed in αCOP-DUB and β′-COP-DUB backgrounds compared to corresponding DUB* control or WT cells . Statistical differences were determined using a one-way analysis of variance (ANOVA) on the means of the three biological replicates (****p < 0.0001).
Figure 5 with 2 supplements
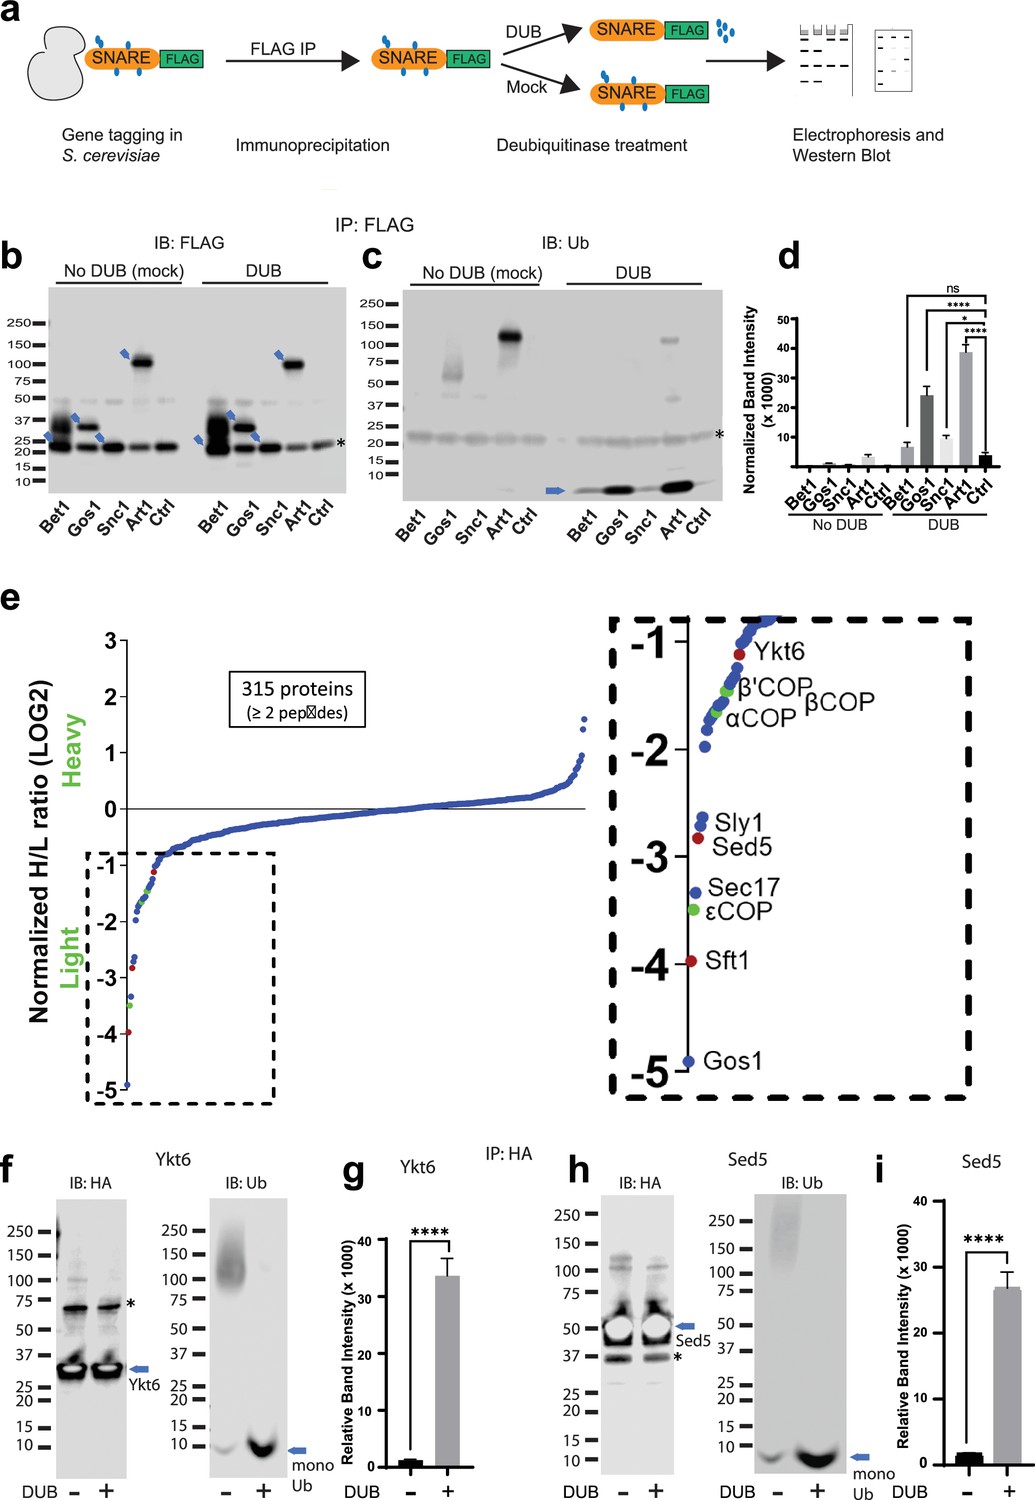
Multiple Golgi SNARE complexes are modified with ubiquitin.
(a) Schematic of the experimental setup wherein SNAREs were individually tagged with FLAG and immunoprecipitated using anti-FLAG beads. Half the samples were mock treated, and the other half was treated with deubiquitinase (DUB). Western blots of samples are probed with FLAG (b) or ubiquitin antibody (c). Blue arrows in (b) indicate the position of FLAG-tagged protein and the asterisk indicates the position of a background band. (d) Quantitation of the amount of monoubiquitin released from the samples by deubiquitinases. (e) SILAC mass spectrometric analysis of Gos1-FLAG pulldown samples indicates enrichment of SNAREs Sft1, Ykt6, and Sed5 (red dots) and COPI subunits (green dots) with Gos1 . (f–i) Western blot analysis showing HA-tagged Ykt6, and Sed5 probed for ubiquitination following HA immunoprecipitation and deubiquitinase treatment. (g, i) Quantitation of monoubiquitin. Statistical differences were determined using a one-way analysis of variance (ANOVA) with multiple comparison test on three biological replicates (****p ≤ 0.0001, *p < 0.05, Ns p > 0.05).
Figure 5—figure supplement 1
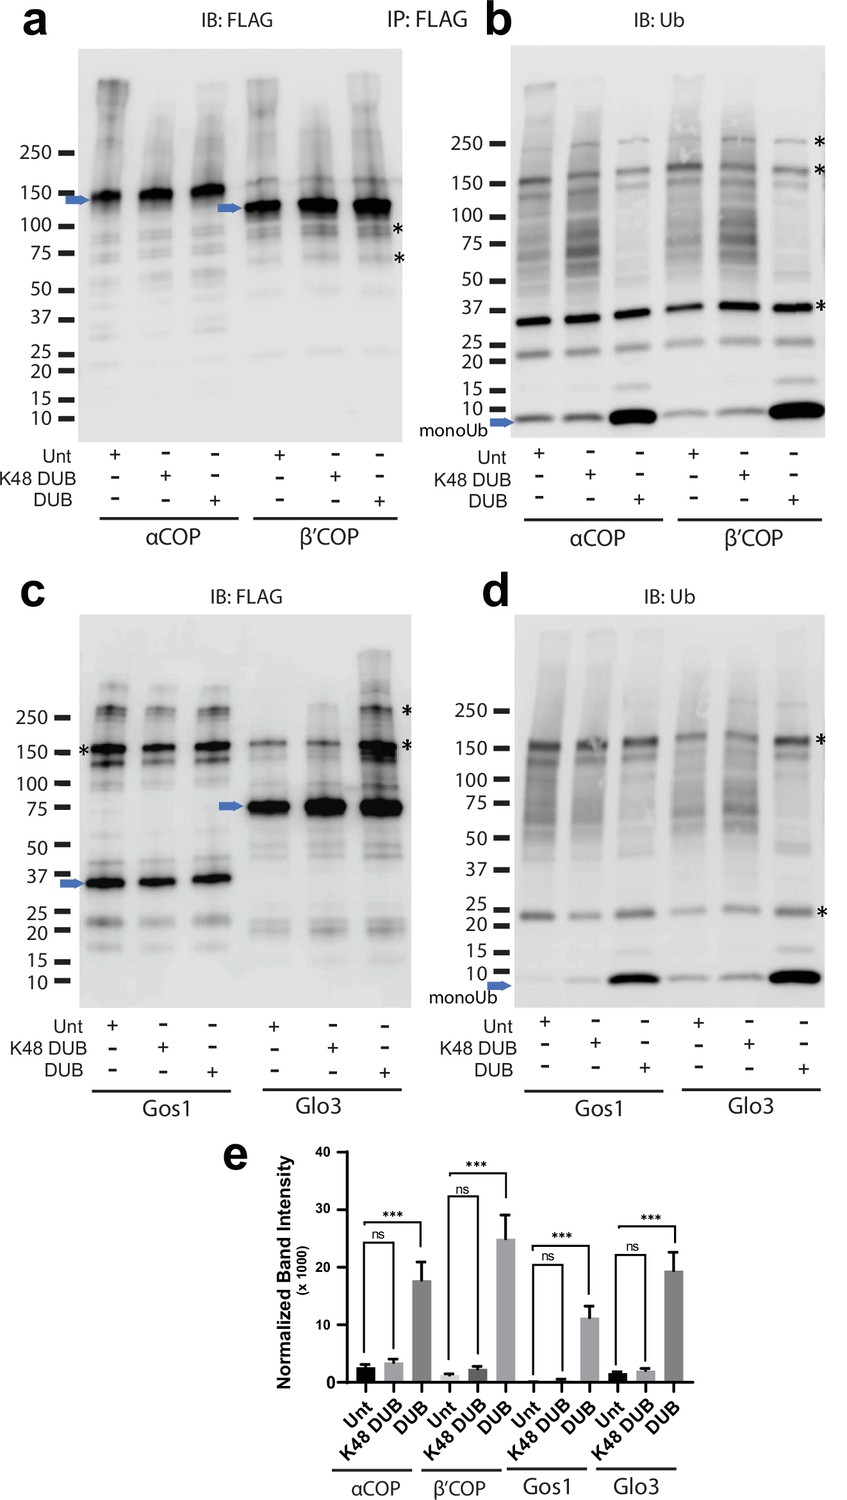
Ubiquitination associated with COPI, Gos1, and Glo3 is non-K48 linked.
Western blot data wherein – FLAG-tagged α-COP or β′-COP, Gos1, and Glo3 were immunoprecipitated and treated with a general deubiquitinase (DUB), a K48-specific deubiquitinases (K48-DUB) or mock treated (Unt) and probed with (a, c) FLAG or (b, d) ubiquitin antibody. (b, d) No significant release of ubiquitin is observed following the K48-DUB treatment. Blue arrows indicate the position of the FLAG-tagged protein and the asterisks indicate the position of prominent background bands. (e) Statistical differences were determined using a one-way analysis of variance (ANOVA) with multiple comparison test on the means of the three biological replicates (***p < 0.001, NS p > 0.05).
Figure 5—figure supplement 2
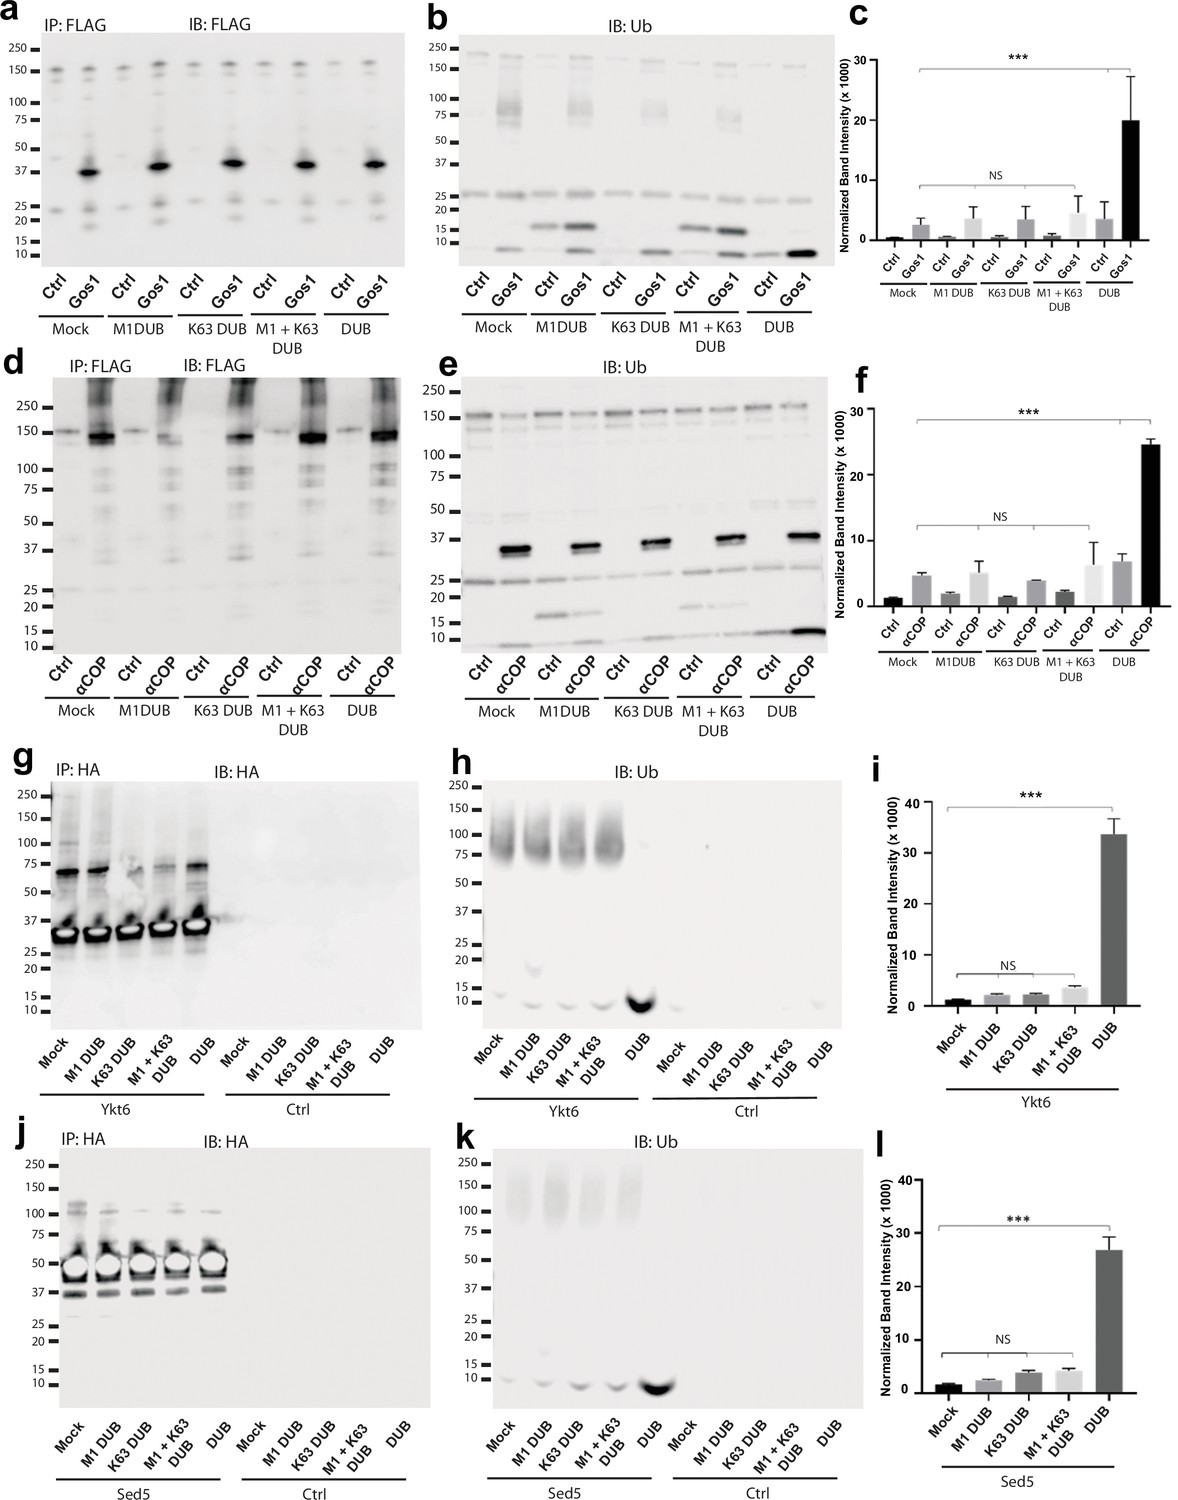
Ubiquitin associated with Gos1, α-COP, Ykt6, and Sed5 is not K63- or M1-linked polyubiquitin.
Western blot analysis for FLAG-tagged Gos1 and α-COP, and HA-tagged Ykt6 and Sed5 or untagged cells (Ctrl) following immunoprecipitation, treatment with mock buffer (no DUB), linkage-specific deubiquitinases (K63 DUB, M1 DUB, or M1 + K63 DUB) or with general deubiquitinase (DUB). Western blots were probed with with (a, d) FLAG or (g, j) HA antibody and (b, e, h, k) ubiquitin antibodies. Blots probed with FLAG or HA antibody show equal amount of corresponding bait recovered under different conditions.The treatment of immunoprecipitated samples with general deubiquitinases leads to significant release of monoubiquitin from Gos1, α-COP, Ykt6, and Sed5 but no significant release of monoubiquitin is observed when treated with linkage-specific K63-DUB, M1-DUB, or the K63 + M1 DUB combination (b–c, e–f, h–i, k–l). Statistical differences were determined using a one-way analysis of variance (ANOVA) with multiple comparison test on three biological replicates ( ***p < 0.001, Ns p > 0.05).
Figure 6 with 1 supplement
Ubiquitin modification stabilizes a priming complex between COPI, Arf, and SNAREs.
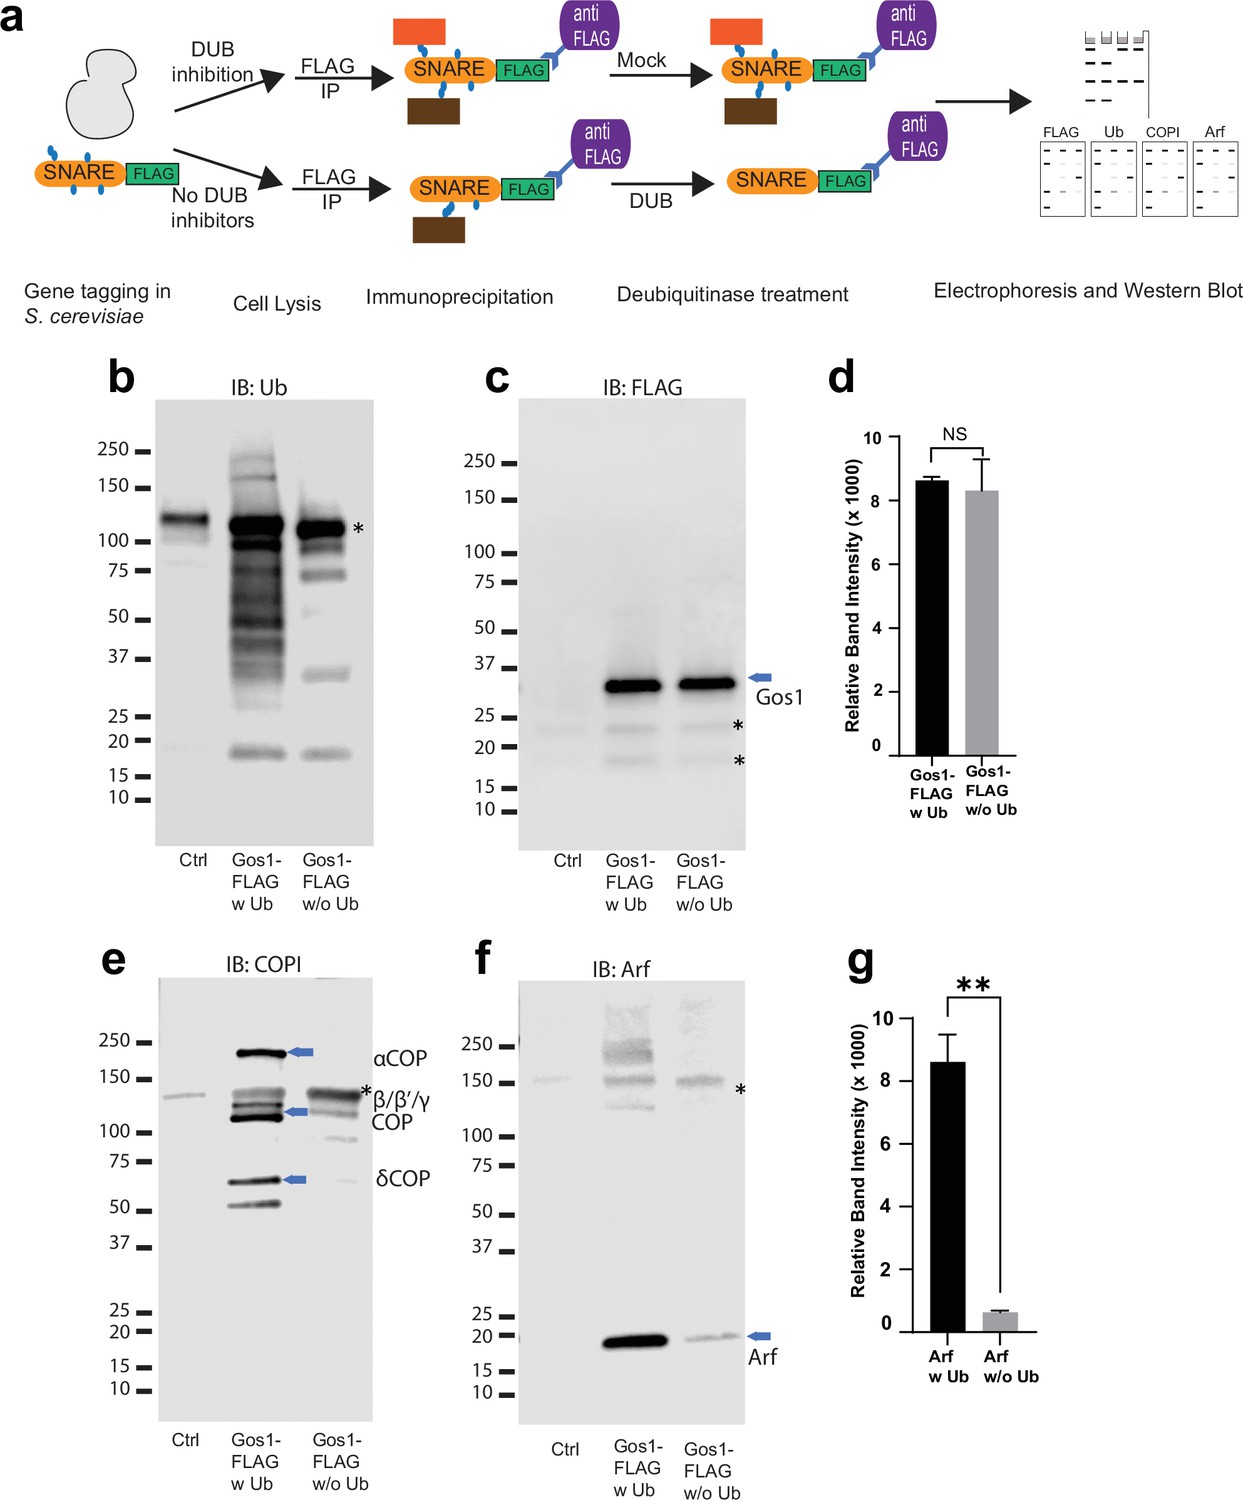
(a) Schematic of the experimental setup wherein FLAG-tagged SNAREs are divided into two equal portions, and one is processed under ‘w Ub’ conditions (DUB inhibitors used during the lysis step and no deubiquitinases [mock] treatment) and the other portion is processed under ‘w/o Ub’ condition (no deubiquitinase inhibitors used during lysis and immunoprecipitated samples are treated with deubiquitinases). (b–g) Western blot data showing comparative pulldowns of Gos1-FLAG (b–f) and Bet1-FLAG (Figure 6—figure supplement 1) processed under ‘ubiquitin-preserved’ (w Ub) and ‘no-ubiquitin’ (w/o Ub) condition, and probed for Ub (b), FLAG (c), COPI (e), and Arf (f). Untagged cells processed under ‘w UB’ condition to determine background binding were used as a control (Cntr) and abundant background bands are marked with an asterisk. Quantitation of Gos1-FLAG (d) and Arf (g) in the pulldown samples. Band intensities are measured using ImageJ. Quantitation was done on three biological replicates using a t-test (**p < 0.01, Ns p > 0.05).
Figure 6—figure supplement 1
Ubiquitin-mediated enhancement of COPI and Arf Bet1.
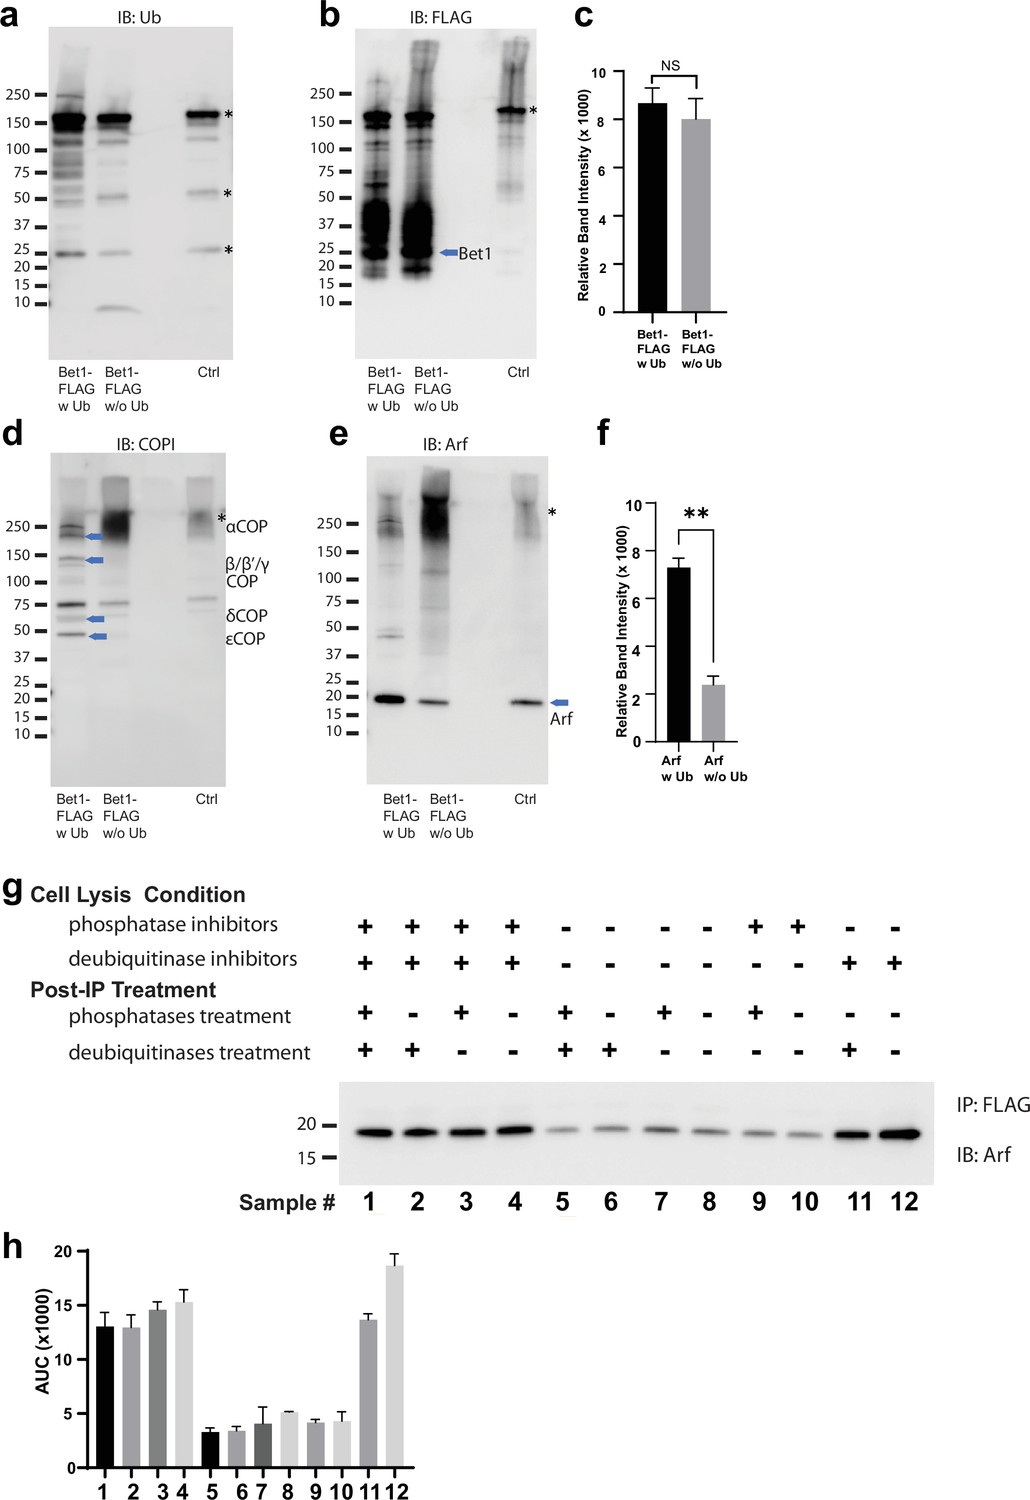
Western blot data showing comparative pulldowns of Bet1-FLAG (a–f) processed under ‘ubiquitin-preserved’ (w Ub) and ‘no-ubiquitin’ (w/o Ub) condition, and probed for Ub (a), FLAG (b), COPI (d), and Arf (e). Untagged cells processed under ‘w UB’ condition to determine background binding were used as a control (Cntr) and abundant background bands are marked with an asterisk. Quantitation of Bet1-FLAG (c) and Arf (f) in the pulldown samples. Band intensities are measured using ImageJ. Quantitation was done on three biological replicates using a t-test (**p < 0.01, Ns p > 0.05). (g-h) Western blot data for Arf enriched with Gos1-FLAG under various combinations of cell lysis conditions to either preserve or not preserve ubiquitination and/or phosphorylation and to strip off ubiquitin and/or phosphorylation by post-immunoprecipitation (post-IP) treatments as indicated. Cell lysis in the presence of deubiquitinase and phosphatase inhibitors is expected to preserve ubiquitin- and phosphorylation-mediated complexes. Cell lysis in the presence of just deubiquitinase or phosphatase inhibitors is expected to preserve only ubiquitin- or phosphorylation-mediated complexes. Cell lysis in the absence of both deubiquitinase and phosphatase inhibitors in expected to not preserve ubiquitin- or phosphorylation-mediated complexes. Post-IP deubiquitination (with USP2, AMSH, and Otulin) and/or dephosphorylation (with Lambda phosphatase) are expected to strip off any preserved or remaining ubiquitination and phosphorylation, respectively, from the immunoprecipitated samples. Band intensities were measured using ImageJ and quantitation was done on three biological replicates.
Figure 7
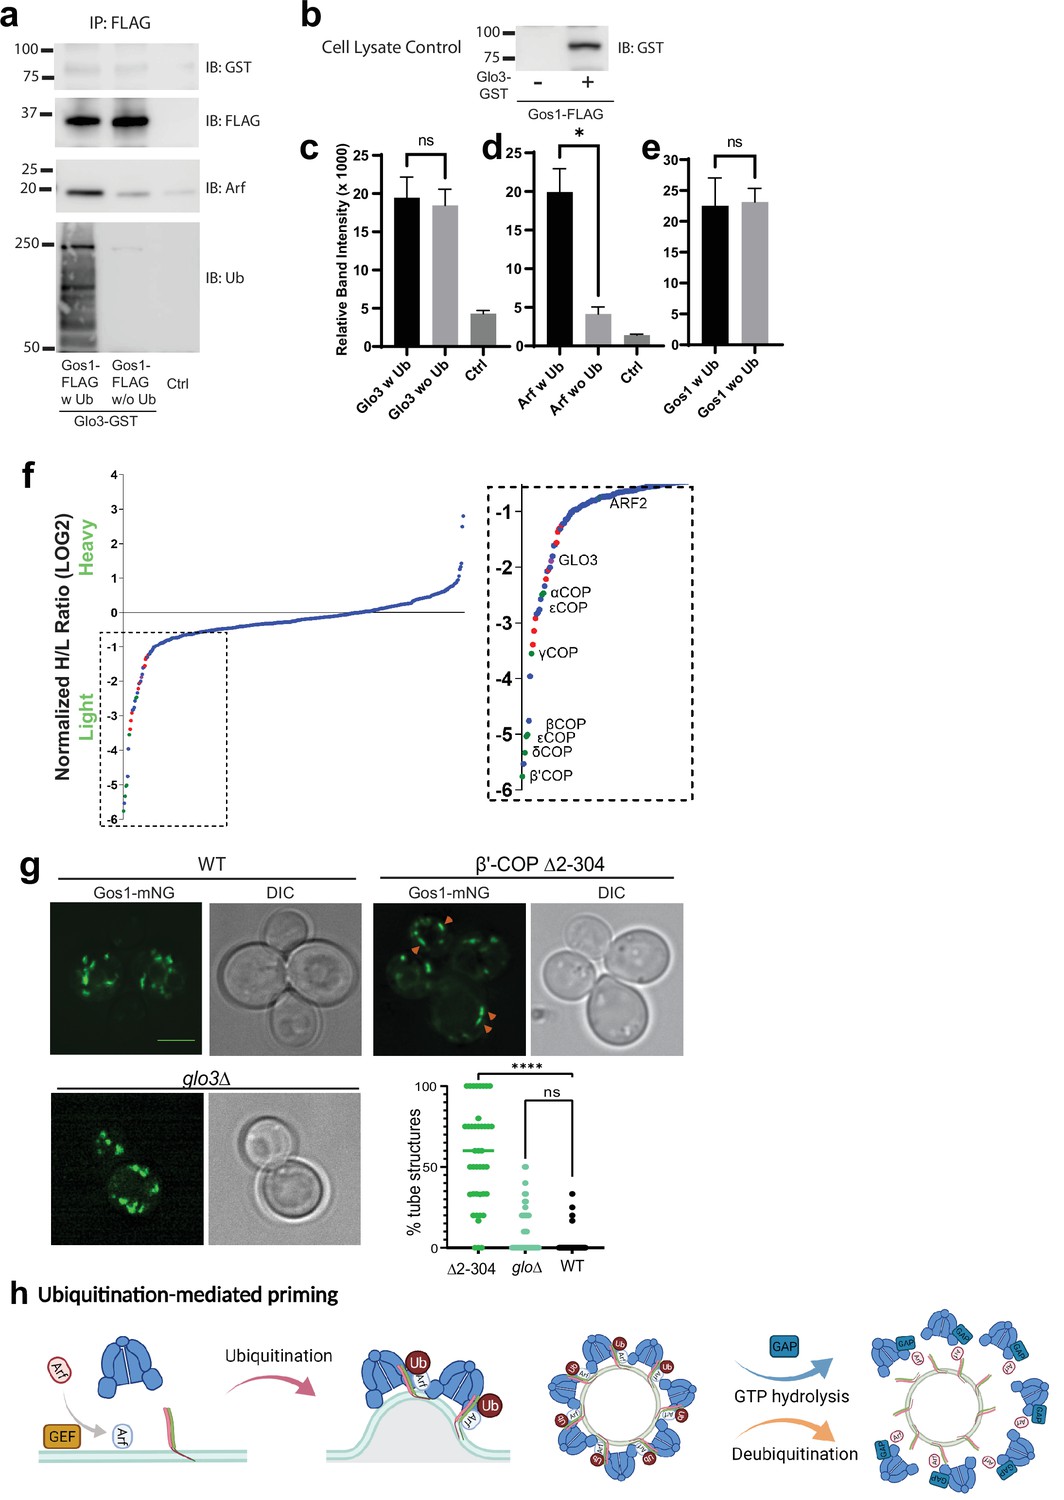
ArfGAP is not enriched in ubiquitin-stabilized SNARE–Coat complexes and is not required for Gos1 localization.
(a–e) Western blot data showing comparative pulldowns of Gos1-FLAG from cells expressing FLAG-tagged Gos1 and GST-tagged Glo3. Samples were processed under ‘ubiquitin-preserved’ (w Ub) and ‘no-ubiquitin’ (w/o Ub) condition, and probed for Glo3 (anti-GST), Gos1 (anti-FLAG), Arf, and Ub. Untagged cells processed under ‘w UB’ condition to determine background binding were used as a control (Ctrl). Cell lysates from cells expressing only FLAG-tagged Gos1 or both FLAG-tagged Gos1 and GST-tagged Glo3 probed with anti-GST antibody are included as controls to ensure expression of GST-tagged Glo3. Quantitation of (c) Glo3-GST, (d) Arf, and (e) Gos1-FLAG samples. Band intensities are measured using ImageJ. Quantitation was done on three biological replicates using a t-test (*p < 0.05, Ns p > 0.05). (f) SILAC mass spectrometric analysis of αCOP-FLAG pulldown samples indicate the enrichment of other COPI subunits (green dots), ArfGAP Glo3 (purple dots), and dilysine COPI cargo (red dots) but no SNAREs . (g) Live cell imaging of mNG-Gos1 in wild-type (WT), β′-COP Δ2–304 and glo3∆ cells. Quantification of % tube structures for each strain was from three biological replicates with 60 or more cells analyzed for each sample . Statistical differences were determined using a one-way analysis of variance (ANOVA) on the means of the three biological replicates (****p < 0.0001). Scale bar represents 5 µm. (h) Model showing ubiquitination-mediated priming of a SNARE–Arf–COPI complex. Glo3 is recruited at later stages after vesicle budding leading to hydrolysis of Arf-GTP and disassociation of COPI complex.
Author response image 1
Author response image 2

Additional files
-
MDAR checklist
- https://cdn.elifesciences.org/articles/80911/elife-80911-mdarchecklist1-v2.docx
-
Supplementary file 1
Saccharomyces cerevisiae SNAREs used in this study.
- https://cdn.elifesciences.org/articles/80911/elife-80911-supp1-v2.xlsx
-
Supplementary file 2
List of strains used in this study.
- https://cdn.elifesciences.org/articles/80911/elife-80911-supp2-v2.xlsx
-
Supplementary file 3
List of plasmids used in this study.
- https://cdn.elifesciences.org/articles/80911/elife-80911-supp3-v2.xlsx
-
Supplementary file 4
SILAC top 50 hits based on normalized H/L ratio for Gos1.
- https://cdn.elifesciences.org/articles/80911/elife-80911-supp4-v2.xlsx
-
Supplementary file 5
SILAC top 50 hits based on normalized H/L ratio for αCOP.
- https://cdn.elifesciences.org/articles/80911/elife-80911-supp5-v2.xlsx
-
Source data 1
- https://cdn.elifesciences.org/articles/80911/elife-80911-data1-v2.zip
Download links
A two-part list of links to download the article, or parts of the article, in various formats.
Downloads (link to download the article as PDF)
Open citations (links to open the citations from this article in various online reference manager services)
Cite this article (links to download the citations from this article in formats compatible with various reference manager tools)
Ubiquitination drives COPI priming and Golgi SNARE localization
eLife 11:e80911.
https://doi.org/10.7554/eLife.80911


