A remarkable adaptive paradigm of heart performance and protection emerges in response to marked cardiac-specific overexpression of ADCY8
- Laboratory of Cardiovascular Science, National Institute on Aging, National Institutes of Health, United States
- Translational Gerontology Branch, Intramural Research Program, National Institute on Aging, National Institutes of Health, United States
- Division of Cardiology, Department of Medicine, Johns Hopkins University School of Medicine, United States
- Section on Medical Neuroendocrinology, Eunice Kennedy Shriver National Institute of Child Health and Human Development, National Institutes of Health, United States
- Kraennert Institute of Cardiology, Indiana University School of Medicine, United States
Figures
Figure 1 with 1 supplement
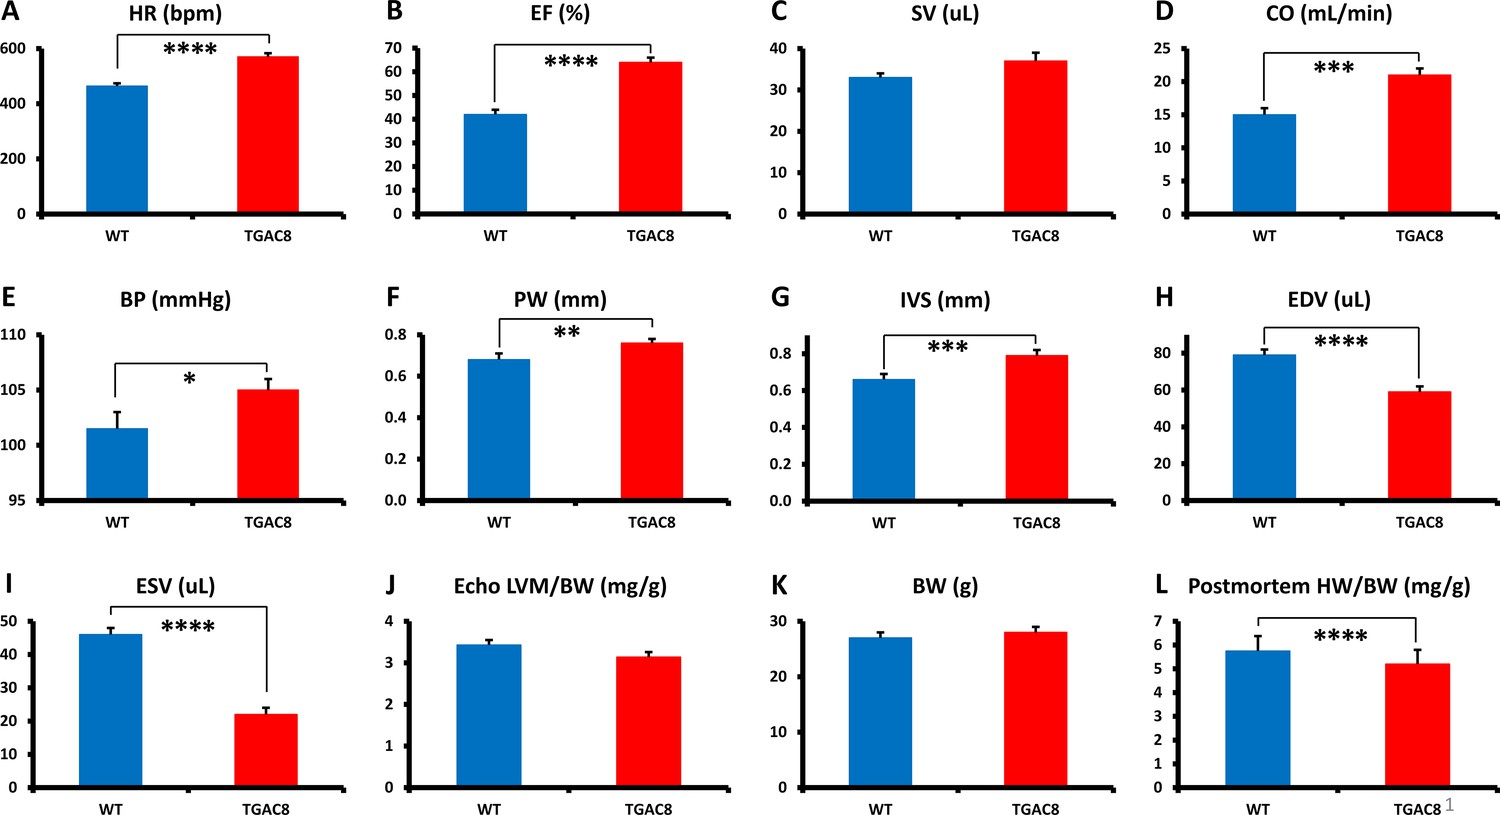
Echocardiographic parameters and body weight of TGAC8 and WT mice.
(A–K), Echocardiographic parameters (N=28 for TGAC8; WT = 21); (L) heart weight/body weight at sacrifice (N=75 for TGAC8 and N=85 for WT). See Supplementary file 1a for additional Echo parameters. Data are presented as Mean± SEM. The statistical significance is indicated by * p<0.05, ** p<0.01, **** p<0.0001 (t test).
Figure 1—figure supplement 1
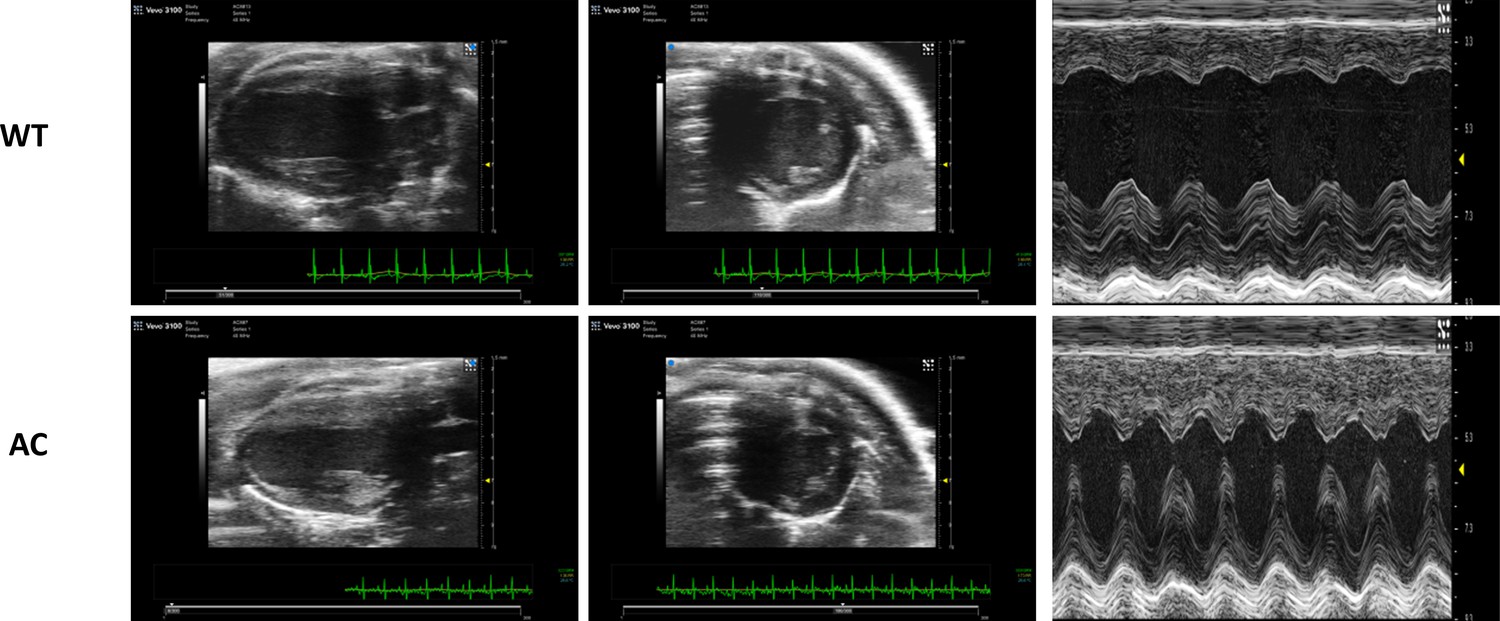
Representative images of echocardiograms.
Figure 2 with 1 supplement
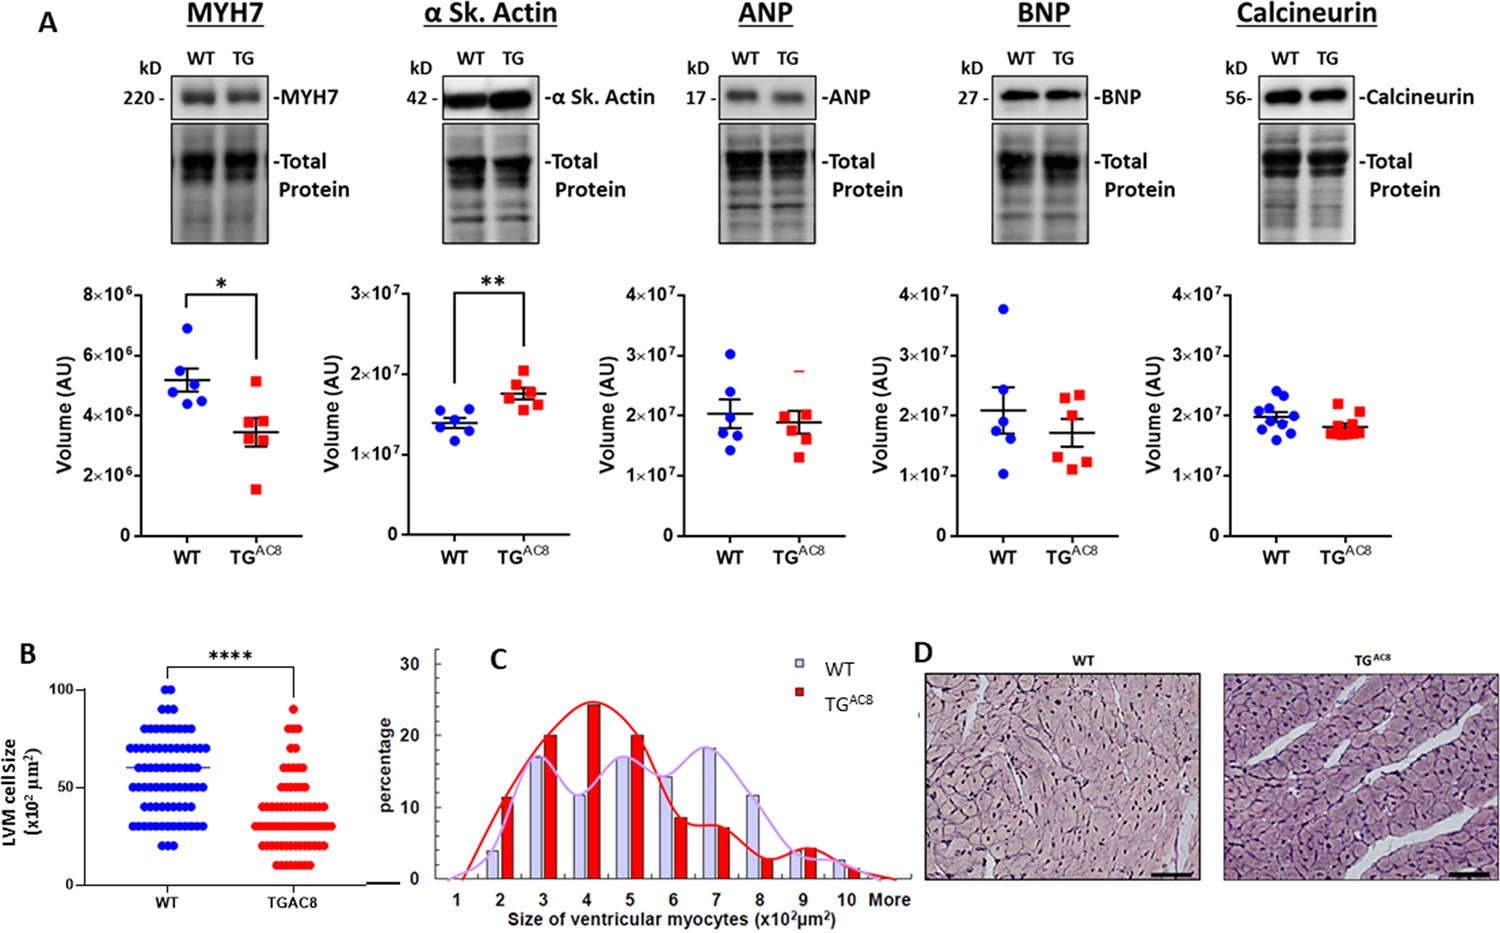
Expression of pathologic hypertrophy markers and cardiac myocyte sizes in LV of TGAC8 and WT mice.
(A) WB of Pathologic hypertrophy markers, (B, C) cardiac myocyte cross-sectional areas and distributions of cardiac myocyte sizes in TGAC8 and WT hearts (cardiomyocytes were counted on left free wall at the middle level sections from four animals in each group; 37 high power fields from WT mice and 33 high power fields from TGAC8 mice; 77 cells from WT mice and 70 cells from TGAC8 mice were analyzed) Data are presented as Mean± SEM. The statistical significance is indicated by * p<0.05, ** p<0.01, (two-tailed t test)., (D) Representative LV sections depicting cardiac myocyte diameters (scale bar 100 µm).
-
Figure 2—source data 1
Raw unedited blot images and uncropped blot images of MYH7, α Sk.
Actin, ANP, BNP, and Calcineurin.
- https://cdn.elifesciences.org/articles/80949/elife-80949-fig2-data1-v2.zip
Figure 2—figure supplement 1
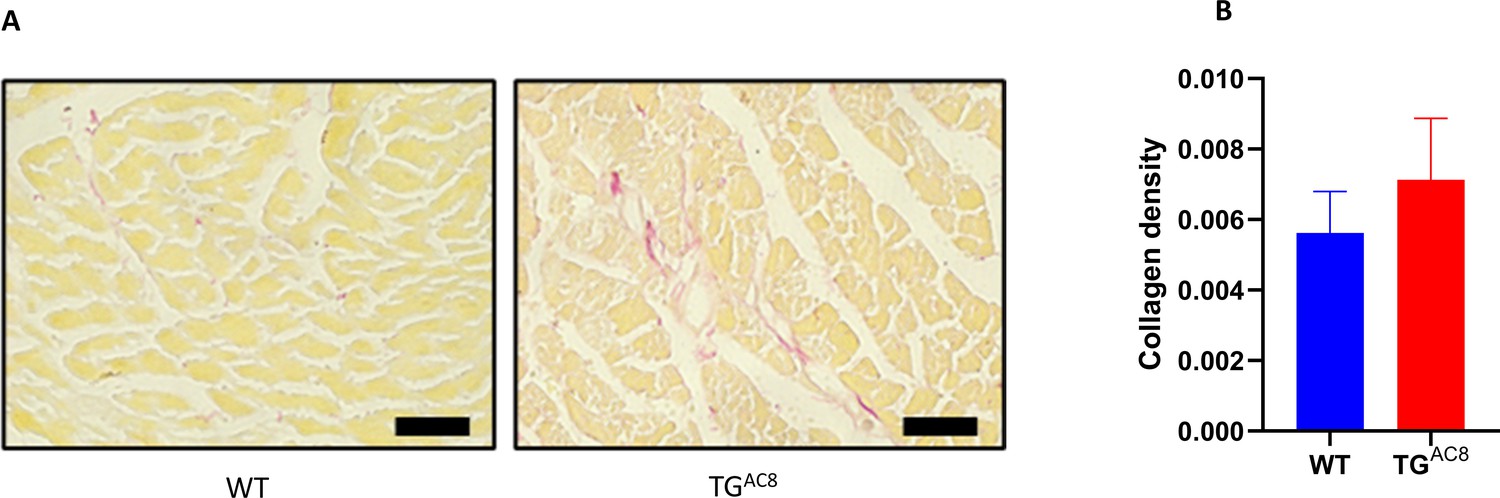
Representative LV sections, labeled with picrosirius red (A) and (B) average collagen density (picrosirius red labeling) in TGAC8 vs WT LV.
Scale bar 100 µm. N=37 high power fields of left free wall at the middle level from four WT mice. N=33 high power fields of left free wall at the middle level from four TGAC8 mice. Data are presented as Mean± SEM.
Figure 3
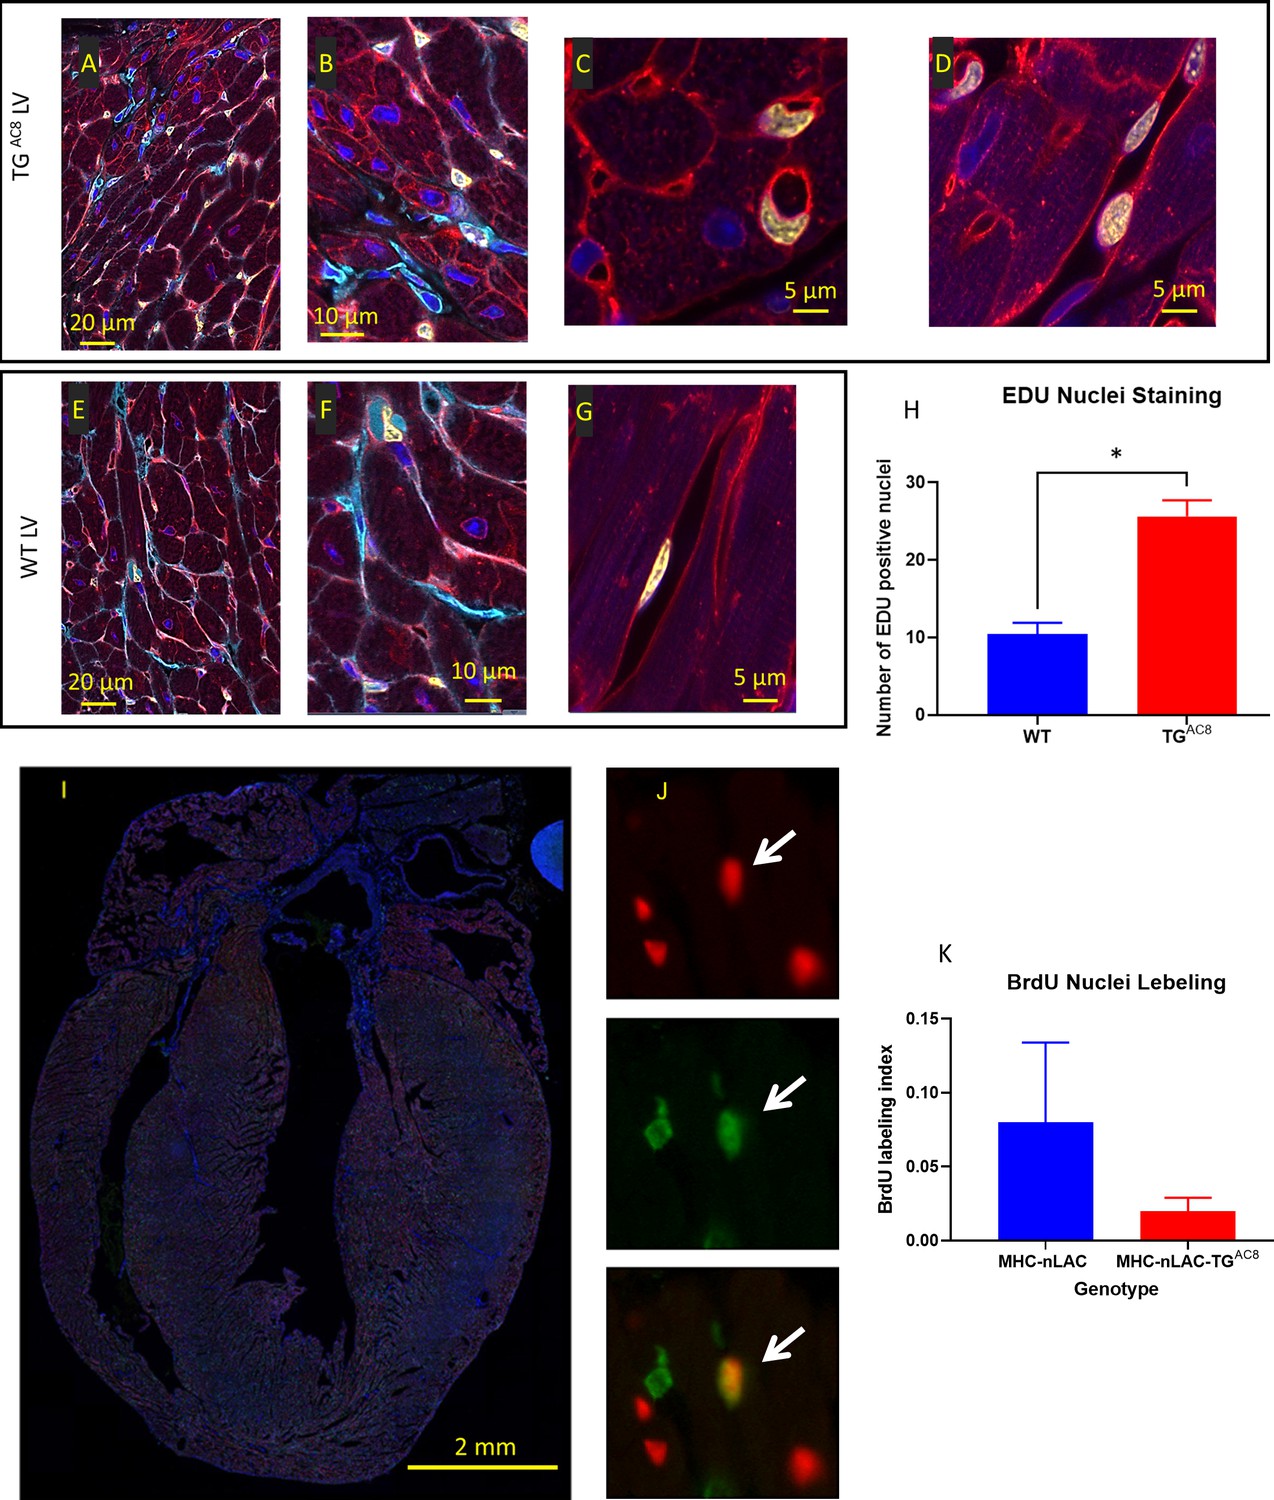
EdU labeling of cardiac tissue.
(A–G) representative examples of confocal images (400 x) of LV WGA (red), vimentin (Cyan), EdU (yellow), DAPI (blue), (H) average number of EdU-labeled nuclei positive field counts in LV TGAC8 vs WT (N=3 mice in each genotype). Data are presented as Mean± SEM. The statistical significance is indicated by * p<0.05, (t test). Detection of cardiomyocyte S-phase activity. (I) Section from the heart of a TGAC8, MHC-nLAC double-transgenic mouse subjected to 12 days of BrdU treatment. The section was processed for β-galactosidase (to identify cardiomyocyte nuclei, red signal) and BrdU (to identify DNA synthesis, green signal) immune reactivity, and then counterstained with Hoechst (which stains all nuclei, blue signal). (J) Example of an S-phase cardiomyocyte nucleus detected with this assay. The upper panel shows β-galactosidase immune reactivity (red channel), the middle panel shows BrdU immune reactivity (green channel), and the lower panel shows a red and green color combined image of the same field. The arrow identifies an S-phase cardiomyocyte nucleus, as evidenced by the overlay of β-galactosidase and BrdU immune reactivity, which appears yellow in the color combined image. (H) Graph representing S-phase activity in the TGAC8, MHC-nLAC double-transgenic vs. the MHC-nLAC single transgenic animals (mean +/- SEM, p=0.315; 5 mice per genotype and 3 sections per mouse were analyzed).
Figure 4
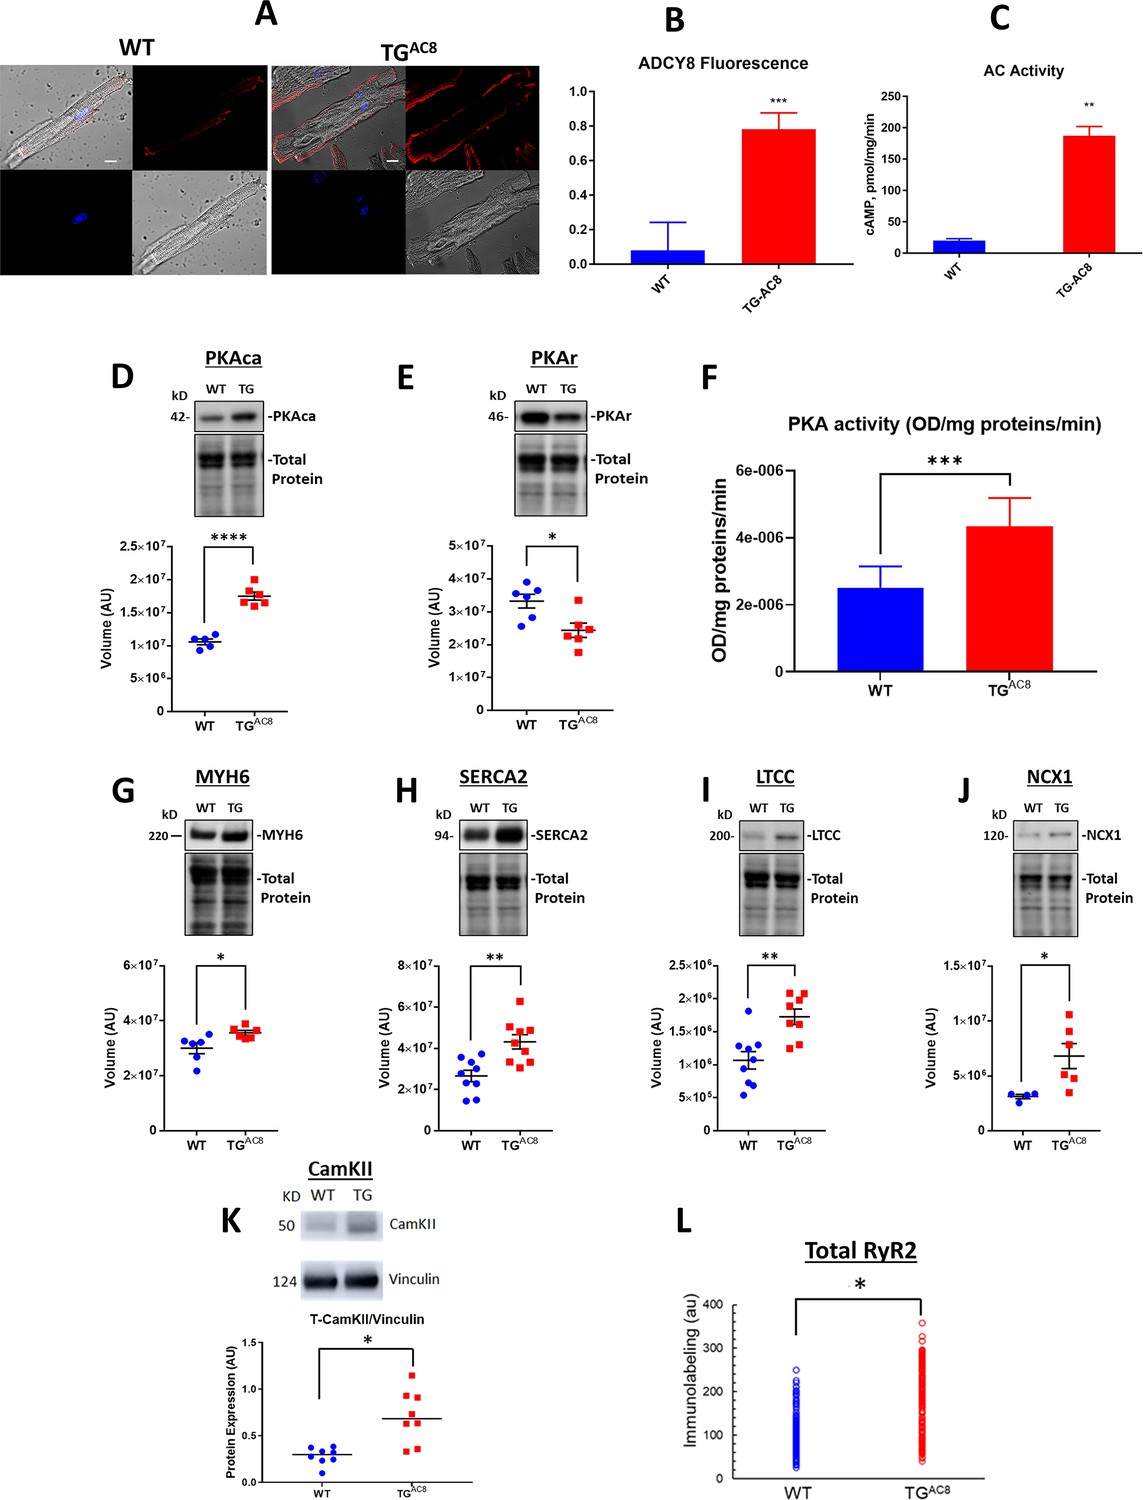
Expression of molecules involved in AC/cAMP/PKA/Ca2+ signaling in LV of TGAC8 and WT mice.
(A) Representative examples of ADCY8 immunolabeling in TGAC8 and WT LV cardiomyocytes (scale bar 10 µm), (B) Average AC8 fluorescence in LV cardiomyocytes (N=3 animals per group; 60 cells for each genotype were analyzed. Data are presented as Mean± SEM. The statistical significance is indicated by **** p<0.0001 (two-tailed t test).) and (C) Average AC activity in TGAC8 vs WT (N=3 per group), (D, E) Expression levels of PKA catalytic and regulatory subunits, and (F) PKA activity in TGAC8 vs WT (N=8 per group), (G–M) Western Blot analysis of selected proteins involved in excitation - Ca release – contraction-relaxation coupling TGAC8 vs WT LV. (L) RyR2 immunolabeling. Antibodies employed are listed in supplemental methods. (N=199 WT cells and 195 TGAC8 cells each from 3 mice). Data are presented as Mean± SEM. The statistical significance is indicated by * p<0.05, ** p<0.01, *** p<0.001,**** p<0.0001 (two-tailed t test).
-
Figure 4—source data 1
Raw unedited blot images and uncropped blot images of PKAca, PKAr, MYH6, SERCA2, LTCC, NCX1, CamKII.
- https://cdn.elifesciences.org/articles/80949/elife-80949-fig4-data1-v2.zip
Figure 5
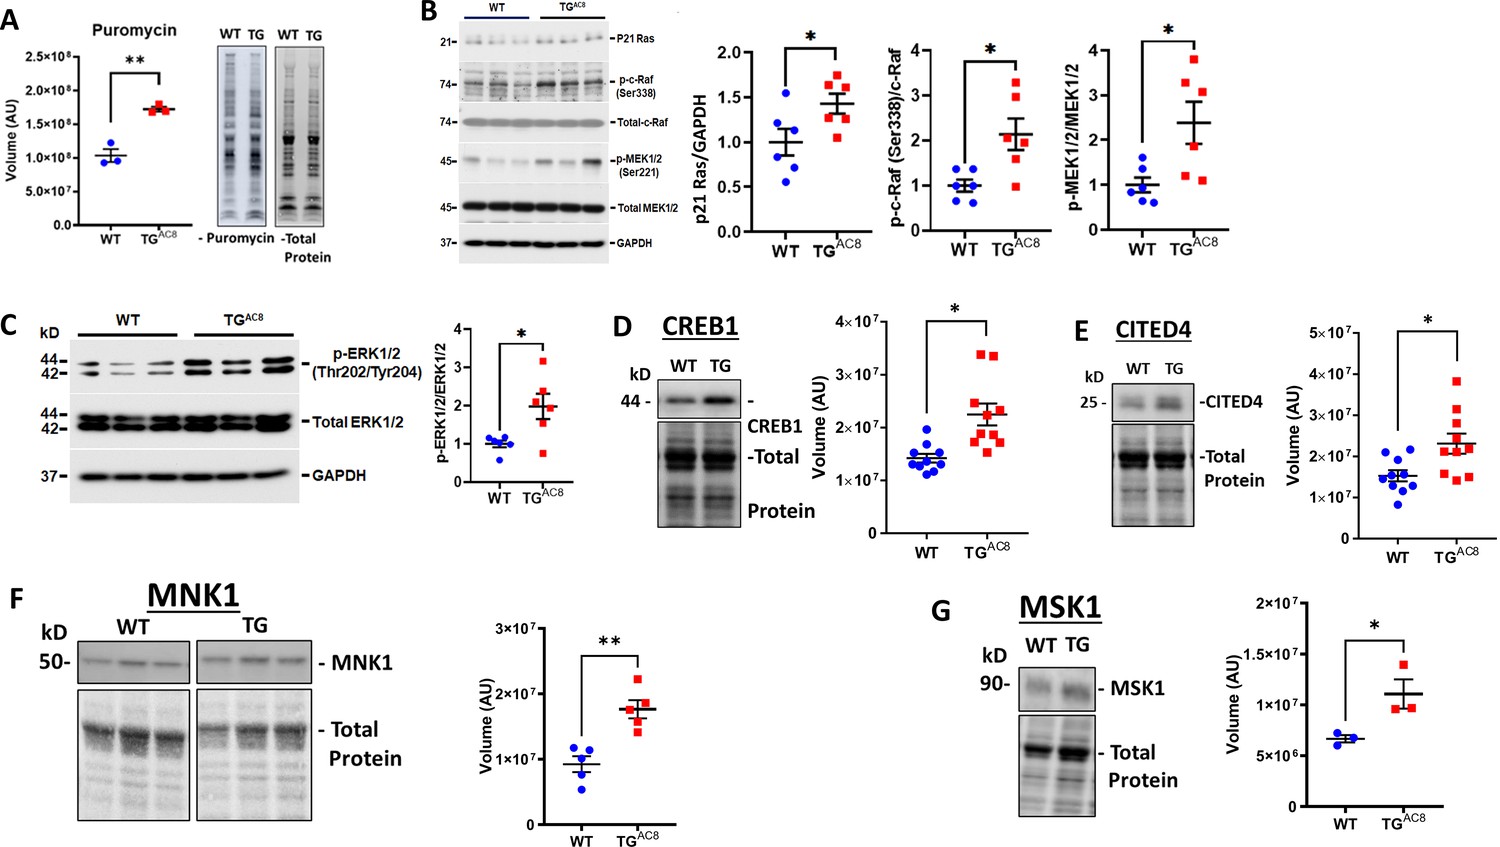
Expression of proteins,involved in protein synthesis, degradation, and quality control in LV of TGAC8 and WT mice.
(A) Rate of global protein synthesis and (B–G) mechanisms downstream of PKA signaling involved in protein synthesis in the TGAC8 and WT. Data are presented as Mean± SEM. The statistical significance is indicated by * p<0.05, ** p<0.01,(two-tailed t test).
-
Figure 5—source data 1
Raw unedited blot images and uncropped blot images of Puromycin, CITED4, CREB1, MNK1, MSK1, GAPDH, pMEK1/2, p21 Ras, p-c-Raf, total Raf, total Mek 1/2, p-ERK 1/2 and total ERK 1/2.
- https://cdn.elifesciences.org/articles/80949/elife-80949-fig5-data1-v2.zip
Figure 6
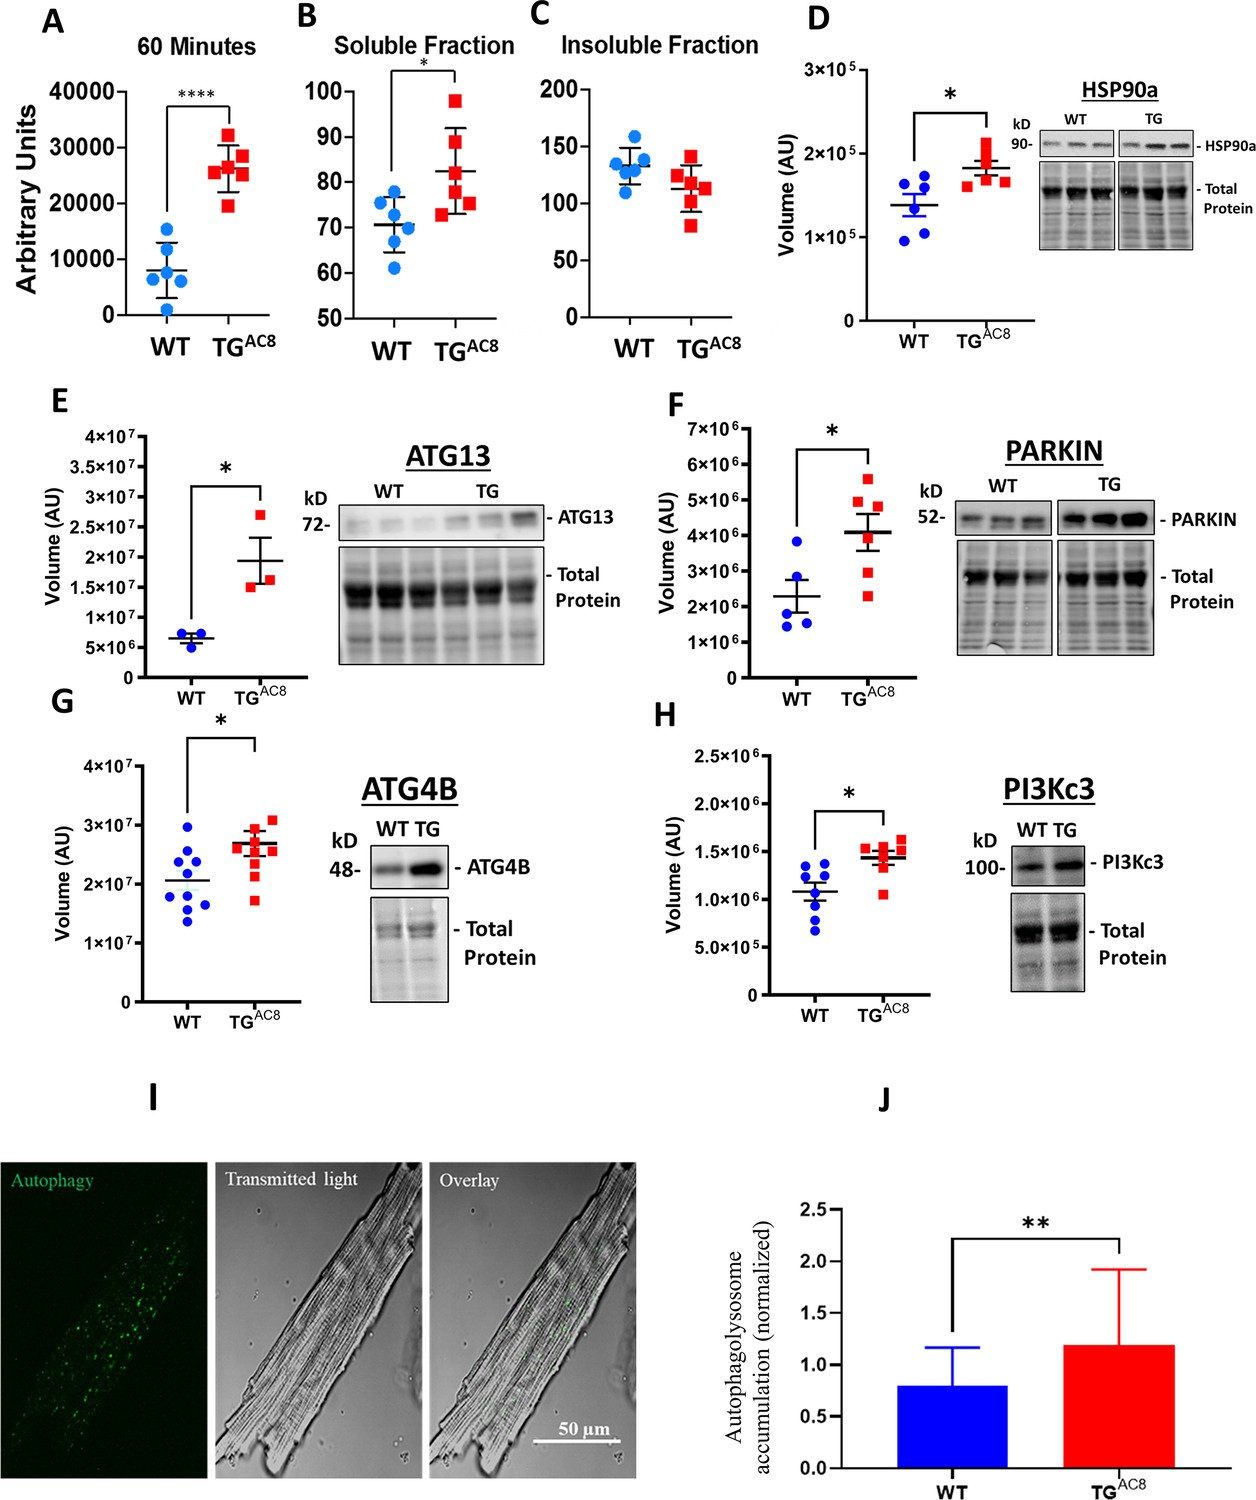
Proteosome activity assay, accumulated proteins in soluble and insoluble fractions and expression levels of selected proteins involved in the autophagy process in LV of TGAC8 and WT mice.
(A) Proteosome activity assay and (B, C) accumulated proteins in soluble and insoluble fractions of LV lysates in TGAC8 vs WT. (D) WB of HSP90 in TGAC8 and WT, (E–H) Expression levels of selected proteins involved in the autophagy process (Data are presented as Mean± SEM. The statistical significance is indicated by * p<0.05, **** p<0.0001 (two-tailed t test).). ;(I, J) Autophagolysosome accumulation is enhanced in AC8 mice (46 cells for each group; 3 aminals per genotype). Data expressed as Mean± SEM. The statistical significance is indicated by **p<0.01, and t (p<0.01 in one-tailed t test).
-
Figure 6—source data 1
Raw unedited blot images and uncropped blot images of HSP90, ATG13, PARKIN, ATG4B, and PI3Kc3.
- https://cdn.elifesciences.org/articles/80949/elife-80949-fig6-data1-v2.zip
Figure 7
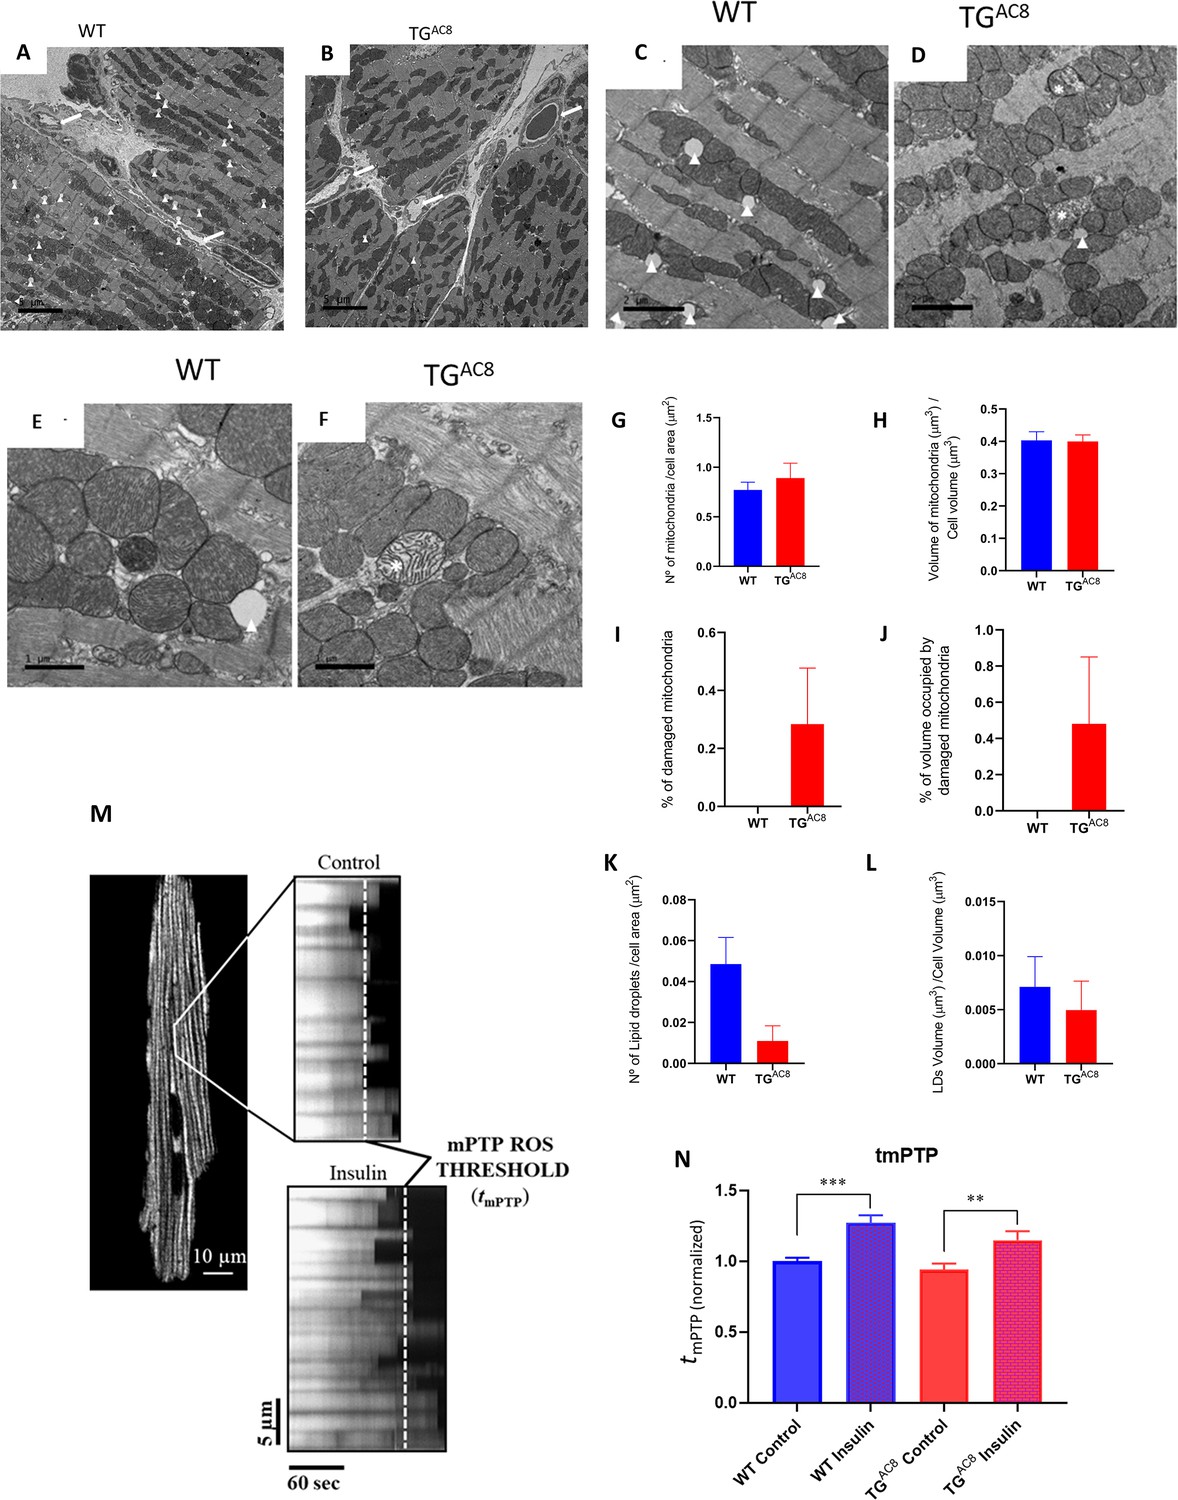
Mitochondrial structure and function.
(A, B) Representative panoramic electron micrographs (white arrows depict capillaries surrounding cardiac myocytes) and (C–F) higher resolution images of LV cardiac muscle fibers and mitochondria in TGAC8 and WT. White arrows depict lipid droplets; asterisks show swollen, disrupted mitochondria with lighter cristae compared to the surrounding, healthy mitochondria. (G, H) Average mitochondrial number of quantitative stereological analyses of normal mitochondrial number and volume, (I, J) damaged mitochondria, (K, L) number of lipid droplets per cell area and volume of lipid droplets. (M, N) mPTP-ROS threshold, measured in a single LV cardiac myocyte, did not differ between TGAC8 and WT mice. Insulin was employed as a positive control. (3 animals in each genotype; 29 cells - WT Control; 26 cells - WT insuline; 30 cells - TGAC8 control; 25 cells - TGAC8 insulin) (** p<0.01, *** p<0.001, one-way anova; Mean± SEM).
Figure 8

Detection of ROS levels and NRF signaling in LV of TGAC8 and WT mice.
(A) LV performance and the rate of superoxide (ROS) generation in isolated working TGAC8 and WT hearts. (B) WB analysis of Nrf2 expression in LV TGAC8 vs WT. Differences between two groups were assessed by a t-test, and reported as Mean± SEM; * p<0.05; ** p<0.01.
-
Figure 8—source data 1
Raw unedited blot images and uncropped blot images of NRF2.
- https://cdn.elifesciences.org/articles/80949/elife-80949-fig8-data1-v2.zip
Figure 9
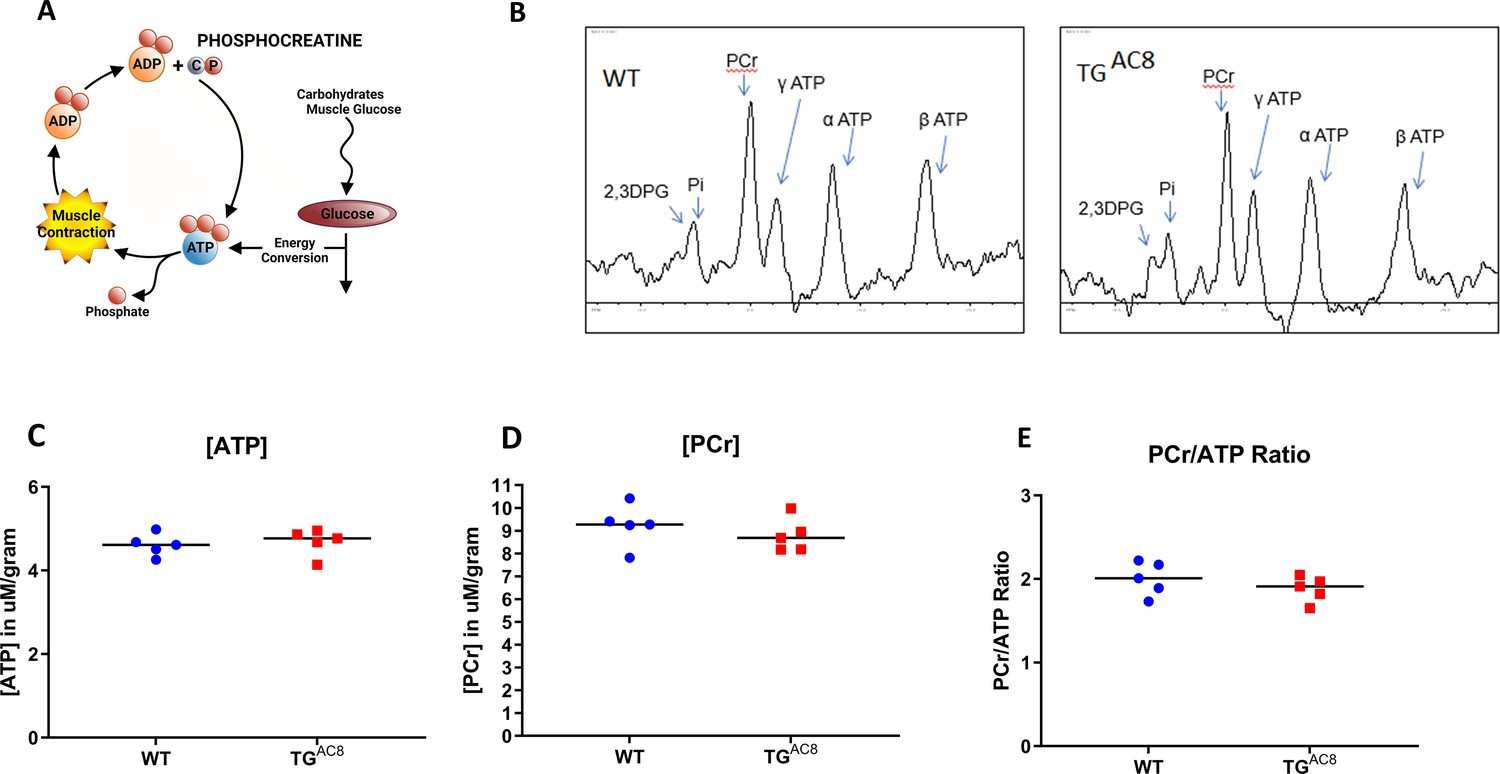
High-energy phosphates in TGAC8 and WT hearts.
(A) A schematic of ATP creatine energy system, (B) Representative P31 NMR spectra of TGAC8 and WT hearts. (C–E) Average levels of ATP, PCr, and ATP/PCr in TGAC8 and WT hearts derived from NMR spectra. Data are presented as Mean± SEM. The statistical significance is indicated by * p<0.05 (two-tailed t test).
Figure 10 with 5 supplements
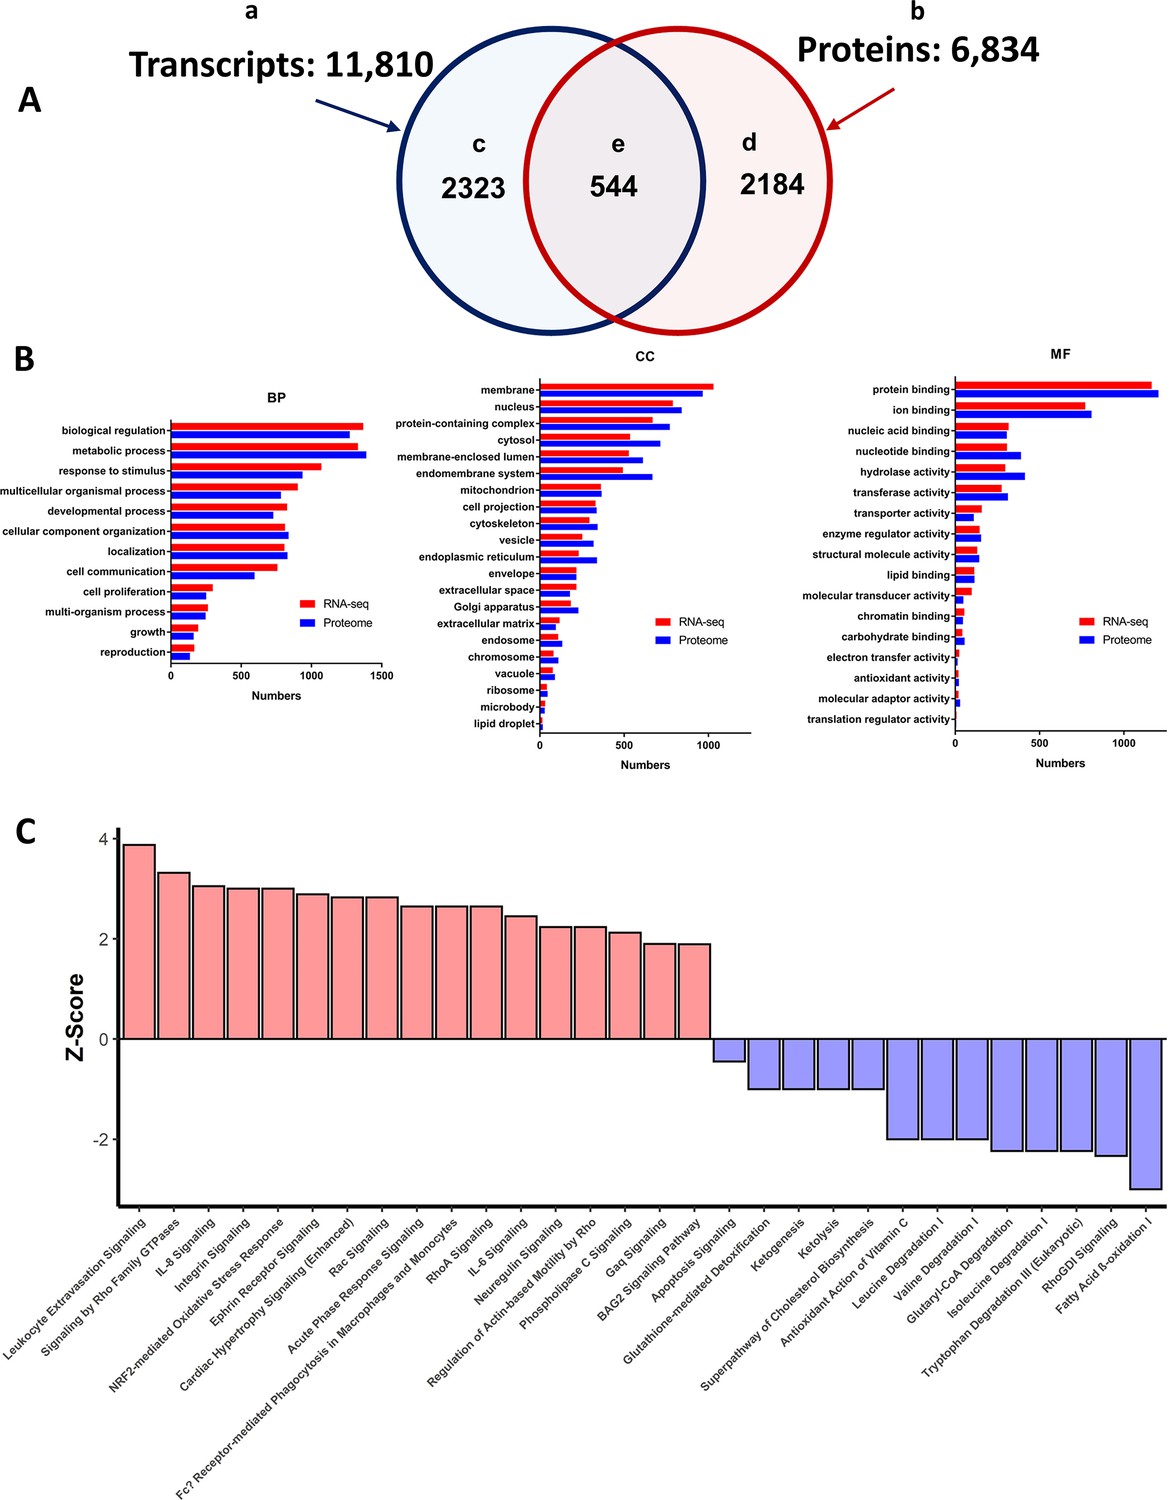
Summary of LV transcriptome and proteome analysis of TGAC8 and WT.
(A) Schematic of the total number of transcripts (subset ‘a’ – 11,810), and proteins (subset ‘b’ 6834), identified in LV lysates, the number of transcripts (subset ‘c’ 2323), and proteins (subset ‘d’ 2184), that differed by genotype, and number of identified transcripts and proteins that both differed by genotype (subset ‘e’ - 544). (B) WEBGESTALT analysis of the 2323 transcripts (Panel A subset ‘c’) and 2184 proteins (Panel A subset ‘d’) that significantly differed by genotype. Biological Processes (BP), Cell Compartment (CC), Molecular Functions (MF). (C) Top canonical signaling pathways differing in enrichment (-log10(pvalue) >1.3) and activation status by genotype in IPA analysis of transcripts and proteins.
Figure 10—figure supplement 1
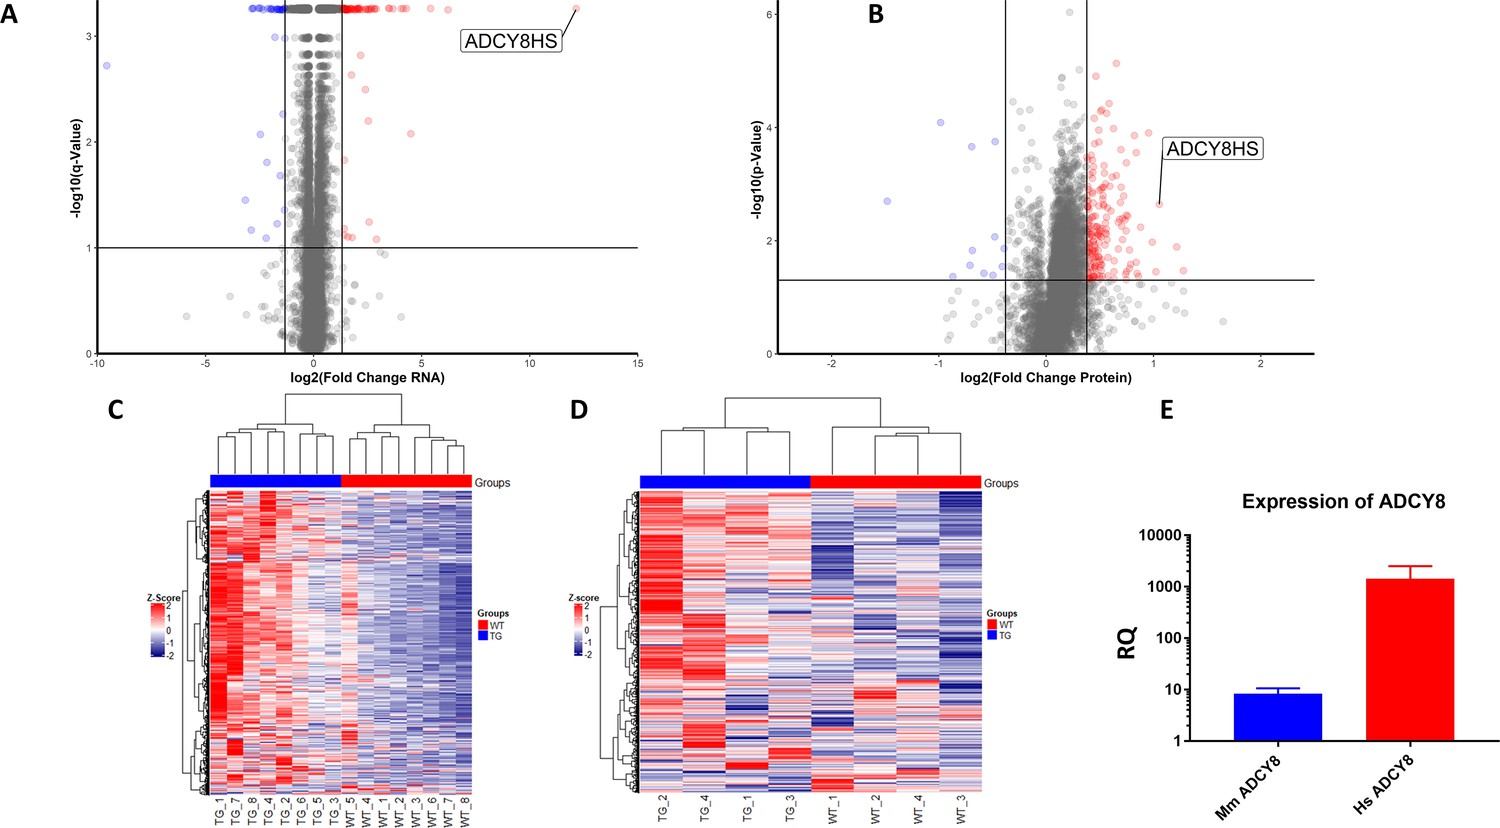
Volcano plots and heat maps of transcripts and proteins.
Figure 10—figure supplement 2
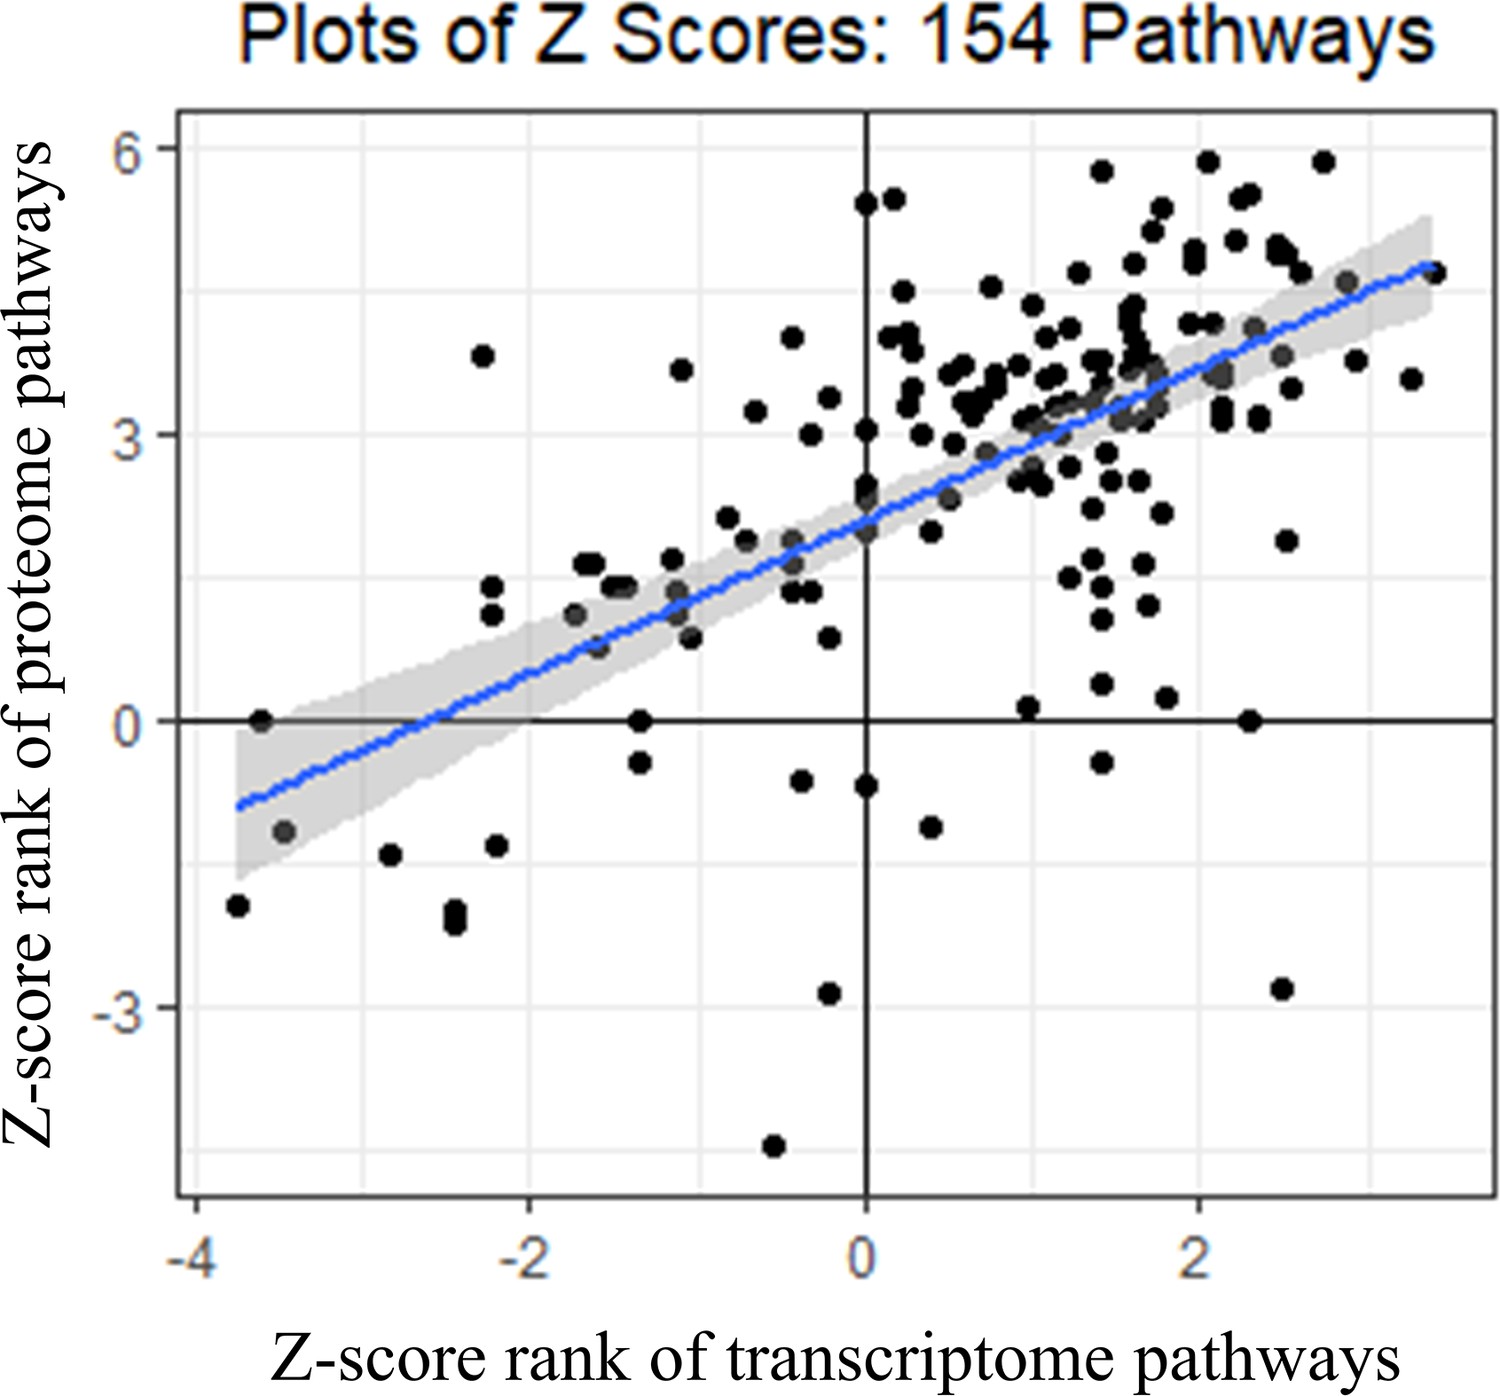
Spearman’s correlations of Z-scores of IPA canonical pathways that significantly differed by genotype in transcriptome and proteome.
Figure 10—figure supplement 3
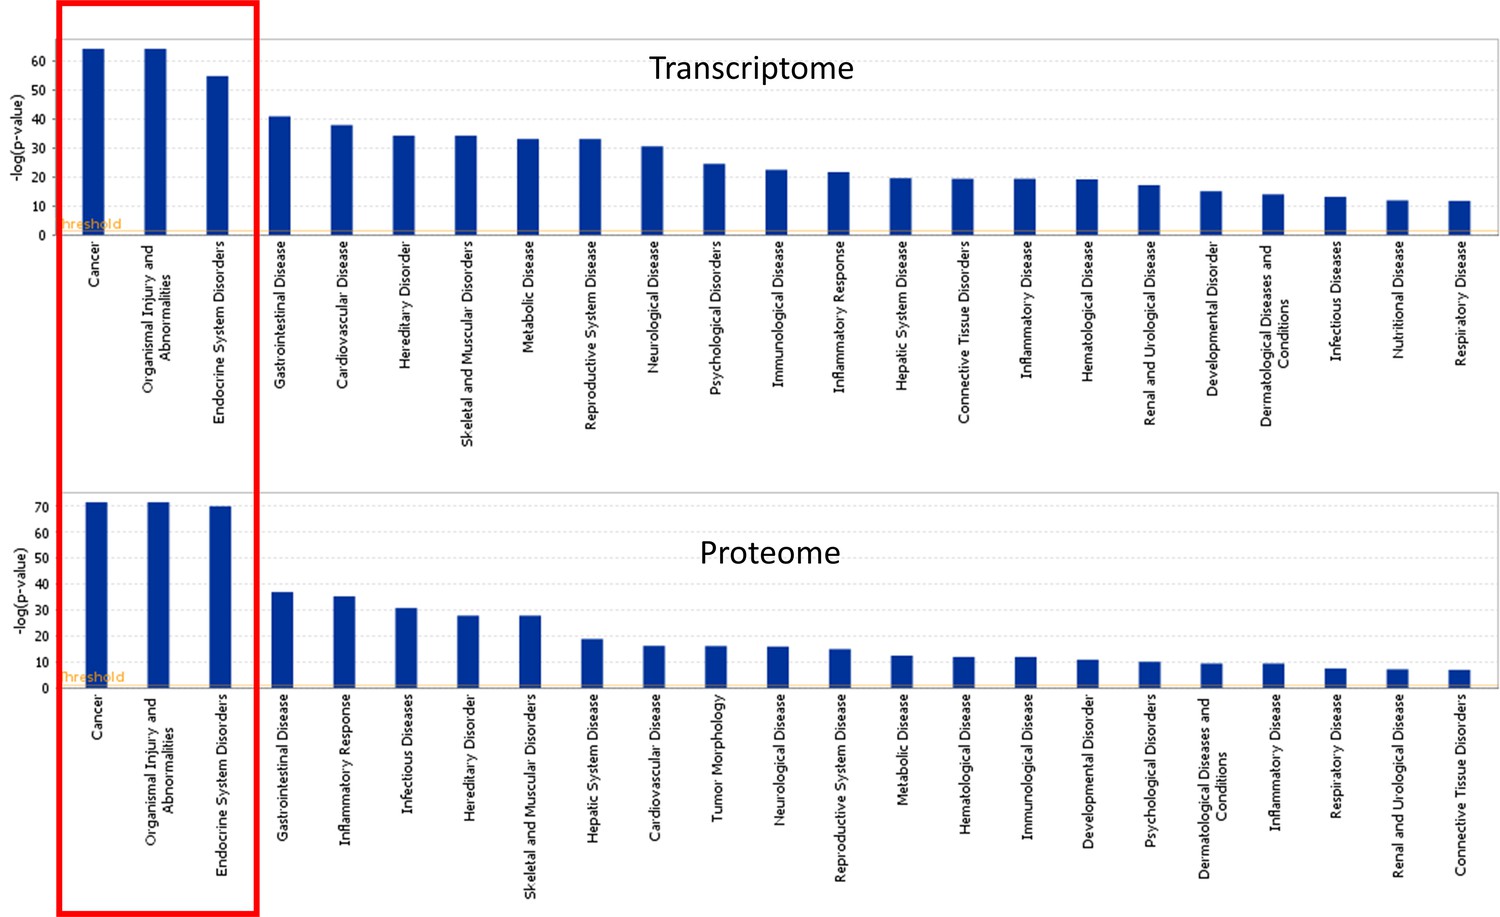
IPA representation of top disease-related functions within the LV transcriptome and proteome of TGAC8 and WT.
Figure 10—figure supplement 4
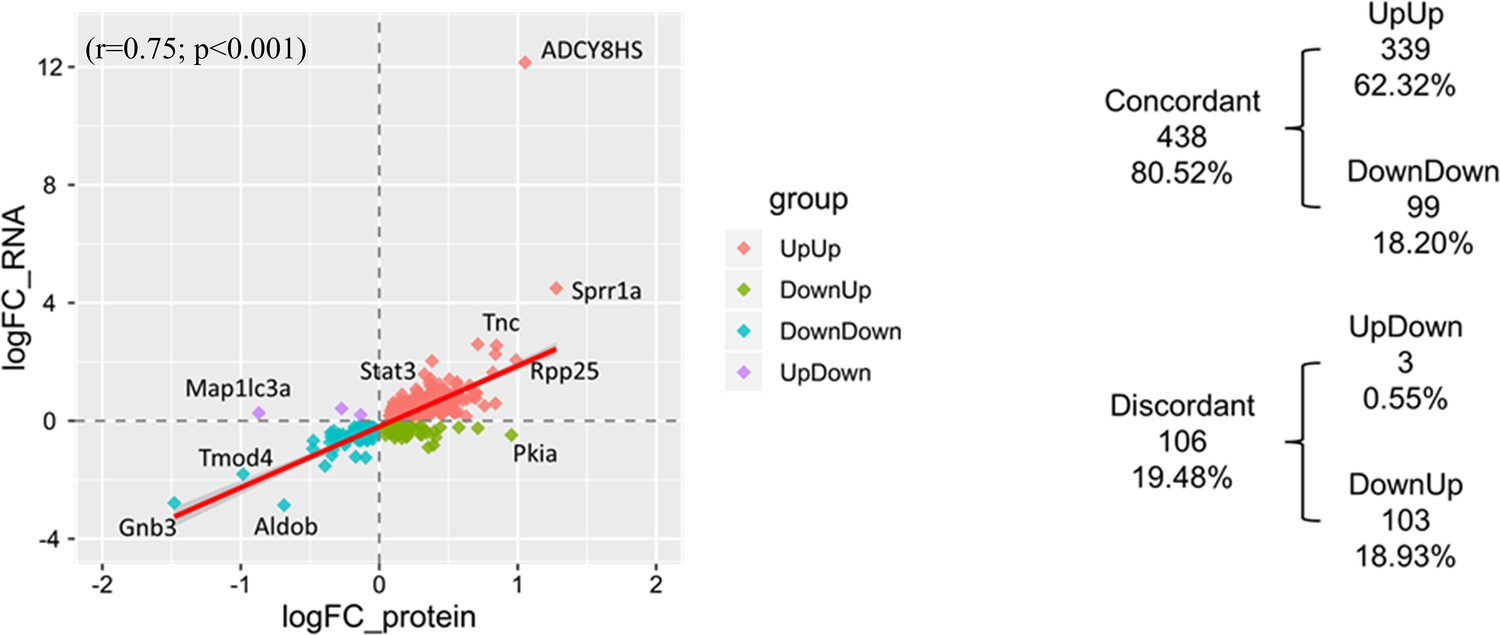
Correlation plot of 544 identified molecules of which both transcripts and proteins differed by genotype.
Figure 10—figure supplement 5
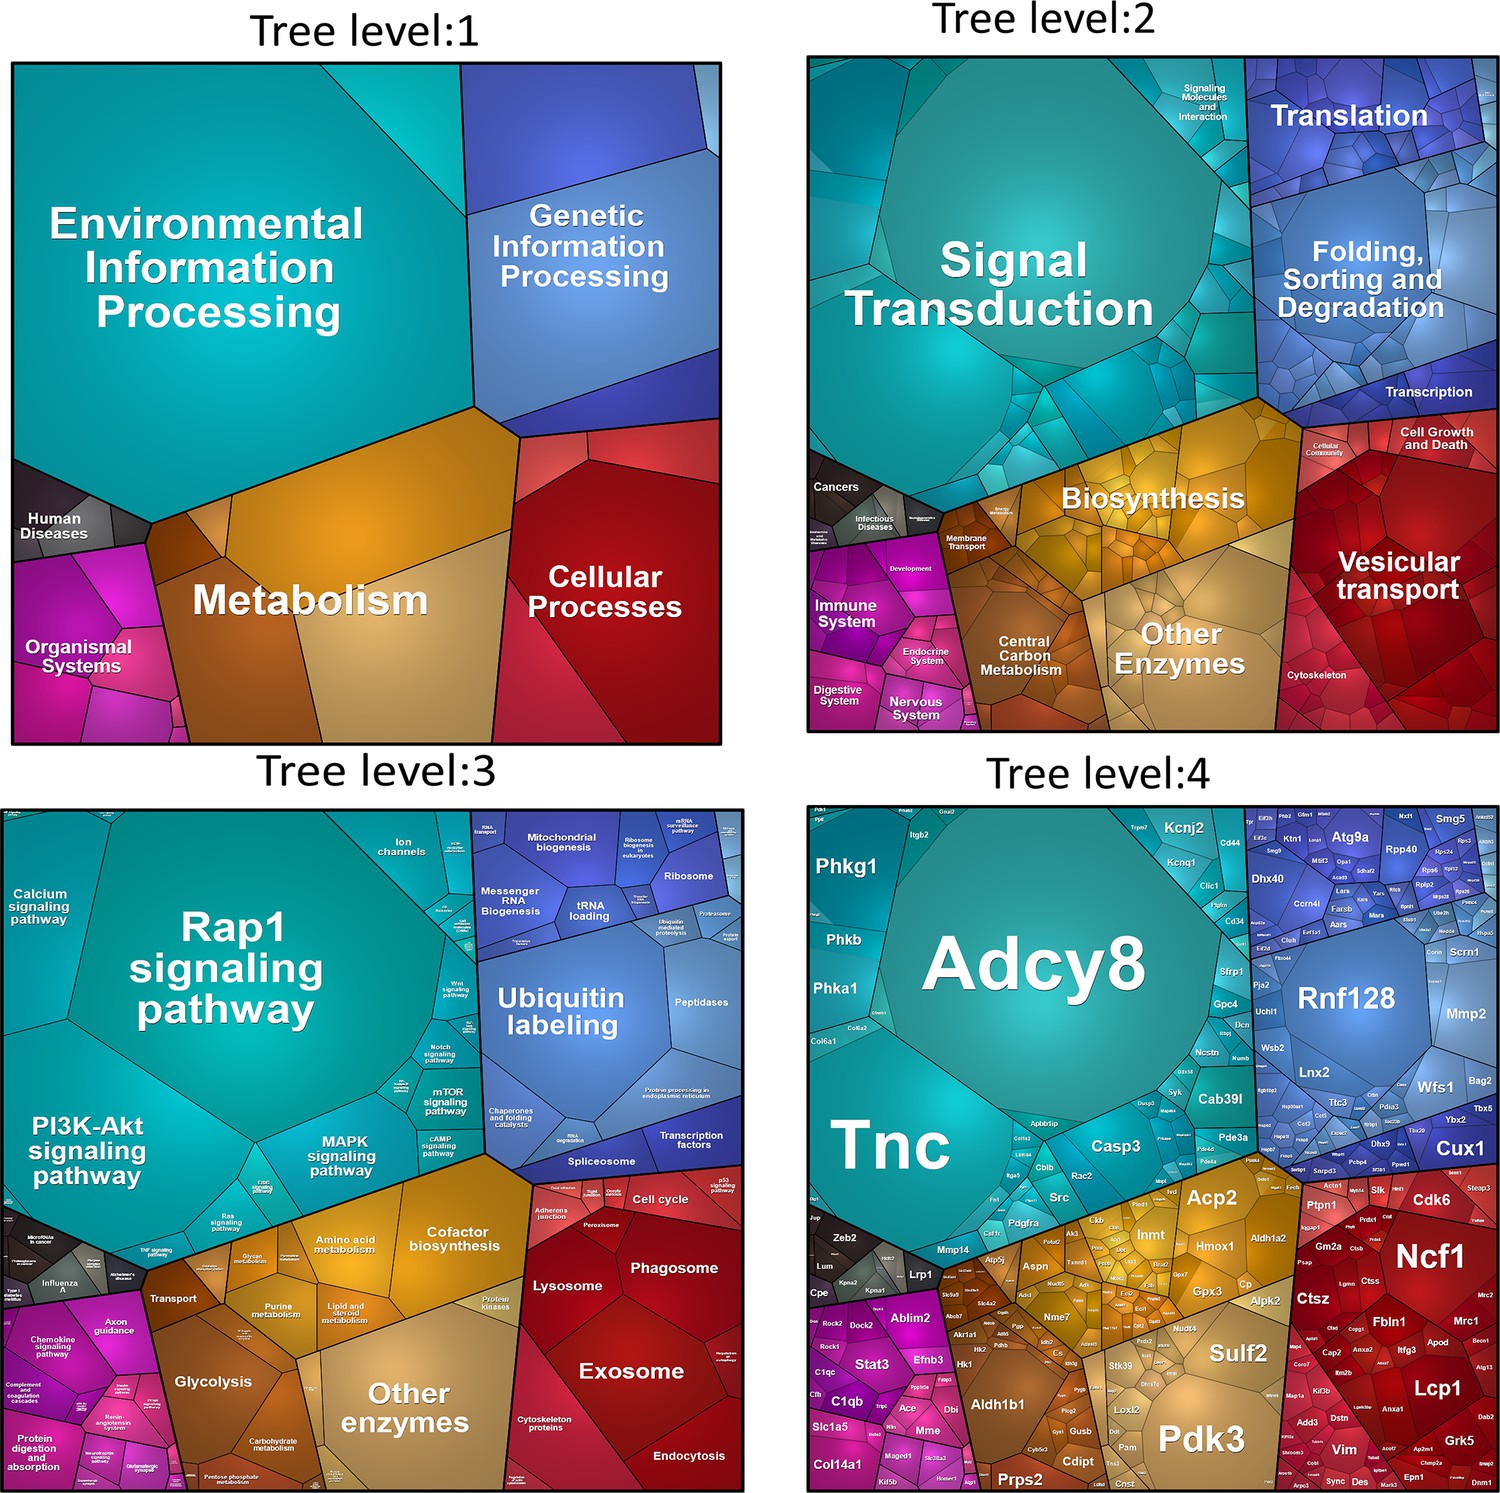
PROTEOMAP.
Visualization of functional categories of the 544 proteins that differed by genotype. Four levels of functional tree consist of number of polygons. The areas of each polygon reflect genotypic differences in protein abundances.
Figure 11 with 1 supplement
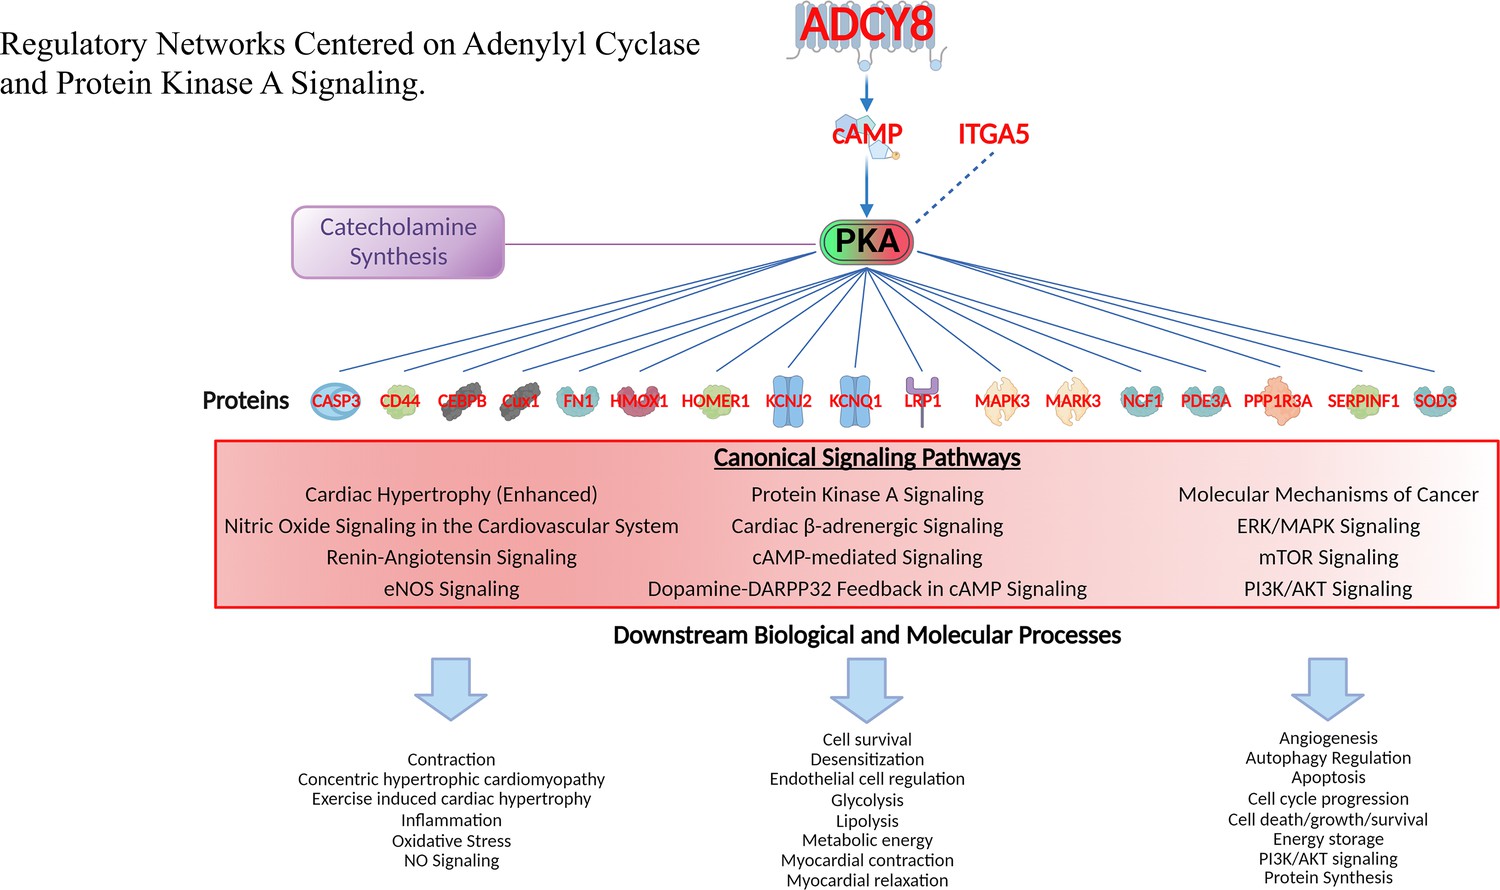
Regulatory networks centered on adenylyl cyclase and protein kinase A signaling.
Gene families of proteins regulated by PKA ranged from transcription regulators, kinases, peptidases and other enzymes, transmembrane receptors, ion channels and other gene families. Canonical signaling pathways in which these proteins operate and downstream biological and molecular processes of proteins in these pathways are also displayed (lower part). See Supplementary file 1k for the full list of these downstream effects of PKA signaling.
Figure 11—figure supplement 1
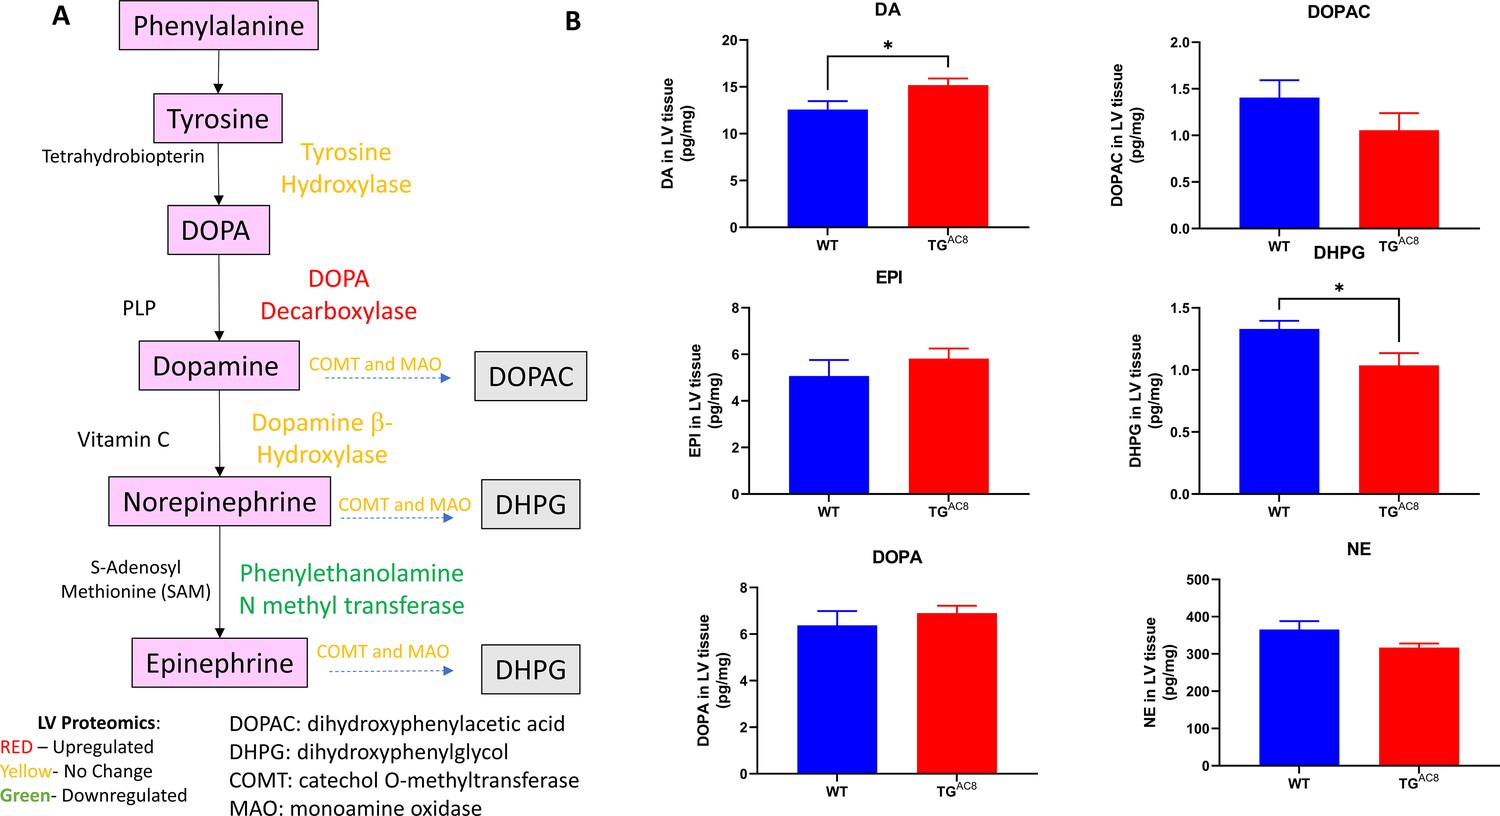
Myocardial catecholamine levels in LV of TGAC8 and WT.
(A) Pathway for catecholamine synthesis and breakdown; (B) Myocardial catecholamine levels (N=12 for each group, Data are presented as Mean± SEM. The statistical significance is indicated by * p<0.05, (two-tailed t test).).
Figure 12 with 3 supplements
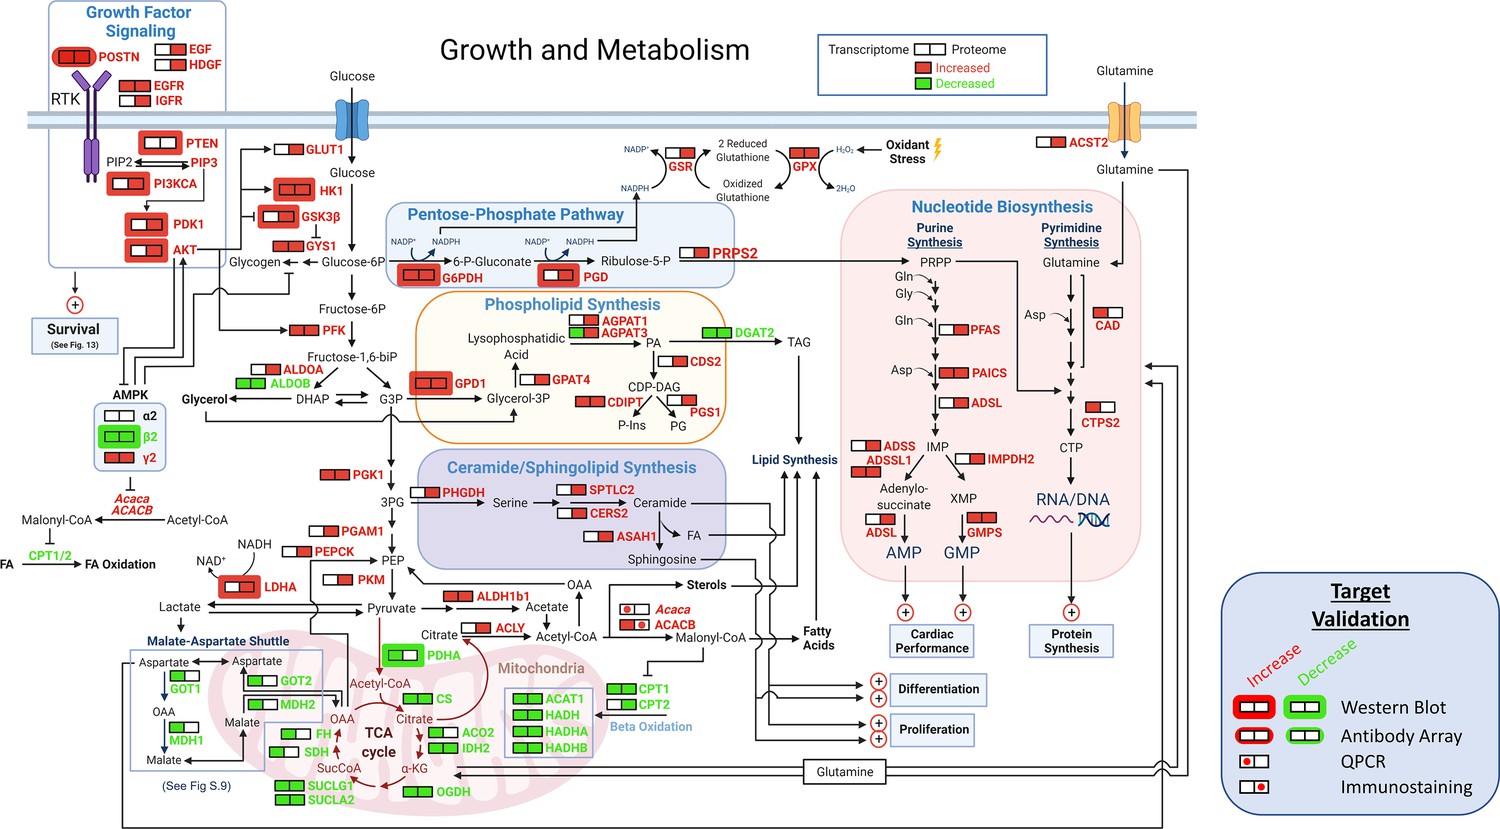
Growth and metabolism.
A schematic of growth and metabolism circuitry based on signals derived from bioinformatic analyses of the transcriptome and proteome and on selected WBs. Catabolism of glucose is markedly increased in TGAC8 vs WT as reflected in increased expression of Glut1, HK1, and PFK and other glycolytic enzymes, whilst fatty acid β oxidation pathway is concurrently reduced, as reflected in reduced expression of Cpt1, Cpt2, Acat1, Hadh, Hadha, and Hadhb. in TGAC8 vs WT LV. Shifts in the transcription of genes and translation of proteins that are operative within PPS pathway, that is G6PDH, PGD and PRPS2 suggests that PPS is more highly activated in the TGAC8 vs WT. The combination of increased expression of the glucose transporter, lactic acid dehydrogenase type A and the glutamine transporter in TGAC8, suggests that, relative to WT, the TGAC8 heart utilizes aerobic glycolysis to fulfill part of its energy needs. Enhanced growth factor and other PI3/AKT driven signaling processes increased in TGAC8 vs WT are also known to be linked to aerobic glycolysis.
Figure 12—figure supplement 1
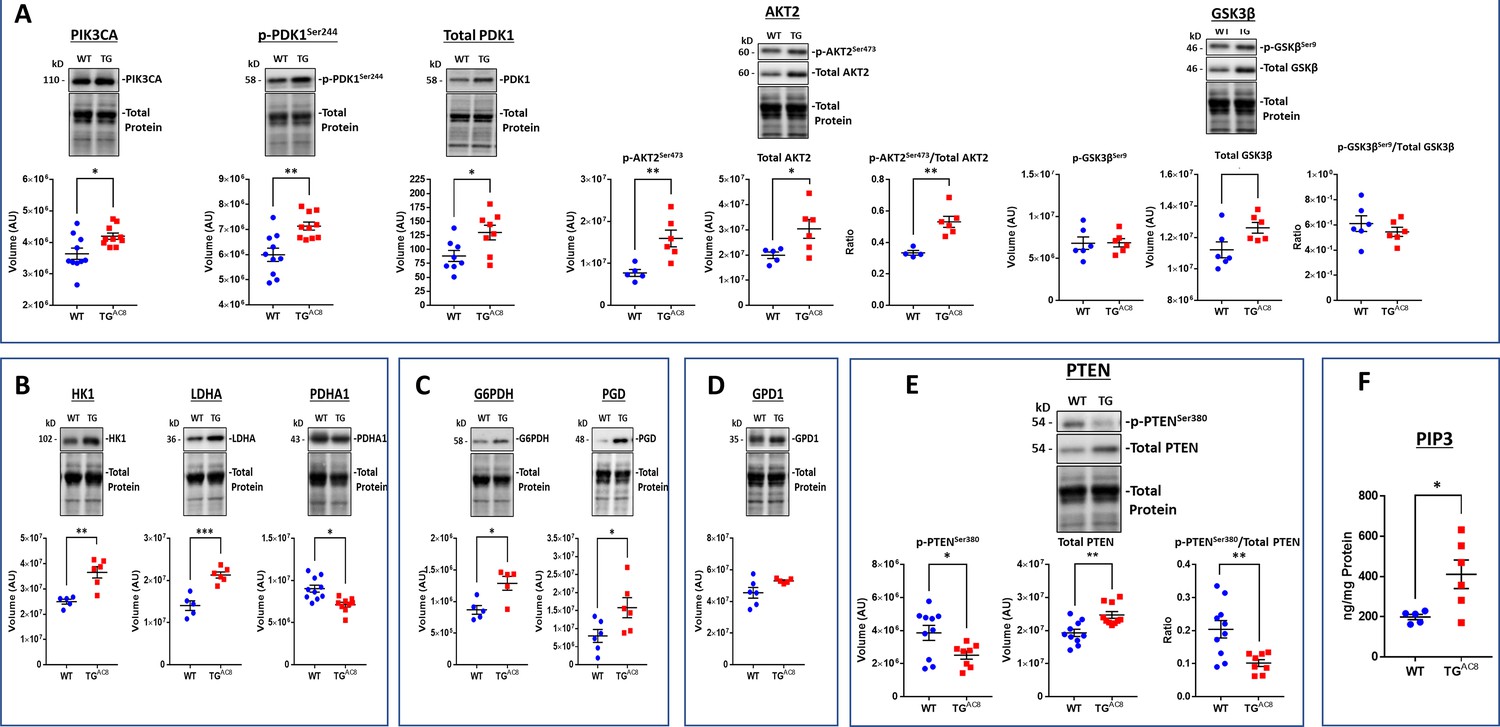
WB analyses of selected proteins that mediate PIP3 kinase signaling and metabolism.
Data are presented as Mean± SEM. The statistical significance is indicated by * p<0.05, ** p<0.01, *** p<0.001, (two-tailed t test).
-
Figure 12—figure supplement 1—source data 1
Raw unedited blot images and uncropped blot images of AKT2, GAPDH, GPD1, GSK3b and HK1.
- https://cdn.elifesciences.org/articles/80949/elife-80949-fig12-figsupp1-data1-v2.zip
-
Figure 12—figure supplement 1—source data 2
Raw unedited blot images and uncropped blot images of LDHA, PDHA1, PDK1, PGD, PIK3CA and PTEN.
- https://cdn.elifesciences.org/articles/80949/elife-80949-fig12-figsupp1-data2-v2.zip
Figure 12—figure supplement 2
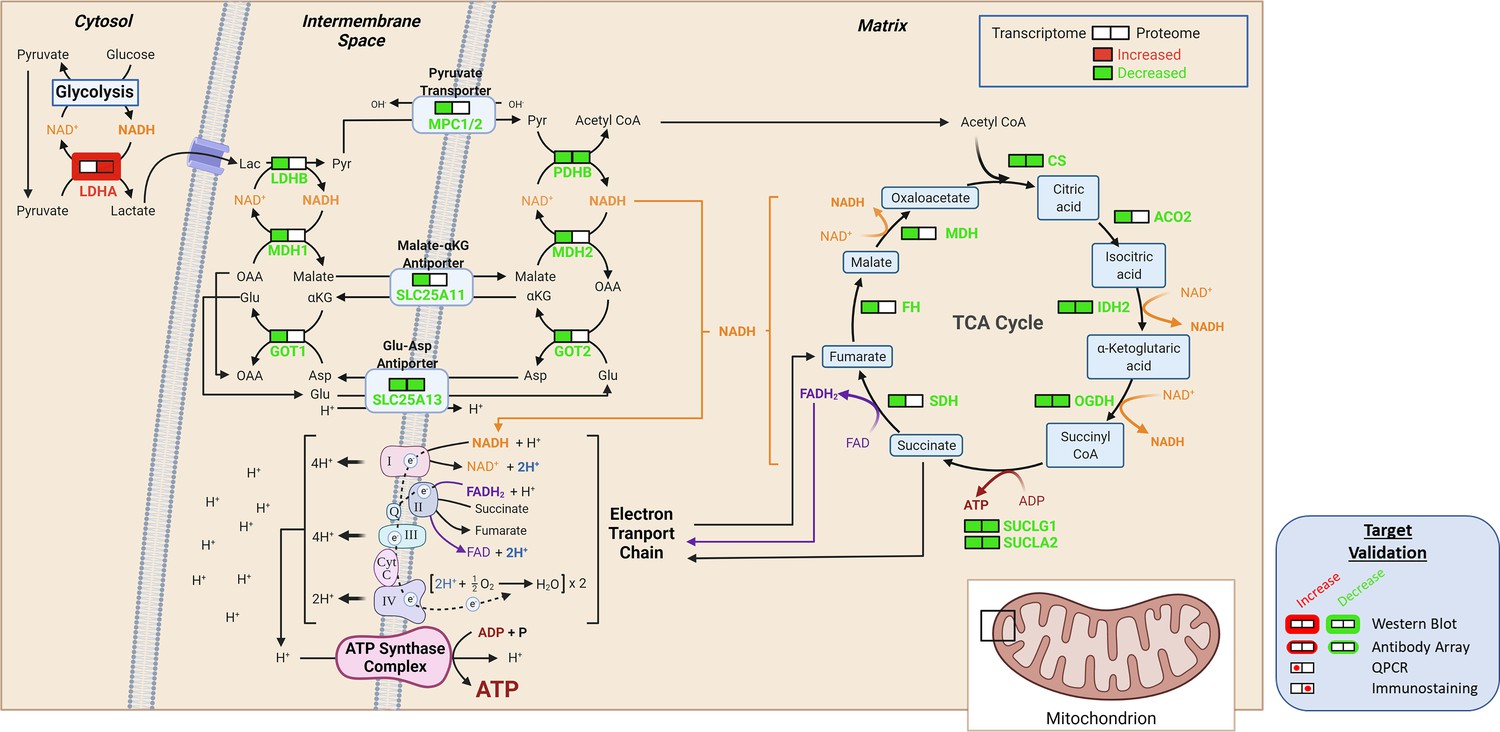
Detailed schematic malate-aspartate shuttle based on signals derived from bioinformatic analyses of the transcriptome and proteome and on selected WBs.
Figure 12—figure supplement 3
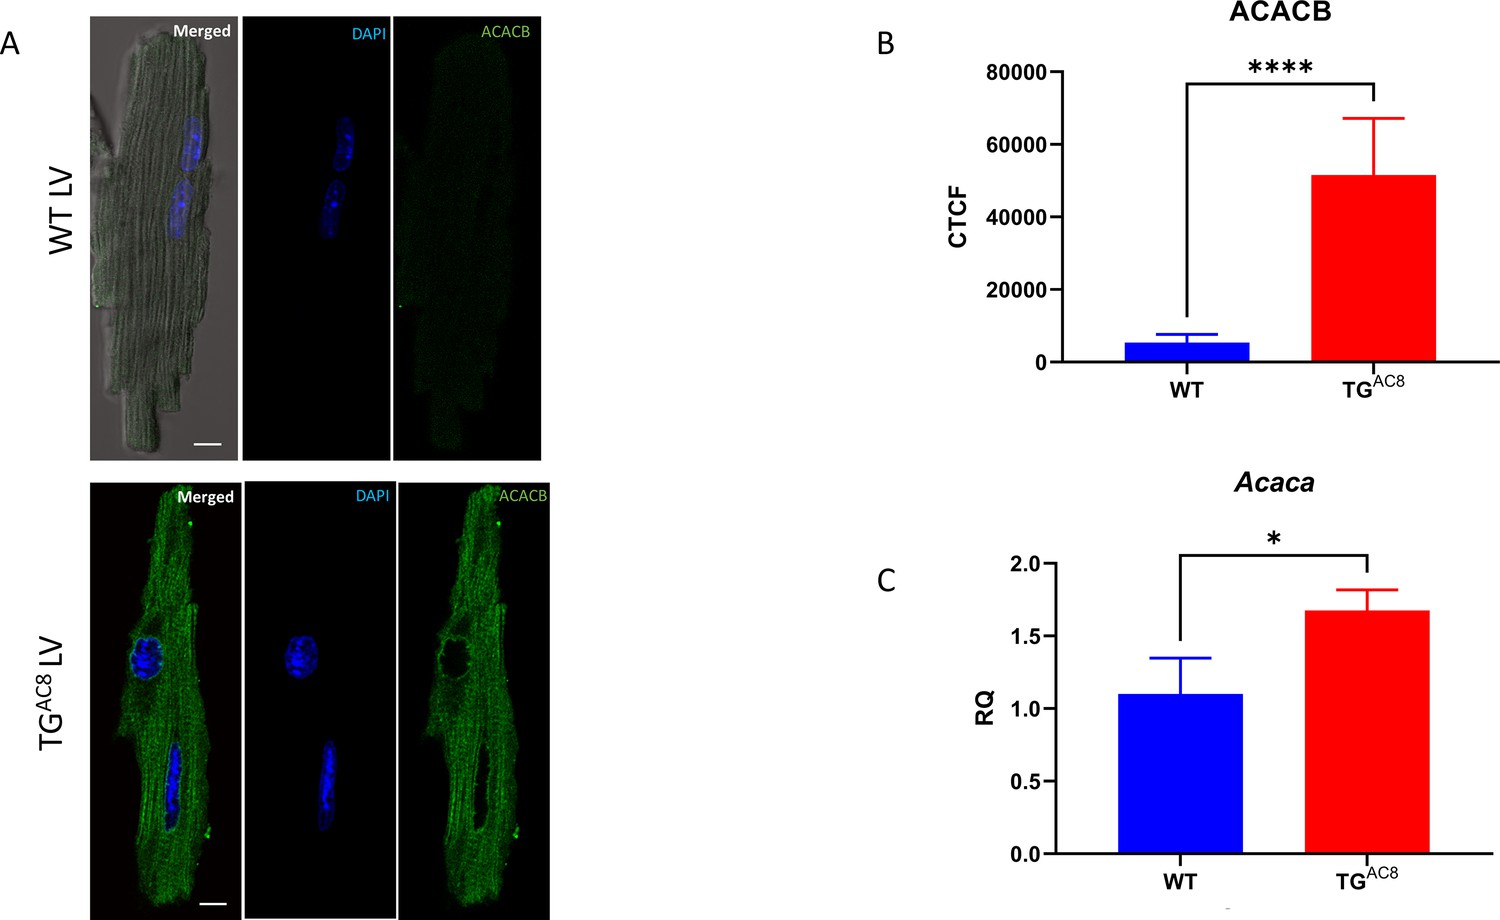
Representative examples of (A) ACACB immunolabeling of TGAC8 and WT LV myocytes (scale bar 10 µm); (B) average ACACB fluorescence in LV cardiomyocytes (n=25 for each group); (C) Relative Quantification of Acaca mRNA expression in LV tissue (n=4 for each group).
Data are presented as Mean± SEM. The statistical significance is indicated by * p<0.05, **** p<0.0001 (two-tailed t test).
Figure 13 with 9 supplements
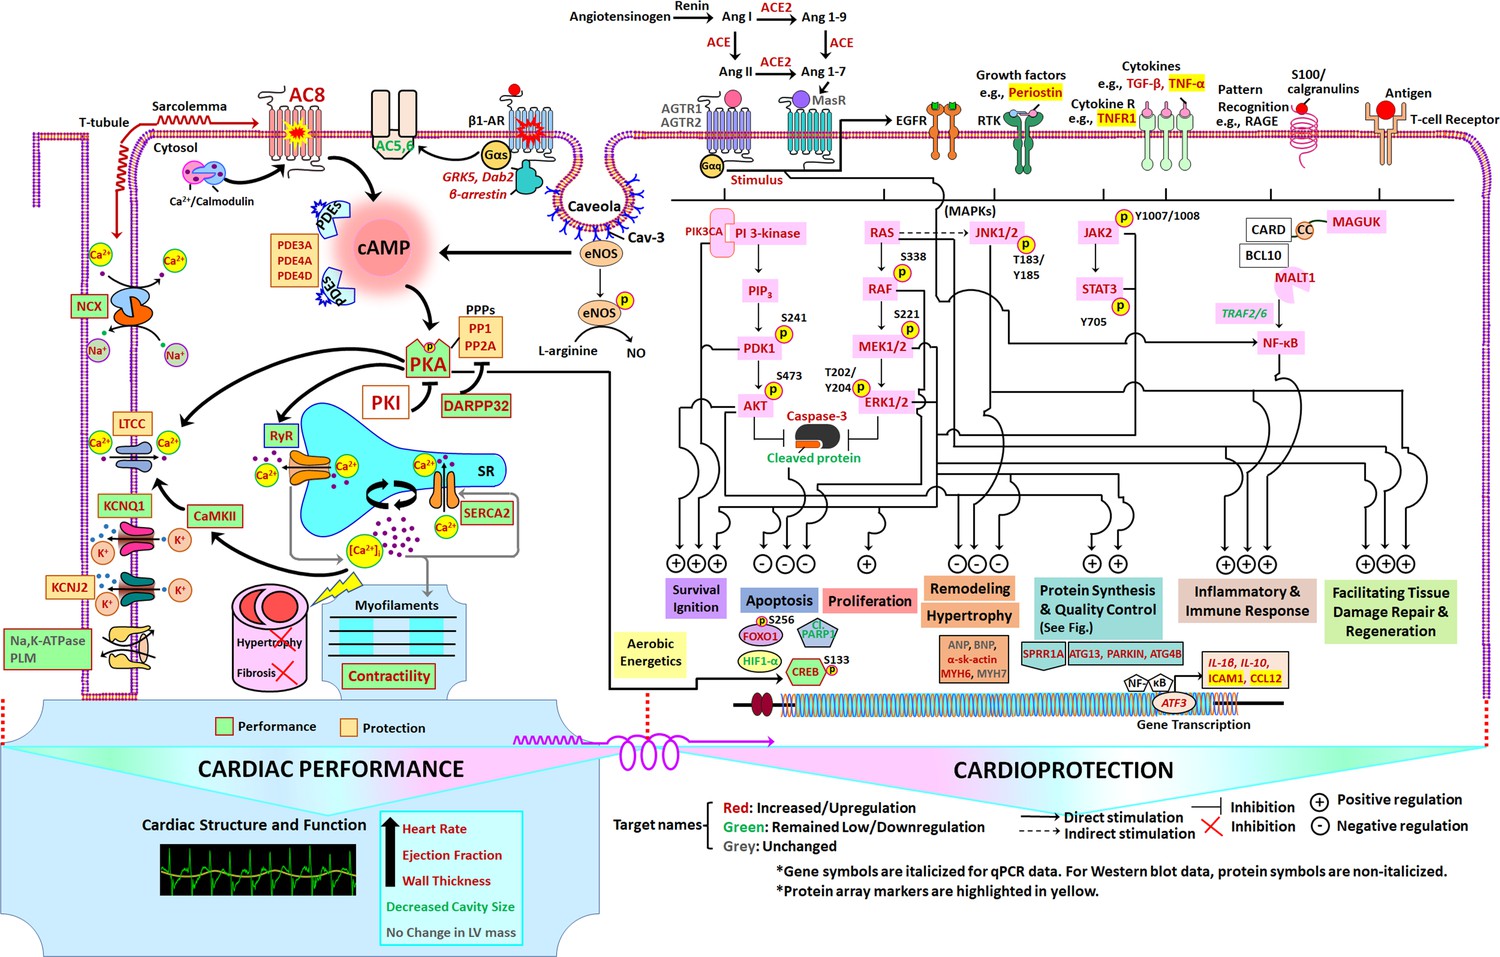
Schematic of TGAC8 heart performance and protection circuits that appeared to be concurrently engaged in the TGAC8 LV.
The pathways/specific targets and the effector functions/outcomes culminating from the regulation of the components within the circuits in the pathways are represented according to published literature with respect to cardiac-specific context (see Discussion). Pink colors represent proteins that differed by genotype in WB. Molecular targets or components in red, green, and grey represent molecular targets or components that are increased or upregulated, decreased or downregulated, or unchanged, respectively, in TGAC8 vs WT.
Figure 13—figure supplement 1
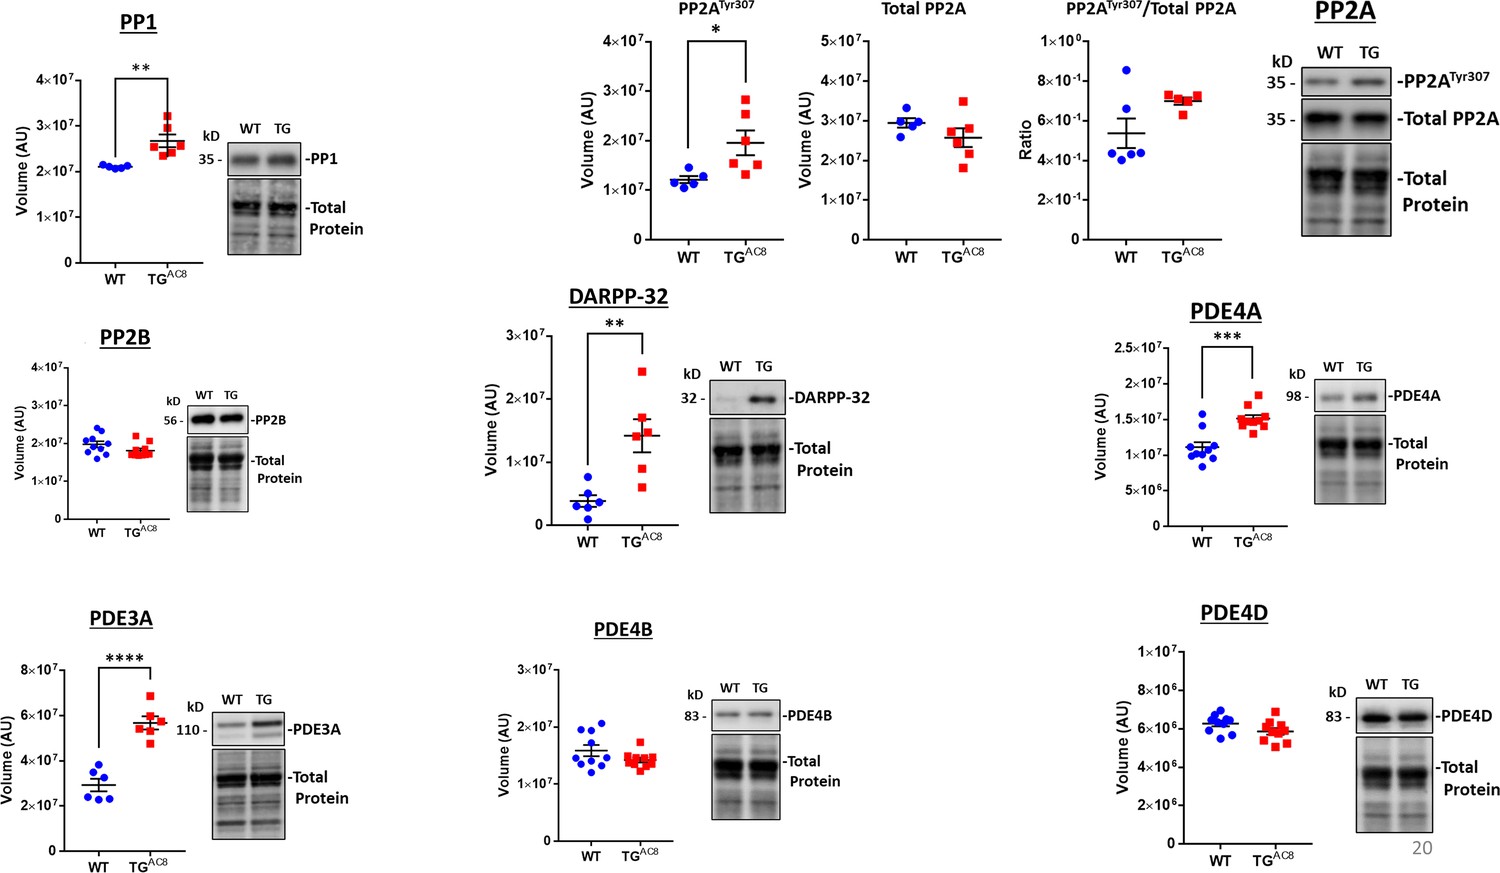
WB analyses of selected proteins within the performance and protection circuitry depicted in Figure 13.
Negative feedback adaptations on AC/PKA signaling.Data are presented as Mean± SEM. The statistical significance is indicated by * p<0.05, ** p<0.01, *** p<0.001, **** p<0.0001 (two-tailed t test).
-
Figure 13—figure supplement 1—source data 1
Raw unedited blot images and uncropped blot images of PDE4B, PDE4D, PP1, PP2A, PP2B.
- https://cdn.elifesciences.org/articles/80949/elife-80949-fig13-figsupp1-data1-v2.zip
-
Figure 13—figure supplement 1—source data 2
Raw unedited blot images and uncropped blot images of PP2B, DARPP-32, PDE3A, PDE4A.
- https://cdn.elifesciences.org/articles/80949/elife-80949-fig13-figsupp1-data2-v2.zip
Figure 13—figure supplement 2
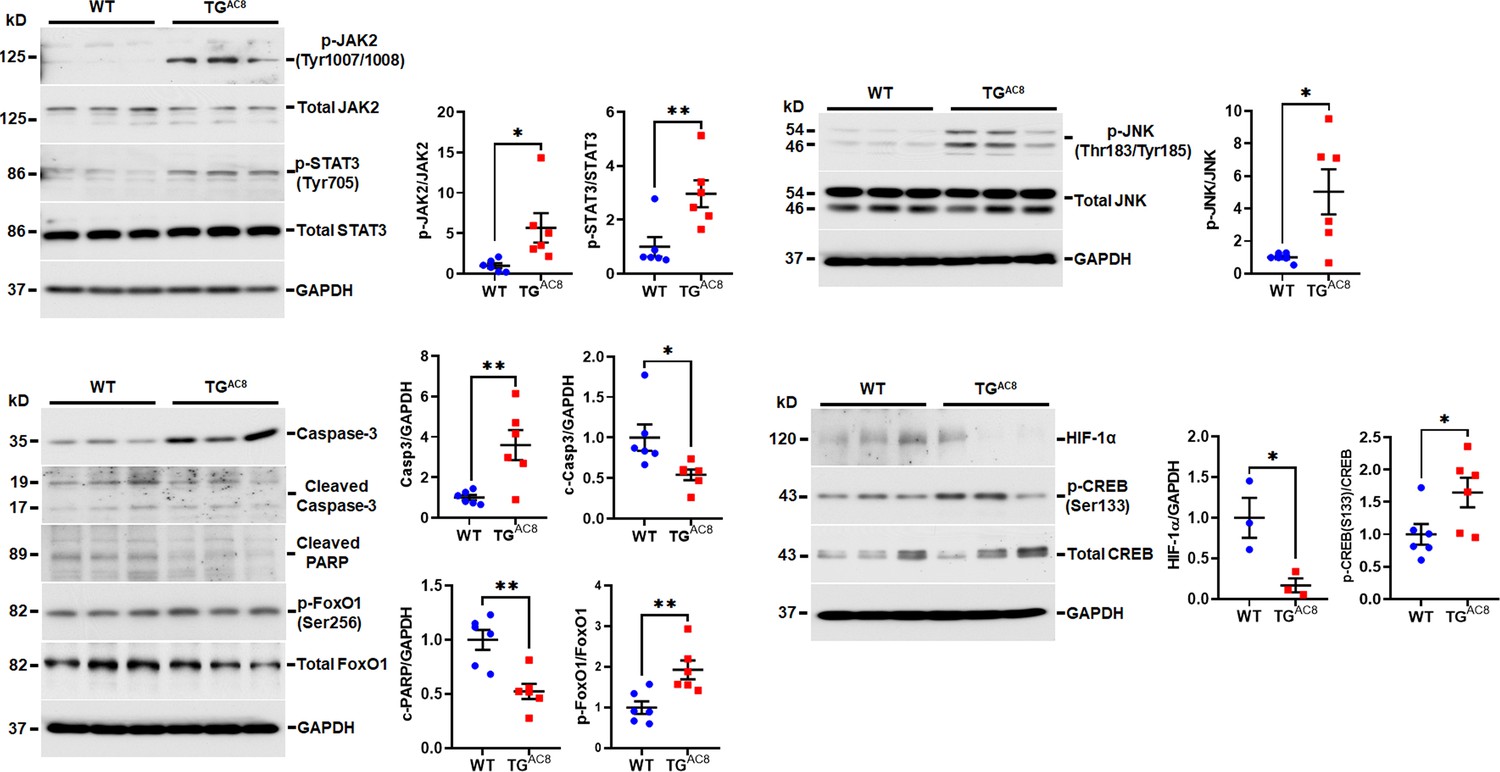
WB analysis of selected proteins involved in Jak/Stat/Jnk/Caspase signaling.
Data are presented as Mean± SEM. The statistical significance is indicated by * p<0.05, ** p<0.01 (two-tailed t test).
-
Figure 13—figure supplement 2—source data 1
Raw unedited blot images and uncropped blot images of Caspase3, Cleaved Caspase3, Cleaved PARP, pFoxO1 (Ser256), GAPDH, HIF1α, JAK2 (Tyr1007/Tyr1008), pCREB (Ser133), pJNK (Thr183/Tyr185), pSTAT3 (Tyr705), total CREB, total FoxO1, total JAK2, total JNK, and total STAT3.
- https://cdn.elifesciences.org/articles/80949/elife-80949-fig13-figsupp2-data1-v2.zip
Figure 13—figure supplement 3
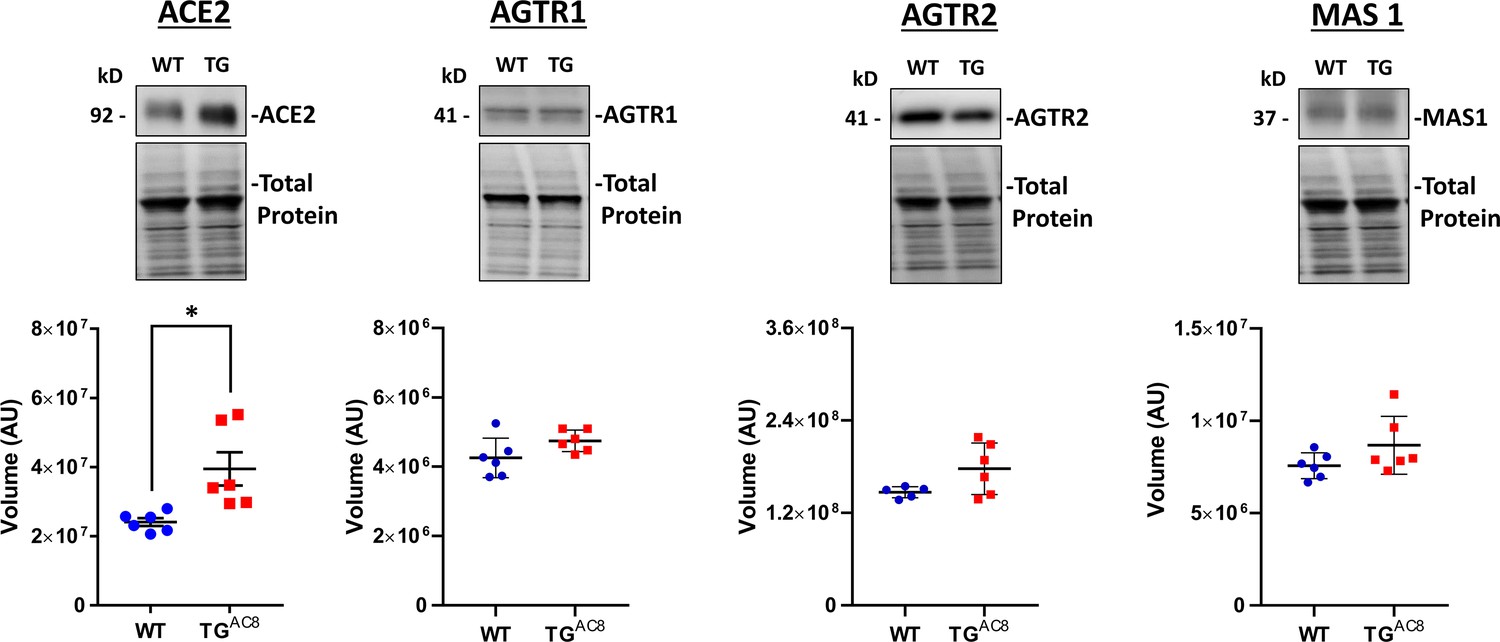
WB analysis of selected proteins involved in angiotensin receptor signaling Data are presented as Mean± SEM.
The statistical significance is indicated by * p<0.05, ** p<0.01, *** p<0.001, **** p<0.0001 (two-tailed t test).
-
Figure 13—figure supplement 3—source data 1
Raw unedited blot images and uncropped blot images of ACE2, AGTR1, AGTR2, and MAS1.
- https://cdn.elifesciences.org/articles/80949/elife-80949-fig13-figsupp3-data1-v2.zip
Figure 13—figure supplement 4
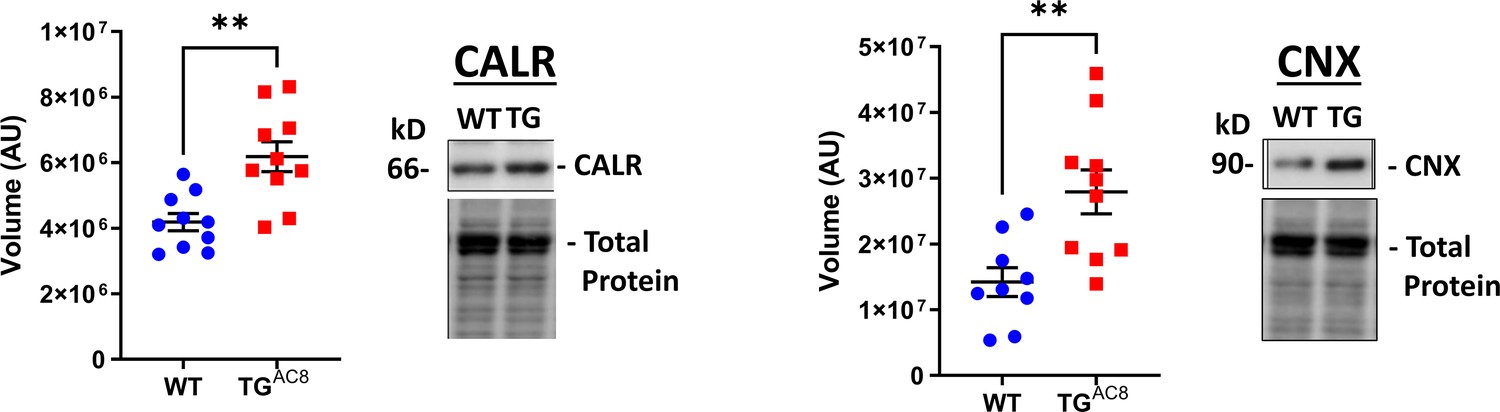
WB analysis of Calnexin and Calreticulin, proteins involved in ER protein processing Data are presented as Mean± SEM.
The statistical significance is indicated by * p<0.05, ** p<0.01 (two-tailed t test).
-
Figure 13—figure supplement 4—source data 1
Raw unedited blot images and uncropped blot images of CALR and CNX.
- https://cdn.elifesciences.org/articles/80949/elife-80949-fig13-figsupp4-data1-v2.zip
Figure 13—figure supplement 5
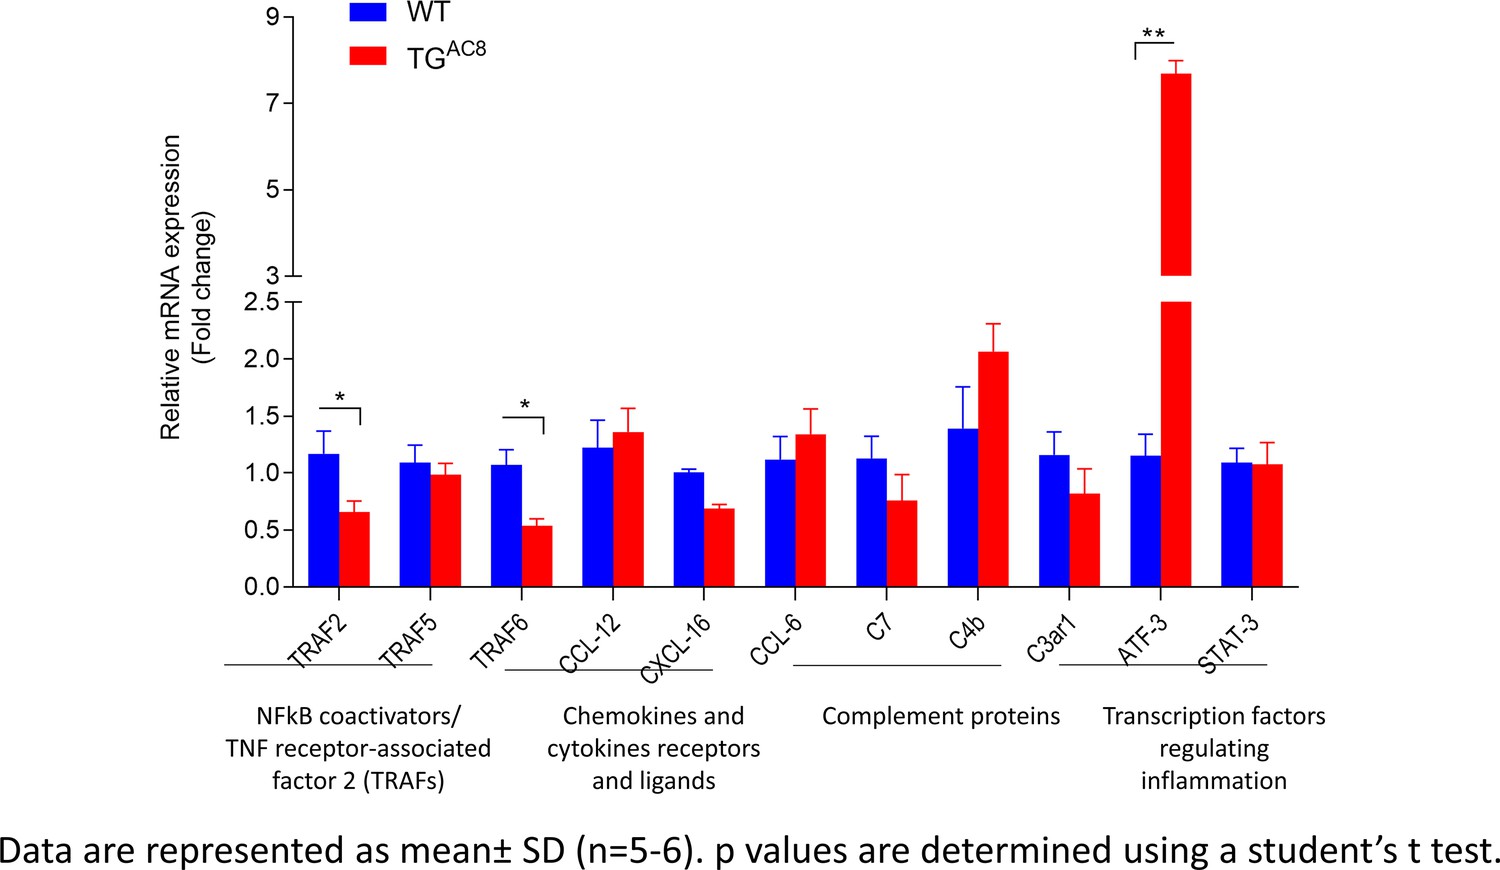
RT-qPCR analysis of genes regulating cytokines level in the LV.
The statistical significance is indicated by * p<0.05, ** p<0.01.
Figure 13—figure supplement 6
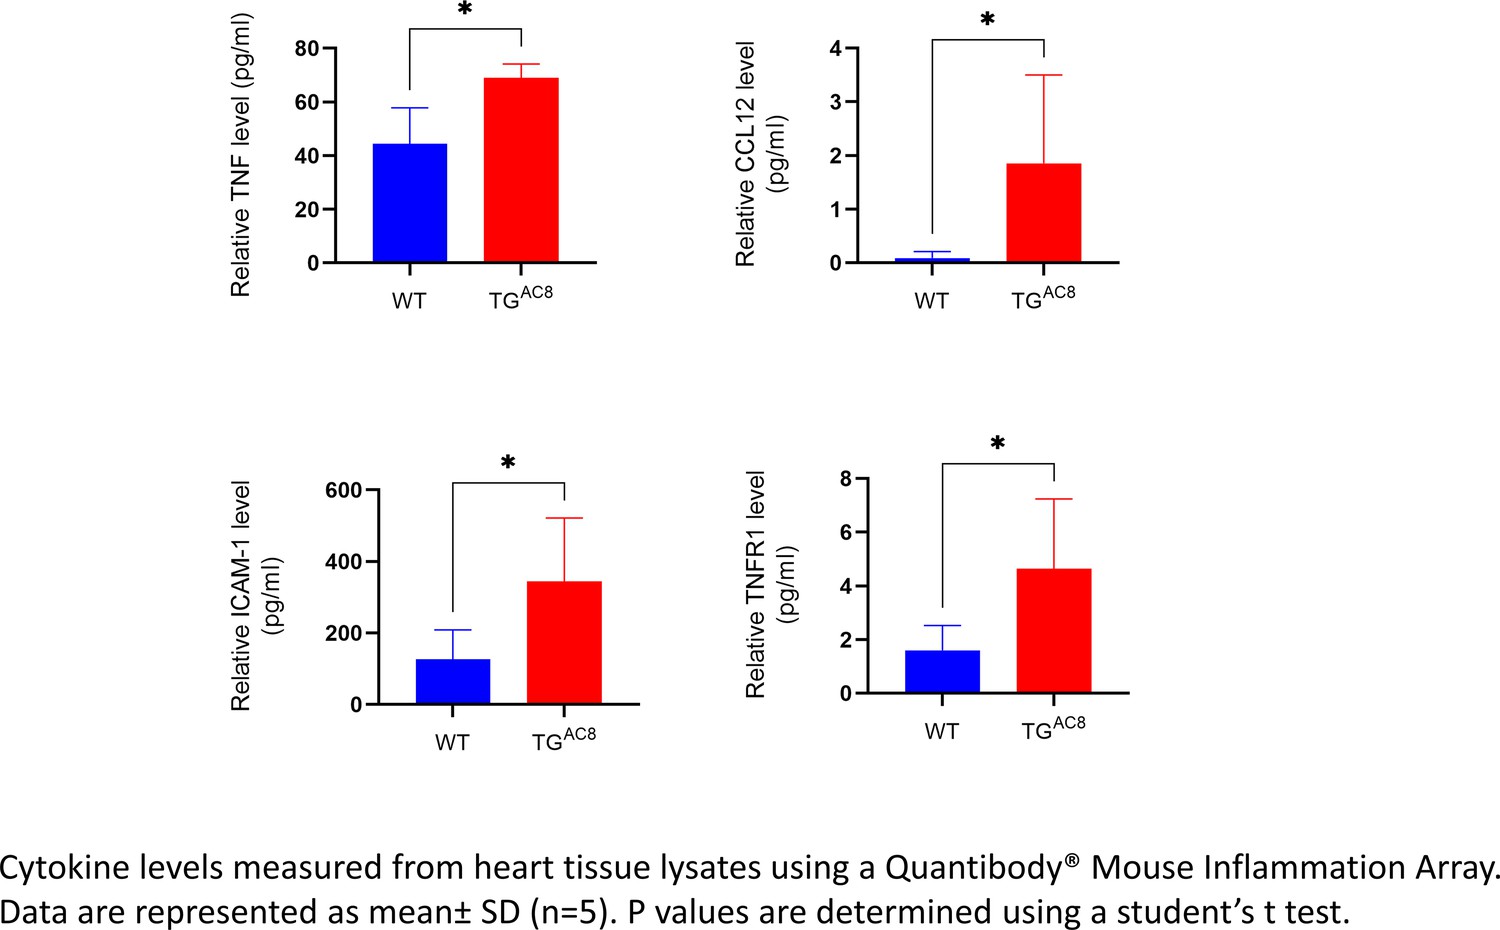
Cytokine levels measured from heart tissue lysates.
The statistical significance is indicated by * p<0.05.
Figure 13—figure supplement 7
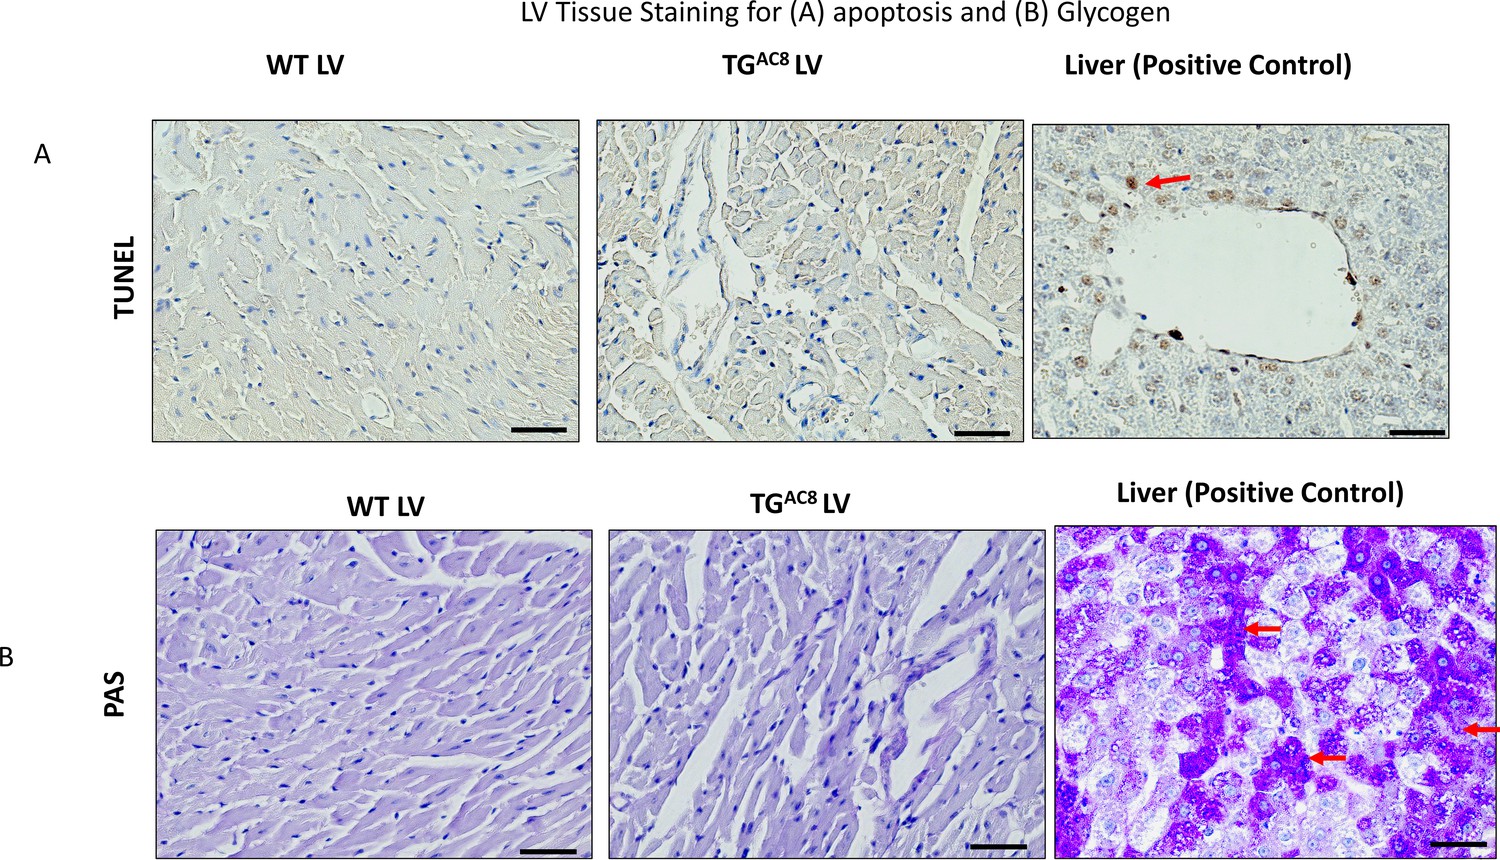
LV tissue staining for apoptosis and glycogen.
Scale bar 100 µm.
Figure 13—figure supplement 8

Periostin levels detected in TGAC8 vs WT LV (growth factor quantibody array).
Data are presented as Mean± SEM (two-tailed t test).
Figure 13—figure supplement 9
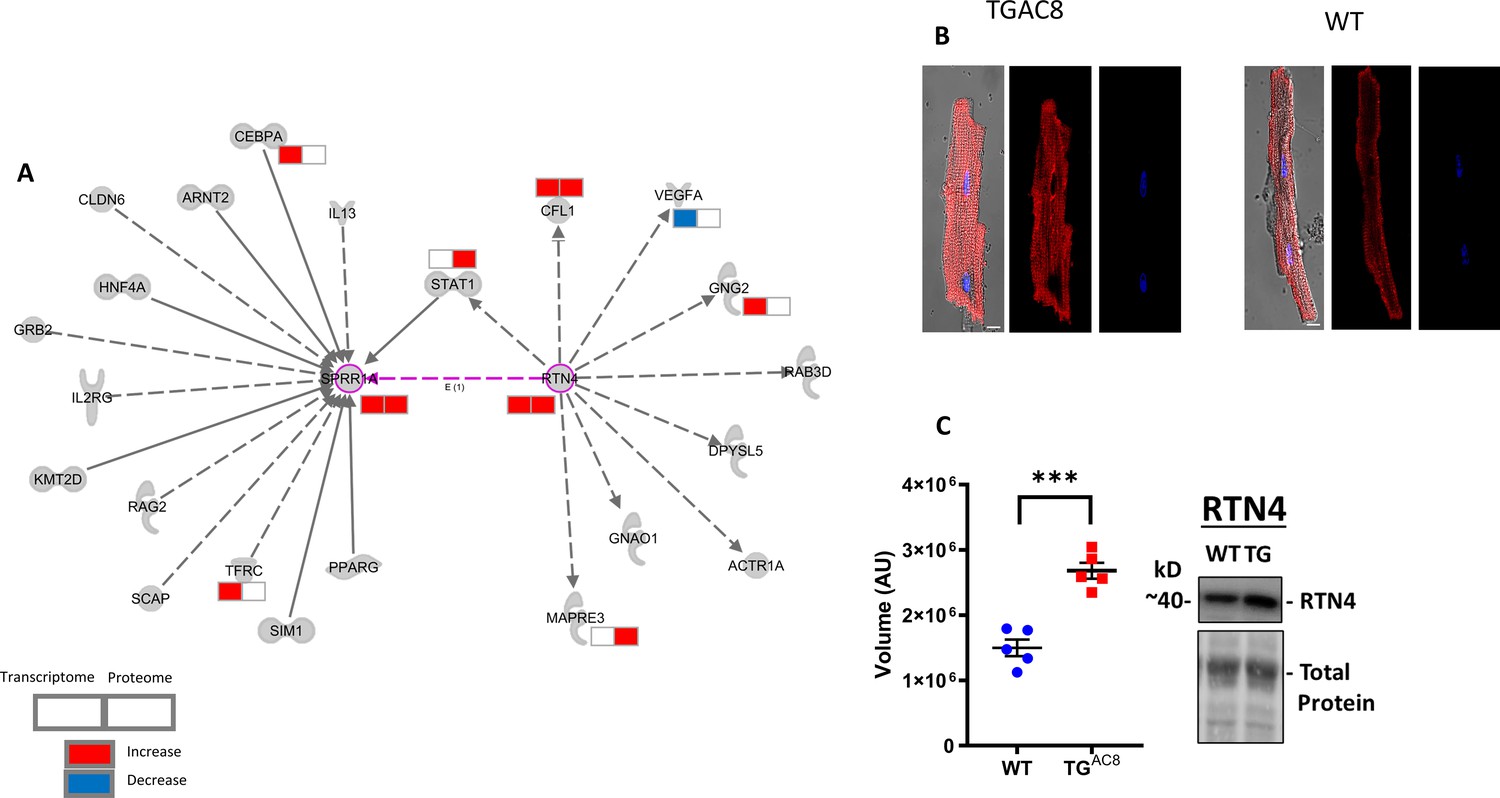
SPRR1A signaling network and Immunolabeling of SPRR1A.
(A) SPRR1A signaling network, (B) Immunolabeling of SPRR1A in isolated LV myocytes, and (C) WB analysis of RTN4 expression. Data are presented as Mean± SEM. The statistical significance is indicated by **** p<0.0001 (two-tailed t test).
Additional files
-
Supplementary file 1
List of: Echo parameters, transcripts and proteins, canonical pathways, cardiovascular disease-related functions within the LV transcriptome and proteome of TGAC8 and WT, RT-qPCR primers and a antibodies used in current study.
(a) List of Echo parameters recorded in TGAC8 heart vs WT. (b) A Listing of all 11810 identified transcripts. (c) A listing of 2323 transcripts that significantly differed in expression by genotype. (d) A listing of all 6834 identified proteins. (e) A listing of 2184 proteins that significantly differed in expression by genotype. (f) A listing of canonical pathways in IPA analysis of the total number of transcripts. (g) A listing of canonical pathways in IPA analysis of the total number of proteins that were differentially enriched or activated in TGAC8 vs WT. (h) A listing of molecules with indication of involvement in number of pathways. (i) A listing of 544 molecules of which both transcripts and proteins differed by genotype. (j) A listing of canonical pathways that were differentially enriched by genotype in IPA analysis of 544 transcripts and proteins. (k) A Complete list of downstream effects of enriched canonical signaling pathways in TGAC8, depicted on Figure 10. (l) RT-qPCR analysis of selected transcripts related to G-protein Coupled Receptor Signaling, that differed by genotype in RNASEQ. (m) Transcripts and proteins involved in Cell Cycle/Cell Proliferation, and Growth and Developmental Circuits that differed between TGAC8 vs WT. (n) IPA representation of top cardiovascular disease-related functions within the LV transcriptome of TGAC8 and WT. (o) IPA representation of top cardiovascular disease-related functions within the LV proteome of TGAC8 and WT. (p) Primers used in RT-qPCR analyses. (q) Antibodies used in WB analyses, antibody arrays and immunostaining.
- https://cdn.elifesciences.org/articles/80949/elife-80949-supp1-v2.xlsx
-
MDAR checklist
- https://cdn.elifesciences.org/articles/80949/elife-80949-mdarchecklist1-v2.docx
Download links
A two-part list of links to download the article, or parts of the article, in various formats.
Downloads (link to download the article as PDF)
Open citations (links to open the citations from this article in various online reference manager services)
Cite this article (links to download the citations from this article in formats compatible with various reference manager tools)
A remarkable adaptive paradigm of heart performance and protection emerges in response to marked cardiac-specific overexpression of ADCY8
eLife 11:e80949.
https://doi.org/10.7554/eLife.80949


