Clonal transcriptomics identifies mechanisms of chemoresistance and empowers rational design of combination therapies
- Cancer Research UK Cambridge Institute, University of Cambridge, Li Ka Shing Centre, Robinson Way, United Kingdom
Figures
Figure 1
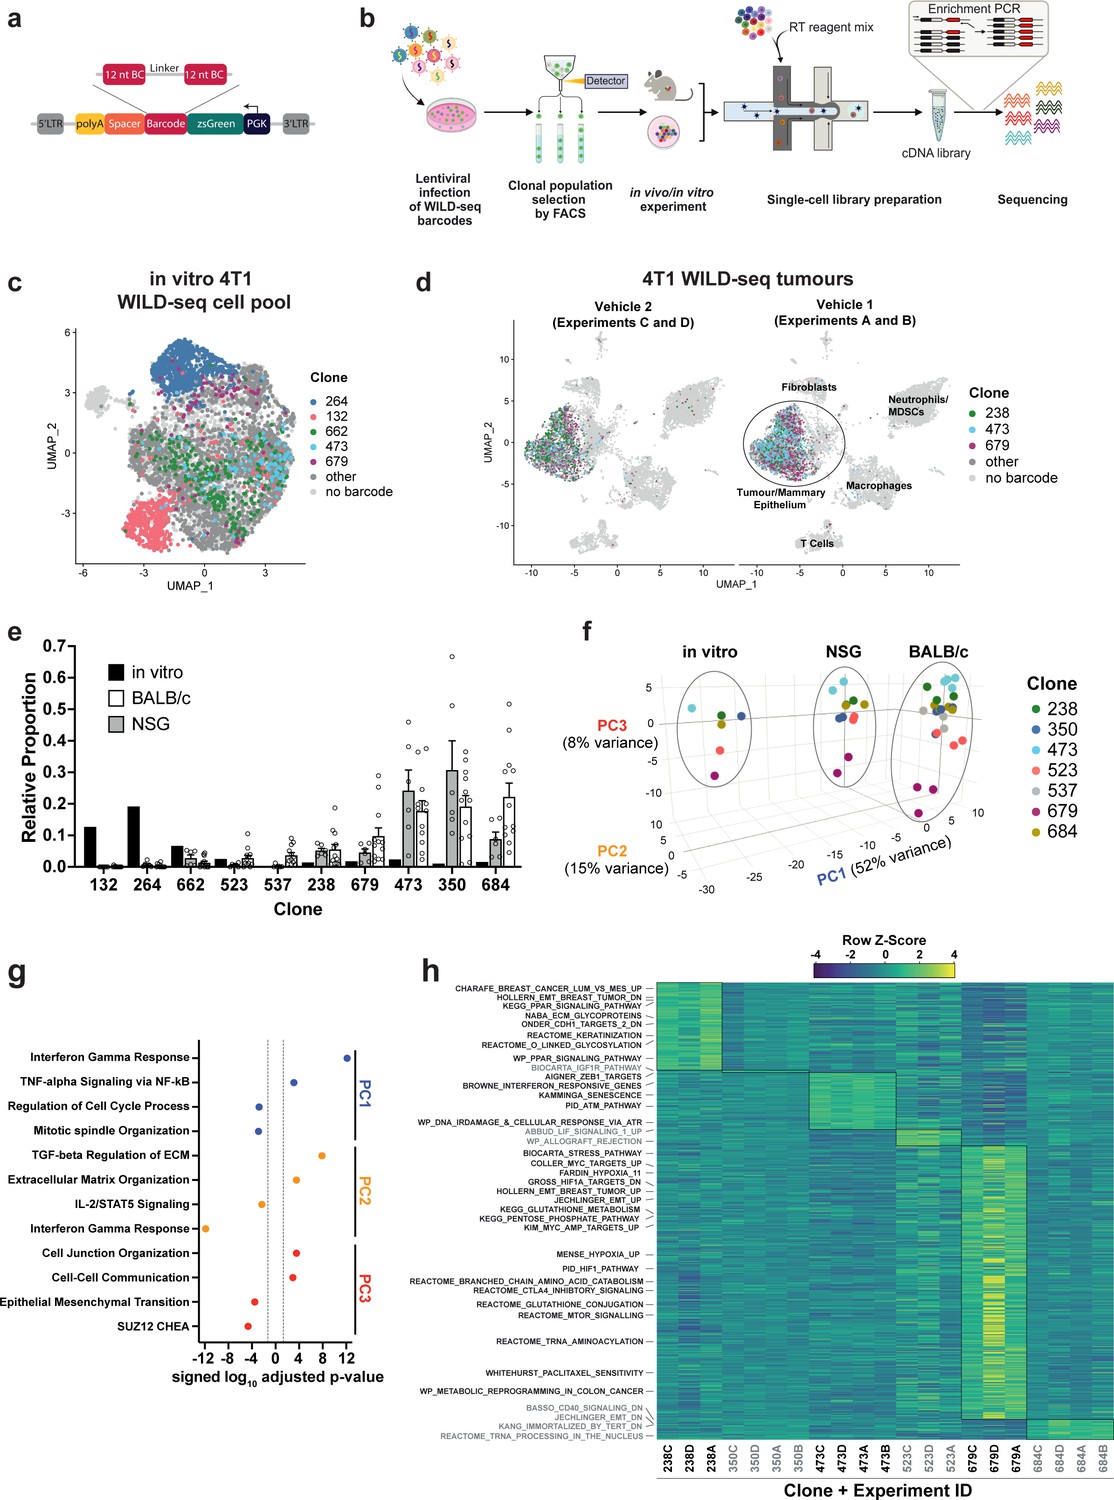
Establishment of an expressed barcode system to simultaneously detect clonal lineage and gene expression from single cells in vivo.
(a) Lentiviral construct design. An attenuated PGK promoter drives expression of a transcript encoding zsGreen and harboring a WILD-seq barcode sequence in the 3′ UTR. A spacer sequence and polyadenylation signal ensure that that the barcode is detectable as part of a standard oligo dT single-cell RNA library preparation and sequencing pipeline. The barcode cassette comprises 2 distinct 12 nucleotide barcode sequences separated by a constant 20 nucleotide linker region. The library of barcode sequences was designed with Hamming distance 5 to allow for sequencing error correction. (b) Schematic of WILD-seq method. Tumour cells are infected with the WILD-seq lentiviral library and an appropriate size population of zsGreen positive cells isolated, each of which will express a single unique WILD-seq barcode. This WILD-seq barcoded, heterogenous cell pool is then subjected to an intervention of interest (such as in vivo treatment of the implanted pool with a therapeutic agent) and subsequently analysed by single cell RNA sequencing using the 10x Genomics platform. An additional PCR amplification step is included that specifically enriches for the barcode sequence to increase the number of cells to which a WILD-seq barcode can be conclusively assigned. (c) scRNA-seq of in vitro 4T1 WILD-seq cell pool. UMAP plot of in vitro cultured 4T1 WILD-seq cells. Cells for which a WILD-seq clonal barcode is identified are shown as dark grey or coloured spots. Cells which belong to five selected clonal lineages are highlighted. (d) scRNA-seq of 4T1 WILD-seq tumours. UMAP plots of vehicle-treated 4T1 WILD-seq tumours generated by injecting the 4T1 WILD-seq pool into the mammary fatpad of BALB/c mice. Four independent experiments were performed each involving injection into three separate host animals. Six animals from experiments A and B received vehicle 1 (10% DMSO, 0.9% β-cyclodextrin) and six animals from experiments C and D received vehicle 2 (12.5% ethanol, 12.5% Kolliphor). (e) Clonal representation. Proportion of tumour cells assigned to each clonal lineage based on the WILD-seq barcode (n=1 for in vitro cultured cells, n=6 for tumours from NSG mice, n=12 for vehicle-treated tumours from BALB/c mice). Selected clones from the most abundant lineages are plotted. Data represents mean ± SEM. (f) Principal component analysis of clonal transcriptomes. Pseudo-bulk analysis was performed by summing counts for all tumour cells expressing the same WILD-seq clonal barcode within an independent experiment. For in vivo tumour samples each point represents the combined cells from three animals. Principal component analysis of normalized pseudo-bulk count data showed separation of samples by origin with PC1 and PC2 and separation by clonality with PC3. (g) Transcriptomic programs associated with principal components. The top/bottom 50 gene loadings of PC1, PC2, and PC3 were analyzed using Enrichr (Chen et al., 2013; Kuleshov et al., 2016; Xie et al., 2021). (h) Clonal transcriptomic signatures from vehicle-treated BALB/c tumours. An AUCell score (Aibar et al., 2017) enrichment was calculated for each clone and for each experiment by comparing cells of a specific clonal lineage of interest to all assigned tumour cells within the same experiment. All gene sets which showed consistent and statistically significant enrichment in one of the six most abundant clones across experiments are illustrated.
Figure 2 with 1 supplement
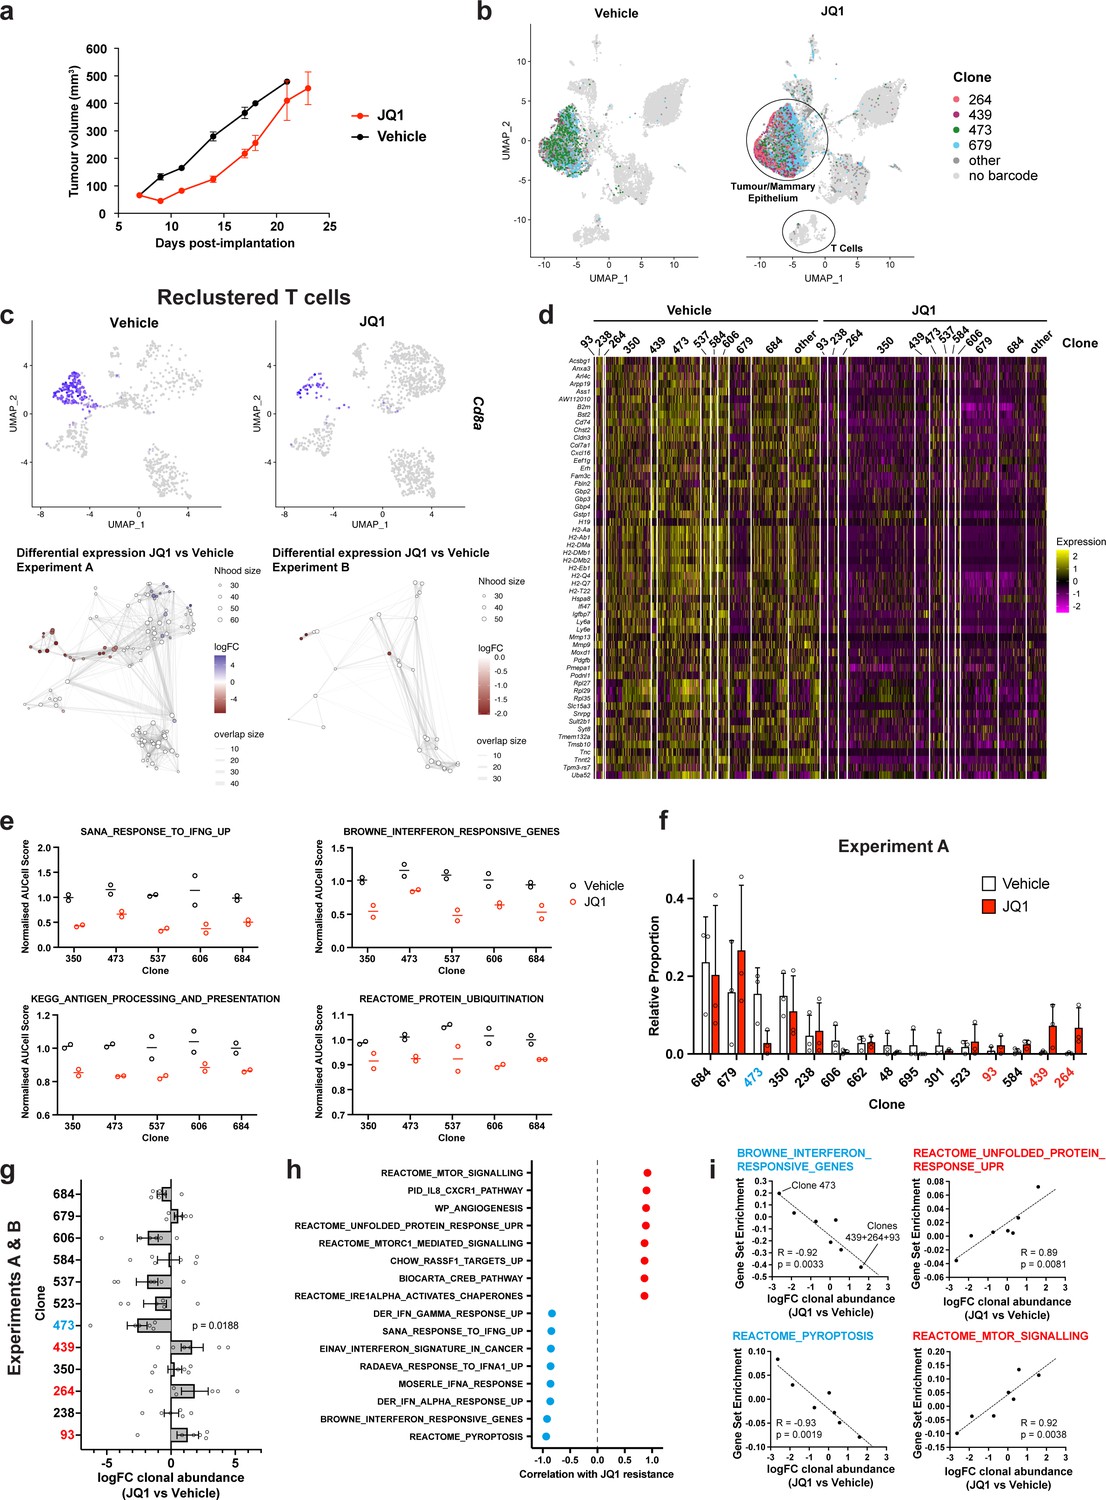
Simultaneous detection of changes in clonal abundance, gene expression, and tumour microenvironment in response to BET bromodomain inhibition with WILD-seq.
(a) Tumour growth curves with JQ1 treatment. 4T1 WILD-seq tumours were treated with the BET bromodomain inhibitor JQ1 or vehicle from 7 days post-implantation until endpoint (n=4 mice per condition). 75 mg/kg JQ1 (dissolved in DMSO and diluted 1:10 in 10% β-cyclodextrin) 5 days/week (5 consecutive days followed by 2 days off). Data represents mean ± SEM. (b) scRNA-seq of JQ1-treated 4T1 WILD-seq tumours. UMAP plots of vehicle- or JQ1-treated 4T1 WILD-seq tumours. Combined cells from 2 independent experiments, each with 3 mice per condition are shown. Cells for which a WILD-seq clonal barcode is identified are shown as dark grey or coloured spots. Cells which belong to four selected clonal lineages are highlighted. (c) JQ1 treatment results in a reduction in Cd8+ T cells within 4T1 tumours. Cells belonging to the T-cell compartment were computationally extracted from the single cell data and reclustered. Upper panels show combined UMAP plots from experiments A and B with Cd8a expression per cell illustrated enabling identification of the Cd8+ T cell cluster. Lower panels show neighbourhood graphs of the results from differential abundance testing using Milo (Dann et al., 2022). Coloured nodes represent neighbourhoods with significantly different cell numbers between conditions (FDR <0.05) and the layout of nodes is determined by the position of the neighbourhood index cell in the UMAP panel above. Experiments A and B were analysed separately due to differences in cell numbers. (d) Differential gene expression between JQ1- and vehicle-treated tumour cells. Single cell heatmap of expression for genes which are significantly and consistently down-regulated across clonal lineages (combined fisher p-value <0.05 and mean logFC <–0.2 for both experiments).1600 cells are represented (400 per experiment/condition), grouped according to their clonal lineage. (e) Differential gene set expression between JQ1 and vehicle-treated tumour cells. Median AUCell score per experiment/condition for selected gene sets. The five clonal lineages with the highest representation across experiments are shown. (f) Clonal representation. Proportion of tumour cells assigned to each clonal lineage in experiment A based on the WILD-seq barcode (n=3 tumours per condition). Clones which make up at least 2% of the assigned tumour cells under at least one condition are plotted. The most sensitive clone 473 is highlighted in blue and the most resistant clones 93, 439, 264 are highlighted in red. Data represents mean ± SD. (g) Clonal response to JQ1-treatment. Log2 fold change in clonal proportions upon JQ1 treatment across experiments A and B. Fold change was calculated by comparing each JQ1-treated sample with the mean of the three corresponding vehicle-treated samples from the same experiment. p-value calculated by one-sample t-test vs a theoretical mean of 0. Data represents mean ± SEM. (h and i) Correlation of JQ1-response with baseline clonal transcriptomic signatures. Clonal gene set enrichment scores for vehicle-treated tumours were calculated by comparing cells of a specific clonal lineage of interest to all assigned tumour cells within the same experiment. Correlation between these scores and JQ1-treatment response (mean log2 fold change clonal proportion JQ1 vs vehicle) was then calculated for each gene set. Selected gene sets with the highest positive or negative correlation values (Pearson correlation test) are shown. A positive correlation indicates a higher expression in resistant clones, whereas a negative correlation indicates a higher expression in sensitive clones. Resistant clonal lineages identified by barcodes 93, 264, and 439 were combined for the purpose of this analysis to have enough cells for analysis within the vehicle-treated samples.
Figure 2—figure supplement 1
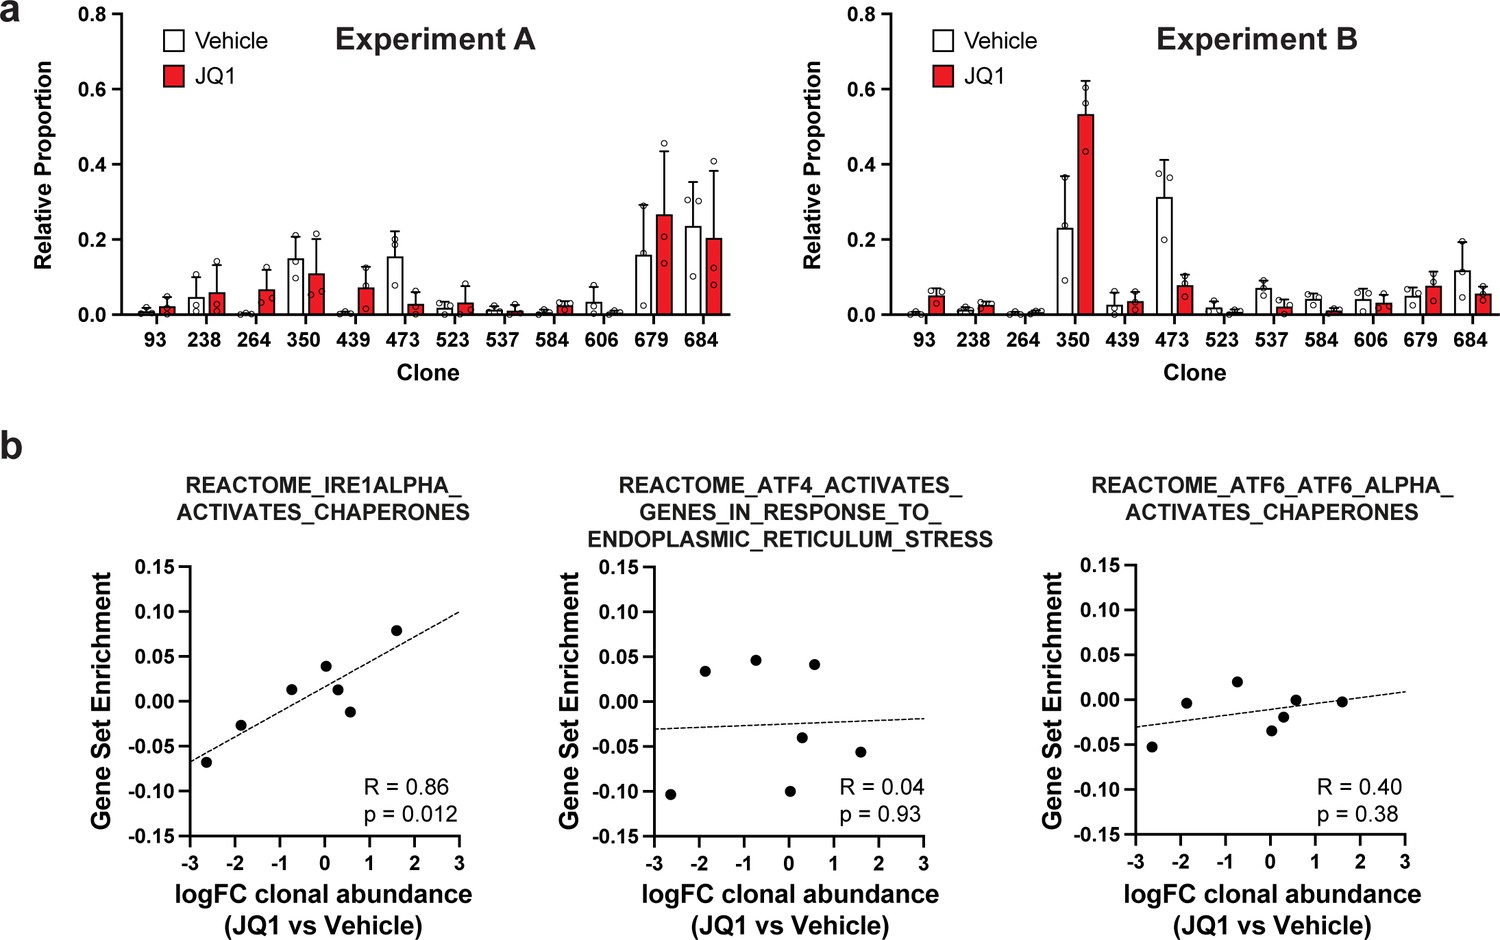
Clonal representation (related to Figure 2g) and correlation of individual UPR pathways with JQ1 response (related to Figure 2i).
(a) Clonal representation (related to Figure 2g). Proportion of tumour cells assigned to each clonal lineage in experiments A and B based on the WILD-seq barcode (n=3 tumours per condition). Clones for which clonal response to JQ1 treatment is plotted in Figure 2g are shown. Data represents mean ± SD. (b) JQ1 response correlates with IRE1 unfolded protein response pathway activity (related to Figure 2i). Gene sets from the Reactome pathway database which represent the three major signalling pathways involved in activation of the unfolded protein response: IRE1, ATF4/PERK and ATF6 were selected. Clonal gene set enrichment scores for these gene sets were calculated from vehicle-treated tumours by comparing cells of a specific clonal lineage of interest to all assigned tumour cells within the same experiment. The correlation between these scores and JQ1-treatment response (mean log2 fold change clonal proportion JQ1 vs vehicle) is plotted. Only the IRE1 pathway was significantly correlated with JQ1 response (Pearson correlation test).
Figure 3 with 1 supplement
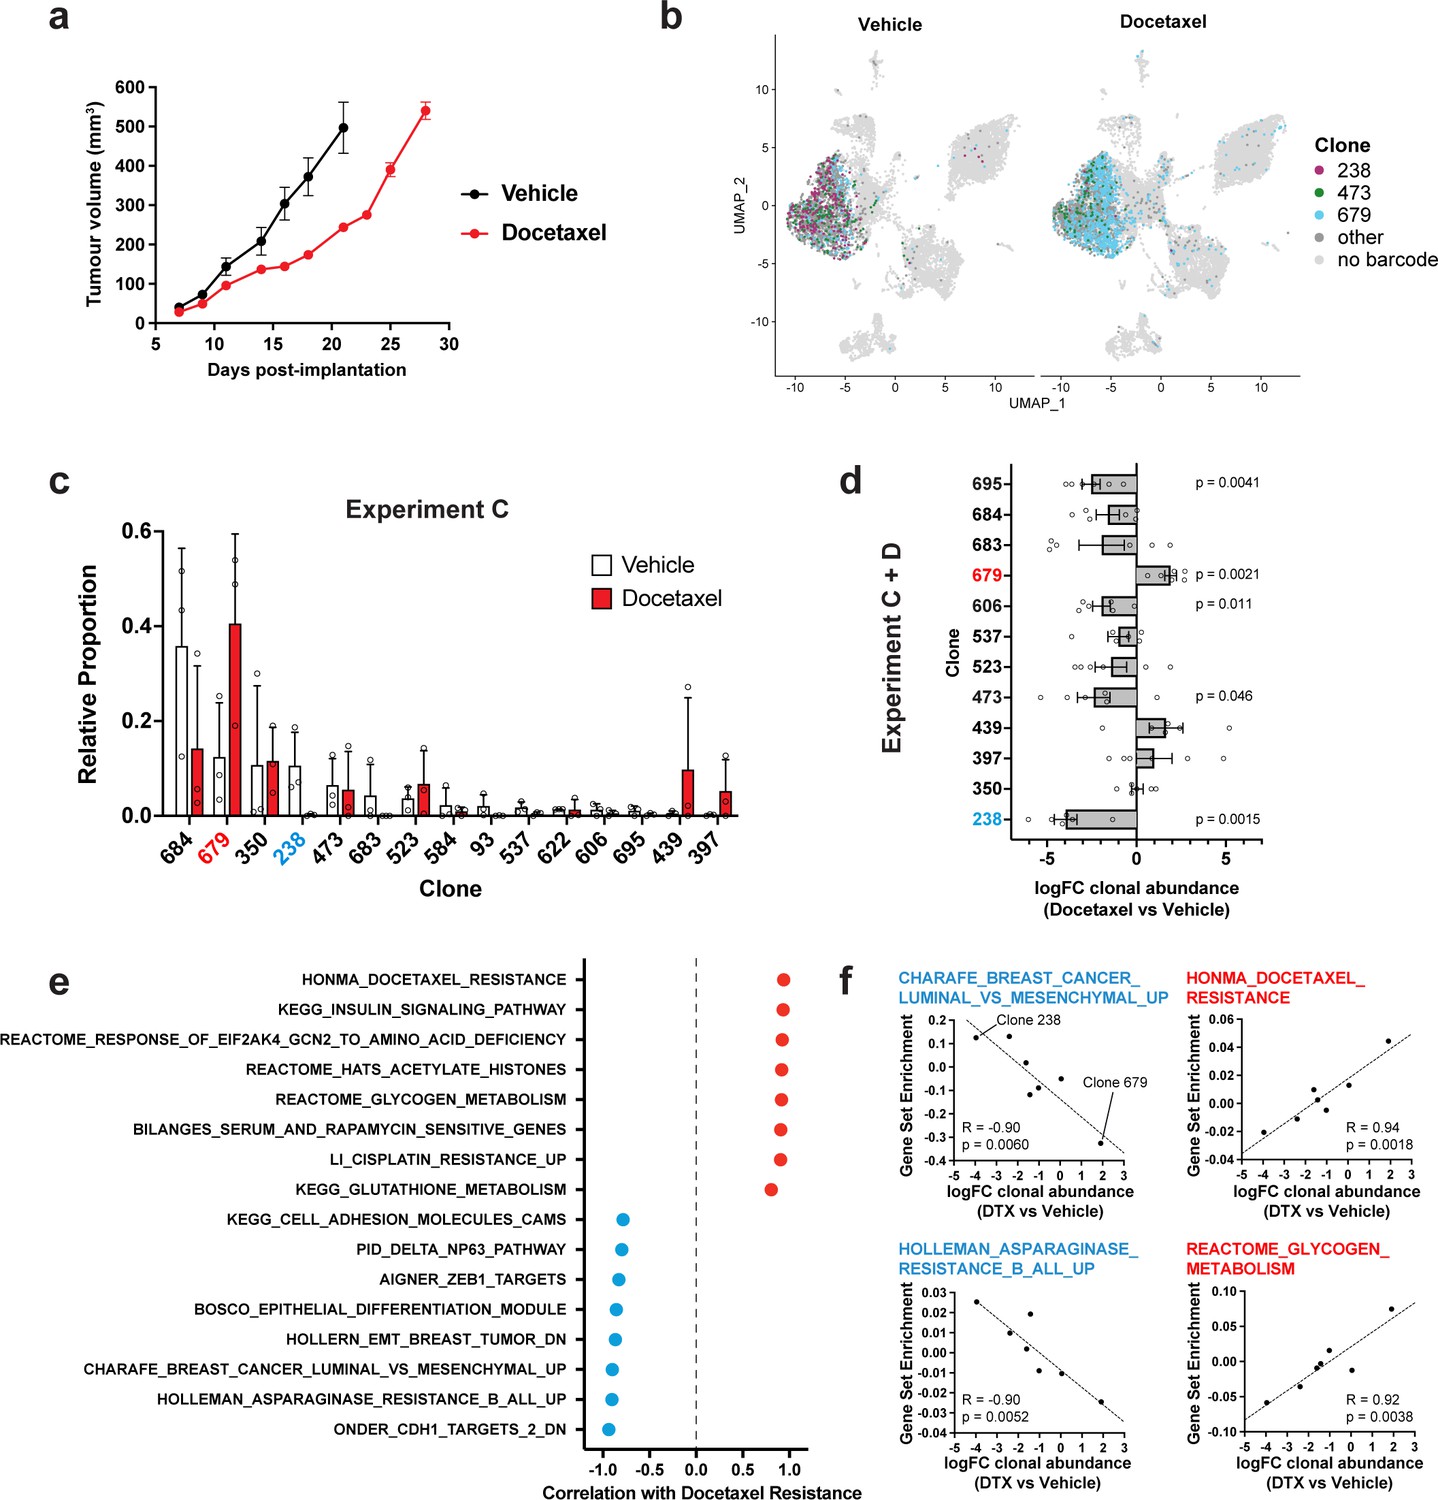
Clonal transcriptomic correlates of response and resistance to taxane chemotherapy in the 4T1 mammary carcinoma model.
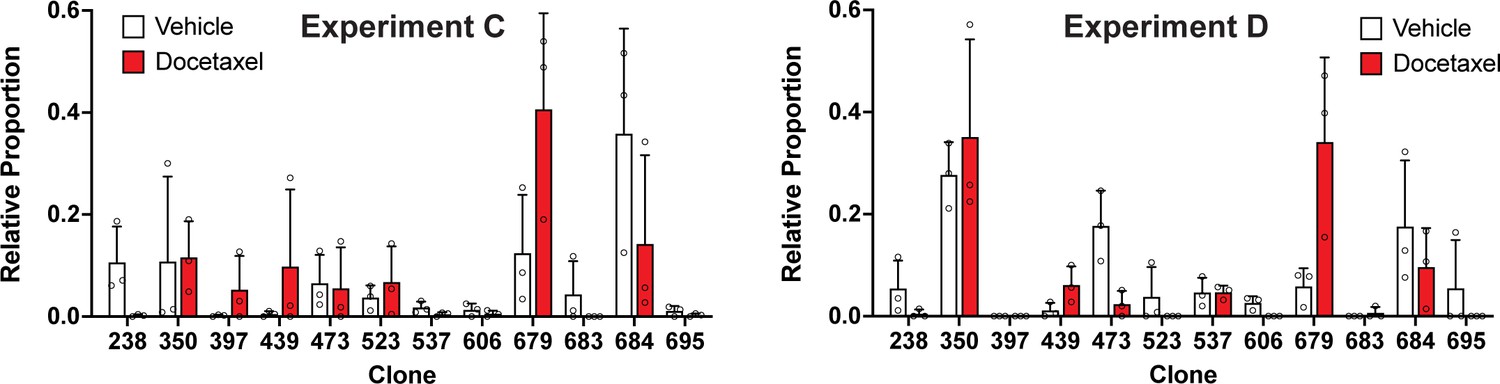
(a) Tumour growth curves with docetaxel treatment. 4T1 WILD-seq tumours were treated with docetaxel or vehicle (12.5% ethanol, 12.5% Kolliphor) from 7 days post-implantation for 2 weeks (n=5 mice per condition). Dosing regimen was 12.5 mg/kg docetaxel three times per week. Data represents mean ± SEM. (b) scRNA-seq of docetaxel-treated 4T1 WILD-seq tumours. UMAP plots of vehicle- or docetaxel-treated 4T1 WILD-seq tumours. Combined cells from 2 independent experiments, each with 3 mice per condition are shown. Cells for which a WILD-seq clonal barcode is identified are shown as dark grey or coloured spots. Cells which belong to three selected clonal lineages are highlighted. (c) Clonal representation. Proportion of tumour cells assigned to each clonal lineage in experiment C based on the WILD-seq barcode (n=3 tumours per condition). Clones which make up at least 2% of the assigned tumour cells under at least one condition are plotted. The most sensitive clone 238 is highlighted in blue and the most resistant clone 679 is highlighted in red. Data represents mean ± SD. (d) Clonal response to docetaxel-treatment. Log2 fold change in clonal proportions upon docetaxel treatment across experiments C and D. Fold change was calculated by comparing each docetaxel-treated sample with the mean of the three corresponding vehicle-treated samples from the same experiment. p-values calculated by one-sample t-test vs a theoretical mean of 0. Data represents mean ± SEM. (e and f) Correlation of docetaxel-response with baseline clonal transcriptomic signatures. Clonal gene set enrichment scores for vehicle-treated tumours were calculated by comparing cells of a specific clonal lineage of interest to all assigned tumour cells within the same experiment. Correlation between these scores and docetaxel-treatment response (mean log2 fold change clonal proportion docetaxel vs vehicle) was then calculated for each gene set. Selected gene sets with the highest positive or negative correlation values (Pearson correlation test) are shown. A positive correlation indicates a higher expression in resistant clones, whereas a negative correlation indicates a higher expression in sensitive clones.
Figure 3—figure supplement 1
Clonal representation (related to Figure 3d).
Proportion of tumour cells assigned to each clonal lineage in experiments C and D based on the WILD-seq barcode (n=3 tumours per condition). Clones for which clonal response to docetaxel treatment is plotted in Figure 3d are shown. Data represents mean ± SD.
Figure 4
Clonal transcriptomic signatures of response and resistance to taxane chemotherapy in the D2A1-m2 mammary carcinoma model.
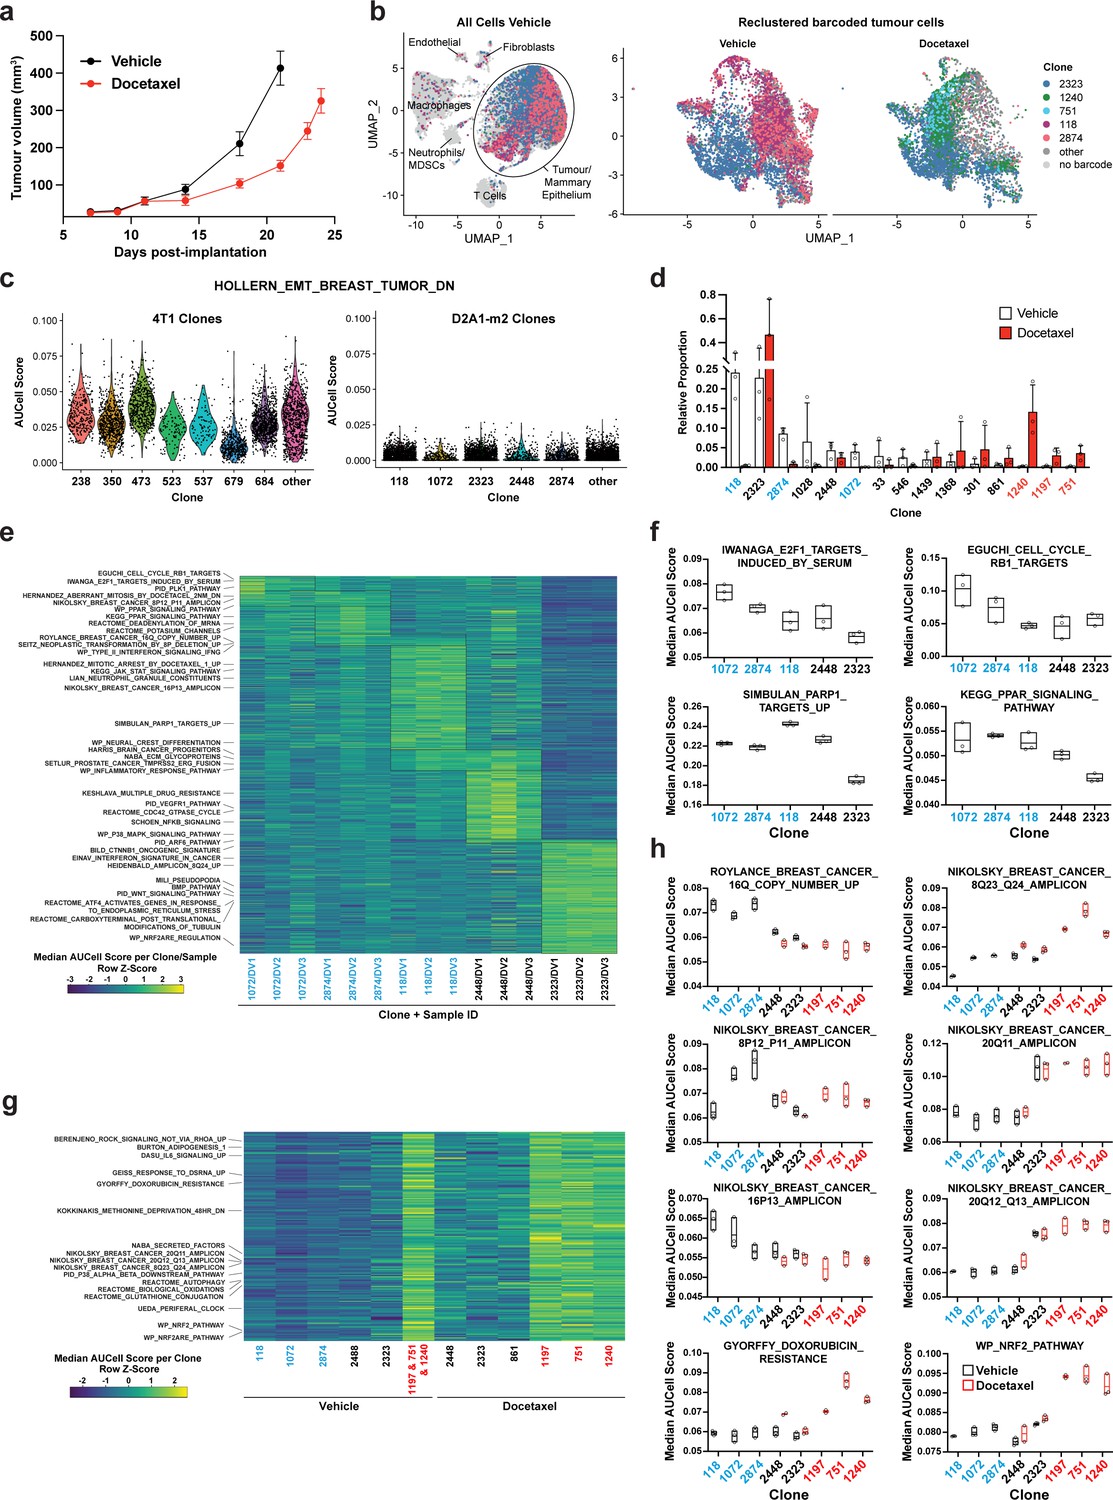
(a) D2A1-m2 WILD-seq tumour growth curves with docetaxel treatment. D2A1-m2 WILD-seq tumours were treated with docetaxel or vehicle from 7 days post-implantation for 2 weeks (n=5 vehicle-treated mice, n=4 docetaxel-treated mice). Dosing was performed as in Figure 3a for 4T1 tumours. Data represents mean ± SEM. (b) scRNA-seq of docetaxel-treated D2A1-m2 WILD-seq tumours. UMAP plots of vehicle-treated D2A1-m2 WILD-seq tumours (left panel) and reclustered barcoded tumour cells (right panel) from vehicle- and docetaxel-treated tumours. Combined cells from 3 mice per condition are shown. Cells for which a WILD-seq clonal barcode is identified are shown as dark grey or coloured spots. Cells which belong to five selected clonal lineages are highlighted. (c) Comparison of EMT status of major 4T1 and D2A1-m2 WILD-seq clones. Violin plot of AUCell scores from vehicle-treated tumour cells generated using the HOLLERN_EMT_BREAST_TUMOR_DN (Hollern et al., 2018) gene set, a set of genes that have low expression in murine mammary tumours of mesenchymal histology. 4T1 WILD-seq clones exhibit varying levels of expression of this gene set, whereas D2A1-m2 WILD-seq clones have consistently low levels of expression of these genes. (d) Clonal representation. Proportion of tumour cells assigned to each clonal lineage based on the WILD-seq barcode (n=3 tumours per condition). Clones which make up at least 2% of the assigned tumour cells under at least one condition are plotted. The most sensitive clones to docetaxel treatment 118, 2874, and 1072 are highlighted in blue and the most resistant clones 1240, 1197, and 751 are highlighted in red. Data represents mean ± SD. (e) Clonal transcriptomic signatures from vehicle-treated tumours. Heatmap of median AUCell scores per sample for each of the five most abundant clones. All gene sets which showed consistent and statistically significant enrichment (combined fisher p-value <0.01 & mean log2 enrichment >0.1) in at least one of these clones are illustrated. (f) Selected gene sets whose expression is associated with sensitivity to docetaxel. Median AUCell scores per sample for each of the five most abundant clones is plotted. (g) Transcriptomic signatures associated with resistance to docetaxel. For vehicle-treated tumours, resistant clonal lineages identified by barcodes 1197, 751, and 1240 were combined to have enough cells for analysis. Gene sets with significantly enriched expression in these resistant clones in vehicle-treated tumours were determined (adjusted p-value <0.01 and log2 enrichment >0.1). A heatmap of median AUCell scores per clone, per condition of these resistance-associated gene sets is plotted. (h) Selected gene sets whose expression is enriched or depleted in resistant clones. Median AUCell scores per clone, per sample are plotted for samples with at least 20 cells per clone. Due to changes in clonal abundance with treatment, and our analysis cut-offs, some clones can only be assessed under vehicle- or docetaxel-treated conditions.
Figure 5
Delineating the contribution of clonal abundance to gene expression changes upon drug treatment.
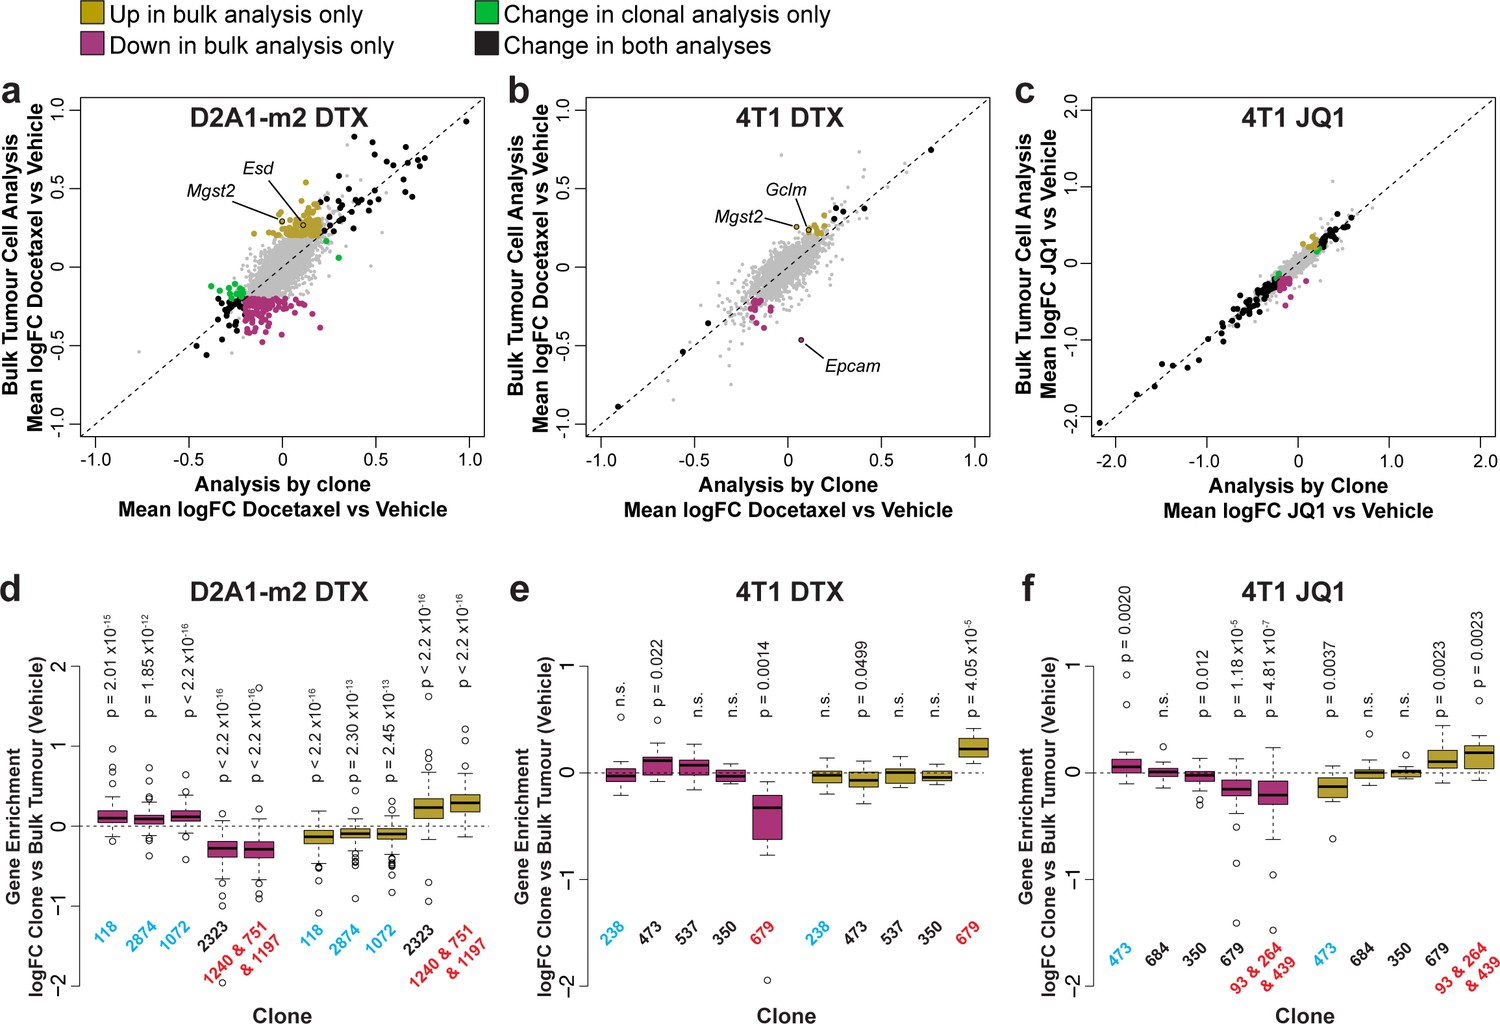
(a and b and c) Comparison of differential gene expression analysis in bulk tumour cells and intra-clonal changes in gene expression. Differential gene expression was performed for all barcoded tumour cells irrespective of clonal lineage comparing chemotherapy-treated and vehicle-treated cells (bulk tumour cell analysis). Alternatively differential gene expression was performed for each individual clone separately and the results combined to identify genes which robustly undergo intra-clonal changes in expression (analysis by clone). Whereas bulk tumour cell analysis will identify changes in overall gene expression due to both changes in clonal abundance and changes within the cells, analysis by clone enables us to delineate exclusively induced cellular changes in gene expression. Log2 fold change in expression as determined by each of these analysis methods is plotted. Genes with significant changes in expression with chemotherapy (p-value <0.05, logFC <–0.2 or>0.2) are highlighted based on the method under which they were identified. Genes identified as significantly changing by one method only met neither logFC nor p-value cutoffs in the alternative method. (d and e and f) Changes in gene expression that are identified by bulk tumour cell analysis only can be attributed to changes in clonal abundance. The expression of genes which were identified as differential expressed after chemotherapy only in the bulk tumour cell analysis was assessed across clonal lineages at baseline. Baseline gene enrichment for each clone was determined as described previously by comparing cells of a specific clonal lineage to all barcoded tumour cells within the same vehicle-treated sample or experiment. Gene enrichment values for all genes with differential expression only in the bulk tumour cell analysis were plotted. As expected, genes down-regulated in bulk analysis have lower expression in resistant clones, whereas genes up-regulated in bulk analysis are enriched in resistant clones. p-values represent a one sample t-test vs a theoretical mean of 0.
Figure 6 with 1 supplement
Taxane-resistant clones have elevated NRF2 signaling.
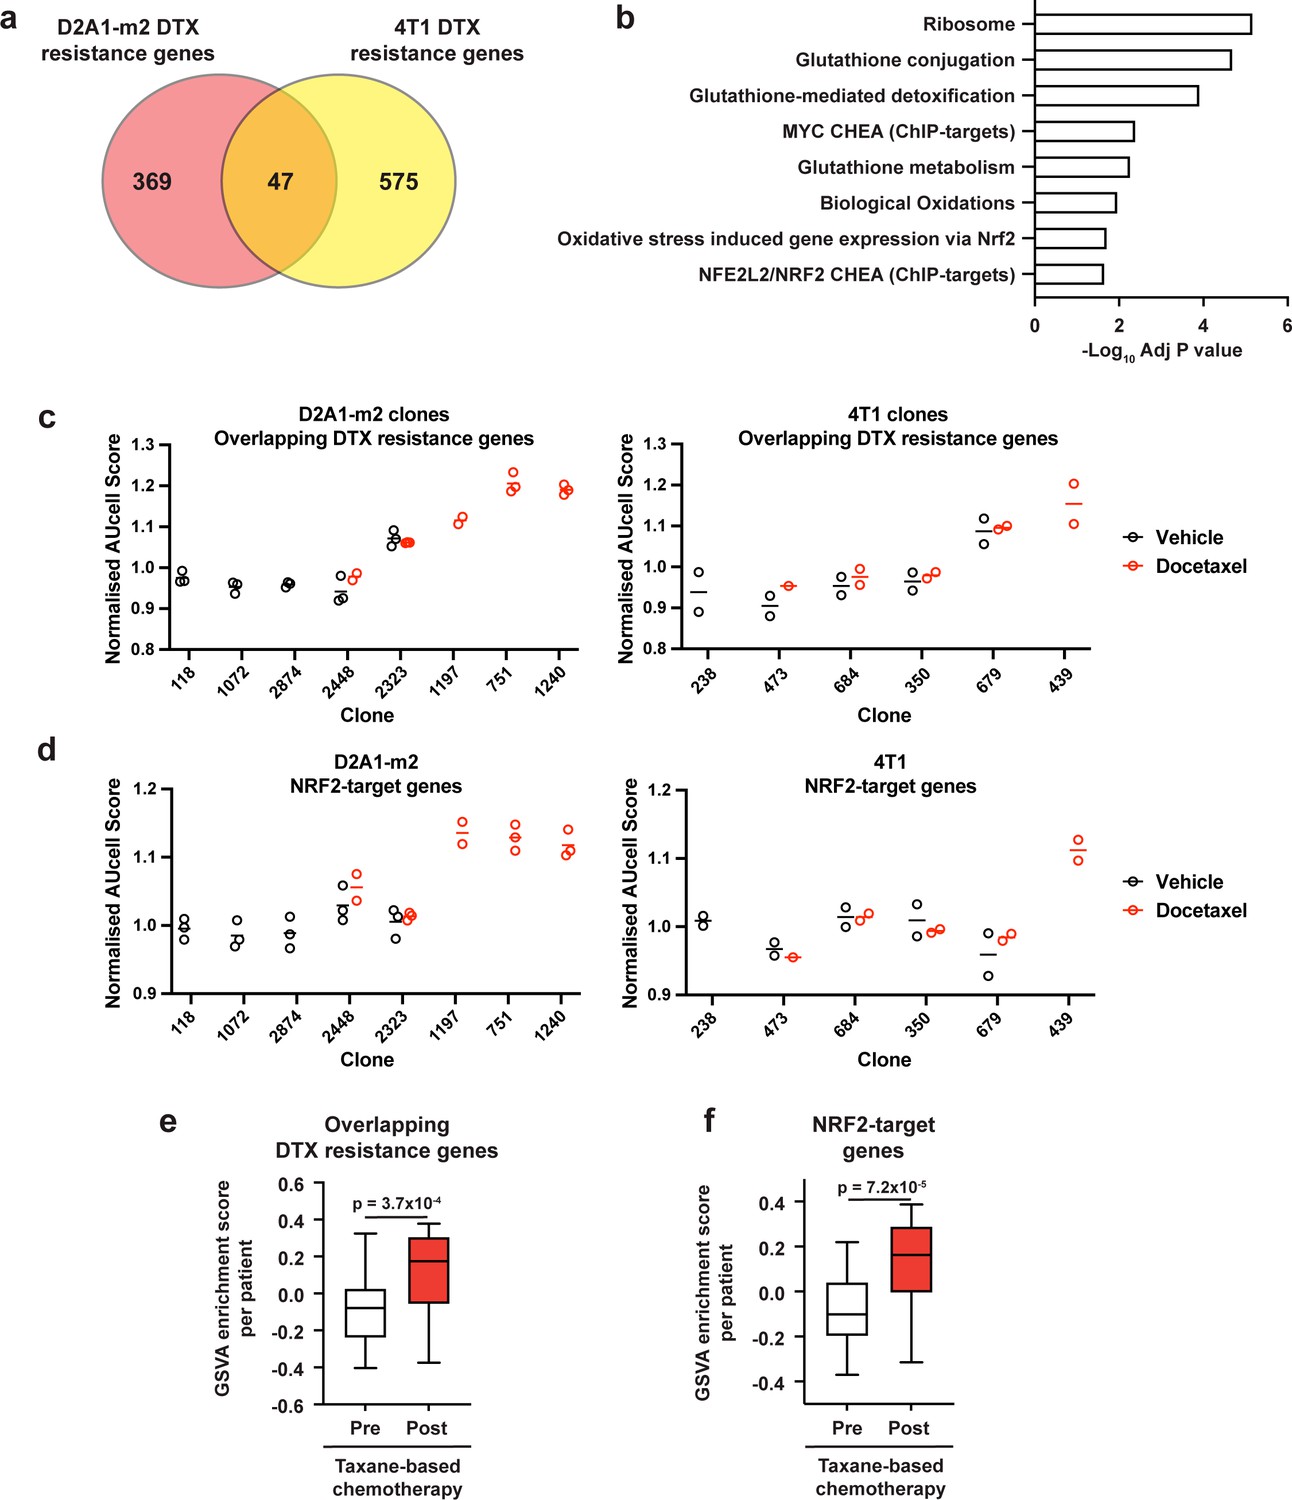
(a) Overlap of genes associated with resistance between the D2A1-m2 and 4T1 WILD-seq models. 4T1 resistance genes were defined as those that were significantly enriched in resistant clone 679 but not in sensitive clone 238 (p<0.05). D2A1-m2 resistance genes were defined as those that were significantly enriched in combined resistant clones 1240, 751, and 1197 but not in sensitive clones 118, 2874, or 1072 (p<0.05). In all cases resistance genes were defined from vehicle treated tumours. (b) Gene set enrichment analysis of overlapping resistance genes. Gene set enrichment was performed using Enrichr for the human orthologs of the 47 overlapping resistance genes identified in a. Adjusted p-values for a subset of significant gene sets are plotted. (c) Our docetaxel resistance gene set identifies resistant clones. Our 47 overlapping docetaxel resistance genes were used as a gene set to calculate an AUCell expression score per clone, per sample (D2A1-m2) or per experiment (4T1). Normalised median AUCell scores are plotted for clones of interest. Data points were included if they represented at least 20 single cells. (d) NRF2-targets defined by ChIP have elevated expression in the most docetaxel resistant clones. NRF2 targets were taken from the ChEA (ChIP Enrichment Analysis) database and their expression measured across clones of interest. Normalised median AUCell scores are plotted for clones of interest. (e) Expression of our identified resistance genes is increased in human breast tumours following docetaxel treatment. Expression of our 47 overlapping resistance genes was assessed in human breast cancer samples taken before and after taxane-based neoadjuvant chemotherapy (GSE28844). GSVA enrichment scores for our gene set was calculated for samples from 28 patients for which matched pre- and post-treatment gene expression data were available. Patients received one of three taxane-containing treatment regimens; Regimen A: Epirubicin 90 mg/m2-Cyclophosphamide 600 mg/m2, 3 cycles bi-weekly and Paclitaxel 150 mg/m2-Gemcitabine 2500 mg/m2, 6 cycles bi-weekly ±weekly Herceptin 4 mg/Kg during the first week, 2 mg/Kg for the remaining 11 cycles. Regimen B: Doxorubicin 60 mg/m2-Pemetrexed 500 mg/m2, 4 cycles tri-weekly and Docetaxel 100 mg/m2, 4 cycles tri-weekly. Regimen C: Doxorubicin 60 mg/m2-Cyclophosphamide 600 mg/m2, 4 cycles tri-weekly and Docetaxel 100 mg/m2, 4 cycles tri-weekly. Expression of our overlapping resistance gene set was significantly increased after chemotherapy in human samples. p-value calculated by paired t-test. (f) NRF2-target genes are upregulated in human patients following neoadjuvant chemotherapy. GSVA enrichment scores for NRF2-target genes (NFE2L2 CHEA consensus CHIP-targets) were calculated for samples from 28 patients in the GSE28844 dataset for which pre- and post-treatment gene expression data were available. p-values calculated by paired t-test.
Figure 6—figure supplement 1
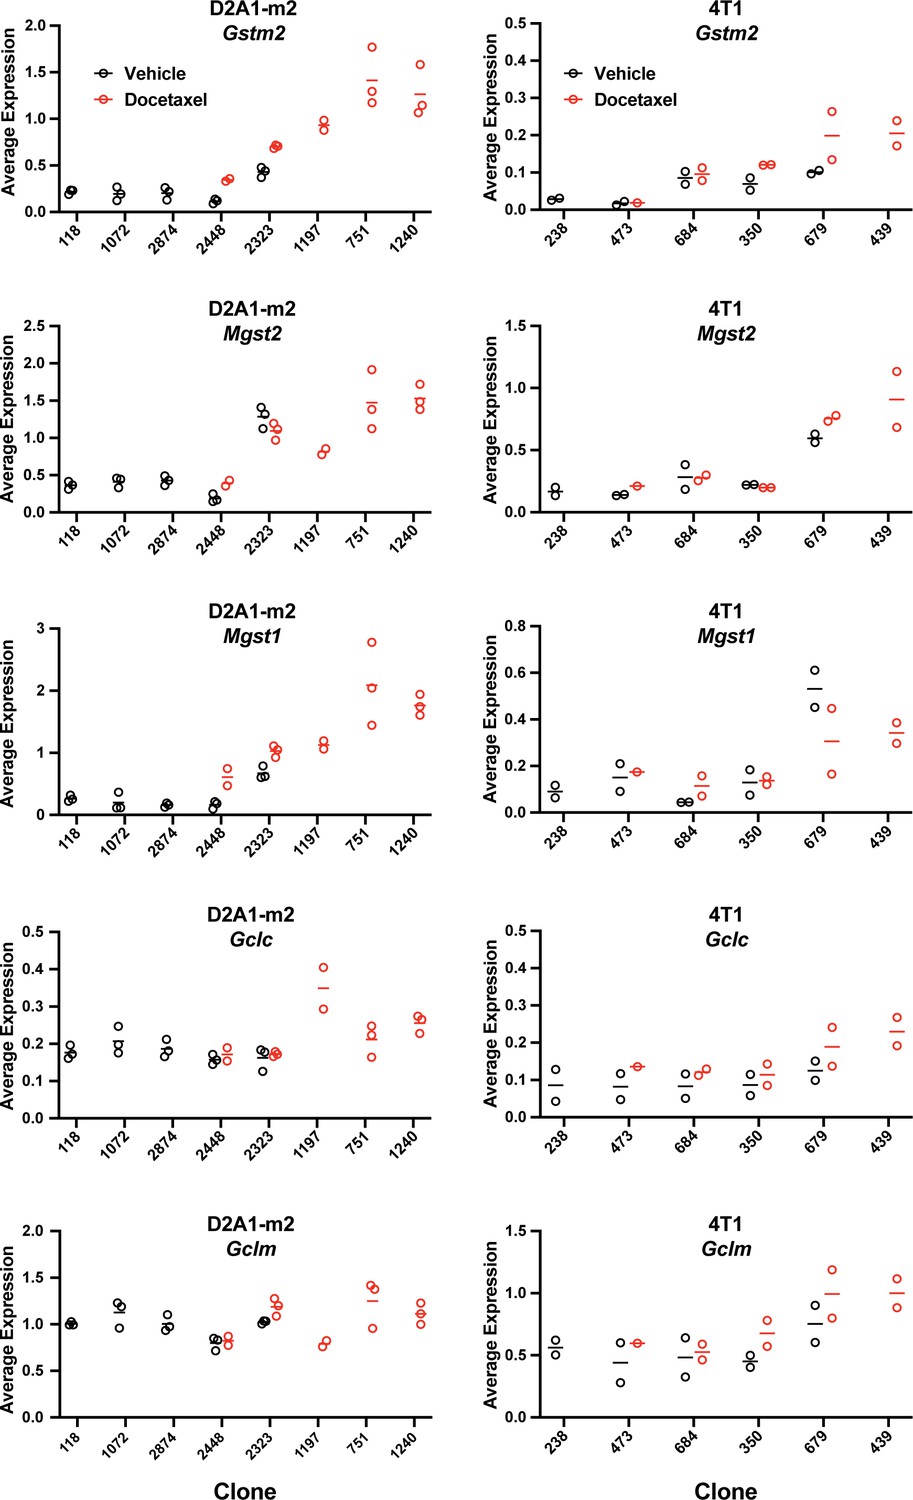
Expression of bona fide transcriptional targets of NRF2 involved in ROS detoxification (Gstm2, Mgst2, Mgst1) and glutathione production (Gclc, Gclm) (related to Figure 6d).
Gene expression was calculated per clone, per sample (D2A1-m2) or per experiment (4T1) using the AverageExpression function from the Seurat package.
Figure 7 with 2 supplements
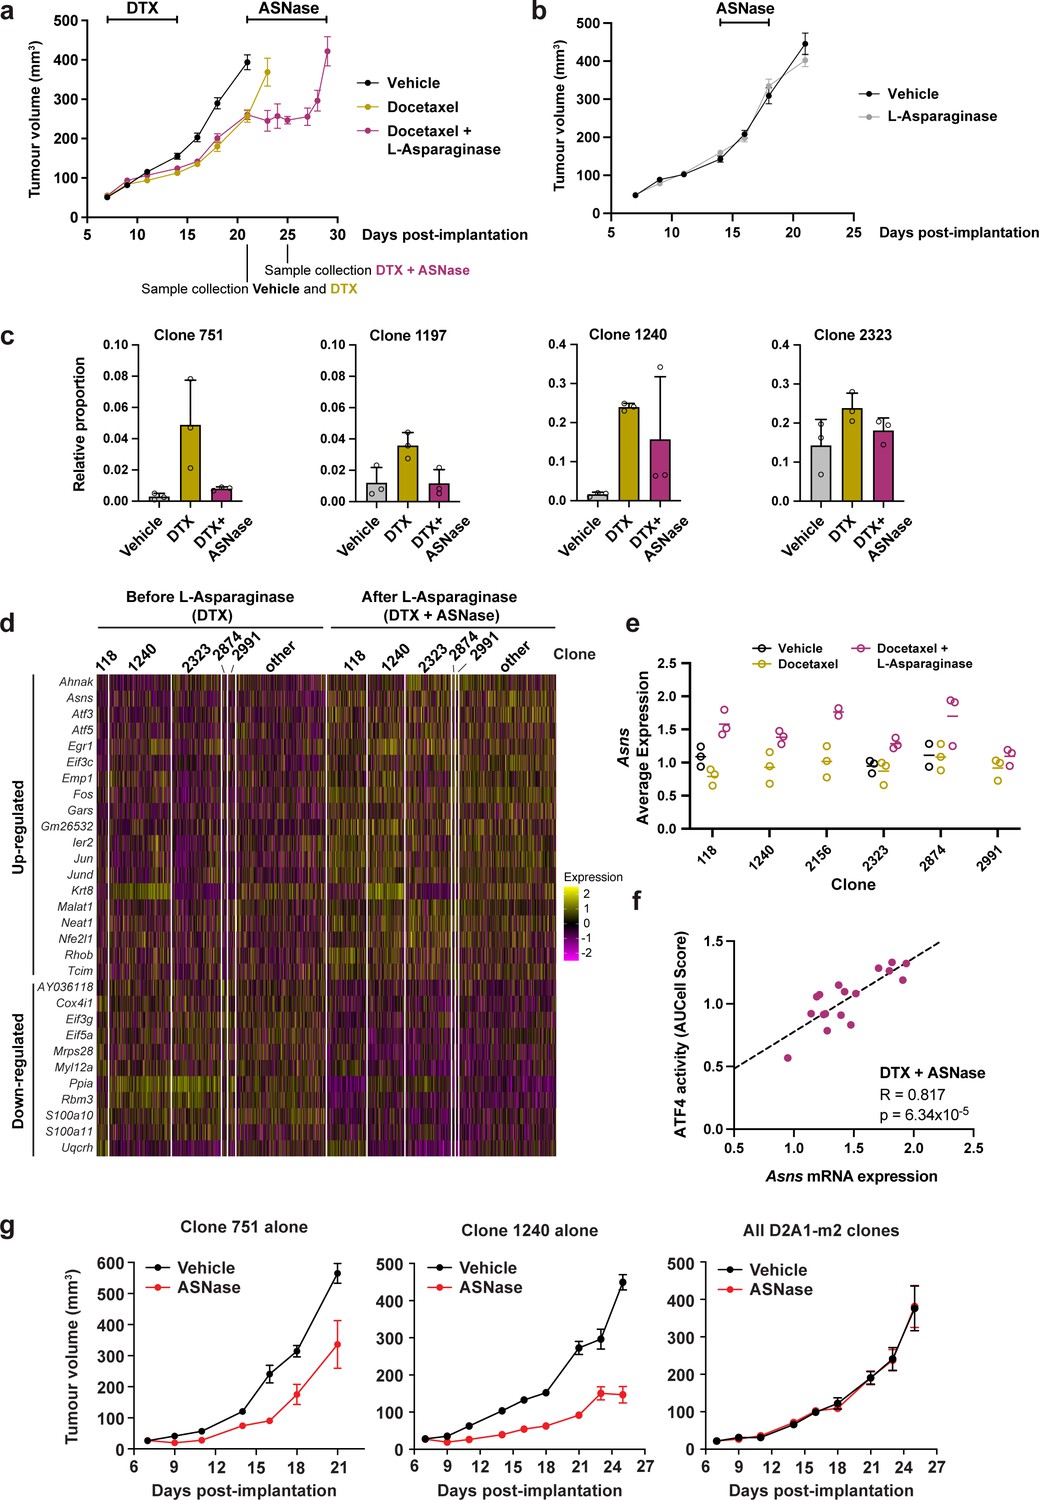
Taxane-resistant, NRF2-high clones are inherently sensitive to amino acid deprivation.
(a) Docetaxel-resistant tumours are collaterally sensitive to L-asparaginase. D2A1-m2 WILD-seq tumours were treated with 3 doses of 12.5 mg/kg docetaxel (days 7,9,11 post-implantation) and 1 dose of 10 mg/kg docetaxel (day 14 post-implantation). From day 21 mice were treated daily with L-asparaginase. Indicated below the X axis are the timepoints of tumour collection for single-cell sequencing. Measurements are combined from two independent experiments, error bars represent SEM. Due to sample collection at timepoints indicated the number of animals is reduced beyond this. Vehicle n=15 mice, docetaxel n=14 mice (reduced to 5 mice after day 21), docetaxel + L-asparaginase n=13 mice (reduced to 4 mice from day 25). In addition, 2 mice reached humane endpoint (due to weight loss following docetaxel treatment but prior to administration of L-asparaginase) one in the DTX only arm at day 18 and one in the DTX +L Asp arm at day 21. (b) L-asparaginase alone does not affect tumour growth. D2A1-m2 WILD-seq tumours were treated with L-asparaginase or vehicle for 5 consecutive days from day 14 post-implantation. n=10 mice per condition, error bars represent SEM. (c) Taxane-resistant clones are sensitive to L-asparaginase. Relative clonal abundance in vehicle-treated (day 21), docetaxel-treated (day 21) and docetaxel and L-asparaginase-treated (day 25) D2A1-m2 WILD-seq tumours is shown for 3 taxane-resistant clones (751, 1197, 1240) and 1 neutral clone (2323). Clonal proportions were calculated from single cell sequencing data of 3 tumours per condition. Error bars represent SD. (d) Gene expression changes in tumour cells after L-asparaginase treatment. Heatmap for genes which are most significantly and consistently differentially expressed across clonal lineages after treatment with L-asparaginase. 2400 cells are represented (400 per sample), grouped according to clonal lineage. (e) Asns expression increases after L-asparaginase treatment. Asns expression was calculated per clone, per sample using the AverageExpression function from the Seurat package. Data points were included if they represented at least 30 single cells and there were at least 2 data points per condition. (f) Asns expression correlates with ATF4 activity in tumours treated with the docetaxel -L-asparaginase combination. ATF4 transcriptional activity was calculated using a gene set defined by Tameire et al. but from which Asns was removed. Each data point represents the normalised, median AUCell score for a specific clone and animal. Only animals treated with docetaxel and then L-asparaginase were included. Correlation was determined using the Pearson correlation test. (g) Clone 751 and 1240 are inherently sensitive to L-asparaginase. The effect of L-asparaginase treatment on tumour growth of monoclonal tumours composed only of clone 751 (250,000 cells implanted) or clone 1240 (250,000 cells implanted) was compared to that of tumours established from the heterogeneous WILD-seq D2A1-m2 pool (60,000 cells implanted). Mice were treated with L-asparginase (60 U/day, IP, 5 days a week) from 7 days post-implantation. Significance was determined by two-way anova (clone 751: F(1,8) = 18.24, p=0.0027; clone 1240: F(1,8) = 108.8, p=6.193 × 10⁻⁷, all clones: F(1,7) = 0.00014, p=0.991). n=5 animals, except for L-asparaginase-treated D2A1-m2 pool where n=4.
Figure 7—figure supplement 1
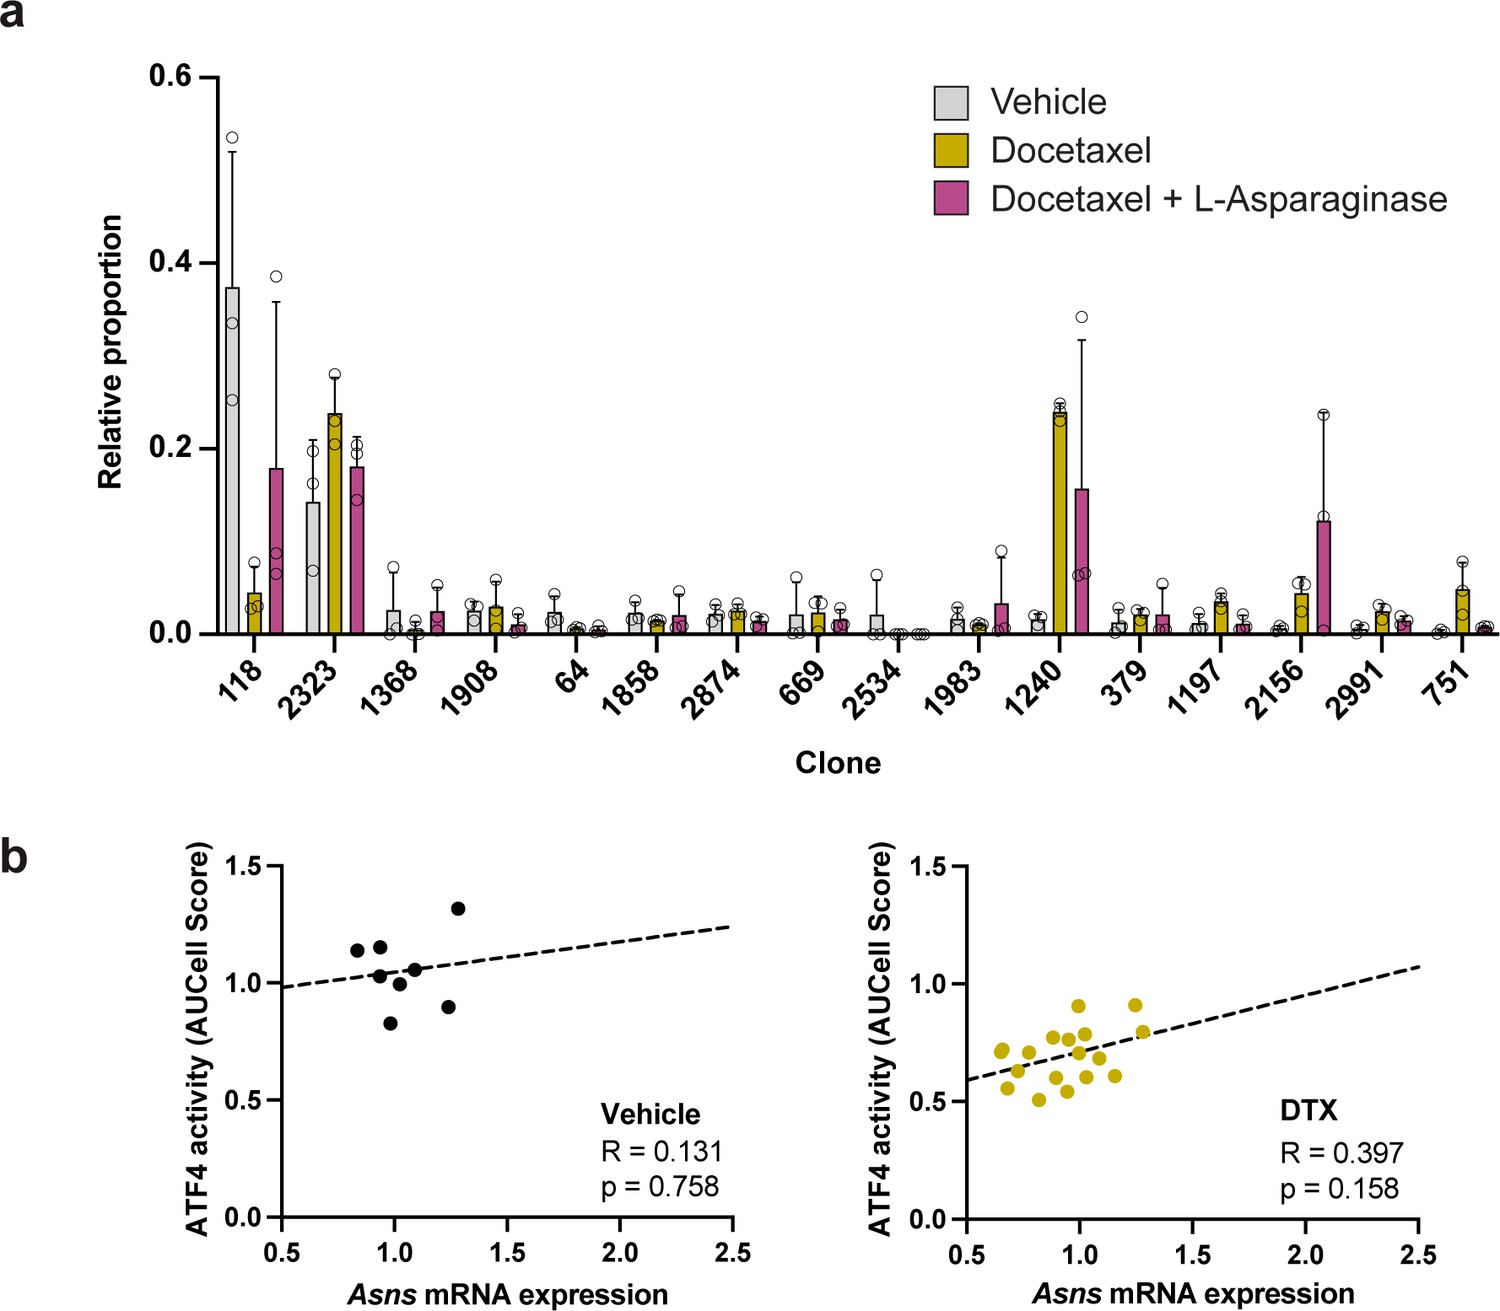
Clonal representation (related to Figure 7c) and lack of significant correlation between Asns expression and ATF4 activity in the absence of L-asparaginase treatment.
(a) Clonal representation (related to Figure 7c). Proportion of tumour cells assigned to each clonal lineage based on the WILD-seq barcode (n=3 tumours per condition). Clones which made up on average more than 2% of the barcoded tumour cells under any one condition are plotted. Data represents mean ± SD. (b) Correlation between Asns expression and ATF4 activity in tumours treated with vehicle or docetaxel only (related to Figure 7f). ATF4 transcriptional activity was calculated using a gene set defined by Tameire et al. but from which Asns was removed. Each data point represents the normalised, median AUCell score for a specific clone and animal. Correlation was determined using the Pearson correlation test.
Figure 7—figure supplement 2
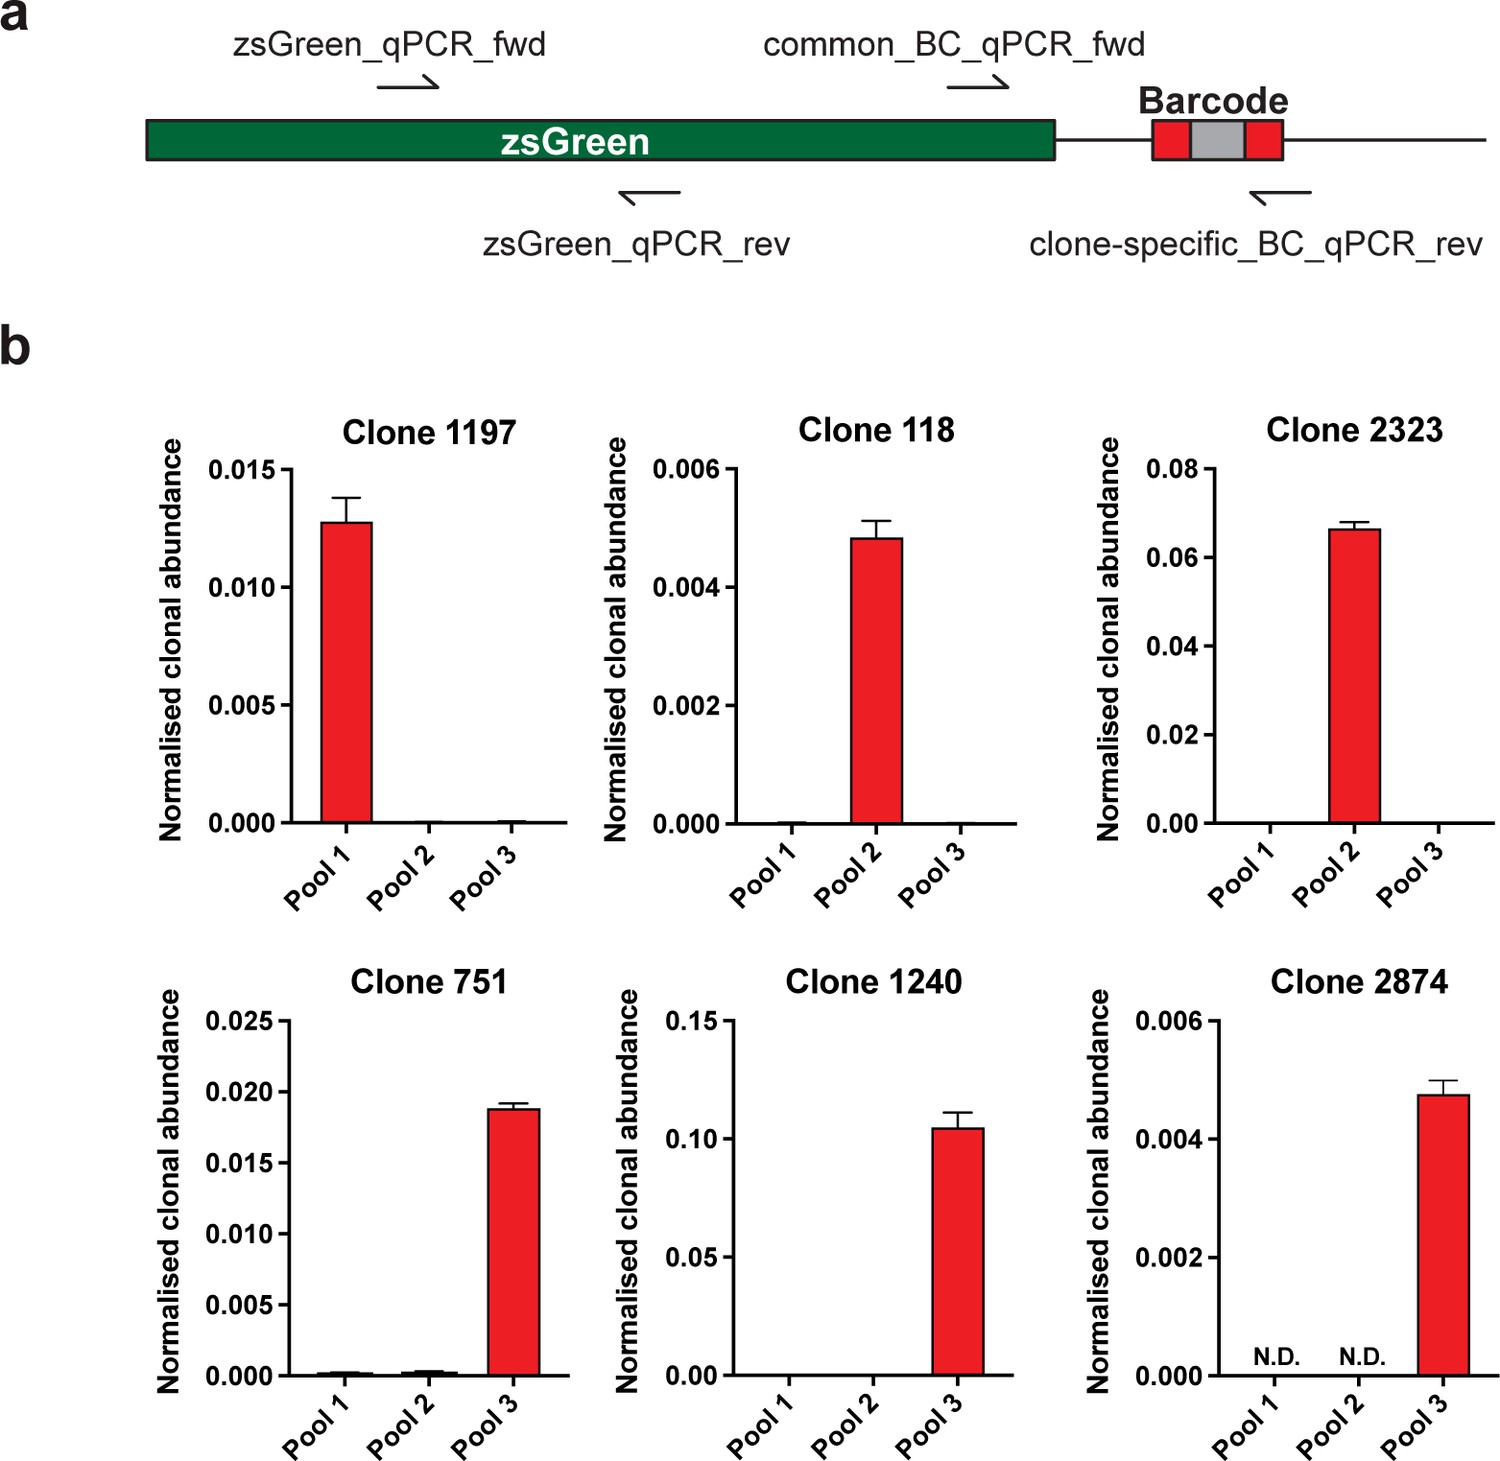
Validation of specific WILD-seq barcode detection by qPCR.
(a) Primer design. qPCR of specific barcodes was performed using a universal forward primer (common_BC_qPCR_fwd) that binds at the 3’ end of the zsGreen transgene coding sequence and a barcode specific reverse primer (clone-specific_BC_qPCR_rev) that binds within the barcode region. For normalisation qPCR primers were used that both bound with the zsGreen transgene coding seqeunce (zsGreen_qPCR_fwd, zsGreen_qPCR_rev). (b) Detection of specific clone barcode sequences. qPCR amplification of clone-specific barcodes from gDNA extracted from cultured WILD-seq cell pools. Values were calculated using the 2-ΔCT method where a common zsGreen amplicon served as the reference. All barcodes showed specific detection in the correct cell pool that contained that clone. N.D.=not detected.
Tables
Key resources table
| Reagent type (species) or resource | Designation | Source or reference | Identifiers | Additional information |
|---|---|---|---|---|
| Strain, 6–8 week old, female, Balb/C (Mus musculus) | Balb/C | Charles River | Strain code 028 | |
| Strain, 6–8 week old, female, NOD.Cg-PrkdcscidIl2rgtm1Wjl/SzJ (Mus musculus) | NOD scid gamma (NSG) | Charles River | Strain code 614 | |
| Cell line (Mus musculus) | 4T1 | ATCC | Cat # CRL-2539. RRID:CVCL_0125 | |
| Cell line (Mus musculus) | D2A1-m2 | Prof Clare Isacke’s laboratory. Jungwirth et al., 2018 | Derived from in vivo selection of D2A1 parental line from the metastatic site (lung) | |
| Cell line (Homo sapiens) | 293 FT | Thermo Fisher Scientific | RRI:CCVCL_6911 | Used to make lenti-virus |
| Recombinant DNA reagent | pHSW8 | This paper | Empty WILD-seq vector with zsGreen flourophor. See materials and methods. | |
| Recombinant DNA reagent | WILD-seq vector library | This paper | WILD-seq vector barcode library in the 3’ UTR of szGreen. See materials and methods. | |
| Commercial assay or kit | SYBR green PCR master mix | Applied Biosystems/ Thermo Fisher Scientific | Cat # 4309155 | |
| Commercial assay or kit | Gibson Assembly master mix | New England Biolabs | Cat # E2611S | |
| Commercial assay or kit | High pure RNA isolation kit | Roche | Cat # 11828665001 | |
| Commercial assay or kit | Tumor dissociation kit, mouse | Miltenyi Biotec | Cat # 130096730 | |
| Commercial assay or kit | Chromium Single Cell 3' Reagent Kits User Guide (v3.1 Chemistry Dual Index) | 10x Genomics | User guide reference: CG000315 | |
| Chemical compound, drug | (+)-JQ1 | Selleck Chemicals | S7110 | |
| Chemical compound, drug | docetaxel | Selleck Chemicals | S1148 | |
| Chemical compound, drug | Native E coli L-asparaginase protein | Abcam | ab277068 | |
| Software, algorithm | Bartender | Zhao et al., 2018 | ||
| Software, algorithm | DNA barcodes | Buschmann, 2017 | ||
| Software, algorithm | Cell Ranger | 10x Genomics | RRID:SCR_017344 | |
| Software, algorithm | Seurat | Stuart et al., 2019 | RRID:SCR_016341 |
Additional files
-
Supplementary file 1
Overview of single cell RNA-seq samples generated.
- https://cdn.elifesciences.org/articles/80981/elife-80981-supp1-v1.xlsx
-
Supplementary file 2
Number and proportion of tumour cells assigned to each clonal barcode for all 4T1 WILD-seq samples.
- https://cdn.elifesciences.org/articles/80981/elife-80981-supp2-v1.xlsx
-
Supplementary file 3
Number and proportion of tumour cells assigned to each clonal barcode for all D2A1-m2 WILD-seq samples.
- https://cdn.elifesciences.org/articles/80981/elife-80981-supp3-v1.xlsx
-
Supplementary file 4
4T1 WILD-seq baseline gene enrichment signatures for major clones.
Differential gene expression analysis was performed for each clone by comparing cells from a clonal lineage of interest to all assigned tumour cells within the same experiment. Only vehicle-treated samples were included in the analysis. Experiments were included in the analysis if they contained at least 20 cells assigned to the clone and clones were analyzed if they were represented by at least 20 cells in at least 3 of the 4 experiments. Differential gene expression was performed using Seurat FindMarkers function and Wilcoxon Rank Sum test. Fisher’s method was used to combine p-values from separate experiments. Analysis for each clone is provided as a separate tab.
- https://cdn.elifesciences.org/articles/80981/elife-80981-supp4-v1.xlsx
-
Supplementary file 5
4T1 WILD-seq baseline gene set enrichment signatures for major clones.
Differential gene set expression analysis was performed for each clone by comparing cells from a clonal lineage of interest to all assigned tumour cells within the same experiment. All gene sets from the Molecular Signatures Database C2 curated gene set collection were included in the analysis that contained more than 20 genes detectable in our single cell data. Only vehicle-treated samples were included in the analysis. Experiments were included in the analysis if they contained at least 20 cells assigned to the clone and clones were analyzed if they were represented by at least 20 cells in at least 3 of the 4 experiments. Gene set expression analysis was performed using AUCell and differential expression was calculated using Wilcoxon Rank Sum test. Tables show median AUCell score per experiment for each gene set, enrichment in AUCell score relative to all assigned tumour cells within the same experiment (log2(median AUCell score clone of interest/median AUCell score all clones)) and adjusted p-value from Wilcoxon Rank Sum test of AUCell scores from clone of interest vs AUCell scores from all assigned tumours cells from the same experiment. Fisher’s method was used to combine p-values from separate experiments. Analysis for each clone is provided as a separate tab. A final tab ‘Data_for_Figure 1h’ provides the matrix of AUCell enrichment values used for the heatmap plotted in Figure 1h compiled from individual analyses.
- https://cdn.elifesciences.org/articles/80981/elife-80981-supp5-v1.xlsx
-
Supplementary file 6
Differential expression analysis JQ1 vs Vehicle.
Differential gene expression analysis was performed by comparing cells from the same clonal lineage treated with JQ1 or vehicle within the same experiment. Five clones were included in the analysis (clones 350, 473, 537, 606 and 684) for which there were at least 20 cells per condition across both experiments. Fisher’s method was used to combine p-values from different clones within the same experiment. Gene level differential expression was performed using Seurat FindMarkers function and Wilcoxon Rank Sum test. These data are provided under the ‘FindMarkers_JQ1vsVeh’ tab. Gene set level differential expression was performed using AUCell and differential expression was calculated using Wilcoxon Rank Sum test. These data are provided under the ‘AUCell_JQ1vsVeh’ tab. The ‘Median_norm_AUCell_Scores’ tab provides a summary of the median normalised AUCell scores for each clone, condition and experiment used in the preparation of Figure 2e. Normalization to enable comparison across separate experiments was performed by dividing by the median AUCell score for all vehicle-treated tumour cells assigned to any clonal lineage from the same experiment.
- https://cdn.elifesciences.org/articles/80981/elife-80981-supp6-v1.xlsx
-
Supplementary file 7
Correlation of clonal gene expression with JQ1 response.
To determine genes and gene sets whose expression correlates with JQ1 response, the correlation between baseline gene and geneset enrichment values for the major clones as defined in Supplementary file 4, Supplementary file 5 and the log fold change in clonal abundance between JQ1 and vehicle-treated samples was calculated using the Pearson correlation test. The Pearson correlation coefficient is provided for each gene and gene set.
- https://cdn.elifesciences.org/articles/80981/elife-80981-supp7-v1.xlsx
-
Supplementary file 8
Correlation of clonal gene expression with docetaxel response.
To determine genes and gene sets whose expression correlates with docetaxel response, the correlation between baseline gene and geneset enrichment values for the major clones as defined in Supplementary file 4, Supplementary file 5 and the log fold change in clonal abundance between JQ1 and vehicle-treated samples was calculated using the Pearson correlation test. The Pearson correlation coefficient is provided for each gene and gene set.
- https://cdn.elifesciences.org/articles/80981/elife-80981-supp8-v1.xlsx
-
Supplementary file 9
D2A1-m2 WILD-seq baseline gene enrichment signatures for major clones.
Differential gene expression analysis was performed for each clone by comparing cells from a clonal lineage of interest to all assigned tumour cells within the same sample. Only vehicle-treated samples were included in the analysis. Clones were included in the analysis if there were at least 20 cells assigned to that clone in all three vehicle samples (DV1, DV2 and DV3). Differential gene expression was performed using Seurat FindMarkers function and Wilcoxon Rank Sum test. Fisher’s method was used to combine p-values from separate samples. Analysis for each clone is provided as a separate tab. In addition, analysis is included for the combined resistant clones 751, 1197 and 1240. Due to their low representation in vehicle-treated samples cells assigned to these clones from all three vehicle-treated samples were combined for gene expression analysis and compared to all assigned tumour cells from the three samples.
- https://cdn.elifesciences.org/articles/80981/elife-80981-supp9-v1.xlsx
-
Supplementary file 10
D2A1-m2 WILD-seq baseline gene set enrichment signatures for major clones.
Differential gene set expression analysis was performed for each clone by comparing cells from a clonal lineage of interest to all assigned tumour cells within the same sample. All gene sets from the Molecular Signatures Database C2 curated gene set collection were included in the analysis that contained more than 20 genes detectable in our single cell data. Only vehicle-treated samples were included in the analysis. Clones were included in the analysis if there were at least 20 cells assigned to that clone in all three vehicle samples (DV1, DV2 and DV3). Gene set expression analysis was performed using AUCell and differential expression was calculated using Wilcoxon Rank Sum test. Tables show median AUCell score per sample for each gene set, enrichment in AUCell score relative to all assigned tumour cells within the same experiment (log2(median AUCell score clone of interest/median AUCell score all clones)) and adjusted p-value from Wilcoxon Rank Sum test of AUCell scores from clone of interest vs AUCell scores from all assigned tumours cells from the same sample. Fisher’s method was used to combine p-values from separate samples. Analysis for each clone is provided as a separate tab. In addition, analysis is included for the combined resistant clones 751 1197 and 1240. Due to their low representation in vehicle-treated samples cells assigned to these clones from all three vehicle-treated samples were combined for gene expression analysis and compared to all assigned tumour cells from the three samples. The tab ‘Data for Figure 4e and f’ provides the matrix of median AUCell scores used for the heatmap plotted in Figure 4e compiled from individual analyses. The tab ‘Data for Figure 4h’ provides median AUCell scores per sample for clones of interest for all samples and conditions where at least 20 cells per clone were present. Selected data from this table was plotted in Figure 4h.
- https://cdn.elifesciences.org/articles/80981/elife-80981-supp10-v1.xlsx
-
Supplementary file 11
Comparison of differential gene expression analysis in bulk tumour cells and intra-clonal changes in gene expression.
For each treatment condition (docetaxel/D2A1-m2, docetaxel/4T1 and JQ1/4T1) differential expression analysis was performed between barcoded tumour cells from drug-treated and vehicle-treated animals from the same experiment. Analysis was performed either by using cells from a single clonal lineage (analysis by clone) or all barcoded tumour cells irrespective of clonal lineage (bulk tumour cell analysis). Differential gene expression was performed using Seurat FindMarkers function and Wilcoxon Rank Sum test. Log2 fold change and adjusted p-value are provided for each comparison. For the analysis by clone, the mean logFC of all individual clonal comparisons is given (mean.logFC.clonal) and Fisher’s method was used to combine p-values (fisher.combined.pvalue.clonal). Genes were classified as significantly changed in clonal analysis only, bulk analysis only or both analysis methods based on significance cutoffs of p-value <0.05 and logFC <–0.2 or>0.2. Genes identified as significantly changing by one method only met neither logFC nor p-value cutoffs in the alternative method. For analysis of WILD-seq 4T1 data, analysis was performed separately for the 2 experiments and genes had to meet significance cutoffs in both experiments.
- https://cdn.elifesciences.org/articles/80981/elife-80981-supp11-v1.xlsx
-
Supplementary file 12
Overlap of docetaxel resistance markers in 4T1 and D2A1-m2 cell lines.
4T1 resistance genes were defined as those that were significantly enriched in resistant clone 679 but not in sensitive clone 238 (p<0.05). D2A1-m2 resistance genes were defined as those that were significantly enriched in combined resistant clones 1240, 751 and 1197 but not in sensitive clones 118, 2874 or 1072 (p<0.05). Overlap of these lists revealed 47 common genes. These are listed along with their human orthologs.
- https://cdn.elifesciences.org/articles/80981/elife-80981-supp12-v1.xlsx
-
Supplementary file 13
Number and proportion of tumour cells assigned to each clonal barcode for docetaxel and L-asparaginase combination experiment.
- https://cdn.elifesciences.org/articles/80981/elife-80981-supp13-v1.xlsx
-
Supplementary file 14
Differential expression analysis for L-Asparaginase treatment.
Differential gene expression analysis was performed by comparing cells from the same clonal lineage between each DTX +Asp sample and the combined DTX only samples. To ensure there were sufficient cells across all samples, five major clones (118, 1240, 2323, 2874 and 2991) were included in the analysis. Differential expression analysis was performed using Seurat FindMarkers function and Wilcoxon Rank Sum test. Fisher’s method was used to combine p-values from different clones within the same comparison. When selecting genes of interest, mean fold change between DTX + ASNase samples and vehicle (also calculated on a per clone basis using abundant clones) was used as an additional cutoff and is included in the table. The most significantly and consistently differentially expressed genes are indicated in the final column ‘Meets.cutoffs?’.
- https://cdn.elifesciences.org/articles/80981/elife-80981-supp14-v1.xlsx
-
Supplementary file 15
pHSW8 vector sequence.
Full annotated sequence file for the WILD-seq library vector pHSW8.
- https://cdn.elifesciences.org/articles/80981/elife-80981-supp15-v1.zip
-
MDAR checklist
- https://cdn.elifesciences.org/articles/80981/elife-80981-mdarchecklist1-v1.docx
Download links
A two-part list of links to download the article, or parts of the article, in various formats.
Downloads (link to download the article as PDF)
Open citations (links to open the citations from this article in various online reference manager services)
Cite this article (links to download the citations from this article in formats compatible with various reference manager tools)
Clonal transcriptomics identifies mechanisms of chemoresistance and empowers rational design of combination therapies
eLife 11:e80981.
https://doi.org/10.7554/eLife.80981


