Inhibited KdpFABC transitions into an E1 off-cycle state
- Institute of Biochemistry, Biocenter, Goethe University Frankfurt, Germany
- Department of Structural Biology, Groningen Biomolecular Sciences and Biotechnology Institute, University of Groningen, Netherlands
- Department of Biochemistry, University of Oxford, United Kingdom
- School of Life Sciences & Department of Chemistry, University of Warwick, United Kingdom
Figures
Figure 1 with 4 supplements
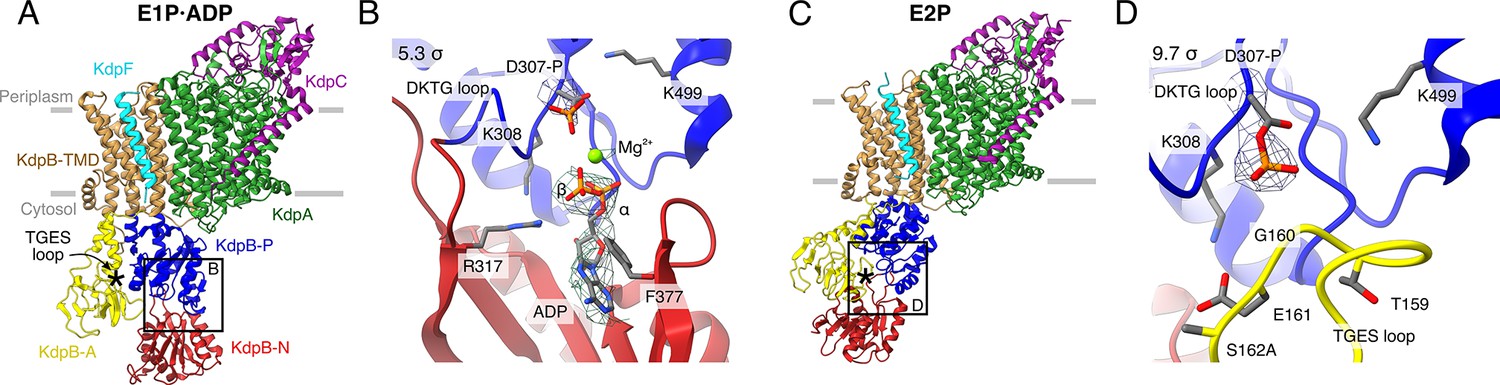
Structures of KdpFABS162AC obtained at turnover conditions.
Color code throughout the manuscript, unless stated otherwise, is as follows: KdpF in cyan, KdpA in green, KdpC in purple, KdpB transmembrane domain (TMD) in sand with P domain in blue, N domain in red and A domain in yellow. The position of the TGES162 loop is denoted by an asterisk. (A) E1P·ADP structure, with its nucleotide-binding site (B), showing the bound ADP with Mg2+. (C) E2P structure, with its nucleotide-binding site (D), showing the catalytically phosphorylated KdpBD307 (P domain), and the TGES162 loop (A domain) in close proximity. Densities are shown at the indicated σ level.
Figure 1—figure supplement 1
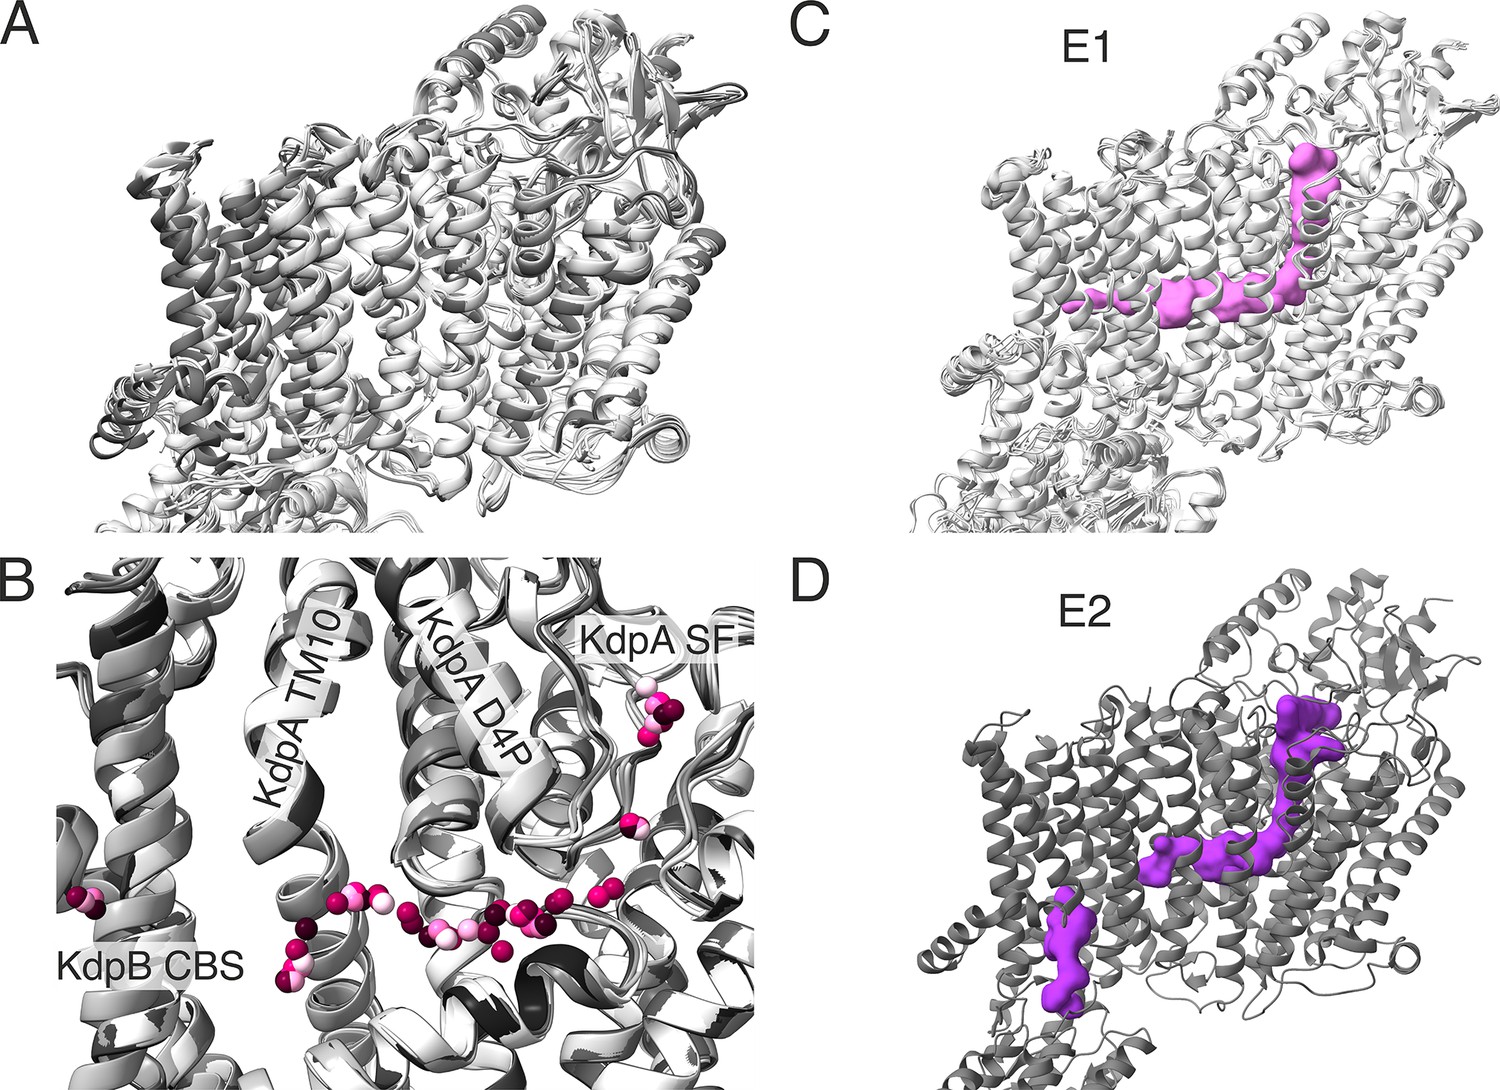
Comparison of transmembrane domains (TMDs) of all KdpFABC structures obtained in this study.
(A) Superimposition of all E1 (light gray) and E2 (dark gray) KdpFABC structures obtained in this study, aligned on KdpA, showing few significant deviations in the TMD of KdpB, KdpA, or KdpC. (B) Superimposition of all potential potassium ions in the intersubunit tunnel found in all structures presented in this paper. Ions for each structure are presented in a different pink shade. Pore helix of the MPM motif 4 of KdpA (KdpA D4P) and TM helix 10 of KdpA are labeled. (C) Superposition of and E1 KdpFABC structures from this study, with a representative outward-open tunnel from the E1P·ADP structure of WT KdpFABC under turnover conditions shown in pink. (D) E2P structure of KdpFABC with calculated tunnels shown in purple. (C, D) The outward-open half-channel closes off at the KdpA/KdpB interface, while a new, inward-open half-channel opens from the canonical substrate-binding site (CBS) in KdpB to the cytosol.
Figure 1—figure supplement 2
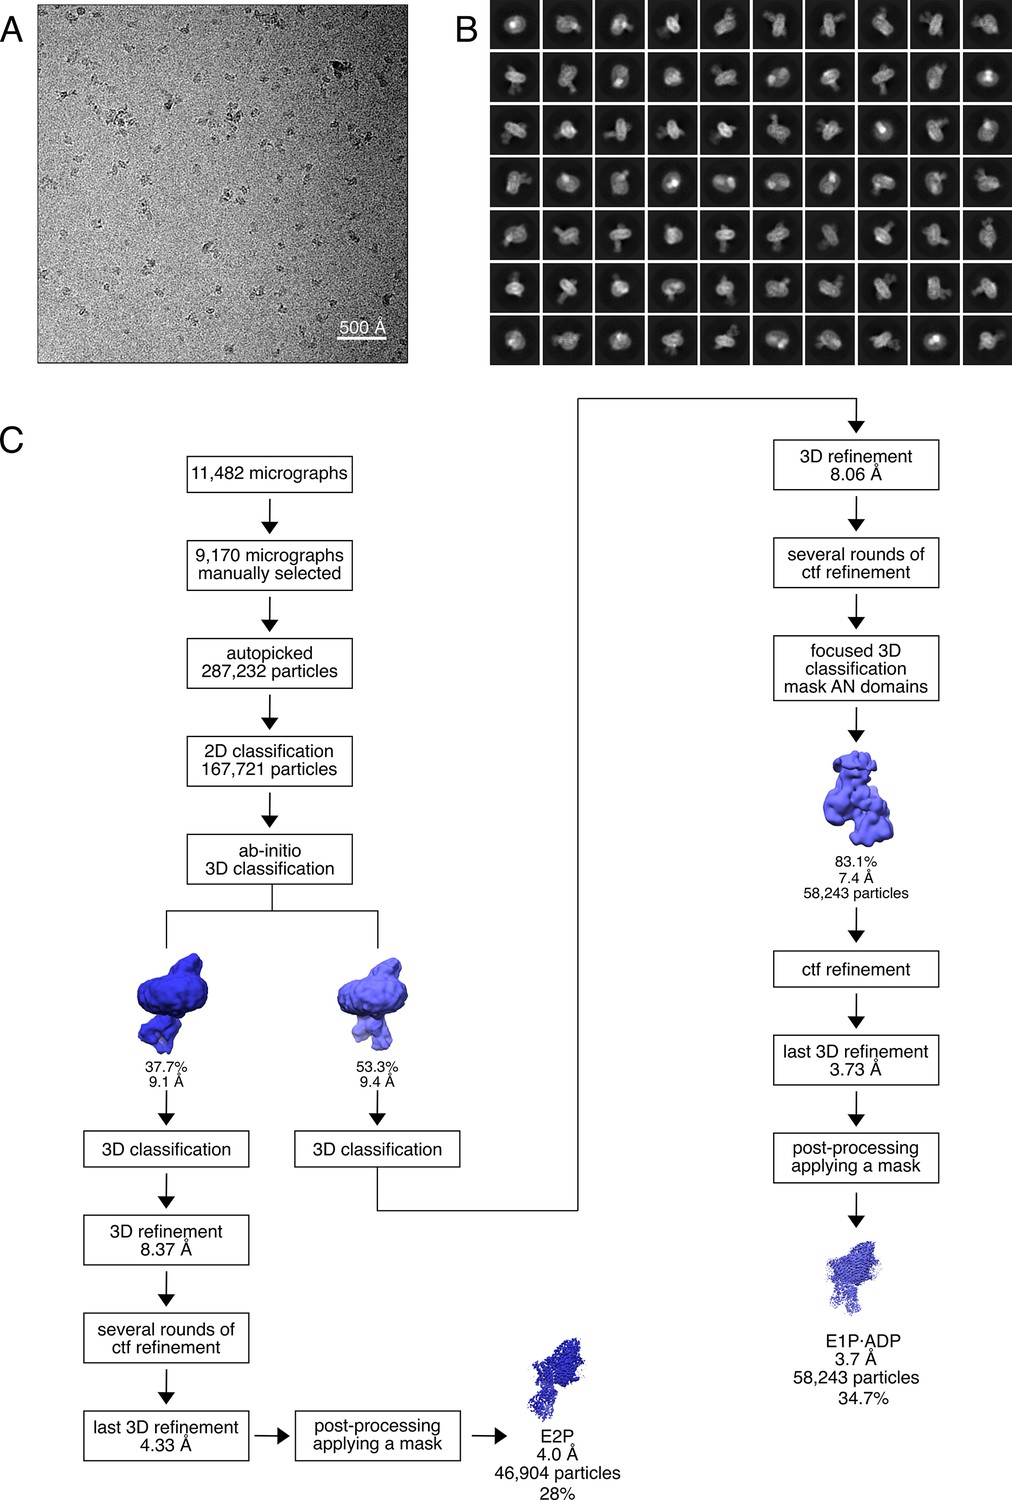
Cryo-EM analysis of the KdpFABS162AC complex under turnover conditions, resulting in E1P·ADP and E2P states.
(A) Representative cryo-EM image of the recorded data and (B) 2D class averages of vitrified WT KdpFABS162-PC in the presence of 2 mM ATP and 50 mM KCl. (C) Image processing workflow as described in Materials and methods. If not otherwise noted, indicated class percentages refer to the initial set of particles defined after 2D classification.
Figure 1—figure supplement 3
Cryo-EM validation of KdpFABS162AC under turnover conditions.
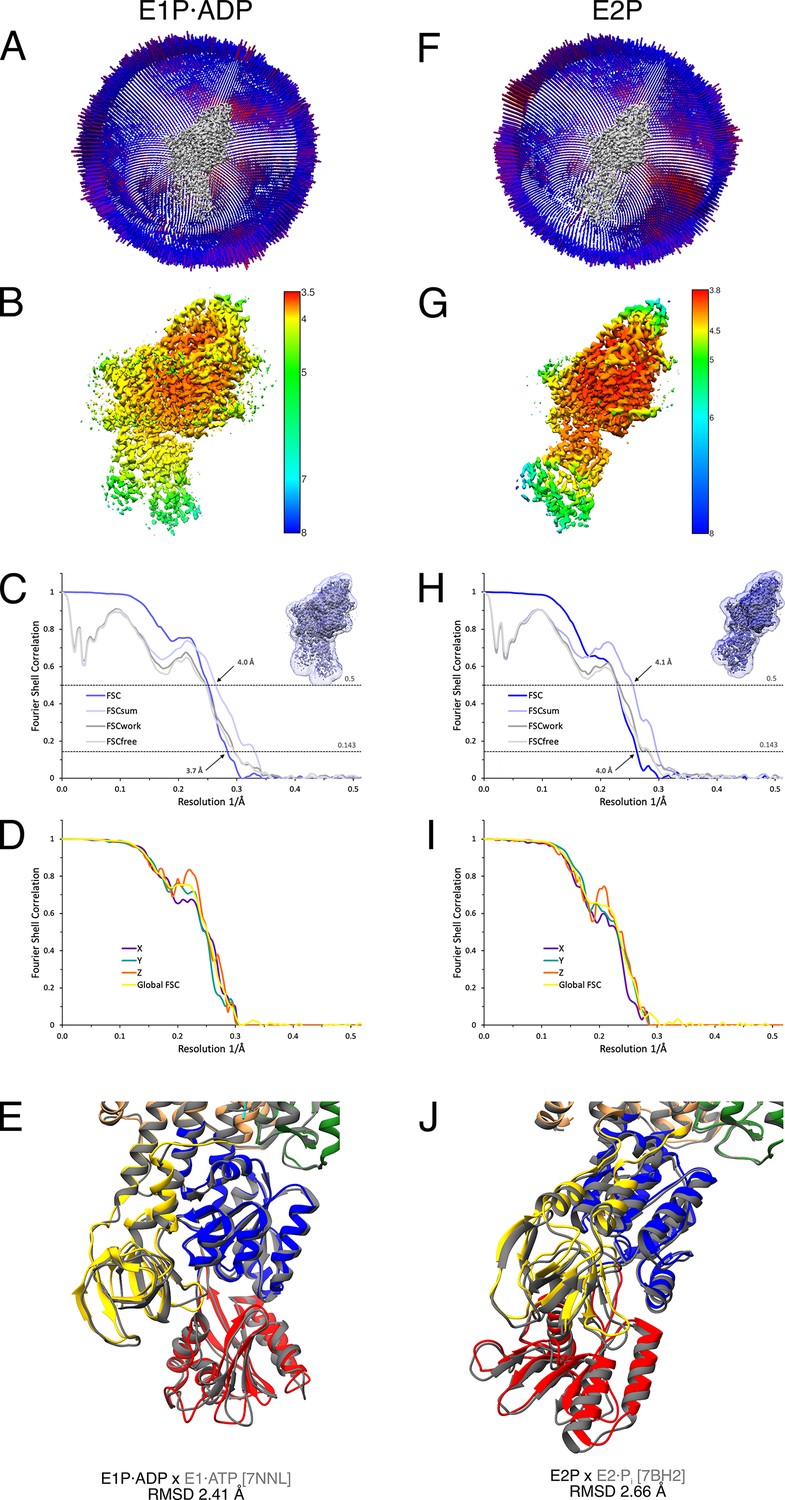
Validation shown for the E1P·ADP (A–E) and the E2P state (F–J). (A, F) Angular distribution plots of particles included in the final unsymmetrized 3D reconstruction. The number of particles with the respective orientations is represented by length and color of the cylinders (long and red: high number of particles; short and blue: low number of particles). (B, G) Final reconstruction maps colored by local resolution as estimated by RELION. (C, H) Fourier shell correlation (FSC) plots used for resolution estimation and model validation. The gold-standard FSC plot between two separately refined half-maps is shown in dark blue and indicates final resolutions of 3.7 and 4.0 Å for the E1P·ADP state (C) and the E2P state (H), respectively. The FSC model validation curves for FSCsum, FSCwork, and FSCfree are described in Materials and methods and show no overfitting. Thumbnails of the mask used for FSC calculation overlaid on the maps are shown in the upper right corner of both curves. Dashed lines indicate the FSC thresholds used for FSC (0.143) and for FSCsum (0.5). (D, I) Anisotropy estimation plots of the final maps show no significant anisotropy. (E, J) Superposition of the E1P·ADP state (colored) with the AMPPCP-stabilized E1·ATP structure [7NNL] (gray), root mean square deviation (RMSD) 2.41 Å in the cytosolic domains, and the E2P state (colored) with the BeF3−-stabilized E2·Pi structure [7BH2] (gray), RMSD 2.66 Å in the cytosolic domains, respectively, verifying the assignment of each structure at its position in the conformational cycle.
Figure 1—figure supplement 4
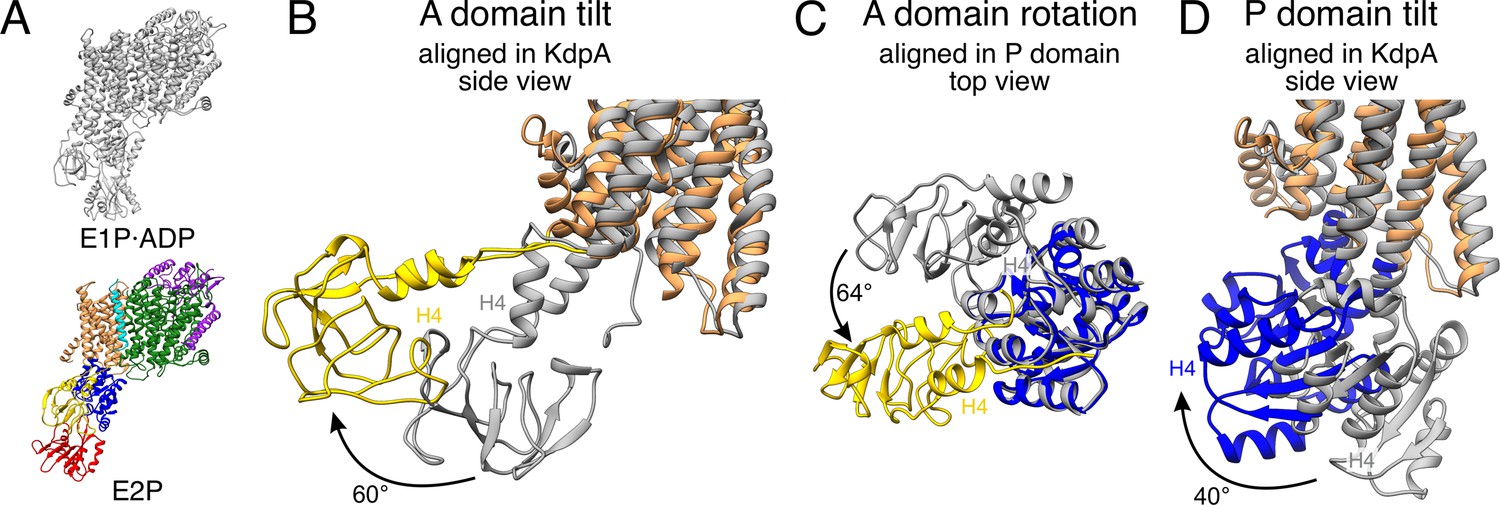
A and P domain movements during the E1P/E2P transition.
(A) KdpFABS162AC structures in the E1P·ADP (colors) and E2P (gray) states. Individual panels show (B) the tilt of the A domain (structures aligned on the static KdpA, N, and P domains removed for clarity), (C) the rotation of the A domain around the P domain (structures aligned on the P domain, N domain, and the transmembrane domain [TMD] removed for clarity), and (D) the tilt of the P domain (structures aligned on the static KdpA, A, and N domains removed for clarity). In the E1P/E2P transition, the A domain tilts by 60°, while the P domain tilts by 40°. Additionally, the A domain rotates by 64° around the P domain. Helices from the A and P domains used for angle measurements are labeled in all panels.
Figure 2 with 5 supplements
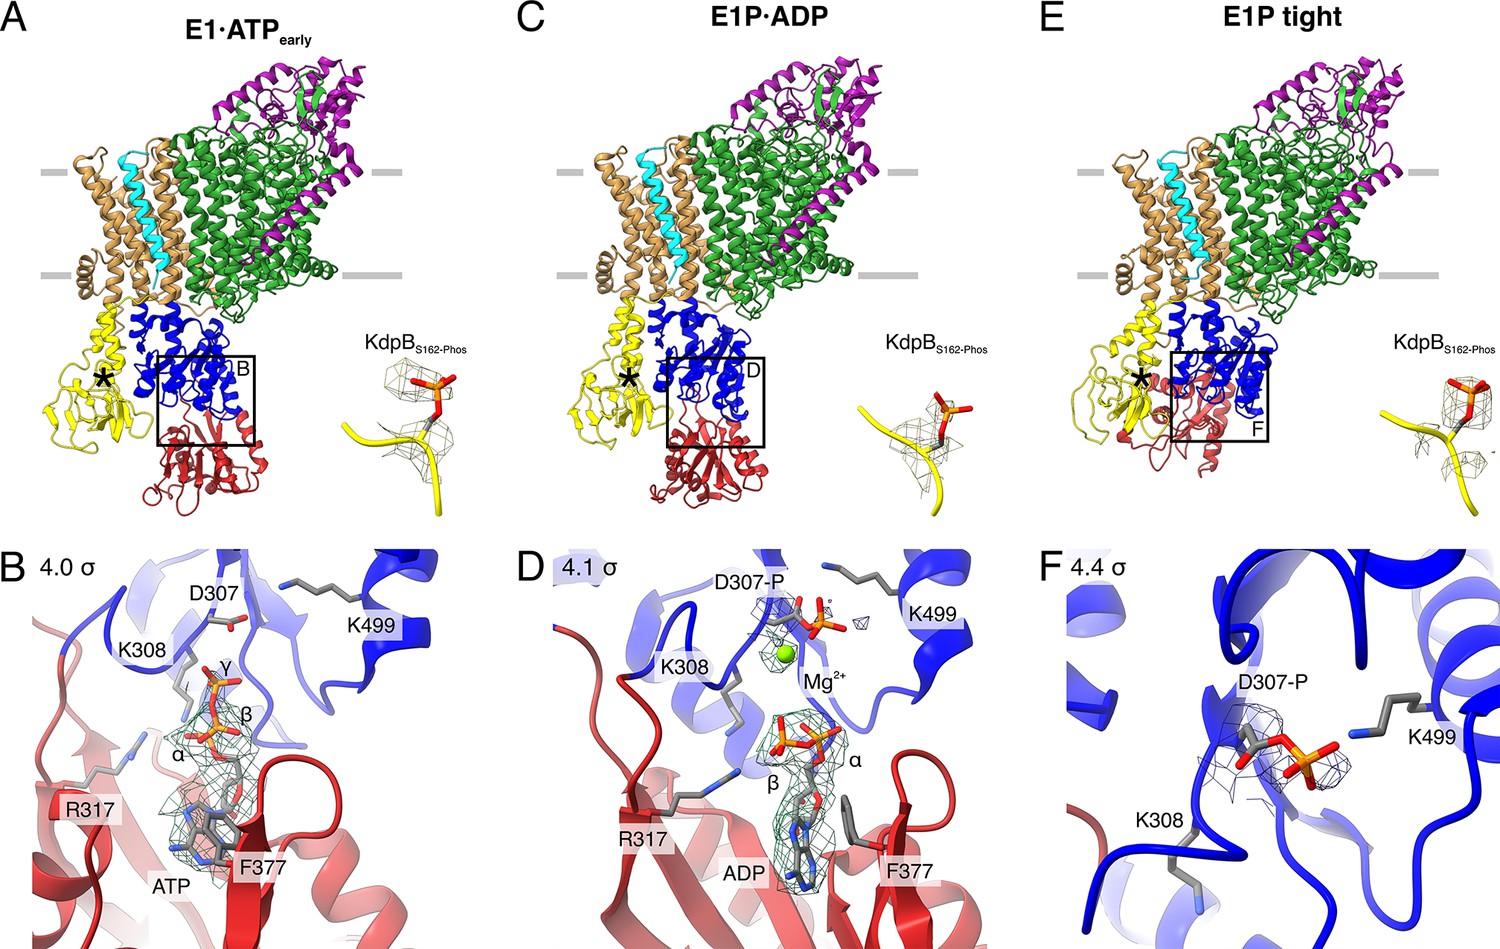
Structures of WT KdpFABS162-PC obtained at turnover conditions.
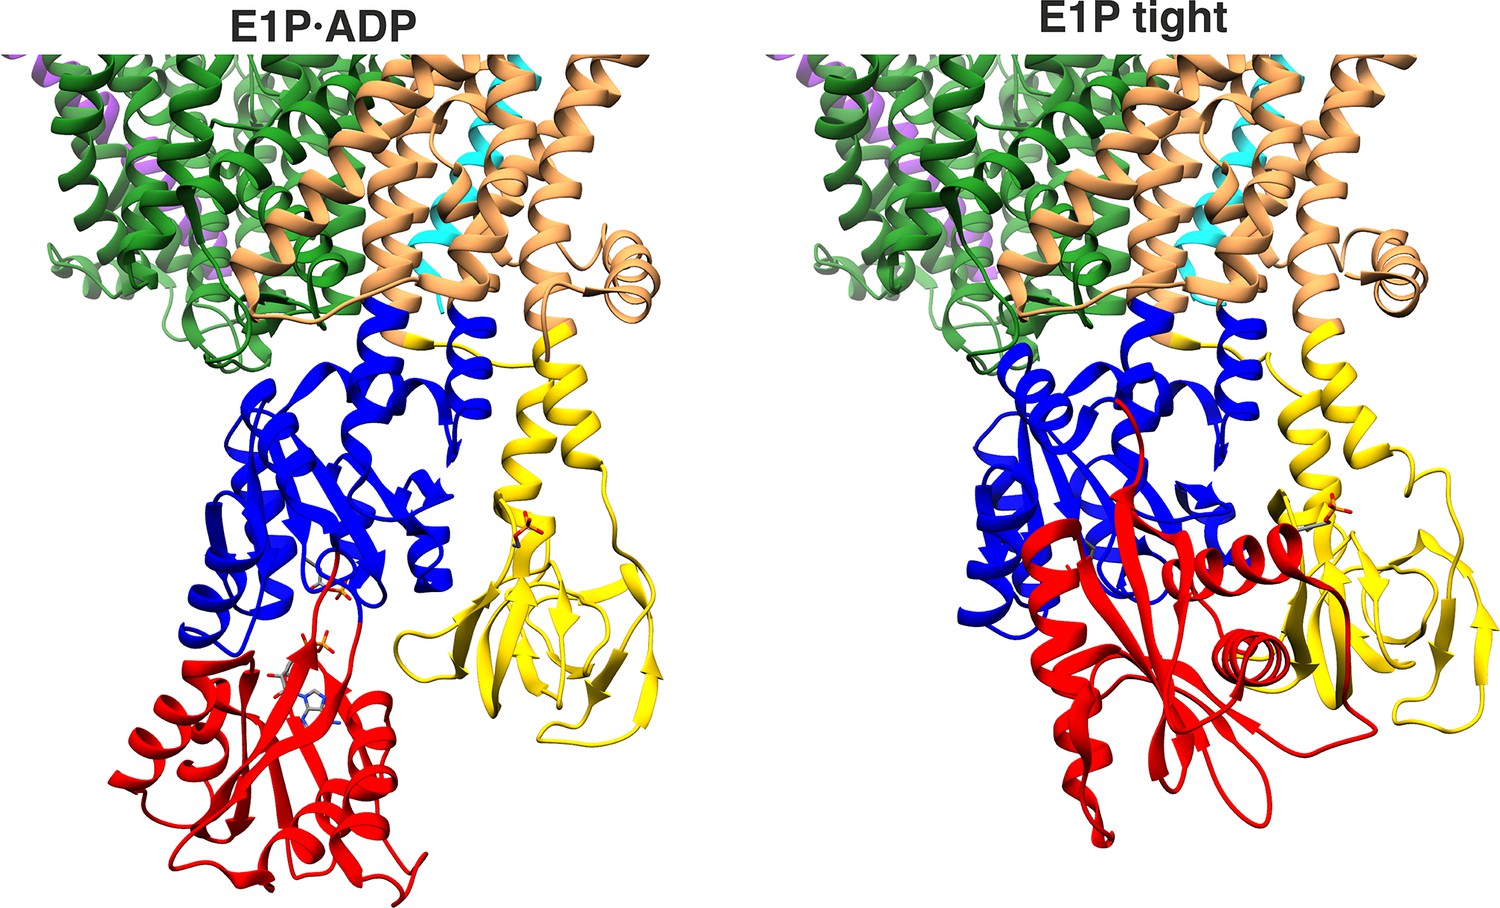
(A) E1·ATPearly structure with the corresponding density of KdpBS162 phosphorylation and (B) its nucleotide-binding site, showing the bound ATP. (C) E1P·ADP structure with the corresponding density of KdpBS162 phosphorylation and (D) its nucleotide-binding site, showing the bound ADP with Mg2+. (E) E1P tight structure with the corresponding density for KdpBS162 phosphorylation and (F) its nucleotide-binding site. Densities are shown at the indicated σ level.
Figure 2—figure supplement 1
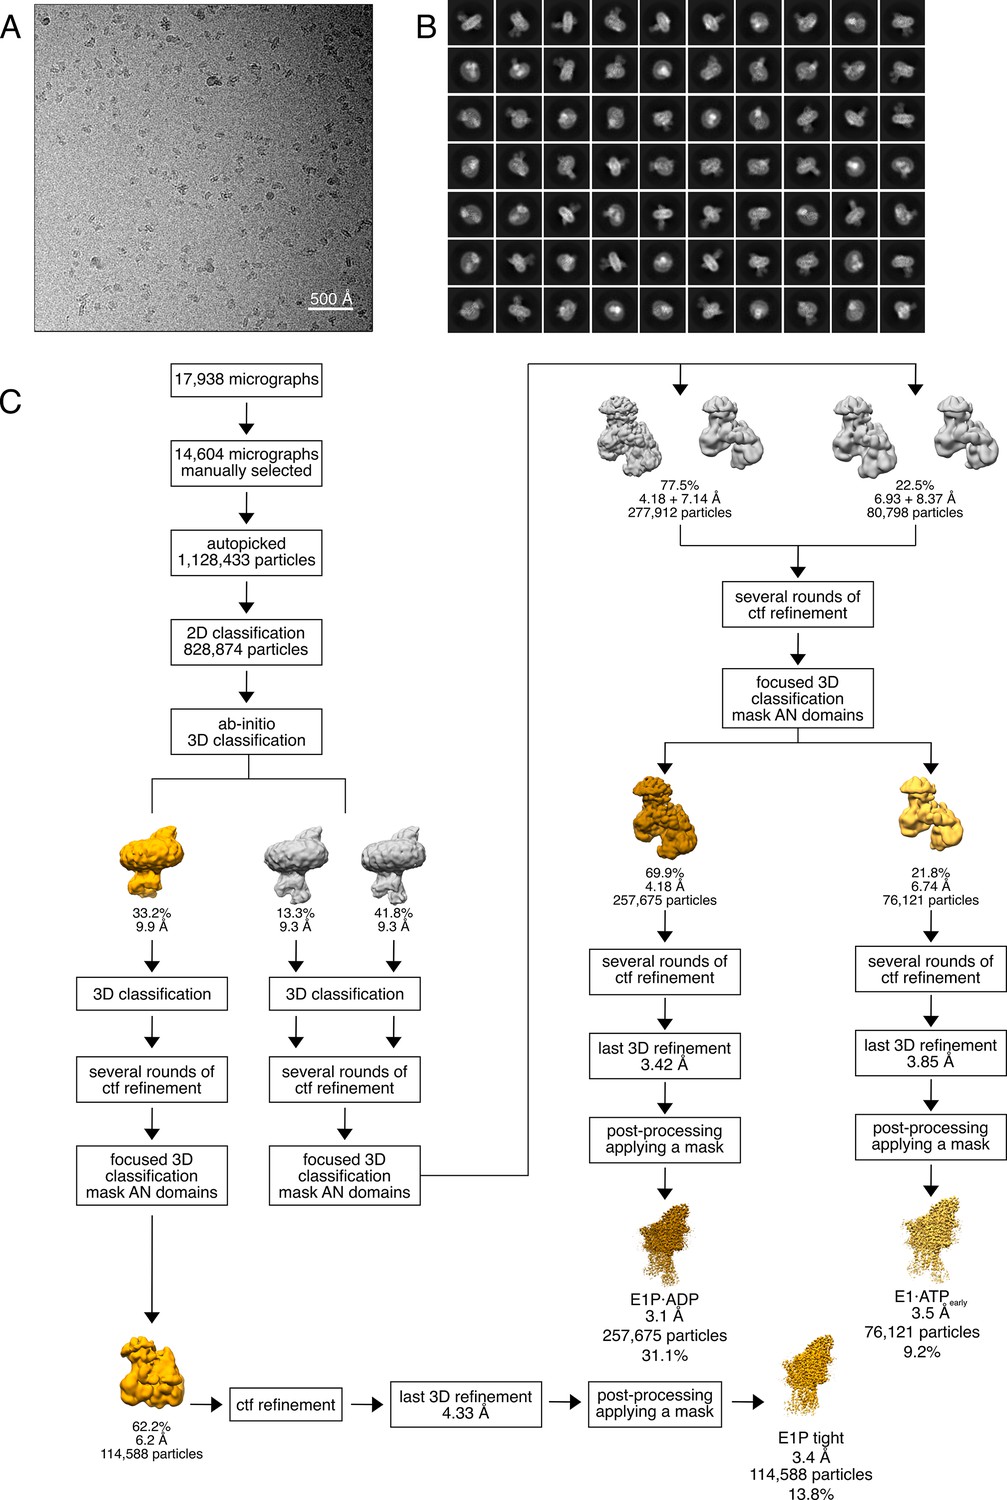
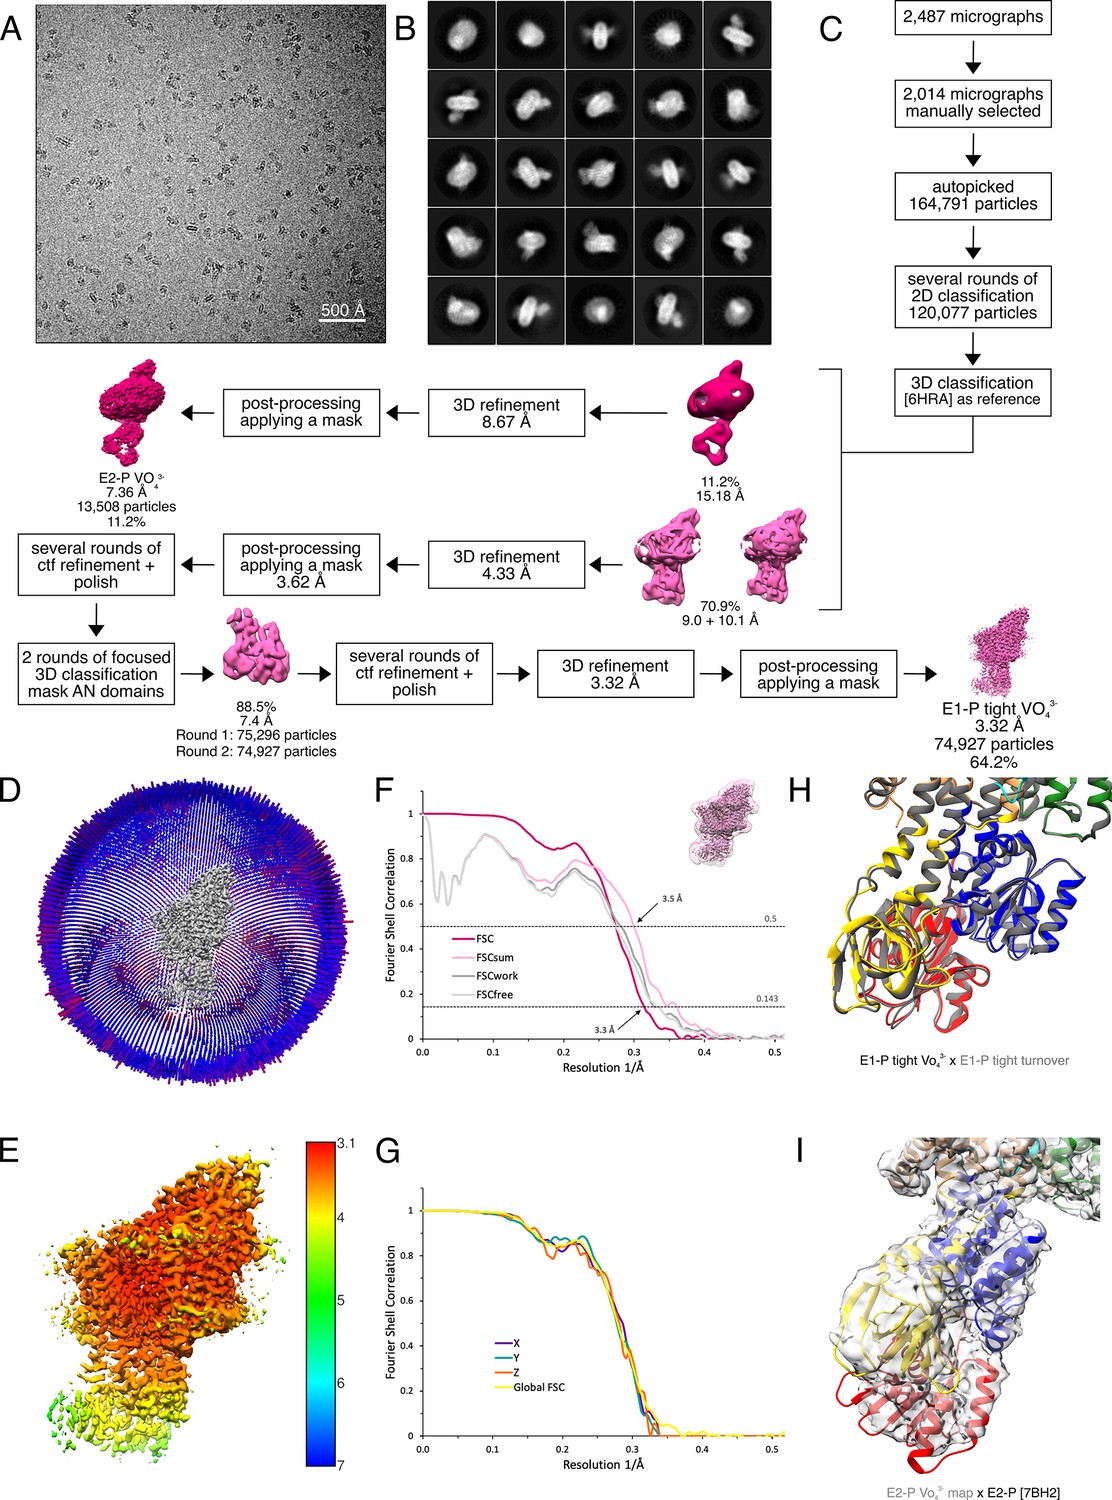
Cryo-EM analysis of the WT KdpFABS162-PC complex under turnover conditions, resulting in the E1P tight, E1P·ADP, and E1·ATPearly states.
(A) Representative cryo-EM image of the recorded data and (B) 2D class averages of vitrified WT KdpFABS162-PC in the presence of 2 mM ATP and 50 mM KCl. (C) Image processing workflow as described in Materials and methods. Indicated class percentages refer to the initial set of particles defined after 2D classification.
Figure 2—figure supplement 2
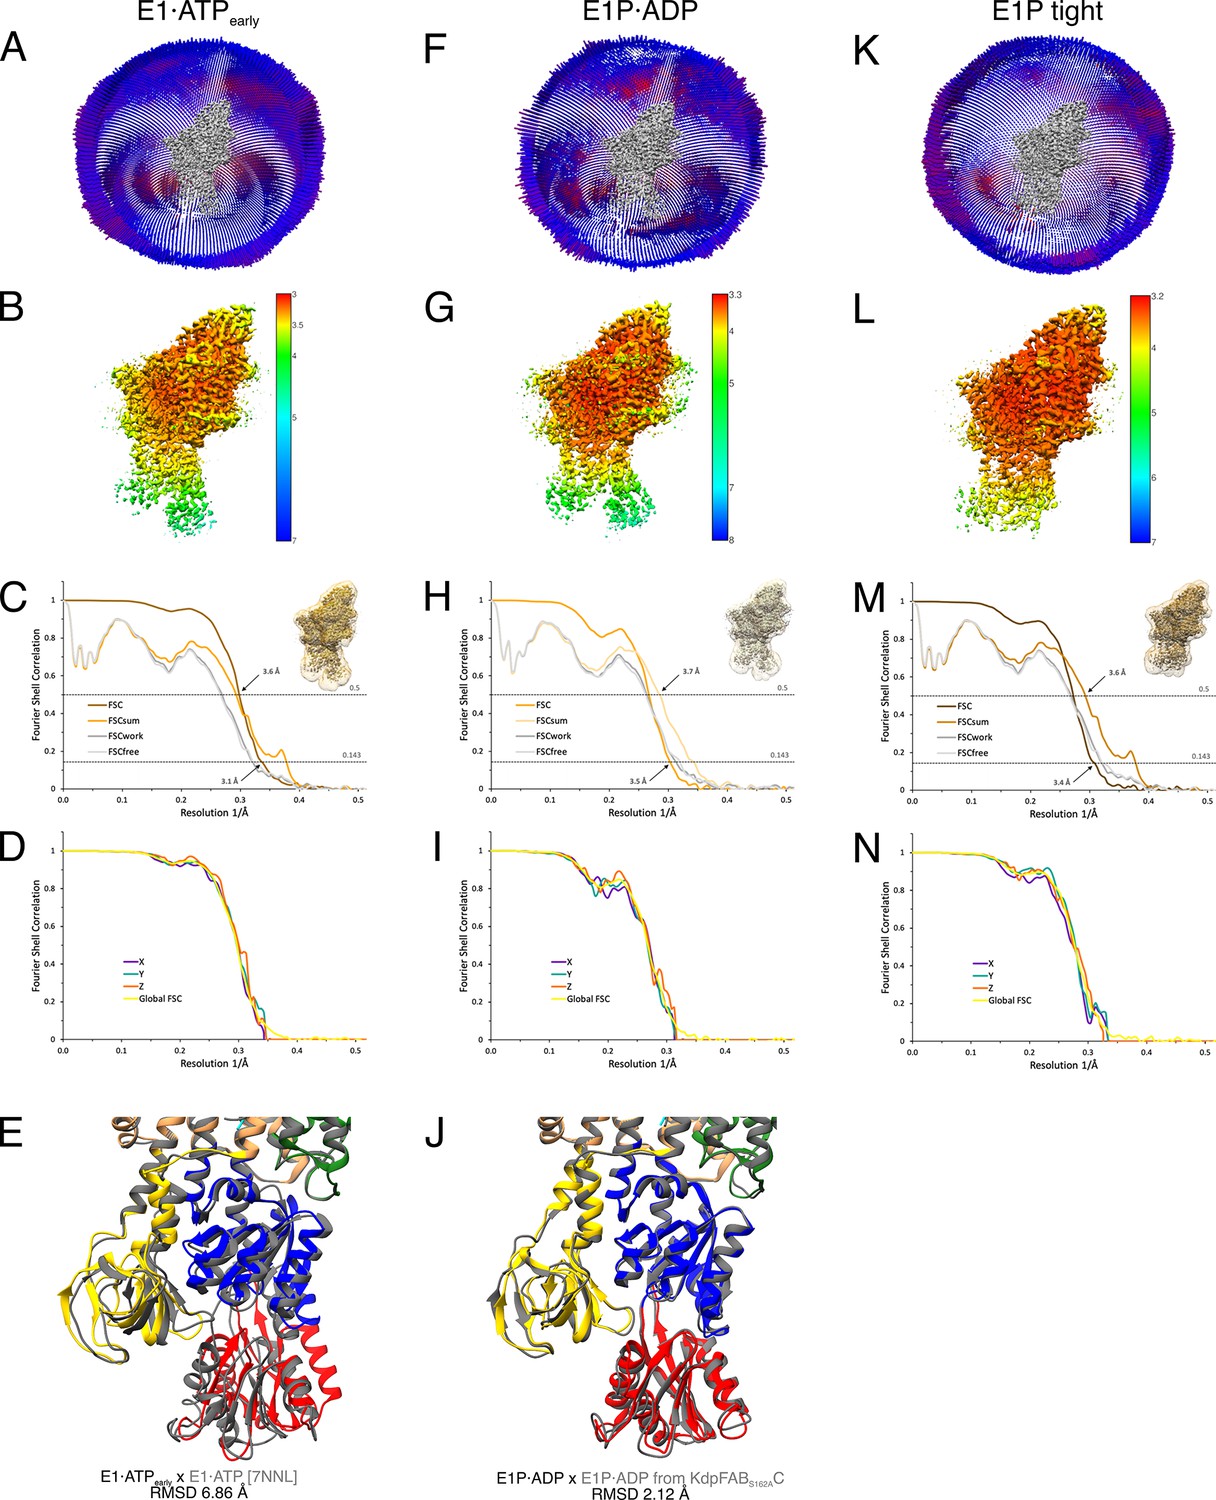
Cryo-EM validation of WT KdpFABS162-PC under turnover.
Validation shown for the E1·ATPearly state (A–E), the E1P·ADP state (F–J), and the E1P tight state (K–N). (A, F, K) Angular distribution plots of particles included in the final unsymmetrized 3D reconstruction. The number of particles with the respective orientations is represented by length and color of the cylinders (long and red: high number of particles; short and blue: low number of particles). (B, G, L) Final reconstruction maps colored by local resolution as estimated by RELION. (C, H, M) Fourier shell correlation (FSC) plots used for resolution estimation and model validation. The gold-standard FSC plot between two separately refined half-maps indicates final resolutions of 3.5 Å for the E1·ATPearly state (C), 3.1 Å for the E1P·ADP state (H), and 3.4 Å for the E1P tight state (M). The FSC model validation curves for FSCsum, FSCwork, and FSCfree are described in Materials and methods and show no overfitting. Thumbnails of the masks used for FSC calculation overlaid on the maps are shown in the upper right corner of the curves. Dashed lines indicate the FSC thresholds used for FSC (0.143) and for FSCsum (0.5). (D, I, N) Anisotropy estimation plots of the final maps show no significant anisotropy. (E) Superposition of the E1·ATPearly structure (colored) with the AMPPCP-stabilized E1·ATP structure [7NNL] (gray), showing a slightly more open N domain in the structure obtained under turnover conditions (root mean square deviation [RMSD] of the cytosolic domains 6.86 Å). (J) Superposition of the E1P·ADP structure (colored) with the same state obtained from KdpFABS162AC under turnover conditions (gray), showing the conformational identity (RMSD of the cytosolic domains 2.12 Å).
Figure 2—figure supplement 3
Proximity of A and N domains in E1P·ADP and E1P tight KdpFABC.
In the E1P tight state, the interface of the N and A domains is significantly increased compared to the low proximity observed in the E1P·ADP state.
Figure 2—figure supplement 4
Cryo-EM analysis of WT KdpFABS162-PC in the presence of orthovanadate, resulting in the E1P tight and E2P state.
(A) Representative cryo-EM image of the recorded data. (B) 2D class averages of vitrified WT KdpFABS162-PC in the presence of orthovanadate. (C) Image processing workflow as described in Materials and methods. Indicated class percentages refer to the initial set of particles defined after 2D classification. To exclude a reference bias, initial 3D classification using an E2 structure as reference did not notably alter the number of particles assigned to an E2 states. (D) Angular distribution plot of particles included in the unsymmetrized 3D reconstruction for KdpFABC. The number of particles with the respective orientation is represented by length and color of the cylinders (long and red: high number of particles; short and blue: low number of particles). (E) Final reconstruction map of the E1P tight state colored by local resolution as estimated by RELION. (F) Fourier shell correlation (FSC) plot used for resolution estimation and model validation of the E1P tight state. The gold-standard FSC plot between two separately refined half-maps is shown in red and indicates a final resolution of 3.3 Å. The FSC model validation curves for FSCsum, FSCwork, and FSCfree are described in Methods and show no overfitting. A thumbnail of the mask used for FSC calculation overlaid on the map is shown in the upper right corner. Dashed lines indicate the FSC thresholds used for FSC (0.143) and for FSCsum (0.5). (G) Anisotropy estimation plot of the final E1P tight map, showing no significant anisotropy. (H) Superposition of the E1P tight structure obtained in the presence of orthovanadate (colored) with the E1P tight structure of KdpFABS162-PC obtained under turnover conditions (gray), showing that the adopted state is identical (root mean square deviation [RMSD] of the cytosolic domains 1.59 Å). (I) Fit of the BeF3−-stabilized E2P structure [7BH2] (colored) into the E2P map obtained in the presence of orthovanadate (gray), verifying the assignment of the E2P state.
Figure 2—figure supplement 5
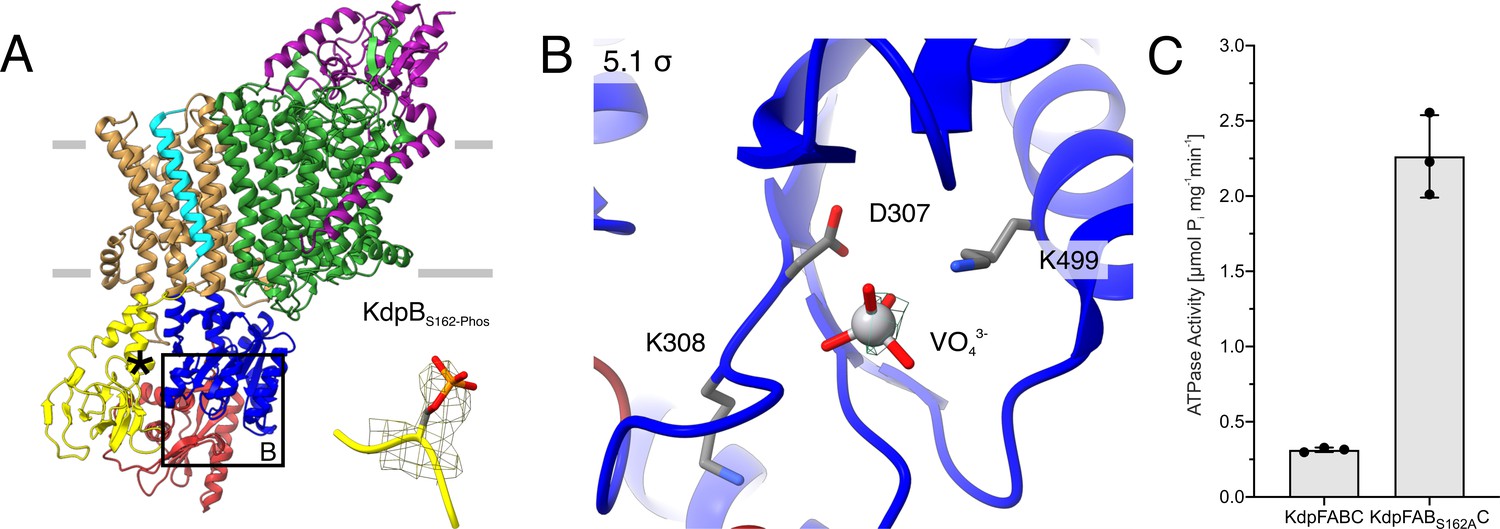
E1P tight structure of WT KdpFABS162-PC in the presence of orthovanadate.
(A) The E1P tight structure obtained from KdpFABS162-PC in the presence of orthovanadate with the KdpBS162 phosphorylation highlighted. (B) Nucleotide-binding site in the P domain of the E1P tight state, showing the coordinated orthovanadate (VO43−) that mimics phosphorylation of the catalytic KdpBD307. Densities are shown at the indicated σ level. (C) ATPase activity of KdpFABC and KdpFABS162AC purified from E. coli LB2003 cells. The residual activity of the phosphorylated sample (KdpFABC) is around 14% of the non-inhibited activity. Bars denote the mean and error bars the standard deviation from technical triplicate measurements.
Figure 3 with 2 supplements
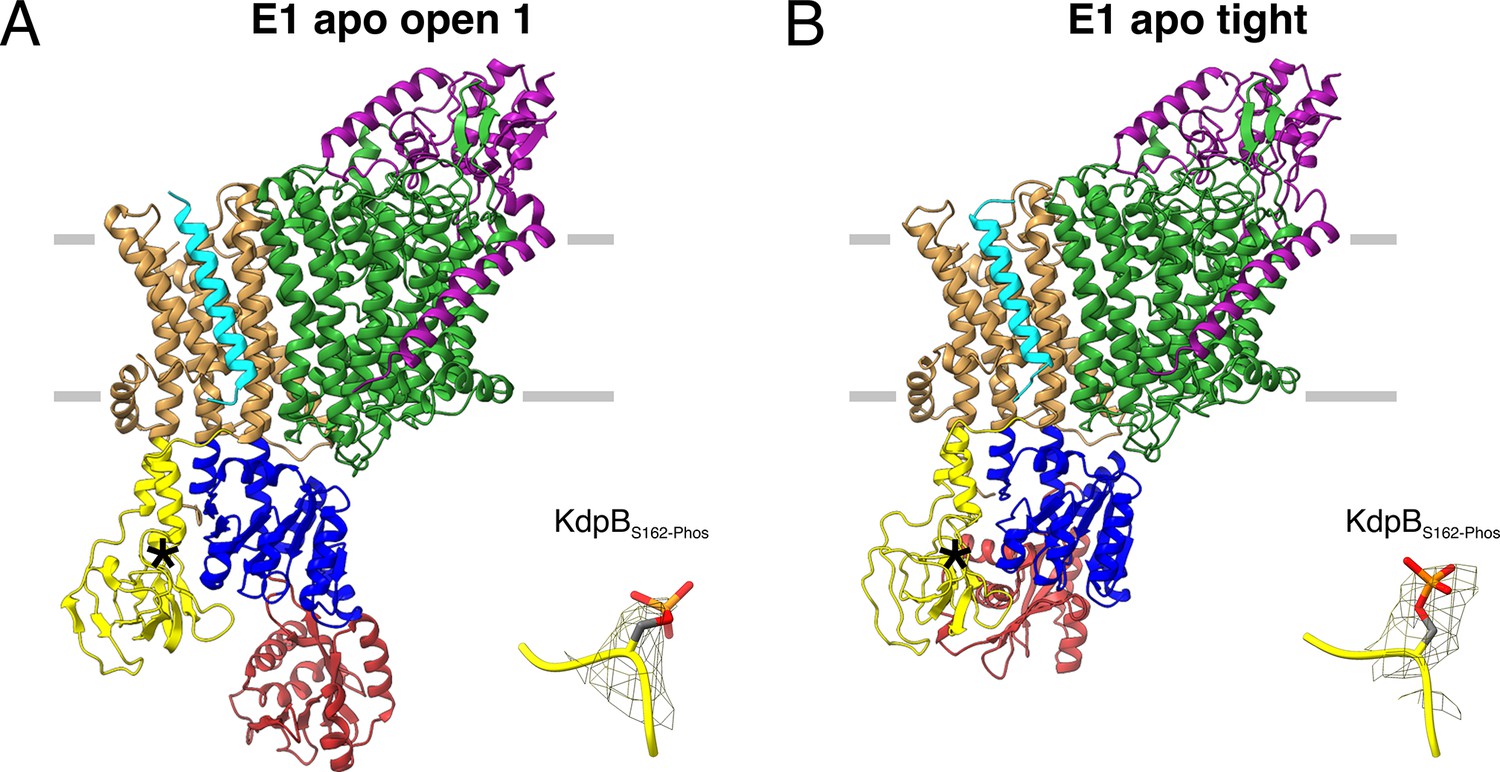
E1 apo structures of KdpFABS162-P/D307NC obtained under nucleotide-free conditions.
(A) E1 apo open substate 1 structure with the corresponding density of KdpBS162 phosphorylation. The E1 apo open substate 2 differs by a slightly displaced orientation of the N domain (see also Figure 3—figure supplements 1 and 2). (B) E1 apo tight structure with the corresponding density of KdpBS162 phosphorylation.
Figure 3—figure supplement 1
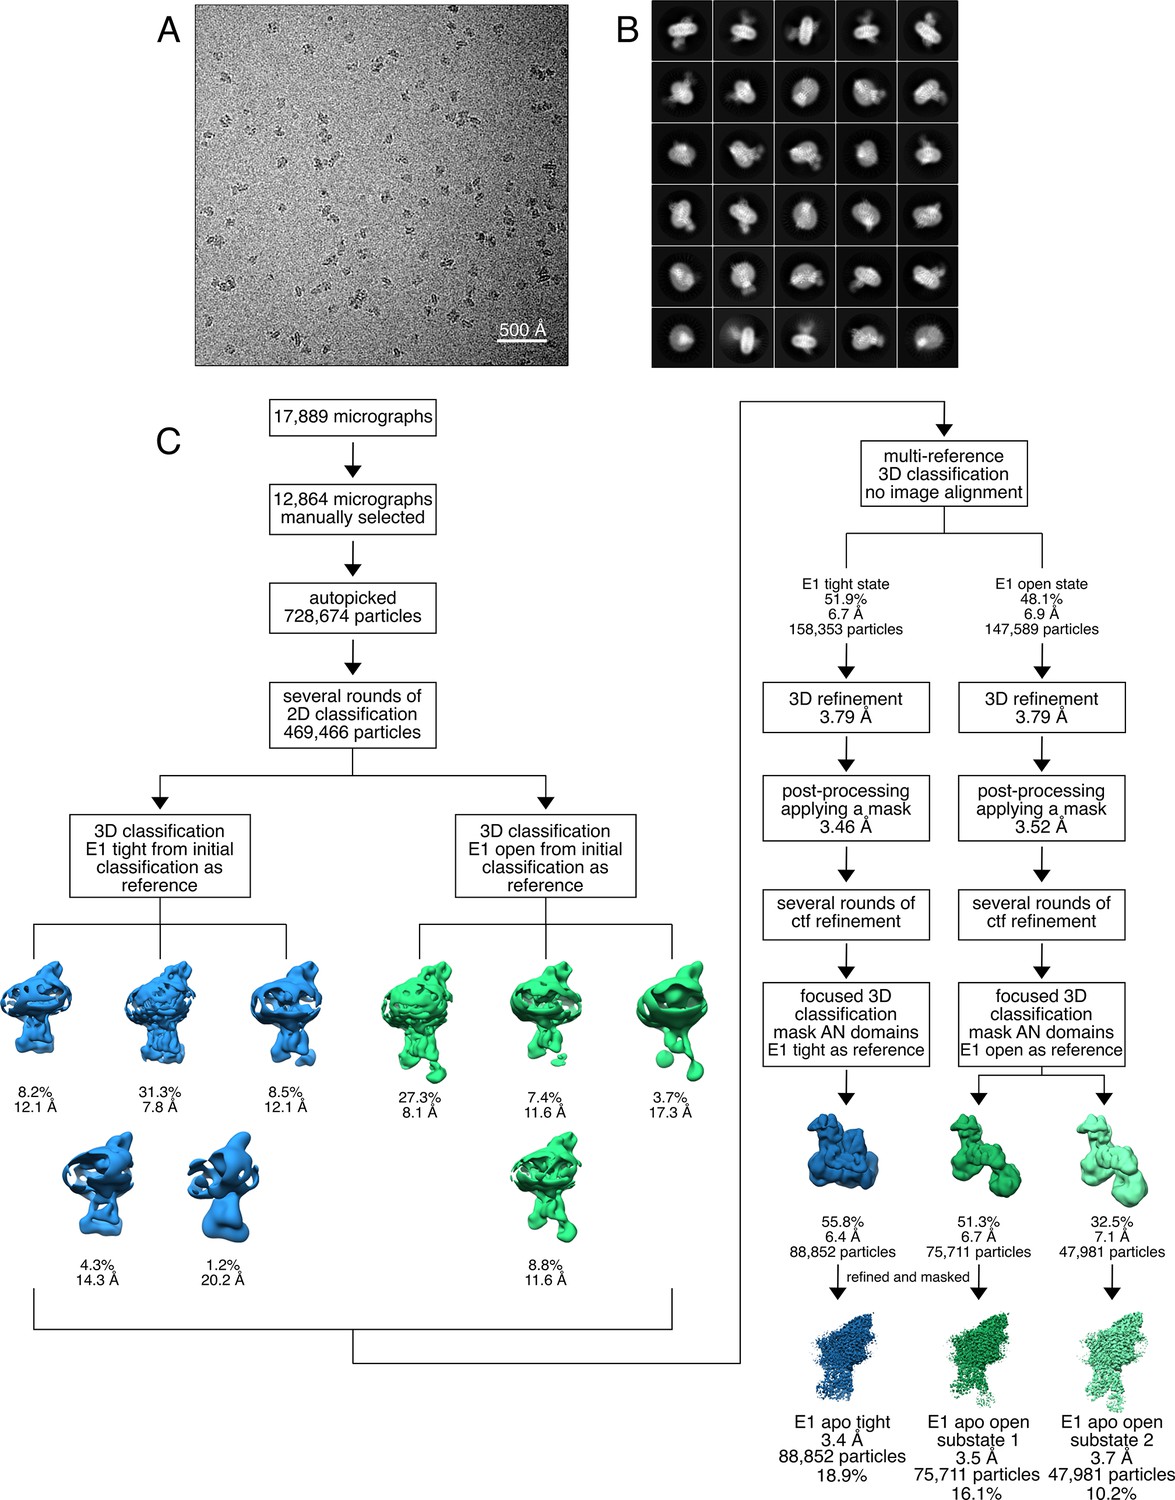
Cryo-EM analysis of the KdpFABS162-P/D307NC complex in the absence of nucleotide, resulting in the E1 apo tight and E1 apo open states.
(A) Representative cryo-EM image of the recorded data. (B) 2D class averages of vitrified KdpFABS162-P/D307NC in the presence of 50 mM KCl. (C) Image processing workflow as described in Materials and methods. Indicated class percentages refer to the initial set of particles defined after 2D classification.
Figure 3—figure supplement 2
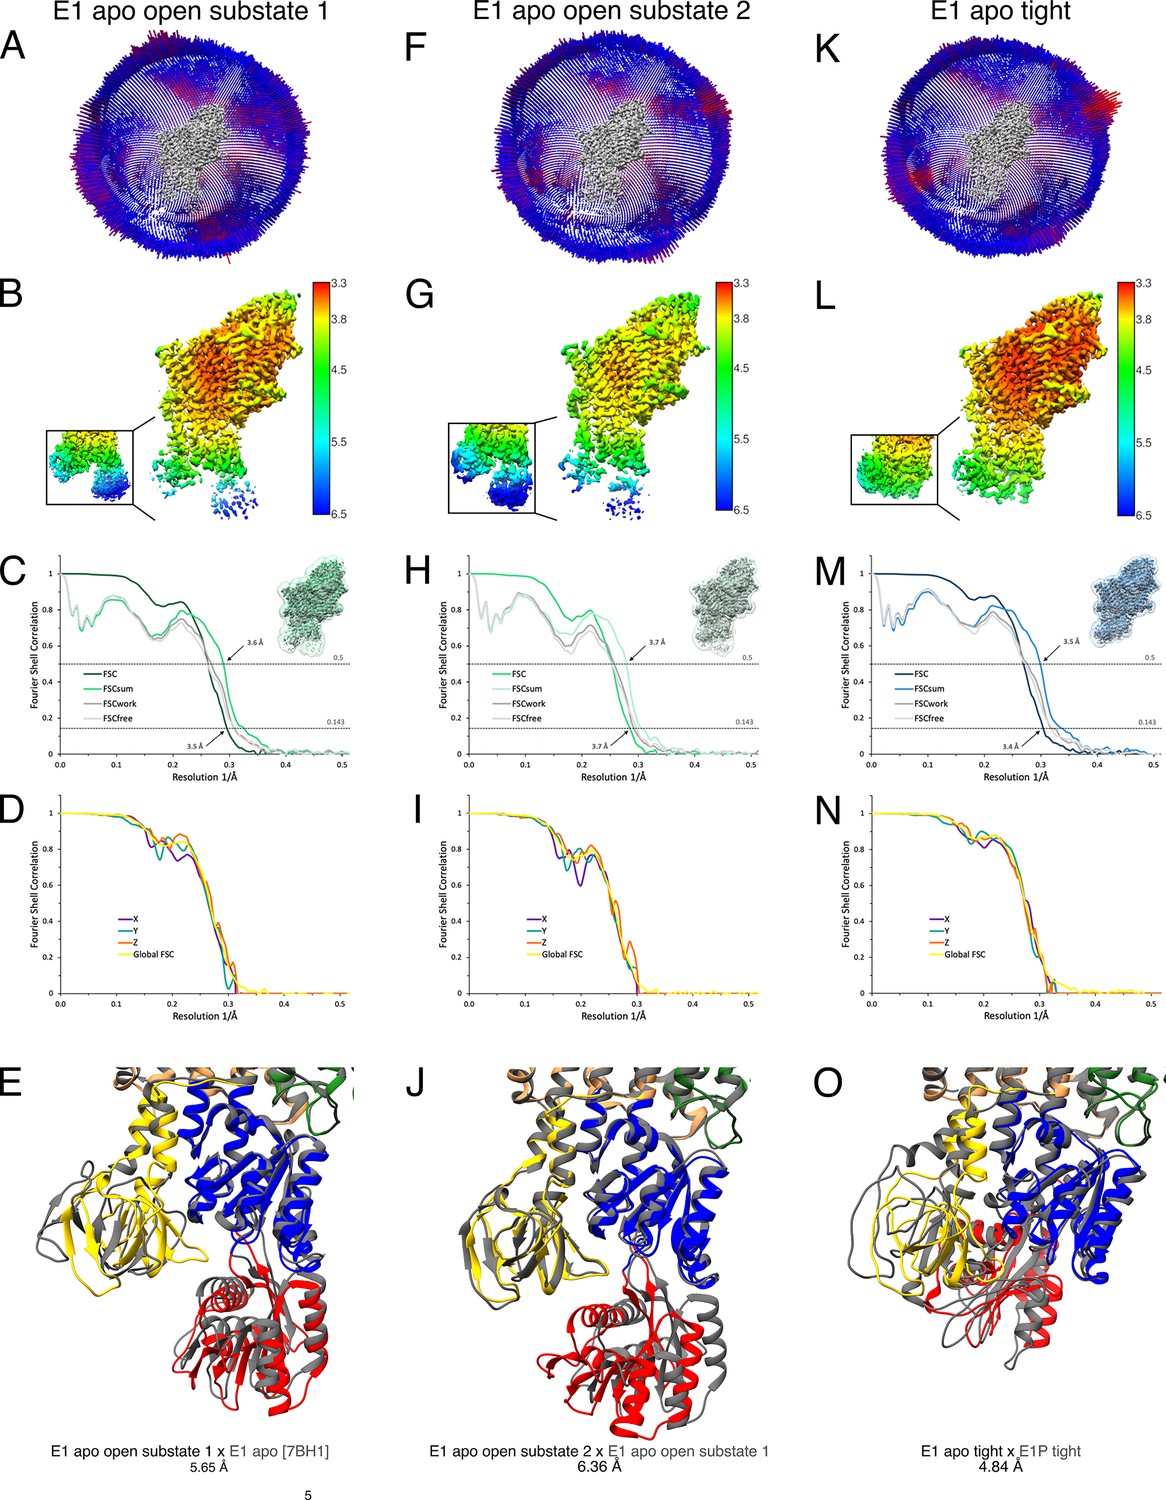
Cryo-EM validation of WT KdpFABS162-P/D307NC under nucleotide-free conditions.
Validation shown for E1 apo open substate 1 (A–E), E1 apo open substate 2 (F–J), and the E1 apo tight state (K–O). (A, F, K) Angular distribution plot of particles included in the final unsymmetrized 3D reconstruction. The number of particles with the respective orientations is represented by length and color of the cylinders (long and red: high number of particles; short and blue: low number of particles). (B, G, L) Final reconstruction maps colored by local resolution as estimated by RELION. Inset shows N, P, and A domains at higher contour level. (C, H, M) Fourier shell correlation (FSC) plots used for resolution estimation and model validation. The gold-standard FSC plot between two separately refined half-maps indicates final resolutions of 3.5 Å for the E1 apo open substate 1 (C), 3.7 Å for the E1 apo open substate 2 (H), and 3.4 Å for the E1 apo tight state (M). The FSC model validation curves for FSCsum, FSCwork, and FSCfree are described in Materials and methods and show no overfitting. Thumbnails of the masks used for FSC calculation overlaid on the map are shown in the upper right corner of the curves. Dashed lines indicate the FSC thresholds used for FSC (0.143) and for FSCsum (0.5). (D, I, N) Anisotropy estimation plots of the final maps show no significant anisotropy. (E) Superposition of E1 apo open substate 1 (colored) with the E1 apo structure [7BH1] (gray), verifying the assignment of the catalytic state while highlighting the flexibility of the open state (root mean square deviation [RMSD] of the cytosolic domains 5.65 Å). (J) Superposition of the E1 apo open substate 2 (colored) with E1 apo open substate 1 (gray), showing a slightly different arrangement of the N domain (RMSD of the cytosolic domains 6.36 Å). (O) Superposition of the E1 apo tight state with the E1P tight state obtained under turnover conditions, showing a different arrangement of the cytosolic domains (RMSD of the cytosolic domains 4.84 Å).
Figure 4 with 2 supplements

KdpBS162-P increases interdomain contacts in E1 tight states.
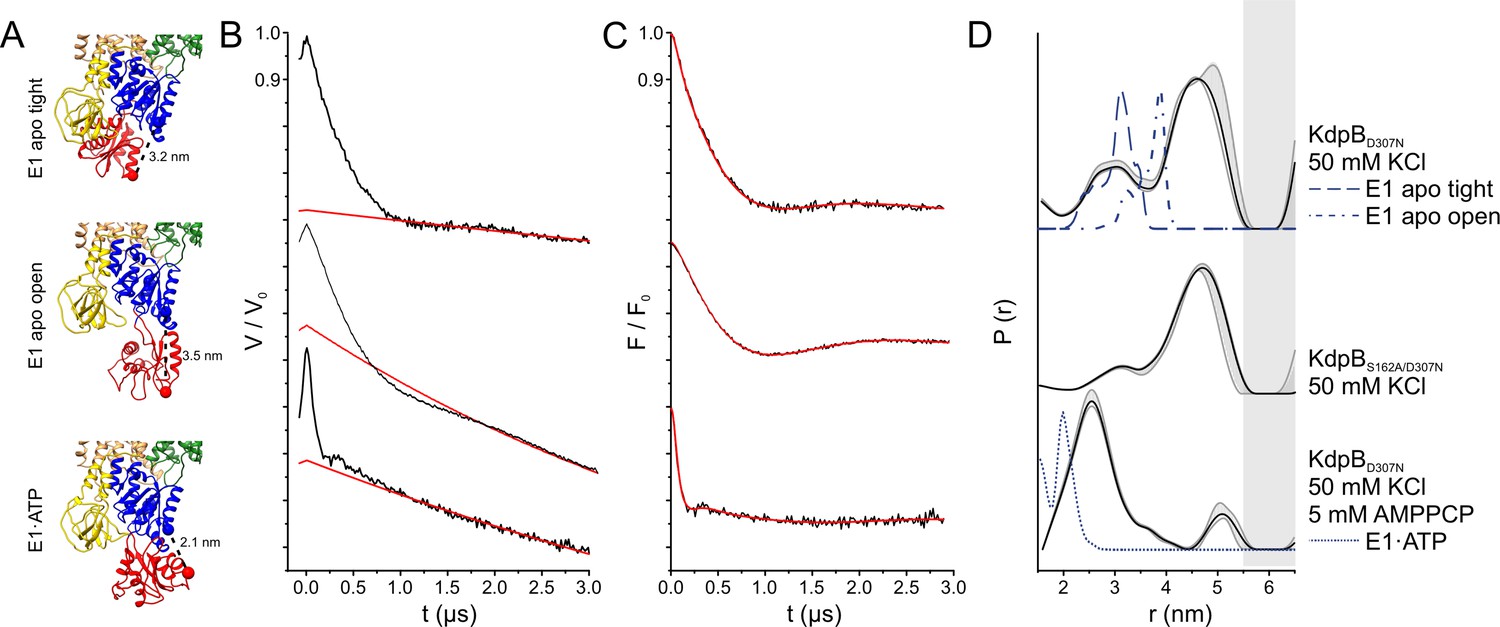
(A) Background-corrected dipolar evolution function F(t) with applied fit (red lines) of pulsed EPR measurements. (B) Area-normalized interspin distance distribution P(r) obtained by Tikhonov regularization. Two KdpFABC variants were prepared with 50 mM KCl and in the presence (red curve) or absence (black curves) of 5 mM AMPPCP. KdpFABD307NC and KdpFABS162A/D307NC without AMPPCP show two states, with N–P domain distances of 3 and 4.5 nm corresponding to the E1 apo tight and E1 apo open states (dominant state), respectively, as indicated by dark gray background shading. The removal of the inhibitory phosphorylation site in KdpFABS162A/D307NC showed a significant decrease of the distance corresponding to the E1 apo tight state (3 nm) compared to KdpFABD307NC. Addition of AMPPCP to KdpFABD307NC resulted in a single stabilized distance of 2.5 nm, representing the E1·ATP state, as indicated by red background shading. Light gray shaded areas starting at 5.5 nm indicate unreliable distances. (C) Contact analysis between the N, P, and A domains for all E1 structures obtained in this study. Average of the number of contacts (>90% contact) between the different domains over 3 × 50 ns molecular dynamics (MD) simulations (see also Figure 4—figure supplement 2 for details of identified high-contact interactions). Interactions between A and P or N and P domains remain consistent across all states, while interactions between A and N domains are increased only in E1 tight states.
Figure 4—figure supplement 1
Pulsed EPR measurements of KdpFABC variants in the absence and presence of AMPPCP.
(A) Cytoplasmic domains of the anticipated states with expected Cα–Cα distances indicated. (B) Experimental raw data V(t) with fitted background function (red). (C) Background-corrected dipolar evolution function F(t) with applied fit (red). (D) Interspin distance distribution P(r) (black curves) obtained by Tikhonov regularization. Gray background areas indicate the full variation of possible distance distributions. The lower and upper error estimates (gray lines) represent the respective mean value minus and plus two times its standard deviation, respectively; the larger the deviations, the less reliable the predicted distances. Dashed blue lines represent the predicted distance distributions of the E1 apo tight, the E1 apo open, and the E1·ATP states, respectively, using the MMM rotamer library analysis. Gray shaded areas starting at 5.5 nm indicate unreliable distances.
Figure 4—figure supplement 2
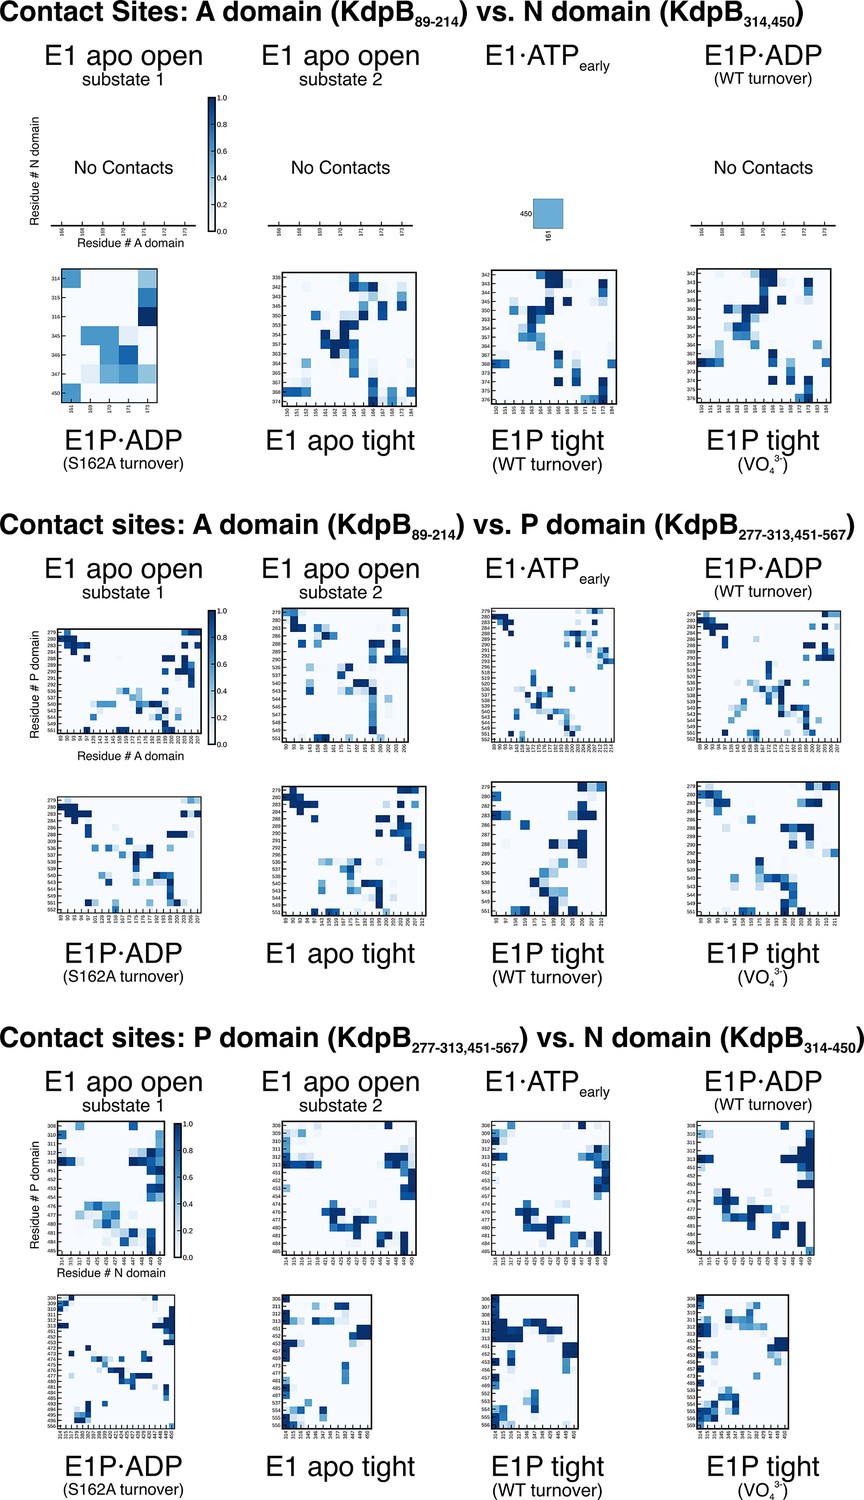
KdpBS162-P mediates stabilization of the E1P tight state.
(A) Contact site analysis of the KdpB N, P, and A domains in the E1 states of KdpFABC. For each structure, graphs show contact sites observed over 3 × 50 ns molecular dynamics (MD) simulations, where darker squares represent longer contact in the simulation time. Empty x-axes indicate no contacts.
Figure 5 with 2 supplements
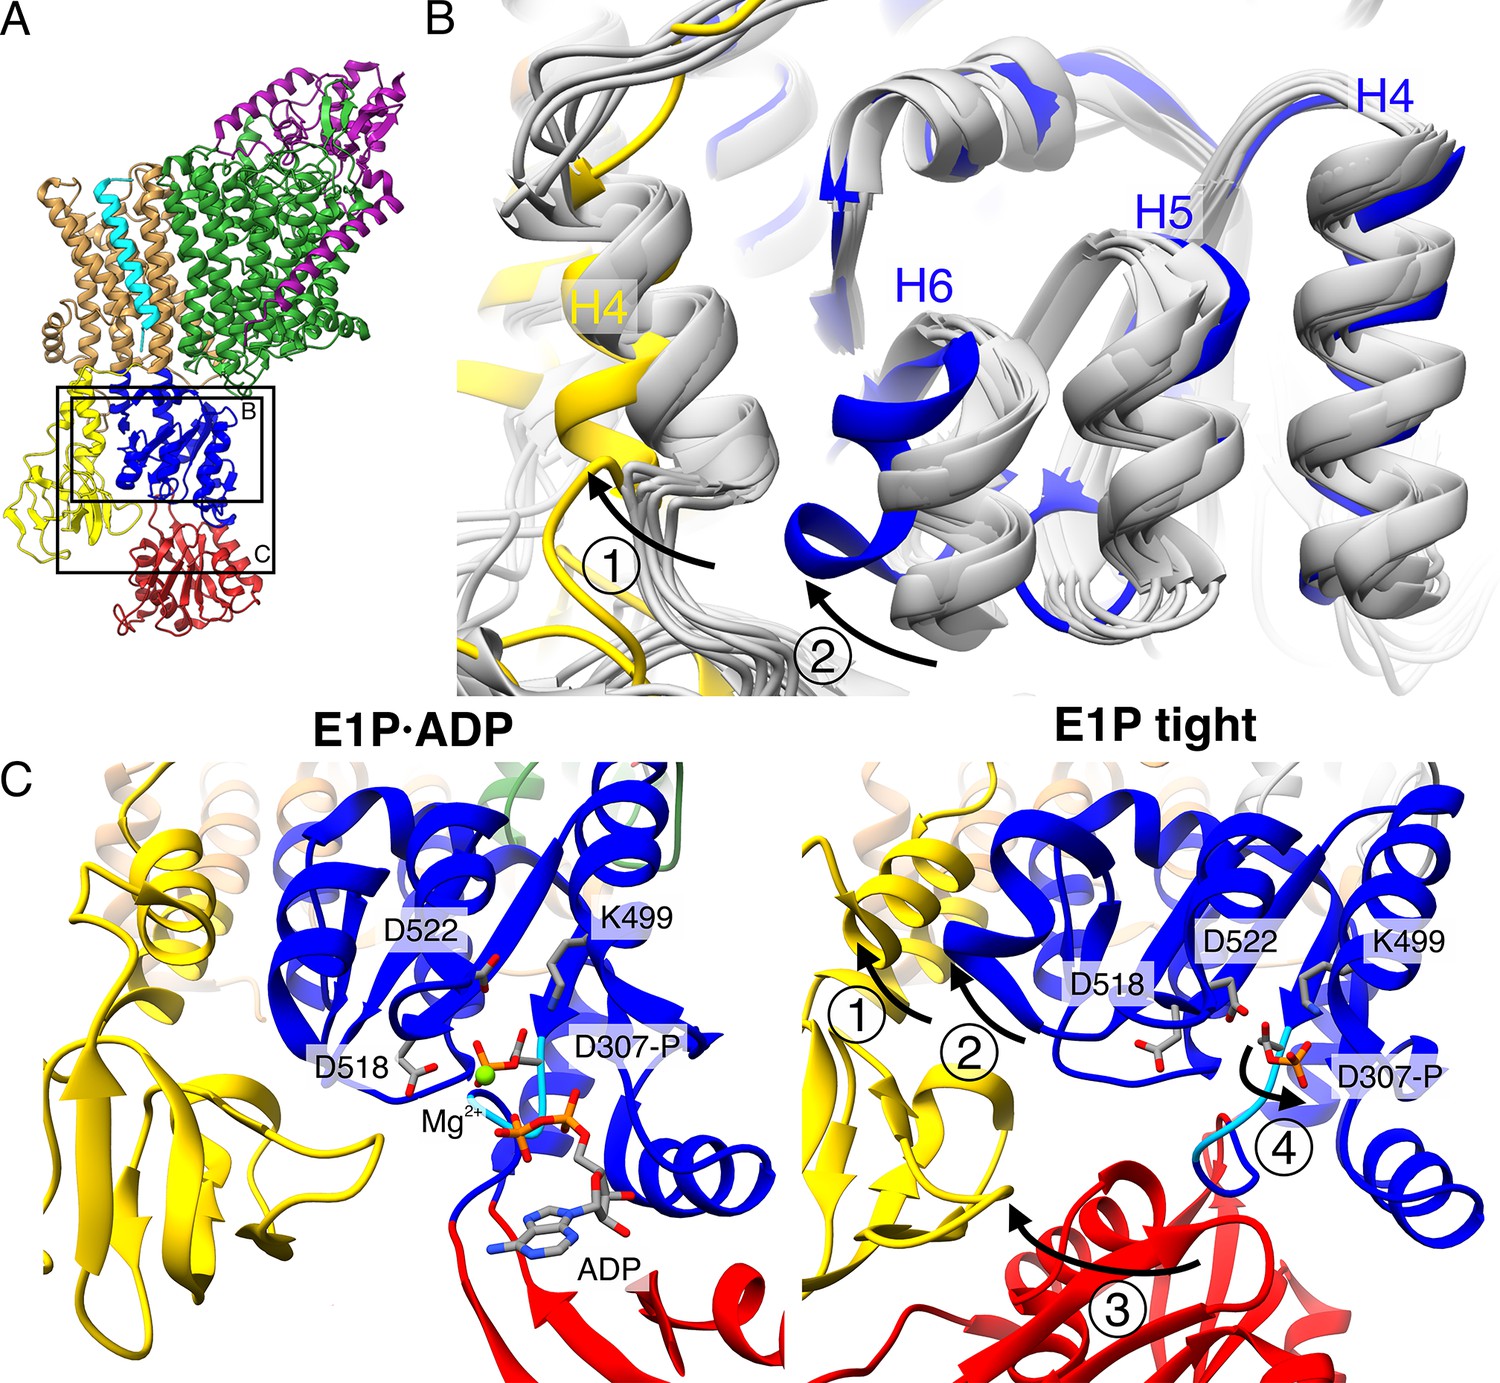
Structural rearrangements in the E1P tight state facilitate KdpFABS162-PC stalling.
(A) Structure of KdpFABS162-PC in the E1P·ADP state obtained at turnover conditions. (B) Overlay of all E1 structures determined in this study (in gray) shows helix rearrangements particular to the E1P tight state (in color). Arrow 1 indicates how A domain helix 4 tilts away from the transmembrane domain (TMD) by 26°; Arrow 2 indicates how P domain helix 6 moves along with A domain helix 4, slightly uncoiling and shifting away from the remaining P domain. (C) Vicinity of the catalytic aspartyl phosphate (KdpBD307-P) in the KdpFABS162-PC E1P·ADP and E1P tight structures, showing rearrangements in the P domain to ease tensions of the E1P state. In the high-energy E1P·ADP state, KdpBD307-P shows strong electrostatic clashes with KdpBD518/D522 (2.9 and 3.5 Å, respectively). These are alleviated by rearrangements in the E1P tight state. Arrow 3 indicates the movement of the N domain toward the A domain in the tight state, which pulls on the D307KTG loop (light blue) containing the aspartyl phosphate to uncoil and reorient it. Arrow 4 indicates how this rearrangement reorients the phosphorylated KdpBD307-P away from KdpBD518/D522 (7.8 and 4.1 Å, respectively) to form a salt bridge with KdpBK499 (3.9 Å).
Figure 5—figure supplement 1
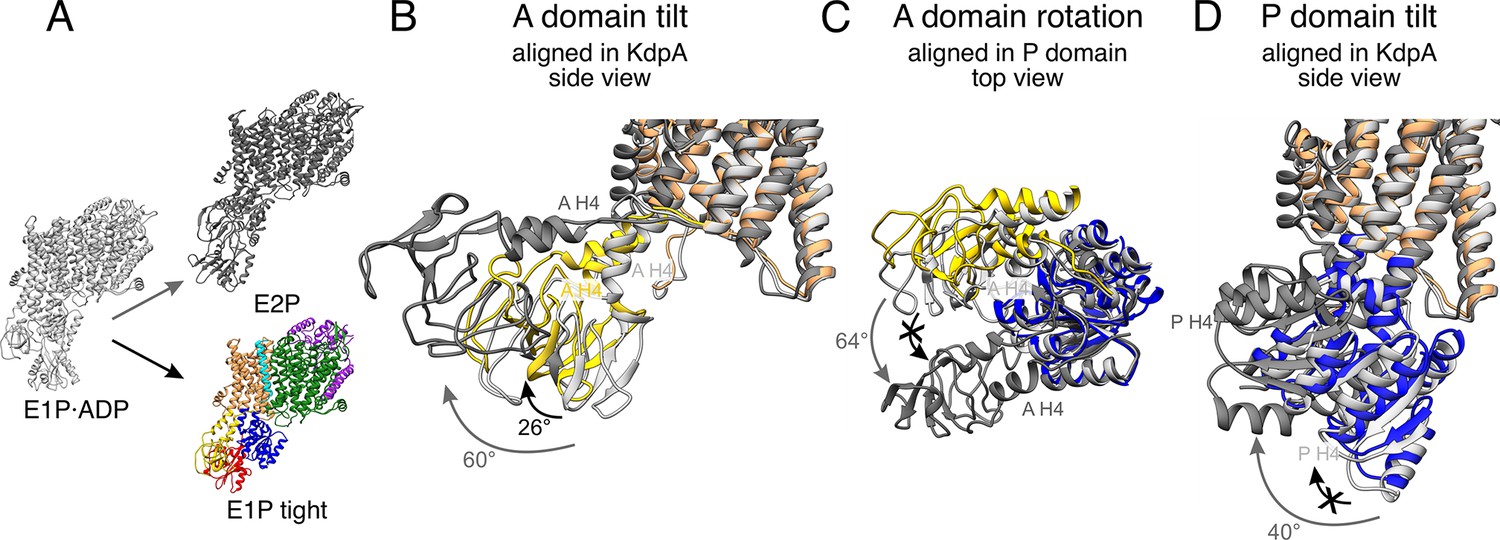
Stalling of A and P domain movements of the E1P/E2P transition in the E1P tight state.
(A) Comparison of KdpFABS162-PC in the E1P tight state (colored) with KdpFABS162AC in the E1P·ADP (light gray) and E2P (dark gray) states. Individual panels show (B) the tilt of the A domain (structures aligned on the static KdpA, N, and P domains removed for clarity), (C) the rotation of the A domain around the P domain (structure of the cytosolic domains aligned on the P domain, N domain, and the transmembrane domain [TMD] removed for clarity), and (D) the tilt of the P domain (structures aligned on the static KdpA, A, and N domains removed for clarity). During the E1P/E2P transition (gray arrows), the A domain tilts by 60°, while the P domain tilts by 40°. Additionally, the A domain rotates by 64° around the P domain. The E1P tight state shows a partial ‘attempted’ transition (black arrows), with a tilt of the A domain by 26°, although the P domain does not undergo global rearrangements and the A domain does not complete its rotation around the P domain. Helices from the A and P domains used for angle measurements are labeled in all panels.
Figure 5—figure supplement 2
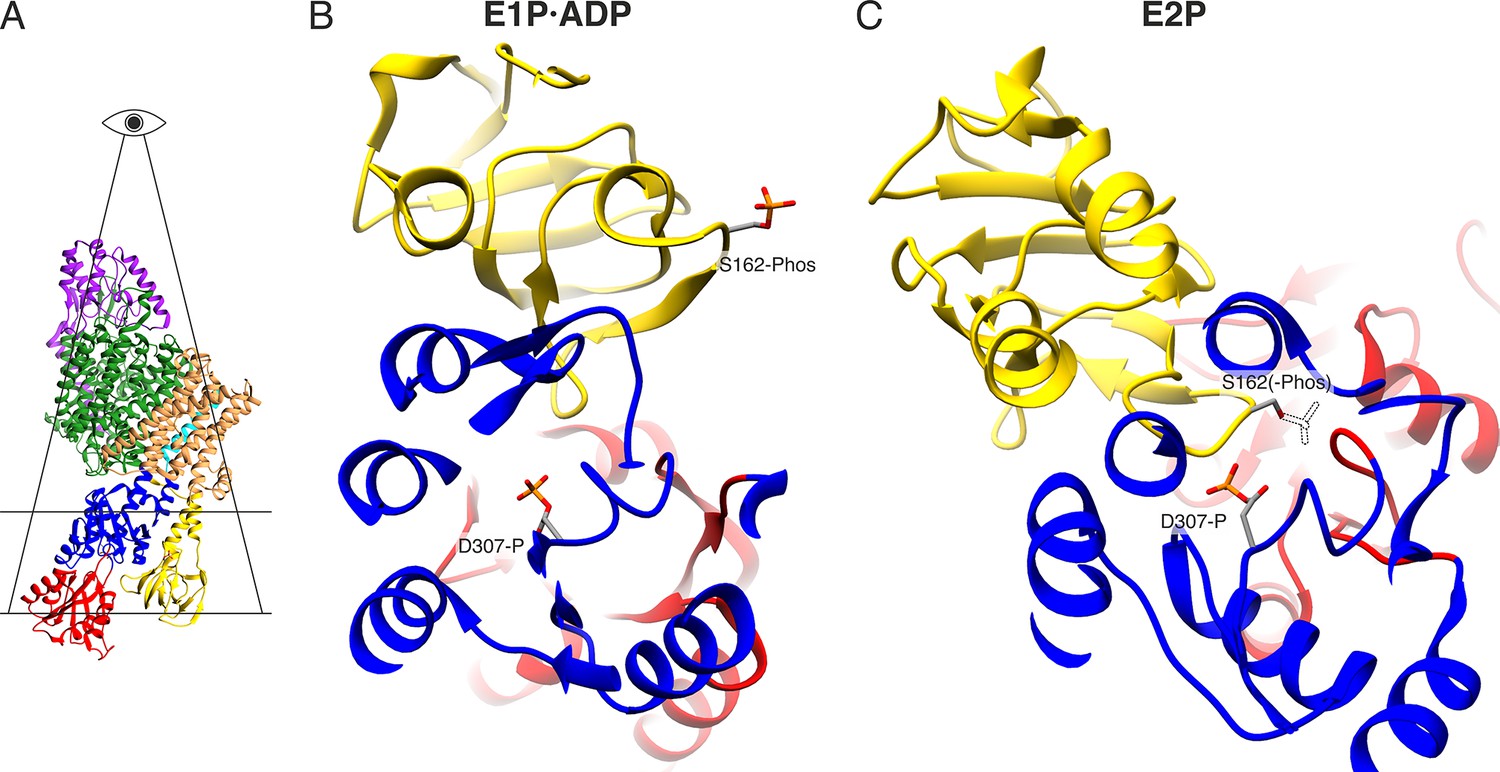
Electrostatic repulsion of KdpBS162-P and KdpBD307-P during the E1P/E2P transition.
(A) Highlighted section displayed in (B) and (C). (B) View of the proximity between KdpBD307-P and KdpBS162-P in the E1P·ADP and hypothetical E2P states. The transition to the E2P state is not possible in the inhibited KdpFABS162-PC, since the catalytic phosphate would come in close proximity with the inhibitory KdpBS162-P, whose theoretical position in the E2P state is shown as a dashed outline.
Figure 6
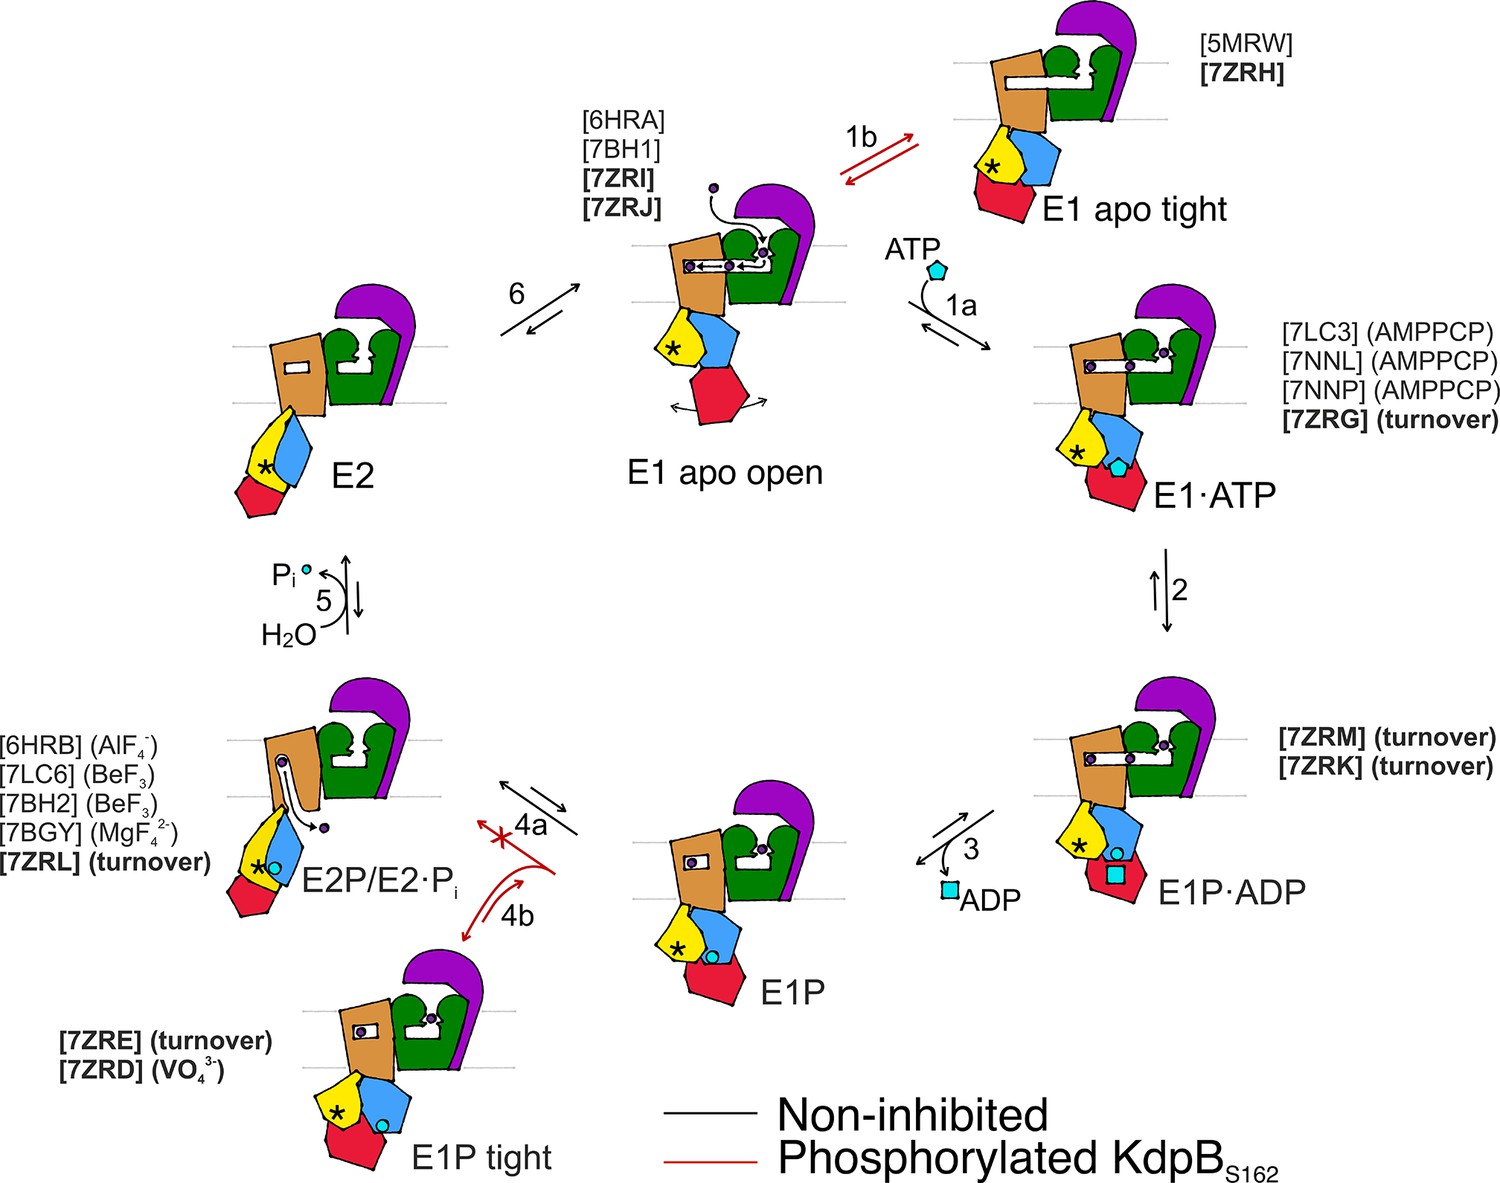
Proposed transport cycle of KdpFABC in the absence and presence of regulatory phosphorylation at KdpBS162.
Black arrows indicate the non-inhibited catalytic cycle, while red arrows denote the transitions taken when KdpBS162 is phosphorylated, and the complex is inhibited. Color code is as follows: KdpA in green, KdpC in purple, KdpB transmembrane domain (TMD) in sand with P domain in blue, N domain in red, and A domain in yellow. ATP shown as cyan pentagon; ADP as cyan rectangle; phosphorylated KdpBD307 as cyan circle; K+ ions in dark purple; the position of the TGES162 loop in the A domain as an asterisk; KdpF is removed for simplicity. All published structures for each state are listed with PDB accession code and nucleotide conditions, with those from this work highlighted in bold.
Videos
Video 1
Illustration of the non-inhibited and inhibited conformational landscape adopted by KdpFABC during its transport cycle, including the transition into the E1P-tight off-cycle state.
Tables
Table 1
Conformational landscape of KdpFABC resolved by cryo-EM.
| Protein sample | Condition | State/resolution | ||||||
|---|---|---|---|---|---|---|---|---|
| E1 apo open | E1 apo tight | E1·ATPearly | E1P·ADP | E1P tight | E2P | |||
| Substate 1 | Substate 2 | |||||||
| KdpFABS162-PC | 50 mM KCl 2 mM ATP (‘turnover’) | 3.5 Å | 3.1 Å | 3.4 Å | ||||
| 1 mM KCl 2 mM VO43− | 3.3 Å | 7.4 Å | ||||||
| KdpFABS162-P/D307NC | 50 mM KCl | 3.5 Å | 3.7 Å | 3.4 Å | ||||
| KdpFABS162AC | 50 mM KCl 2 mM ATP (‘turnover’) | 3.7 Å | 4.0 Å | |||||
-
Table 1—source data 1
Cryo-EM data collection, refinement, and validation statistics.
- https://cdn.elifesciences.org/articles/80988/elife-80988-table1-data1-v2.docx
Table 2
Root mean square deviations (RMSDs) of cytosolic domains of all available structures of KdpFABC.
For conformational comparison, RMSDs were calculated for the cytosolic domains of KdpB (residues 89–215, 275–569), as they feature the largest and, for this study, most relevant conformational differences. Structures were superimposed on KdpA, which is rigid across all conformational states. Structural comparisons involving the crystal structure [5MRW] were performed using superpositions on KdpA (column 5MRW A) and on the TM domain of KdpB (residues 1–88, 216–275, 570–682; column 5MRW B) to compensate for structural deviations in the transmembrane domain (TMD) that skew the structural alignment of the KdpB subunit. Shading indicates the RMSD range for each alignment as follows: red, above 15 Å, orange, 10-15 Å, yellow, 6-10 Å, white, 3-6 Å, green, 0-3 Å. Structures obtained in this study are highlighted in bold.
| State | E1 apo open | E1·ATP | E1P·ADP | E2P | E2P/E2·Pi | E2·Pi | E1 apo tight | E1P tight | Crystal Structure | ||||||||||||
|---|---|---|---|---|---|---|---|---|---|---|---|---|---|---|---|---|---|---|---|---|---|
| PDB | 6HRA | 7BH1 | 7ZRI | 7ZRJ | 7LC3 | 7NNL | 7NNP | 7ZRG | 7ZRM | 7ZRK | 7LC6 | 7ZRL | 6HRB | 7BGY | 7BH2 | 7ZRH | 7ZRE | 7ZRD | 5MRW A | 5MRW B | |
| E1 apo open | 6HRA (3.7 Å) | 9.67 | 8.28 | 4.14 | 10.31 | 9.69 | 10.02 | 8.59 | 9.32 | 9.50 | 17.15 | 25.42 | 24.91 | 25.01 | 25.53 | 14.25 | 13.25 | 13.07 | 14.29 | 12.06 | |
| 7BH1 (3.4 Å) | 9.67 | 5.65 | 8.16 | 15.66 | 15.06 | 15.39 | 10.40 | 14.43 | 14.79 | 22.25 | 30.81 | 30.36 | 30.40 | 31.00 | 14.78 | 14.84 | 14.67 | 18.00 | 15.26 | ||
| 7ZRI (3.5 Å) | 8.28 | 5.65 | 6.36 | 14.83 | 14.14 | 14.47 | 9.61 | 13.49 | 13.86 | 22.58 | 31.33 | 30.85 | 30.87 | 31.43 | 15.11 | 15.64 | 15.52 | 18.50 | 15.58 | ||
| 7ZRJ (3.7 Å) | 4.14 | 8.16 | 6.36 | 12.27 | 11.57 | 11.91 | 8.93 | 11.06 | 11.34 | 18.65 | 27.15 | 26.67 | 26.72 | 27.23 | 14.99 | 14.41 | 14.23 | 16.04 | 13.54 | ||
| E1·ATP | 7LC3 (3.2 Å) | 10.31 | 15.66 | 14.83 | 12.27 | 2.10 | 1.96 | 7.50 | 2.69 | 2.44 | 17.84 | 25.08 | 24.65 | 24.63 | 25.37 | 18.67 | 17.54 | 17.29 | 17.30 | 15.01 | |
| 7NNL (3.1 Å) | 9.69 | 15.06 | 14.14 | 11.57 | 2.10 | 1.75 | 6.86 | 2.41 | 2.17 | 17.95 | 25.36 | 24.92 | 24.91 | 25.62 | 18.28 | 17.25 | 17.00 | 17.19 | 14.85 | ||
| 7NNP (3.2 Å) | 10.02 | 15.39 | 14.47 | 11.91 | 1.96 | 1.75 | 7.23 | 2.61 | 2.34 | 17.84 | 25.16 | 24.72 | 24.70 | 25.42 | 18.42 | 17.34 | 17.11 | 17.14 | 14.81 | ||
| 7ZRG (3.5 Å) | 8.59 | 10.40 | 9.61 | 8.93 | 7.50 | 6.86 | 7.23 | 6.13 | 6.57 | 20.08 | 28.13 | 27.69 | 27.68 | 28.40 | 16.59 | 16.21 | 16.01 | 17.80 | 15.33 | ||
| E1P·ADP | 7ZRM (3.7 Å) | 9.32 | 14.43 | 13.49 | 11.06 | 2.69 | 2.41 | 2.61 | 6.13 | 2.12 | 18.25 | 25.75 | 25.32 | 25.32 | 26.03 | 18.00 | 17.05 | 16.81 | 17.25 | 14.91 | |
| 7ZRK (3.1 Å) | 9.50 | 14.79 | 13.86 | 11.34 | 2.44 | 2.17 | 2.34 | 6.57 | 2.12 | 17.84 | 25.32 | 24.90 | 24.88 | 25.59 | 18.23 | 17.20 | 16.96 | 17.24 | 14.86 | ||
| E2P | 7LC6 (3.7 Å) | 17.15 | 22.25 | 22.58 | 18.65 | 17.84 | 17.95 | 17.84 | 20.08 | 18.25 | 17.84 | 11.03 | 10.44 | 10.32 | 10.71 | 24.86 | 22.44 | 22.32 | 19.25 | 19.44 | |
| E2P/E2·Pi | 7ZRL (4.0 Å) | 25.42 | 30.81 | 31.33 | 27.15 | 25.08 | 25.36 | 25.16 | 28.13 | 25.75 | 25.32 | 11.03 | 2.52 | 2.43 | 2.66 | 30.42 | 27.40 | 27.30 | 22.80 | 23.23 | |
| E2·Pi | 6HRB (4.0 Å) | 24.91 | 30.36 | 30.85 | 26.67 | 24.65 | 24.92 | 24.72 | 27.69 | 25.32 | 24.90 | 10.44 | 2.52 | 1.98 | 2.18 | 30.05 | 27.05 | 26.96 | 22.42 | 22.93 | |
| 7BGY (2.9 Å) | 25.01 | 30.40 | 30.87 | 26.72 | 24.63 | 24.91 | 24.70 | 27.68 | 25.32 | 24.88 | 10.32 | 2.43 | 1.98 | 1.74 | 30.18 | 27.20 | 27.10 | 22.61 | 22.37 | ||
| 7BH2 (3.0 Å) | 25.53 | 31.00 | 31.43 | 27.23 | 25.37 | 25.62 | 25.42 | 28.40 | 26.03 | 25.59 | 10.71 | 2.66 | 2.18 | 1.74 | 30.76 | 27.77 | 27.68 | 23.11 | 22.86 | ||
| E1 apo tight | 7ZRH (3.4 Å) | 14.25 | 14.78 | 15.11 | 14.99 | 18.67 | 18.28 | 18.42 | 16.59 | 18.00 | 18.23 | 24.86 | 30.42 | 30.05 | 30.18 | 30.76 | 4.84 | 5.01 | 9.85 | 7.53 | |
| E1P tight | 7ZRE (3.4 Å) | 13.25 | 14.84 | 15.64 | 14.41 | 17.54 | 17.25 | 17.34 | 16.21 | 17.05 | 17.20 | 22.44 | 27.40 | 27.05 | 27.20 | 27.77 | 4.84 | 1.59 | 6.50 | 4.92 | |
| 7ZRD (3.7 Å) | 13.07 | 14.67 | 15.52 | 14.23 | 17.29 | 17.00 | 17.11 | 16.01 | 16.81 | 16.96 | 22.32 | 27.30 | 26.96 | 27.10 | 27.68 | 5.01 | 1.59 | 6.51 | 4.87 | ||
| Crystal Structure | 5MRW A (2.9 Å) | 14.29 | 18.00 | 18.50 | 16.04 | 17.30 | 17.19 | 17.14 | 17.80 | 17.25 | 17.24 | 19.25 | 22.80 | 22.42 | 22.61 | 23.11 | 9.85 | 6.50 | 6.51 | ||
| 5MRW B (2.9 Å) | 12.06 | 15.26 | 15.58 | 13.54 | 15.01 | 14.85 | 14.81 | 15.33 | 14.91 | 14.86 | 19.44 | 23.23 | 22.93 | 22.37 | 22.86 | 7.53 | 4.92 | 4.87 | |||
Key resources table
| Reagent type (species) or resource | Designation | Source or reference | Identifiers | Additional information |
|---|---|---|---|---|
| Gene (Escherichia coli) | kdpFABC | Uniprot IDs: kdpF: P36937; kdpA: P03959; kdpB: P03960; kdpC: P03961 | ||
| Genetic reagent | pBXC3H | doi:10.1007/978-1-62703-764-8_11 | Addgene catalog #47068 | Plasmid backbone |
| Strain, strain background (Escherichia coli) | LB2003 (F−thi metE rpsL gaI rha kup1 ∆kdpFABC5 ∆trkA) | doi:10.1007/s002030050425 | ||
| Sequence-based reagent | kdpB_S162A_for | Eurofins Genomics (Luxembourg) | 5′-GCGCCATCACCGGGGAAGCGGCACC-3′ | |
| Sequence-based reagent | kdpB_S162A_for | Eurofins Genomics (Luxembourg) | 5′-ACCGGTGCCGCTTCCCCGGTGATGG-3′ | |
| Sequence-based reagent | kdpB_D307N_for | Eurofins Genomics (Luxembourg) | 5′-GCTACTGAATAAAACCGGCACCATCAC-3′ | |
| Sequence-based reagent | kdpB_D307N_rev | Eurofins Genomics (Luxembourg) | 5′-GGTGCCGGTTTTATTCAGTAGCAGAACG-3′ | |
| Sequence-based reagent | kdpB_A407C_for | Eurofins Genomics (Luxembourg) | 5′-CATTCGTCGCCATGTTGAGTGTAACGG-3′ | |
| Sequence-based reagent | kdpB_A407C_rev | Eurofins Genomics (Luxembourg) | 5′-CGTTACACTCAACATGGCGACGAATGG-3′ | |
| Sequence-based reagent | kdpB_A494C_for | Eurofins Genomics (Luxembourg) | 5′-GATTTTCTCGCCGAATGTACACCGGAGGCC-3′ | |
| Sequence-based reagent | kdpB_A494C_rev | Eurofins Genomics (Luxembourg) | 5′-GGCCTCCGGTGTACATTCGGCGAGAAAATC-3′ | |
| Chemical compound, drug | MTSSL | Toronto Research Chemicals Inc, North York, Canada | EPR spin label | |
| Chemical compound, drug | Orthovanadate | Merck KGaA, Darmstadt, Germany | ||
| Chemical compound, drug | Adenosine 5′-triphosphate | Merck KGaA, Darmstadt, Germany | ||
| Software, algorithm | DeerAnalysis | doi:10.1007/BF03166213 | ||
| Other | 200 and 300 mesh Au R1.2/1.3 cryo-EM grids | Quantifoil, Großlöbichau, Germany | Cryo-EM Grids | |
| Software, algorithm | EPU v 2.3 | Thermo Fisher (Eindhoven, Netherlands) https://www.thermofisher.com/nl/en/home/electron-microscopy/products/software-em-3d-vis/epu-software.html | ||
| Software, algorithm | Sample thickness measurement script | https://doi.org/10.1101/2020.12.01.392100 | ||
| Software, algorithm | Focus | https://doi.org/10.1016/j.jsb.2017.03.007 https://focus.c-cina.unibas.ch/about.php | ||
| Software, algorithm | SBGrid | https://doi.org/10.7554/eLife.01456 https://sbgrid.org/software/ | ||
| Software, algorithm | MotionCor2 | https://doi.org/10.1038/nmeth.4193 http://msg.ucsf.edu/em/software/motioncor2.html | ||
| Software, algorithm | Ctffind 4.1.13 | https://doi.org/10.1016/j.jsb.2015.08.008 http://grigoriefflab.janelia.org/ctf | ||
| Software, algorithm | Ctffind 4.1.14 | https://doi.org/10.1016/j.jsb.2015.08.008 http://grigoriefflab.janelia.org/ctf | ||
| Software, algorithm | crYOLO 1.3.1 | https://doi.org/10.1038/s42003-019-0437-z https://cryolo.readthedocs.io/en/stable/ | ||
| Software, algorithm | crYOLO 1.7.6 | https://doi.org/10.1038/s42003-019-0437-z https://cryolo.readthedocs.io/en/stable/ | ||
| Software, algorithm | cryoSPARC 3.2.0 | https://doi.org/10.1038/nmeth.4169 https://cryosparc.com | ||
| Software, algorithm | RELION 3.0.8 | https://doi.org/10.7554/eLife.42166 https://www2.mrc-lmb.cam.ac.uk/relion/ | ||
| Software, algorithm | RELION 3.1.1 | https://doi.org/10.7554/eLife.42166 https://www2.mrc-lmb.cam.ac.uk/relion/ | ||
| Software, algorithm | Coot 0.9 | https://doi.org/10.1107/S0907444904019158 https://www2.mrc-lmb.cam.ac.uk/personal/pemsley/coot/ | ||
| Software, algorithm | Phenix 1.19.2 | https://doi.org/10.1107/S2059798318006551 http://phenix-online.org/ | ||
| Software, algorithm | Molprobity 4.5.1 | https://doi.org/10.1002/pro.3330 http://molprobity.biochem.duke.edu | ||
| Software, algorithm | UCSF Chimera 1.15 | https://doi.org/10.1002/jcc.20084 https://www.cgl.ucsf.edu/chimera/ | ||
| Software, algorithm | UCSF Chimerax 1.1.1 | https://doi.org/10.1002/pro.3943 https://www.rbvi.ucsf.edu/chimerax/ | ||
| Software, algorithm | Origin Pro 2016 | OriginLab https://www.originlab.com/2016 | ||
| Software, algorithm | Gromacs 2019.4 | https://doi.org/10.1016/0010-4655(95)00042-E https://www.gromacs.org/ | ||
| Software, algorithm | VMD 1.9.4a12 | https://doi.org/10.1016/0263-7855(96)00018-5 http://www.ks.uiuc.edu/Research/vmd/ | ||
| Software, algorithm | charmm-gui | https://doi.org/10.1021/acs.jctc.5b00935 http://www.charmm-gui.org/ | ||
| Software, algorithm | MDAnalysis 1.0.1 | https://doi.org/10.1002/jcc.21787 https://www.mdanalysis.org/ | ||
| Software, algorithm | NumPy 1.20.0 | https://doi.org/10.1038/s41586-020-2649-2 https://numpy.org/ | ||
| Software, algorithm | matplotlib 3.3.4 | https://doi.org/10.1109/MCSE.2007.55 https://matplotlib.org/ | ||
| Software, algorithm | GraphPad Prism 8 and 9 | https://www.graphpad.com/scientific-software/prism/ | ||
| Software, algorithm | HOLE 2.2.004 | https://doi.org/10.1016/S0263-7855(97)00,009X | ||
| Software, algorithm | HOLLOW 1.3 | https://doi.org/10.1186/1472-6807-8-49 |
Table 3
Details of molecular dynamics (MD) simulations run.
All simulations were run in POPE membranes, over 3 × 50 ns. Root mean square deviations (RMSDs) are the mean and standard deviations over three repeats.
| State | RMSD (nm) |
|---|---|
| E1 apo open 1 (nucleotide-free) | 0.47 ± 0.09 |
| E1 apo open 2 (nucleotide-free) | 0.55 ± 0.12 |
| E1 apo tight (nucleotide-free) | 0.32 ± 0.08 |
| E1·ATPearly (turnover WT) | 0.35 ± 0.04 |
| E1P·ADP (turnover WT) | 0.51 ± 0.04 |
| E1P·ADP (turnover KdpBS162A) | 0.30 ± 0.06 |
| E1P tight (turnover WT) | 0.31 ± 0.04 |
| E1P tight (orthovanadate) | 0.27 ± 0.03 |
Table 4
EMDB and PDB accession codes of structure depositions.
| State | EMDB # | PDB # | EMPIAR # |
|---|---|---|---|
| E1·ATPearly (turnover WT) | EMD-14913 | 7ZRG | EMPIAR-11232 |
| E1P·ADP (turnover WT) | EMD-14917 | 7ZRK | EMPIAR-11232 |
| E1P tight (turnover WT) | EMD-14912 | 7ZRE | EMPIAR-11232 |
| E1P tight (orthovanadate) | EMD-14911 | 7ZRD | EMPIAR-11230 |
| E2P (orthovanadate) | EMD-14347 | N/A | EMPIAR-11230 |
| E1P·ADP (turnover KdpBS162A) | EMD-14919 | 7ZRM | EMPIAR-11231 |
| E2P (turnover KdpBS162A) | EMD-14918 | 7ZRL | EMPIAR-11231 |
| E1 apo tight (nucleotide-free KdpBD307N) | EMD-14914 | 7ZRH | EMPIAR-11229 |
| E1 apo open 1 (nucleotide-free KdpBD307N) | EMD-14915 | 7ZRI | EMPIAR-11229 |
| E1 apo open 2 (nucleotide-free KdpBD307N) | EMD-14916 | 7ZRJ | EMPIAR-11229 |
Additional files
Download links
A two-part list of links to download the article, or parts of the article, in various formats.
Downloads (link to download the article as PDF)
Open citations (links to open the citations from this article in various online reference manager services)
Cite this article (links to download the citations from this article in formats compatible with various reference manager tools)
Inhibited KdpFABC transitions into an E1 off-cycle state
eLife 11:e80988.
https://doi.org/10.7554/eLife.80988


