Postsynaptic burst reactivation of hippocampal neurons enables associative plasticity of temporally discontiguous inputs
- Department of Physiology, Development and Neuroscience, Physiological Laboratory, University of Cambridge, United Kingdom
- Department of Bioengineering, Imperial College London, United Kingdom
- Department of Physiology, Michigan State University, United States
Figures
Figure 1

Postsynaptic burst reactivation induces LTP in the presence of dopamine (DA).
(A), Schematic of the experimental paradigm (top) and setup (bottom).↓=6 action potential bursts; Whole-cell recording in CA1 stratum pyramidale; electrical stimulation electrodes in stratum radiatum. Plasticity was induced in one pathway (Paired pathway), and a second pathway was used for stability control and for confirmation of input specificity (Control pathway). Normalized EPSP slopes were averaged and plotted as a function of time. (B), Post-before pre-pairing protocol leads to input-specific synaptic depression. Pairing protocol (Δt = –20 ms) induces t-LTD (black trace) and does not affect synaptic weights in control pathway (gray trace). (C), DA application after a post-before-pre pairing protocol (Δt = –20 ms) does not prevent t-LTD (+DA –Burst, blue trace) and does not affect synaptic weights in control pathway (gray trace). (D), Application of DA together with action potential bursts of the postsynaptic cell (indicated by black arrow) induces synaptic potentiation after a post-before-pre pairing protocol (Δt = –20 ms) (+DA +Burst, red trace) and does not affect synaptic weights in control pathway (gray trace). (E), The same protocol, without application of DA, leads to synaptic depression (–DA +Burst, black trace) and does not affect synaptic weights in control pathway (gray trace). (F), Summary of results. All traces show an EPSP before (1) and 40 min after pairing (2). Plots show averages of normalized EPSP slopes ± SEM.
-
Figure 1—source data 1
Normalized EPSP slopes of all recorded cells.
- https://cdn.elifesciences.org/articles/81071/elife-81071-fig1-data1-v2.xlsx
Figure 2
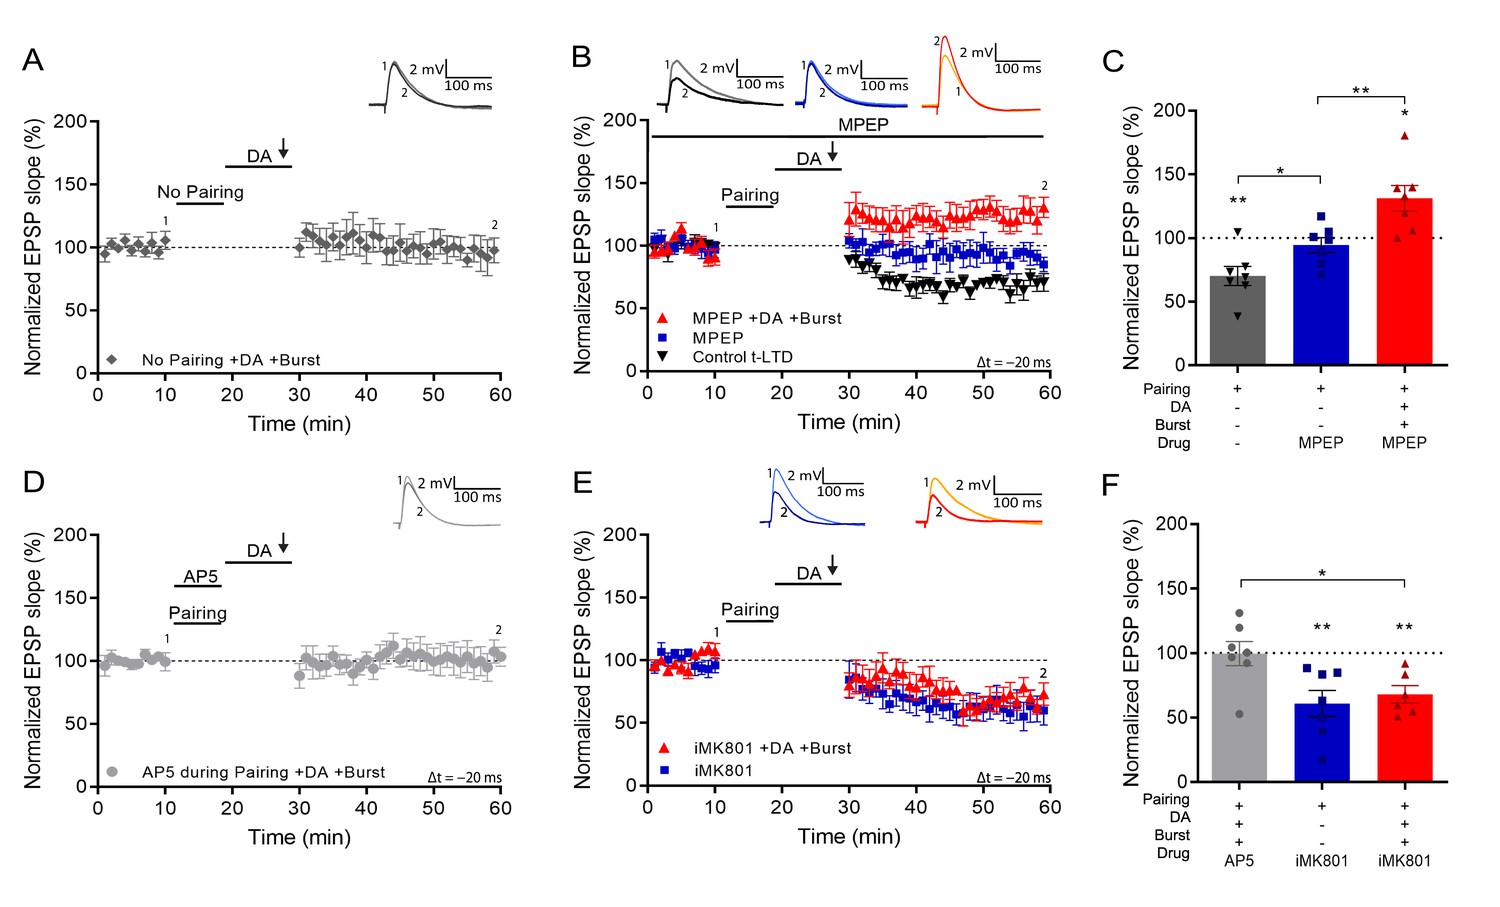
Setting of the eligibility trace is independent of LTD but requires postsynaptic NMDARs.
(A), Application of DA and burst stimulation, but without pairing protocol, does not induce potentiation. (B), Post-before-pre pairing protocol (Δt = –20 ms) leads to synaptic depression (t-LTD) (black trace), which is blocked by MPEP (blue trace). MPEP does not block DA- and burst-induced potentiation (red trace). (C), Summary of results. (D), Application of AP5 during pairing blocks DA- and burst-induced potentiation. (E), Postsynaptic intracellular MK801 (iMK801) does not block t-LTD (blue trace) but blocks DA- and burst-induced potentiation (red trace). (F), Summary of results. All traces show an EPSP before (1) and 40 min after pairing (2). Plots show averages of normalized EPSP slopes ± SEM.
-
Figure 2—source data 1
Normalized EPSP slopes of all recorded cells.
- https://cdn.elifesciences.org/articles/81071/elife-81071-fig2-data1-v2.xlsx
Figure 3
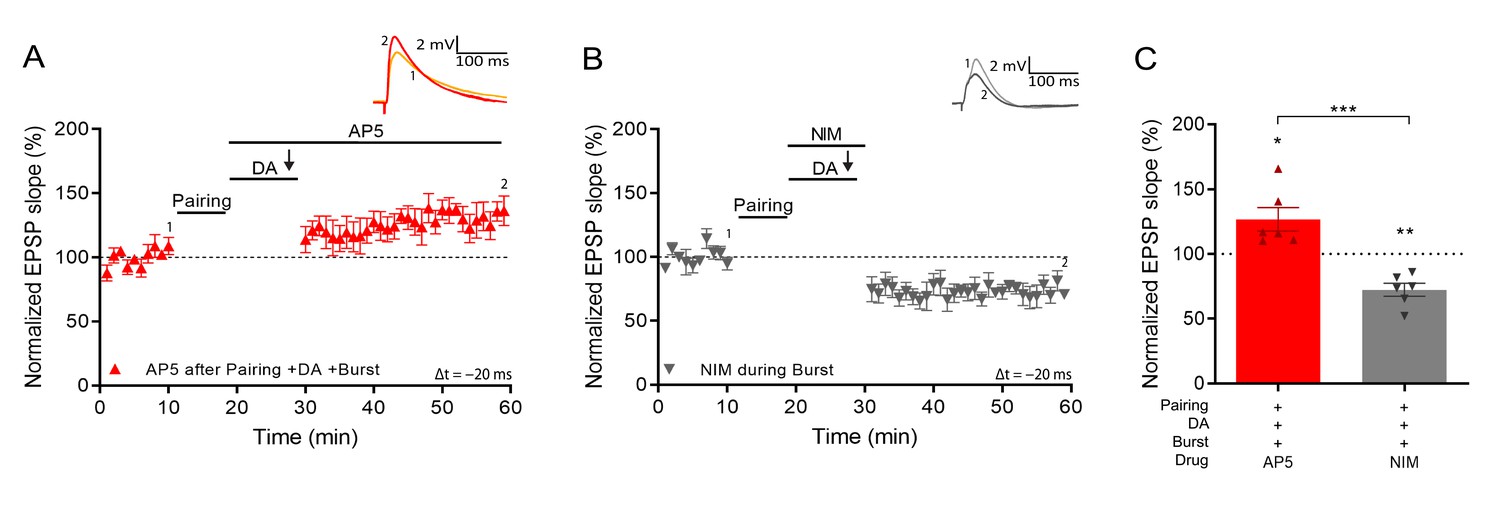
Voltage gated calcium channels mediate DA and reactivation-induced plasticity during burst stimulation.
Normalized EPSP slopes were averaged and plotted as a function of time. (A), Application of AP5 after pairing does not prevent DA- and burst-induced potentiation. (B), Application of nimodipine during the burst prevents DA- and burst-induced potentiation leaving synaptic depression. (C), Summary of results. All traces show an EPSP before (1) and 40 min after pairing (2). Plots show averages of normalized EPSP slopes ± SEM.
-
Figure 3—source data 1
Normalized EPSP slopes of all recorded cells.
- https://cdn.elifesciences.org/articles/81071/elife-81071-fig3-data1-v2.xlsx
Figure 4
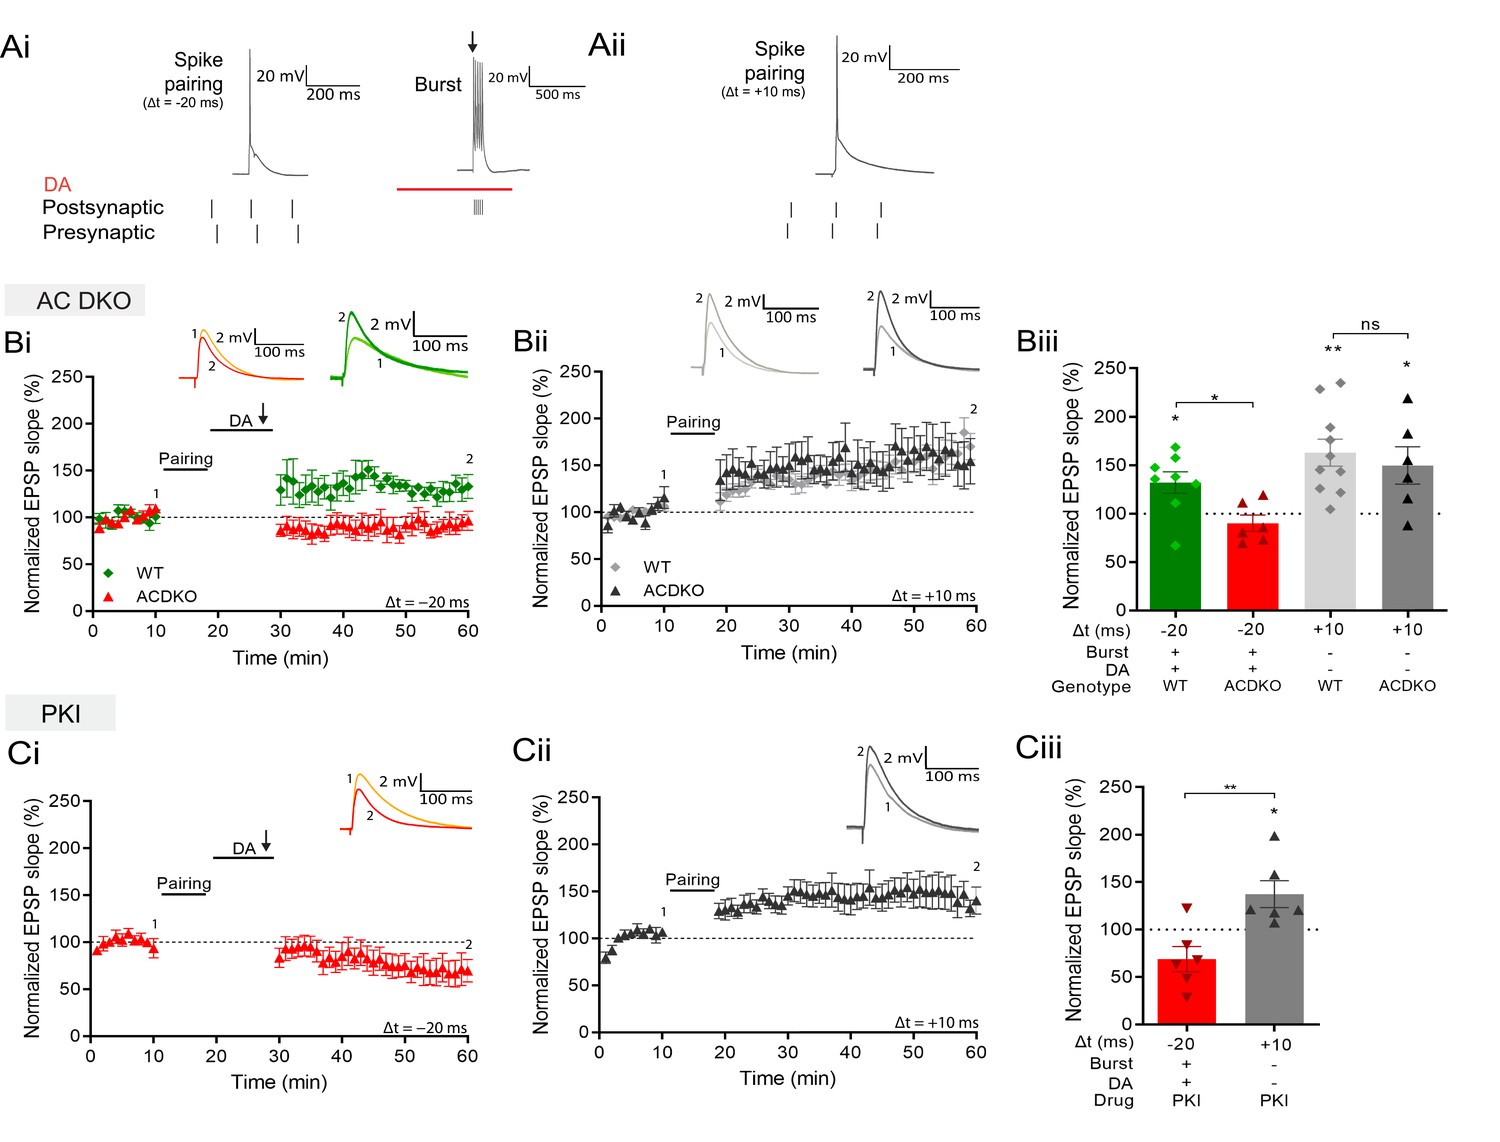
DA and reactivation-induced potentiation require AC1/AC8 and PKA.
Schematics show the difference between the three induction protocols. Normalized EPSP slopes were averaged and plotted as a function of time. (Ai), DA and burst stimulation after a post-before-pre pairing protocol (Δt = –20 ms) induces potentiation. (Aii), A pre-before-post pairing protocol induces t-LTP (Δt = +10 ms). (B), AC DKO mice do not show DA-dependent plasticity with postsynaptic bursts (Bi) but shows conventional t-LTP (Bii). Summary of results (Biii). (C), Postsynaptic application of protein kinase inhibitor-(6-22)-amide (PKI) prevents DA-dependent plasticity with postsynaptic bursts (Ci) but leaves conventional t-LTP intact (Cii). Summary of results (Ciii). All traces show an EPSP before (1) and 40 minutes after pairing (2). Plots show averages of normalized EPSP slopes ± SEM.
-
Figure 4—source data 1
Normalized EPSP slopes of all recorded cells.
- https://cdn.elifesciences.org/articles/81071/elife-81071-fig4-data1-v2.xlsx
Figure 5 with 1 supplement
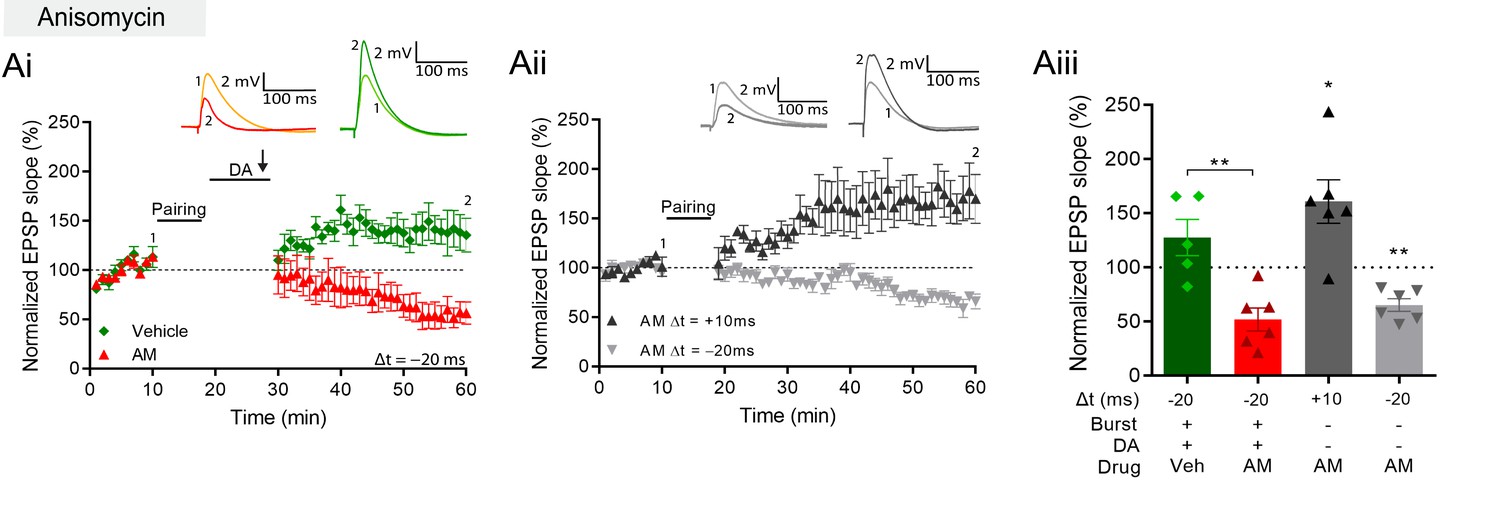
DA and reactivation-induced plasticity requires protein synthesis.
(A), Postsynaptic anisomycin prevents DA-dependent plasticity with postsynaptic burst stimulation (Ai), but leaves conventional t-LTD (Aii, gray trace) and t-LTP (black trace) intact. Summary of results (Aiii). All traces show an EPSP before (1) and 40 min after (2) pairing. Plots show averages of normalized EPSP slopes ± SEM.
-
Figure 5—source data 1
Normalized EPSP slopes, spike amplitudes and spike width of all recorded cells.
- https://cdn.elifesciences.org/articles/81071/elife-81071-fig5-data1-v2.xlsx
Figure 5—figure supplement 1
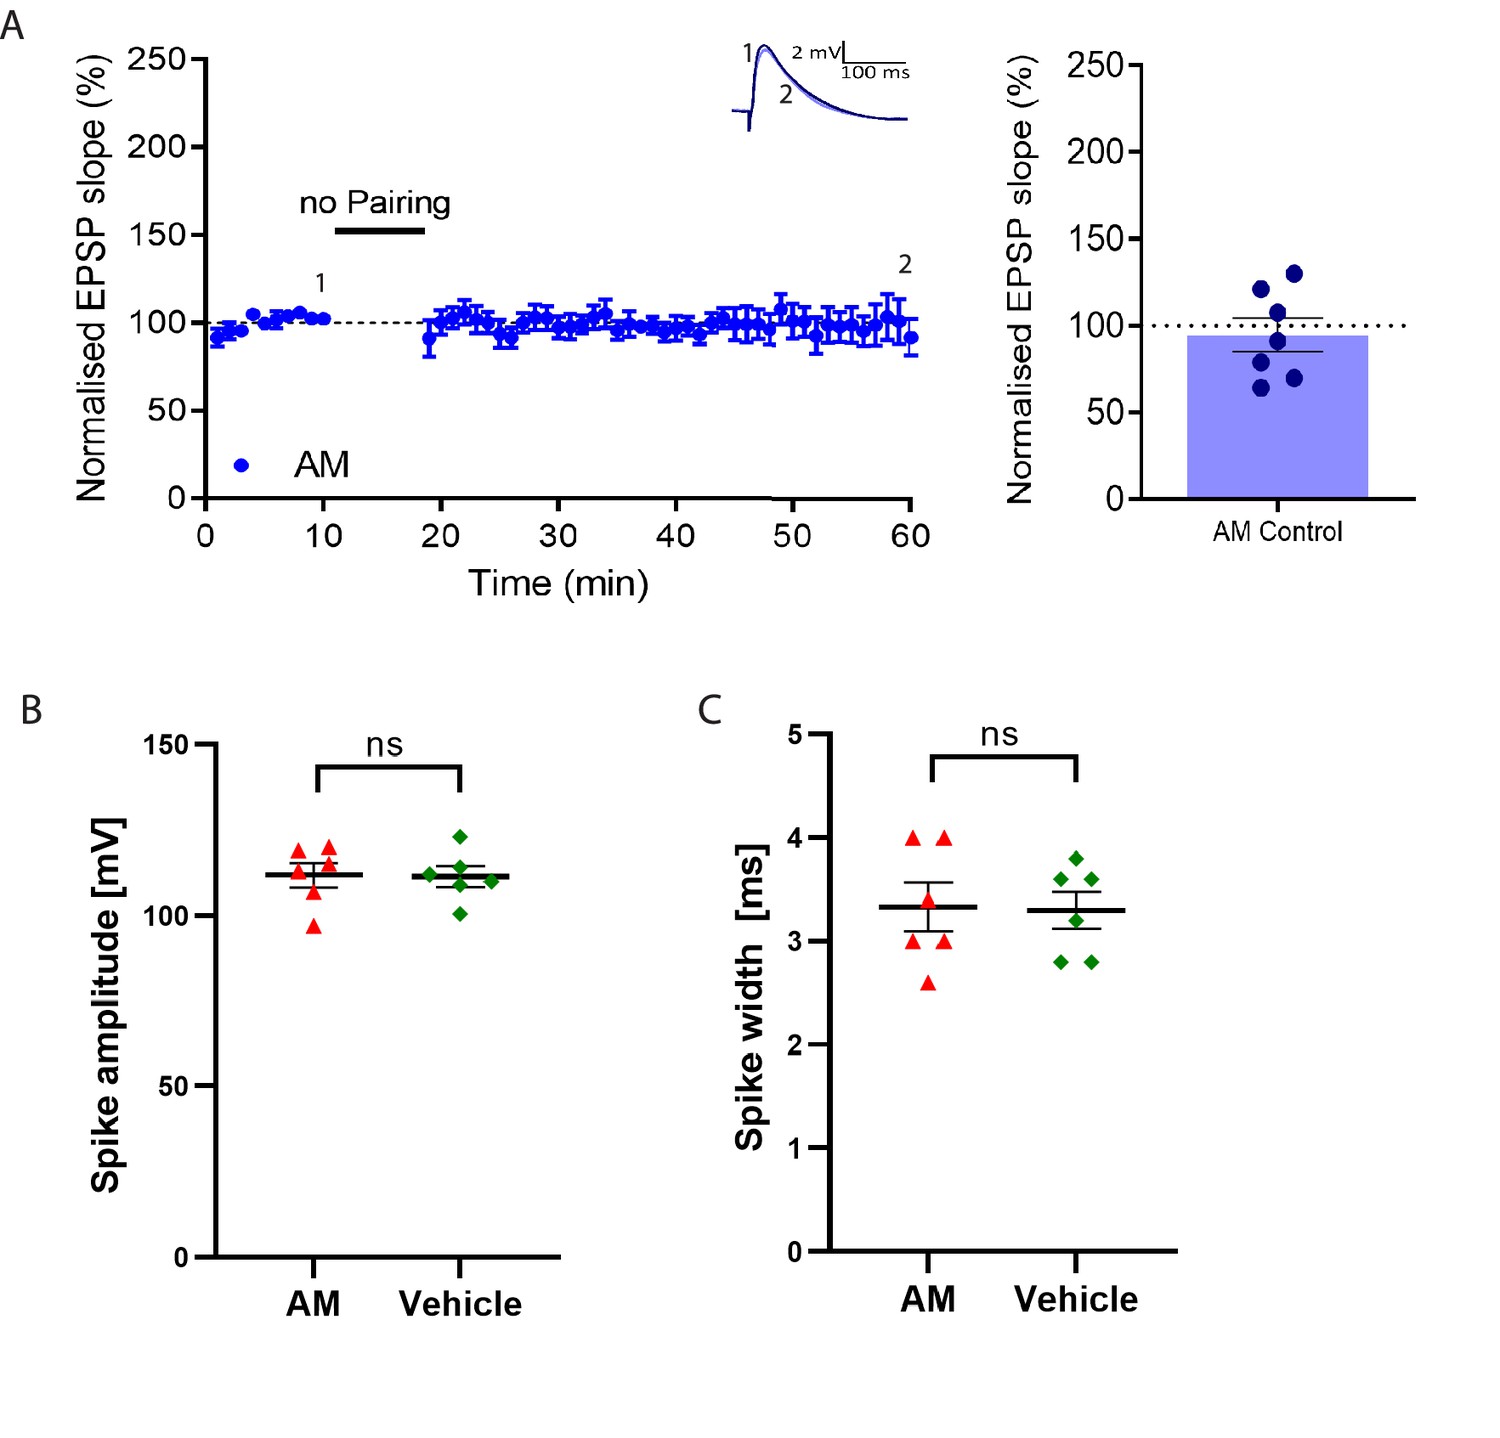
Postsynaptic anisomycin (AM) does not affect baseline synaptic responses and action potential properties.
(A), Stable baseline in presence of postsynaptic anisomycin and summary of result. Traces show an EPSP at the start of the recording (1) and 60 min later (2). Plot shows averages of normalized EPSP slopes ± SEM. (B), No significant change in spike amplitude with anisomycin compared to vehicle control. (C), No significant change in spike width with anisomycin compared to vehicle control.
Figure 6
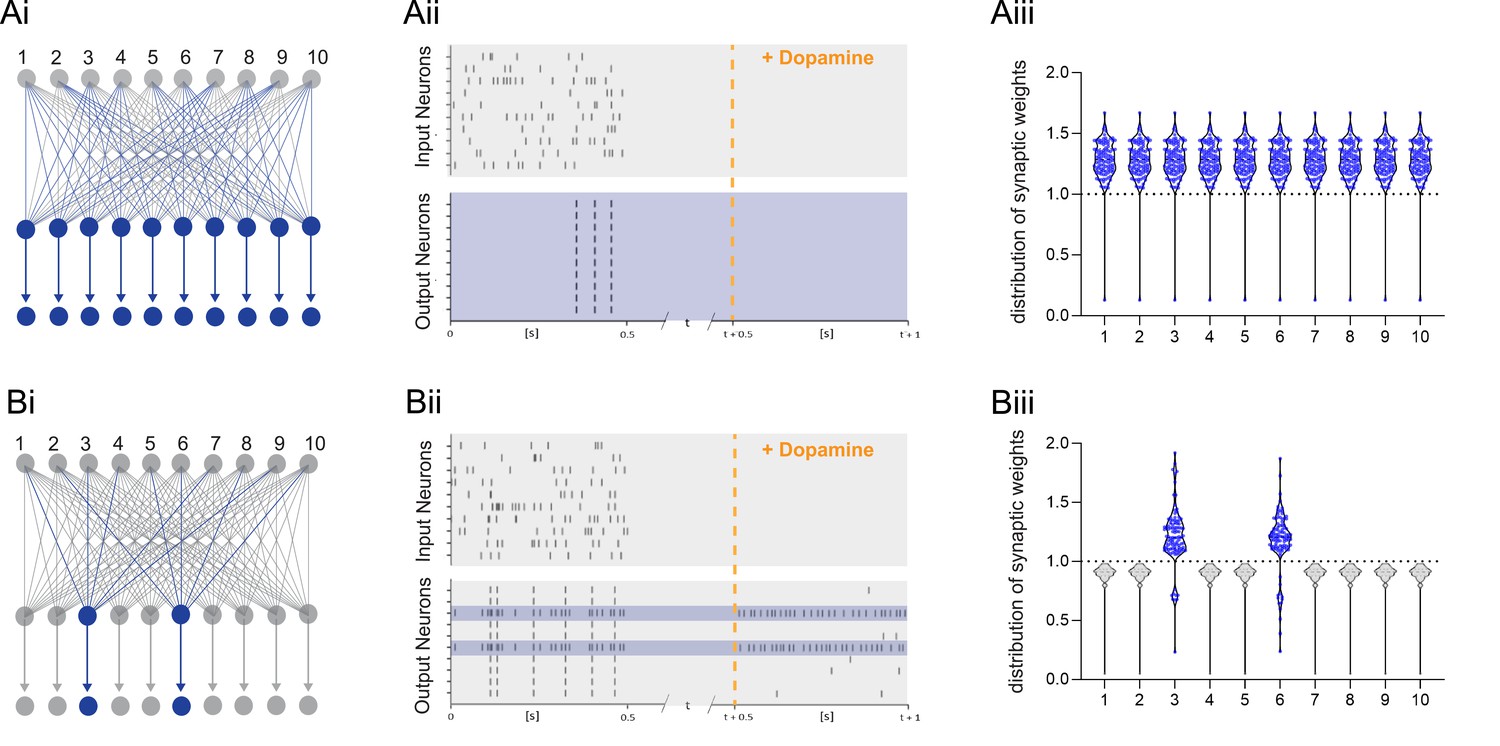
Dopamine-dependent burst-induced plasticity rule reduces the number of neurons in the network encoding a memory.
(Ai-iii), Standard reinforcement learning rule shows reward associating inputs 1–10 (blue) with potentiation of all synaptic weights (blue). (Bi-iii), Burst-dependent potentiation reduces the number of neurons encoding the memory, leading to potentiation of synapses exclusively onto the most excitable burst-firing neurons 3, 6 (blue).
-
Figure 6—source data 1
Raster plot data and synaptic weights.
- https://cdn.elifesciences.org/articles/81071/elife-81071-fig6-data1-v2.csv
Figure 7
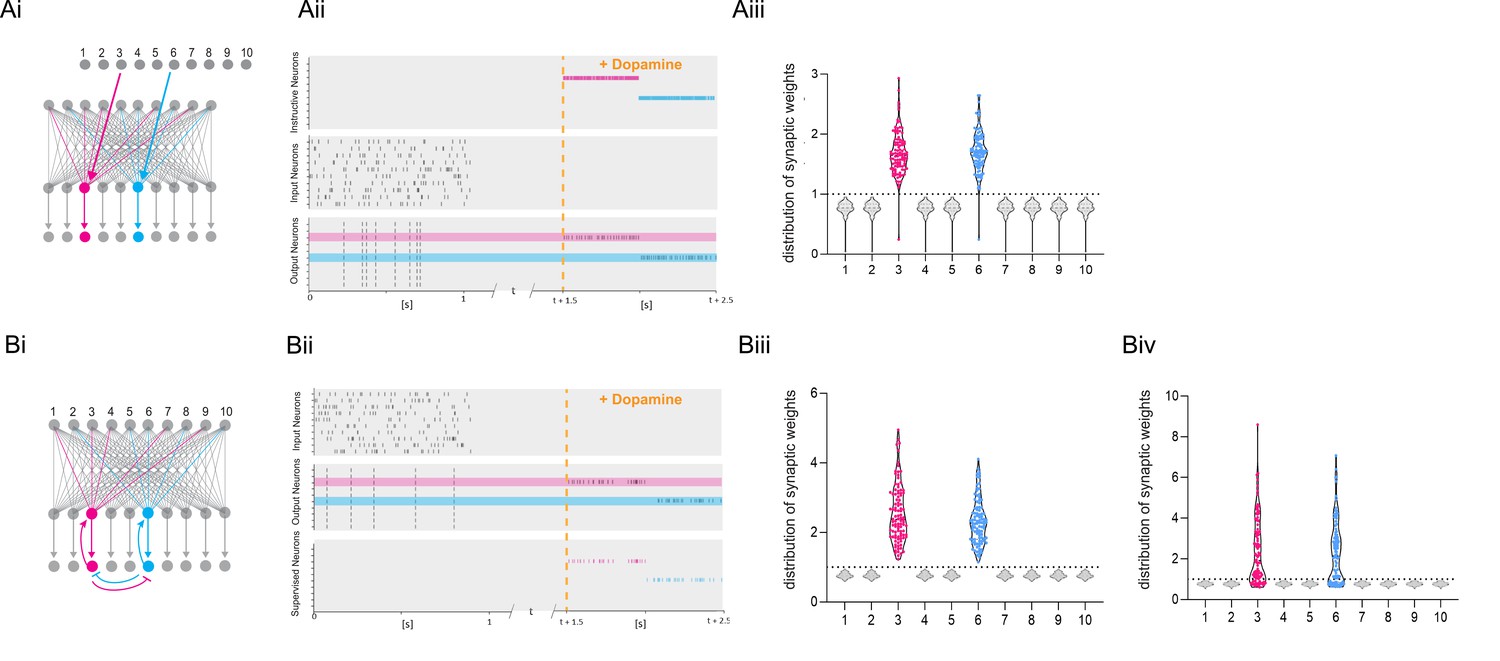
Dopamine-dependent burst-induced plasticity rule enables reinforcement learning (RL) models to encode a specific salient event.
(Ai-iii), Instructive RL rule allows two inputs that code for different information to store the memory in separate sets of neurons, thus encoding not only the reward, but also other reward-relevant features 3, 6 (magenta, cyan). (Bi-ii), A supervised network enables burst-eliciting feedback synaptic input to assign credit to select synapses in the network to encode a desired reward identity. (Biii) Time-dependent lateral inhibition at the output neurons suppress non-relevant information. When only one of the inputs is active, the animal can learn two different memories over time in neurons 3, 6 (magenta, cyan). (Biv) When both inputs are active at the same time they compete with each other, and synapses onto these neurons (magenta, cyan) are less potentiated.
-
Figure 7—source data 1
Raster plot data and synaptic weights.
- https://cdn.elifesciences.org/articles/81071/elife-81071-fig7-data1-v2.csv
Figure 8 with 2 supplements
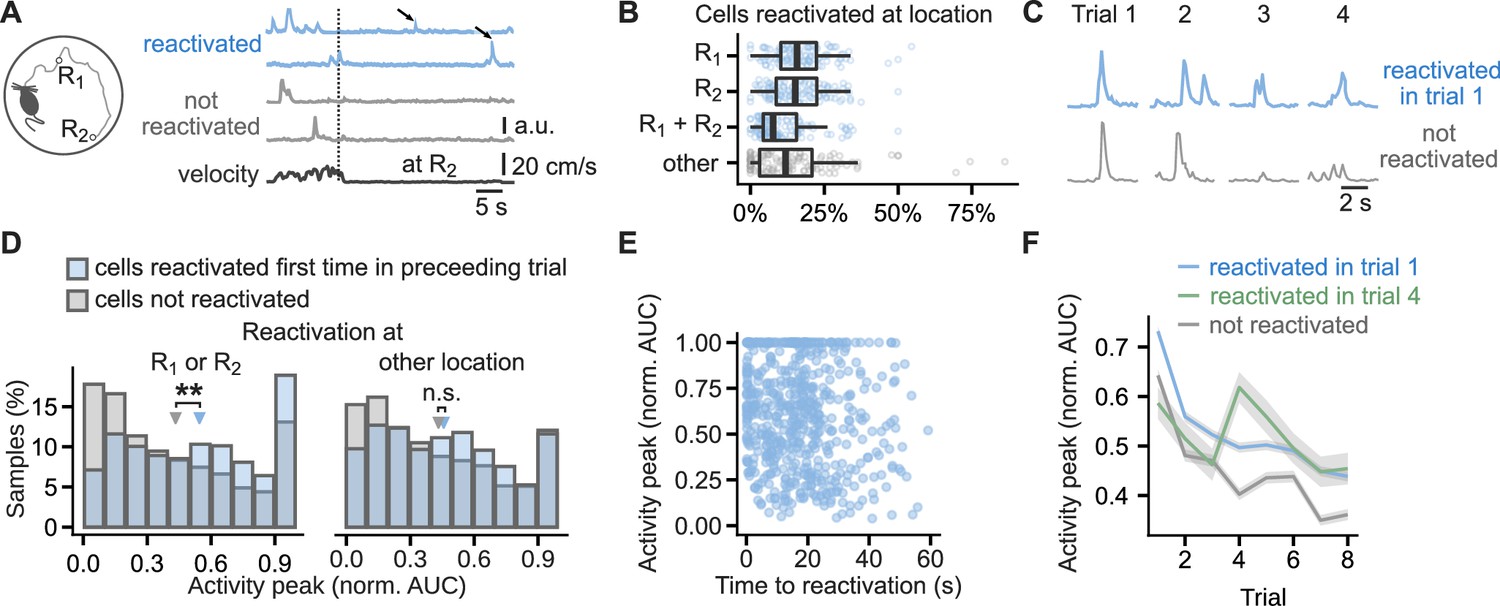
Cells that reactivated at reward location have higher activity peaks than non-reactivated cells.
(A), Running path of a mouse (left) and calcium traces of example cells (right) in a representative single trial. Mice ran toward two reward locations: one previously learned (R1) and one new (R2). Calcium traces for two cells that reactivated at the reward location and two that did not. Arrows mark reactivations. Vertical line marks time of arrival at R2. (B), Percentage of cells that reactivated at one or both of the reward locations or other locations. Points mark percentage in single trials. Box-and-whisker plots: median, 25 and 75th percentile, and extreme values. n=444 trials. (C), Traces centered on activity peaks for two example cells: one that reactivated at the new reward location in trial 1 (top) and one that did not reactivate in any of the trials (bottom). (D), Histogram of activity peaks normalized to maximum AUC value compared between cells that reactivated for the first time in the preceding trial and cells that did not reactivate in any of the trials. Triangles mark mean values. Permutation tests for repeated measures ANOVA, model for reactivations at the reward locations: significant effect of trial (F(6, 96)=4.51, p<0.001) and reactivation (F(1,16) = 10.15, p=0.006), model for reactivations at non-rewarded locations: significant effect of trial (F(6, 96)=7.85, p=0.001) and non-significant of reactivation (F(1, 16)=0.56, p=0.47). n=6785 cell trials from 1405 cells. (E), The duration from activity during locomotion to the time of first reactivation did not correlate with activity peaks in the following trial, suggesting a long-lasting eligibility trace.(F), Mean calcium peak in each trial for cells that reactivated in trial 1 or trial 4 compared to cells that did not reactivate in any trial. Ribbons extend +/- 1 SEM. Cells that reactivated in trial 1 had significantly higher normalized calcium peaks in all trials. Cells that reactivated for the first time in trial 4 had significantly higher normalized calcium peaks in trials 4, 5, 7 and 8 but not in trial 6 and trials before the reactivation. Permutation t-tests with Benjamini-Hochberg correction for multiple comparisons and between-animal random effects. n=6721 cell trials from 681 reactivated in trial 1 cells, n=769 from 96 reactivated in trial 4 cells, and n=5980 from non-reactivated 607 cells. **p<0.01.
Figure 8—figure supplement 1
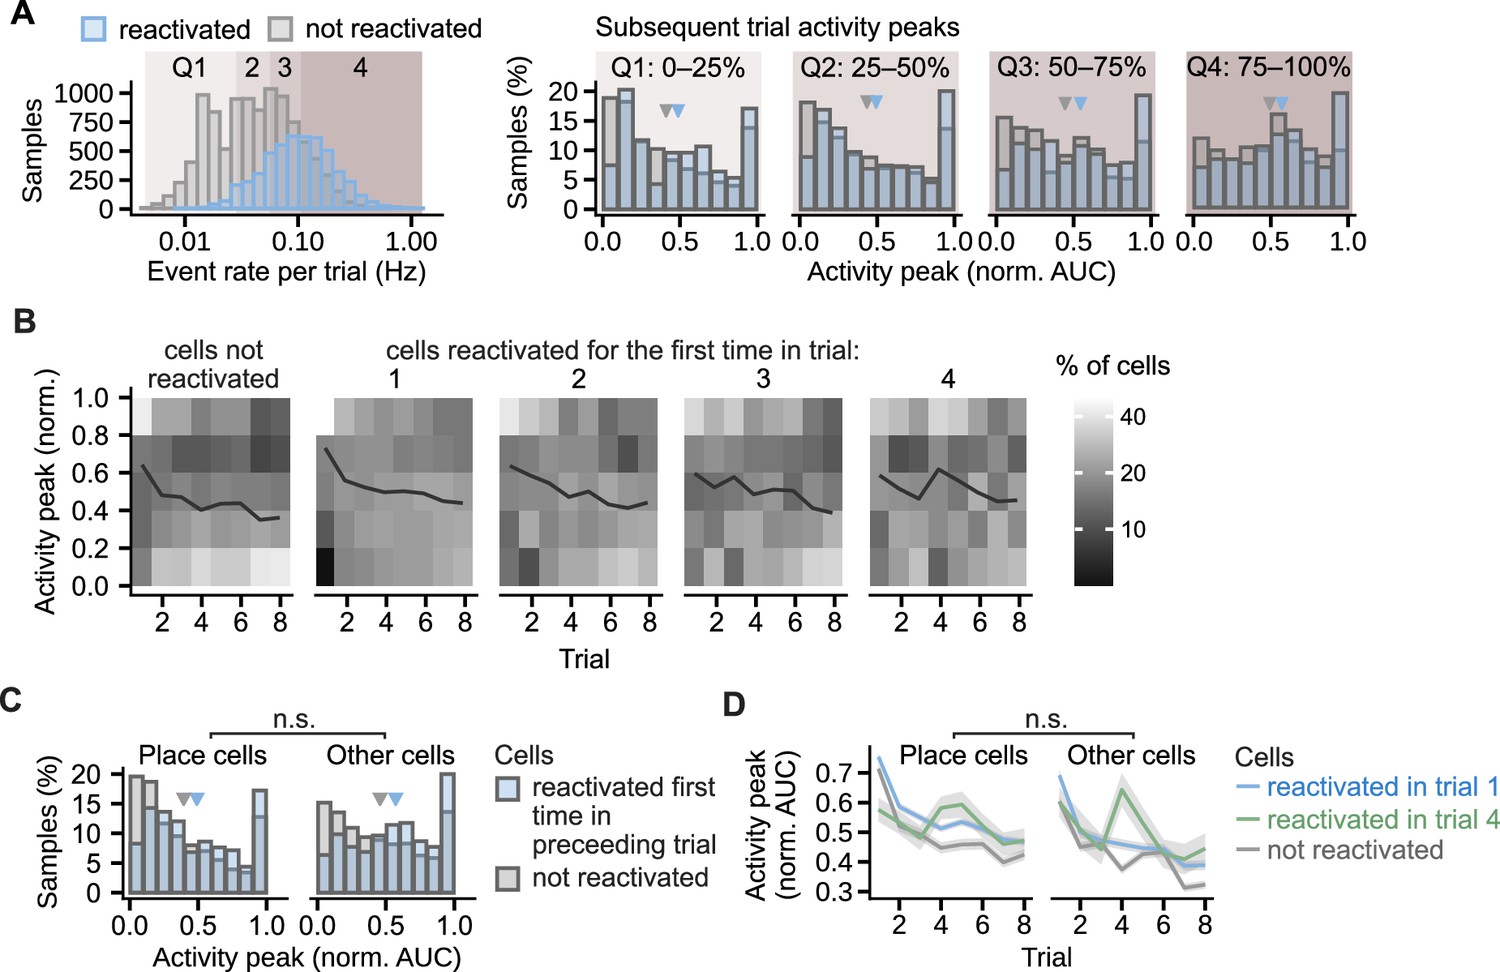
Similar effect of the reactivation on the activity peaks in different cell groups.
(A), Regardless of the cell event rates, the activity peaks were larger in the reactivated cells than in cells that did not reactivate that day. The comparison was performed on four cell groups defined by the quartile ranges (Q1–4) in the event rate distribution shown in the leftmost histogram. The histogram counts the trial event rates per cell. The four histograms to the right compare activity peaks within each quartile range. Calcium peaks in the cells reactivated for the first time in the previous trial are compared with the calcium peaks of non-reactivated cells, the quartiles are assigned based on the event rate in the trial prior. Triangles mark mean values. Permutation test for repeated measures ANOVA: effect of reactivation: F(1, 16)=7.54, p=0.02; effect of quartile: F(3, 48)=6.48, p=0.002. n=6785 cell trials from 1405 cells. (B) Percentage of cells that had a given calcium peak shown per trial. Cells are grouped by the trial of their first reactivation. In all cell groups, a large percentage of cells decreased calcium peaks in late trials. A larger percentage of the reactivated than non-reactivated cells maintained high peak values. (C), Histogram of normalized activity peaks in place cells and other cells compared between the cells reactivated for the first time in the preceding trial and the cells not reactivated in any of the trials. Triangles mark mean values. Permutation test for repeated measures ANOVA: non-significant interaction between cell type (place cell vs other cell) and reactivation (F(1,16) = 0.11, p=0.75, n=6785 cell trials from 1405 cells). (D), Activity peaks as a function of trial compared between place cells and other cells. Cells whose first reactivation happened in the same trial are grouped together. Ribbons extend +– 1 SEM. The effect of reactivation in trial 1 or in trial 4 was not significantly different for place cells and other cells in any of the trials after the reactivation (non-significant interaction between the cell type and reactivation). Permutation t-tests with Benjamini-Hochberg correction for multiple comparisons and between-animal random effects. n=4261 cell trials from place cells reactivated in trial 1 and n=2460 from other cells, n=507 from place cells reactivated in trial 4 and n=262 from other cells, n=2,409 for non-reactivated place cells and n=3571 from other cells.
Figure 8—figure supplement 2
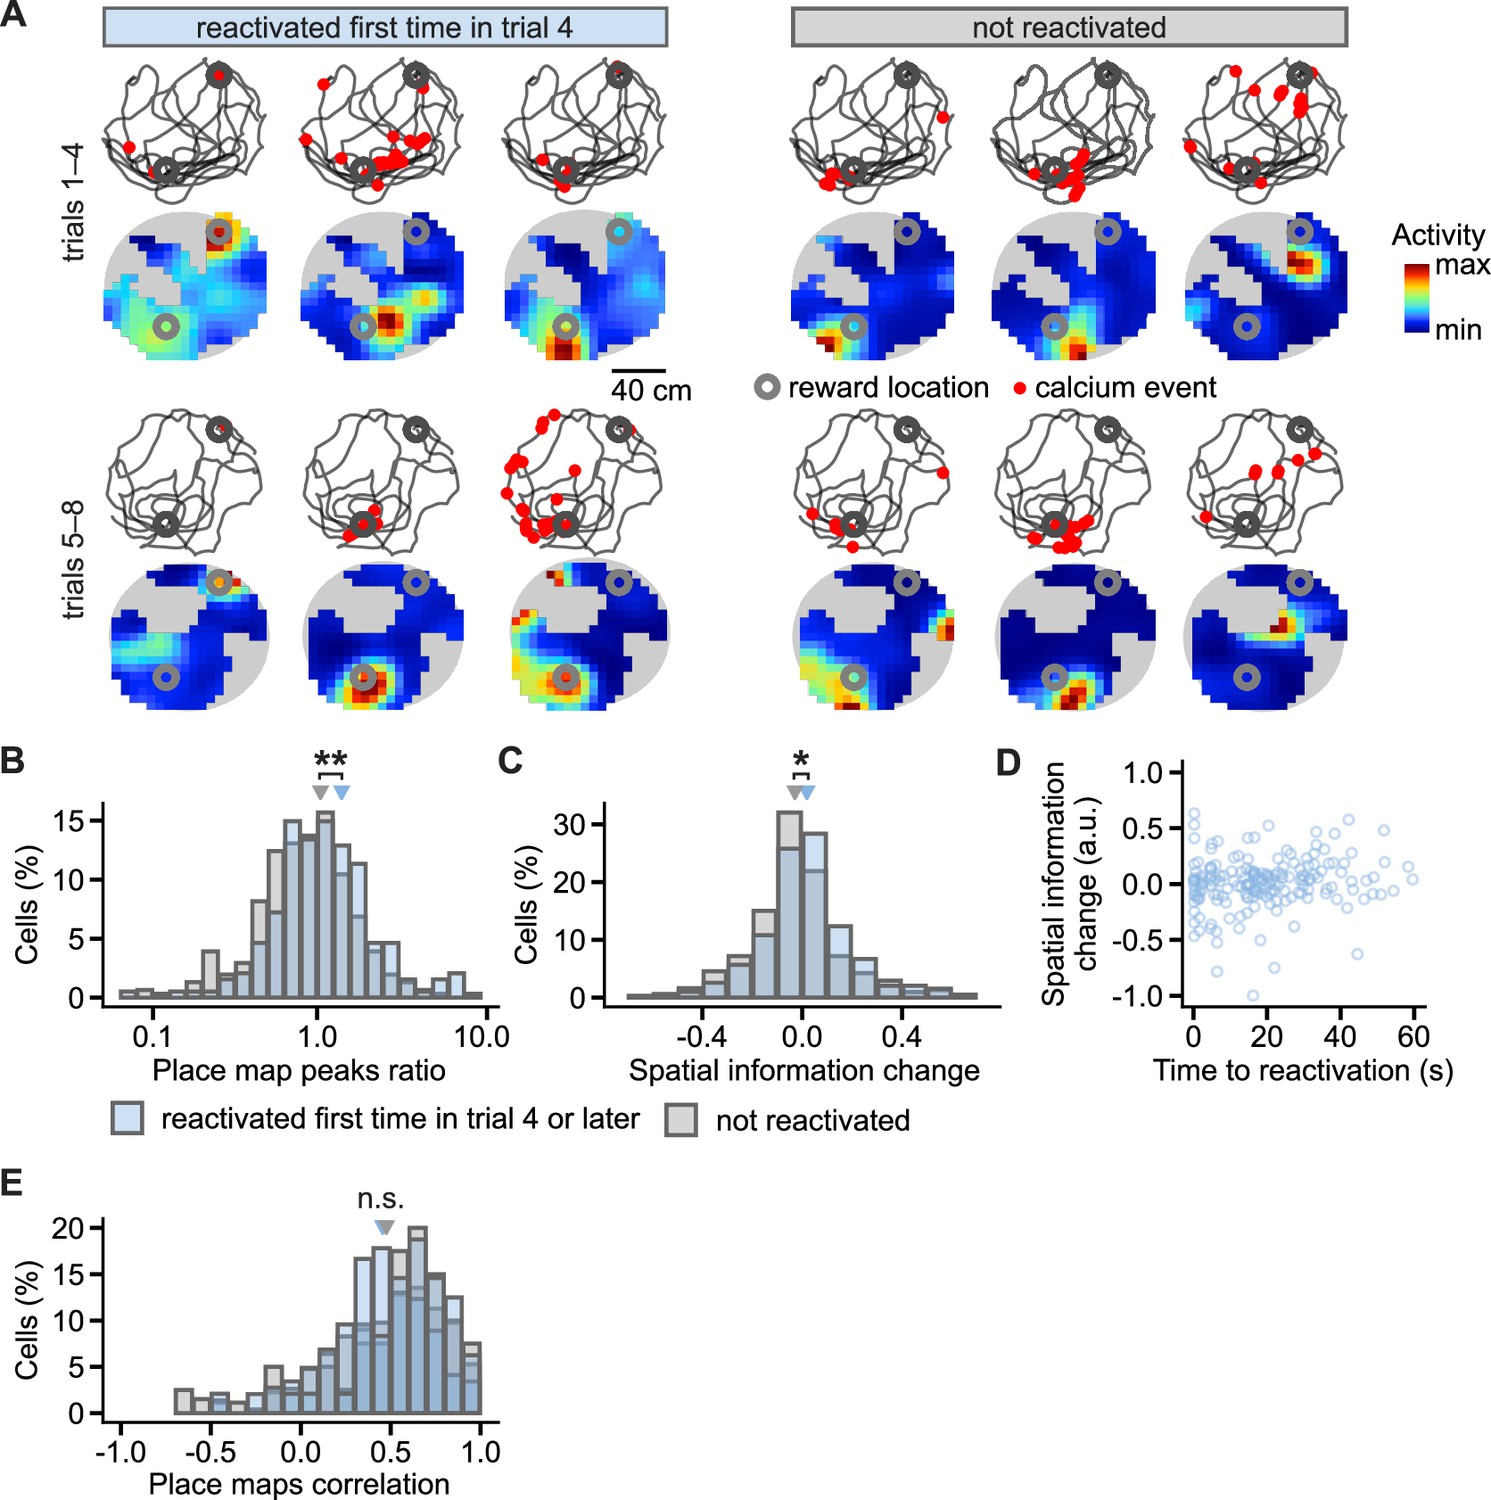
Place cells during learning in reactivated and non-reactivated neurons.
(A), Examples of CA1 place cells and changes in their activity from early (trials 1–4) to late learning trials (trials 5–8) after the cells were reactivated at the reward location in trial 4. Locations of calcium events marked with a red dot are overlaid over mouse movement paths; place maps are shown below. Reward locations are marked with grey circles. Gray background represents locations unsampled by the mouse. (B), Histogram of the ratios between place map peaks in the late over early learning trials. The ratios are compared between the cells reactivated for the first time in the trial 4 or later and the cells not reactivated at any of the trials. Triangles mark mean values. Effect of reactivation: F(1, 16)=11.3, p=0.008. (C), As in (B) but for change in spatial information of place cells from early to late trials. Effect of reactivation: F(1, 16)=4.4, p=0.048. (D), The duration from activity during locomotion to the time of first reactivation did not correlate with the later change in spatial information. (E), As in (B) but for correlation between place maps for early and late trials. Effect of reactivation: F(1, 16)=0.29, p=0.59. Permutation tests for repeated measures ANOVA. n=194 reactivated and n=306 non-reactivated place cells. **p<0.01, *p<0.05.
Tables
Key resources table
| Reagent type (species) or resource | Designation | Source or reference | Identifiers | Additional information |
|---|---|---|---|---|
| Strain, strain background (Mus musculus) | Wild-type C57BL/6 J, Mus musculus | Harlan, Bicester, UK or Central Animal Facility, Physiological Laboratory, Cambridge University | Age range used for slice preparation: 12–19 days. Females and males were used. | |
| Strain, strain background (Mus musculus) | Adenylate cyclase double knock-out (AC DKO), C57BL/6 J, Mus musculus | Mouse line generated by Hongbing Wang and imported from Michigan State University, MI, US | Age range used for slice preparation: 12–19 days. Females and males were used. | |
| Strain, strain background (Mus musculus) | Thy1 – GCaMP6f, C57BL/6 J, Mus musculus | Jax Ref: Dana et al., 2014 | 024276 | Only males were used. |
| Chemical compound, drug | Dopamine hydrochloride | Sigma–Aldrich | H8502 | 100 μM |
| Chemical compound, drug | D-AP5 | Tocris Bioscience | 0106 | 100 µM |
| Chemical compound, drug | Nimodipine | Tocris Bioscience | 0600/100 | 10 µM |
| Chemical compound, drug | PKA inhibitor fragment (6-22) amide | Tocris Bioscience | 1904/1 | 1 µM |
| Chemical compound, drug | Anisomycin | Tocris Bioscience | 1290/10 | 0.5 mM |
| Chemical compound, drug | MK801 | Tocris Bioscience | 0924 | 1 mM |
| Software, algorithm | Igor Pro 6.37 | WaveMetrics | ||
| Software, algorithm | Prism 8.2.0 (435) | Graphpad | ||
| Software, algorithm | Matlab R2021a | MathWorks | ||
| Software, algorithm | CaImAn software (version 1.8.5, Python) | Giovannucci et al., 2019 |
Additional files
-
MDAR checklist
- https://cdn.elifesciences.org/articles/81071/elife-81071-mdarchecklist1-v2.docx
-
Source code 1
Code for computational model.
- https://cdn.elifesciences.org/articles/81071/elife-81071-code1-v2.zip
Download links
A two-part list of links to download the article, or parts of the article, in various formats.
Downloads (link to download the article as PDF)
Open citations (links to open the citations from this article in various online reference manager services)
Cite this article (links to download the citations from this article in formats compatible with various reference manager tools)
Postsynaptic burst reactivation of hippocampal neurons enables associative plasticity of temporally discontiguous inputs
eLife 11:e81071.
https://doi.org/10.7554/eLife.81071


