Single-nuclei characterization of pervasive transcriptional signatures across organs in response to COVID-19
- Chan-Zuckerberg Biohub, United States
- Division of Gastroenterology, Department of Medicine, University of California, San Francisco, United States
- Department of Medicine, San Francisco Veterans Affairs Medical Center, University of California San Francisco, United States
- Yale University, United States
Figures
Figure 1 with 4 supplements
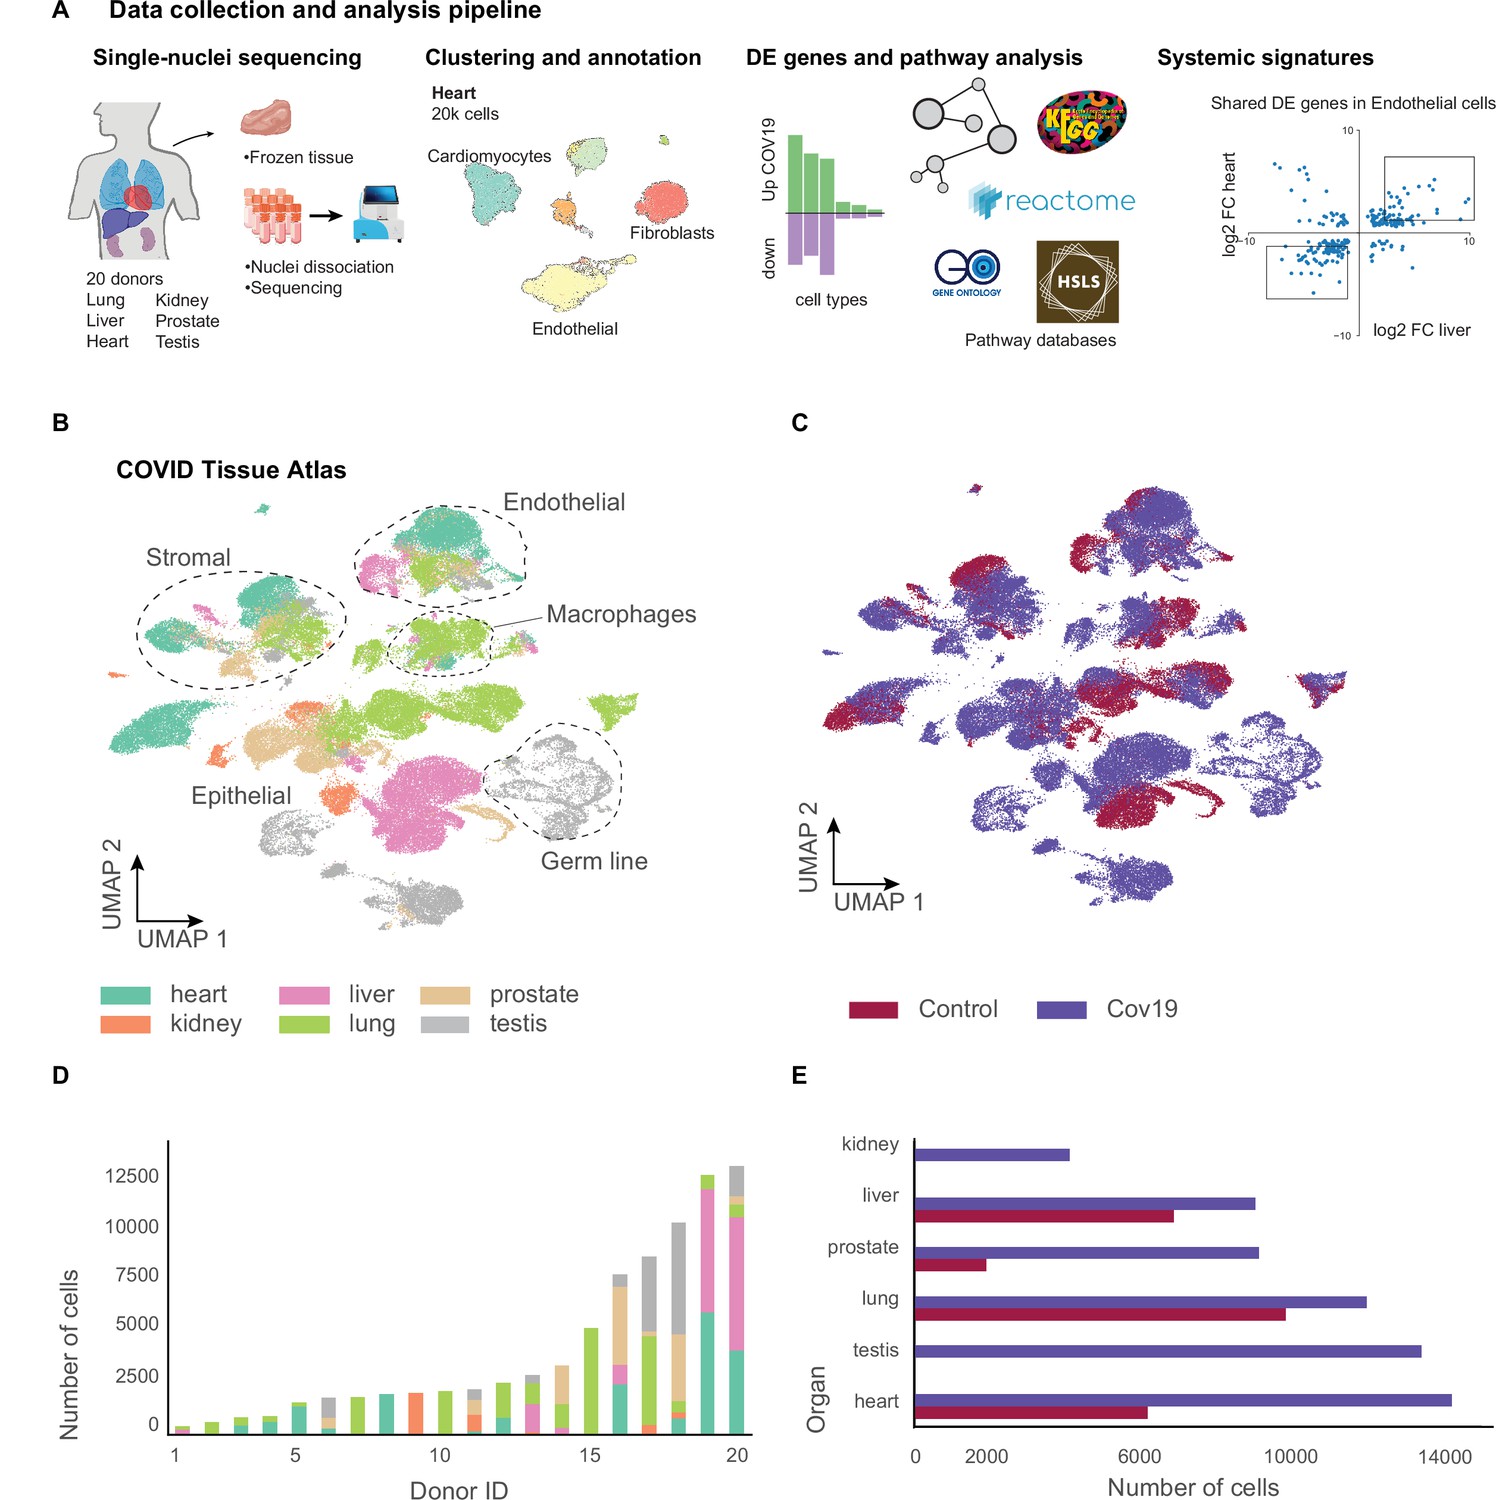
A human single-cell atlas enables the identification of systemic responses to COVID-19.
(A) Tissue samples were collected from different organs and frozen, then dissociated into single nuclei. Libraries for single-nuclei RNA-sequencing (snRNA-seq) were prepared using 10x Genomics Chromium Next GEM Single Cell 3ʹ v.3.1kit, followed by sequencing on various Illumina platforms. After quality control and clustering, cell types for each organ were annotated by experts using literature gene markers. Differential gene expression and pathway enrichment analysis were performed between COVID-19 and healthy samples for all cell types. Finally, global transcriptional signatures were identified via a cross-organ analysis of differential expression. (B) The COVID tissue atlas comprises approximately 85,000 cells from six different organs. (C) Cells in the COVID tissue atlas cluster by cell identity rather than disease status. (D) Number of cells per donor grouped by the organ of origin. (E) Number of cells per organ grouped by COVID-19 status.
Figure 1—figure supplement 1
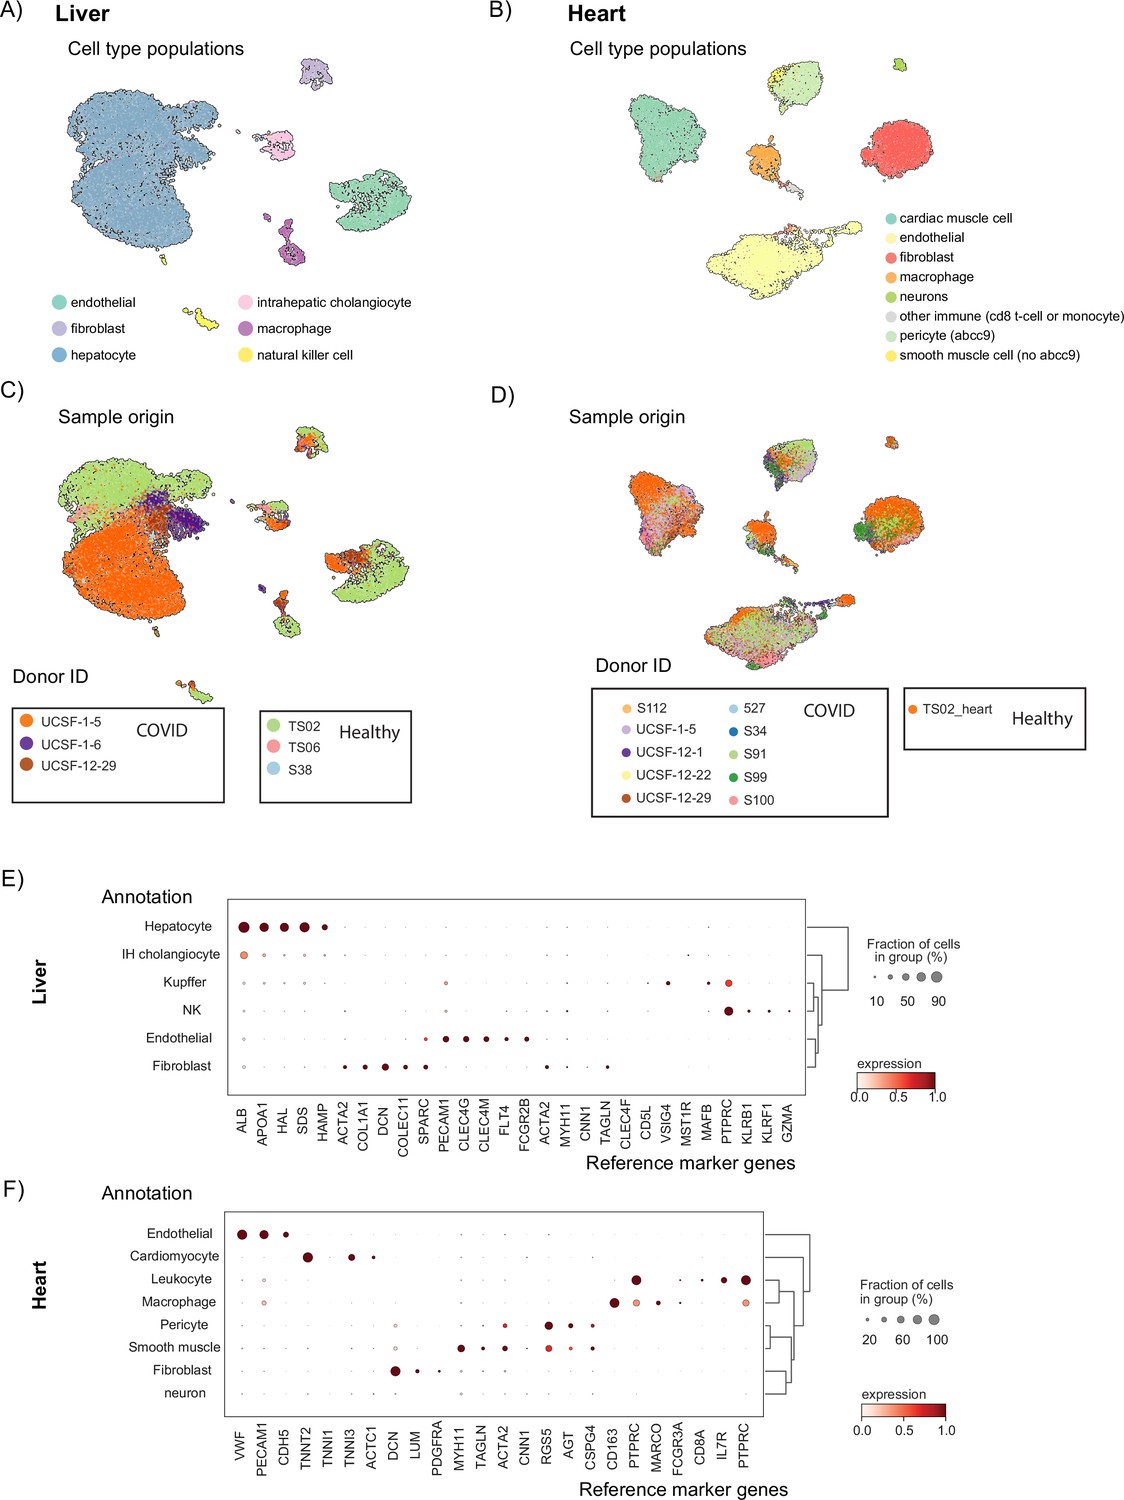
Clustering, batch correction, and annotation of single-nuclei samples.
(A) UMAP visualization of the liver data. Single cells are colored by their cell-type annotation (B) UMAP visualization of the heart data. Single cells are colored by their cell-type annotation. (C, D) UMAP visualizations of the liver (C) and heart (D) datasets. Single cells are colored by their corresponding donor (donorID shows the healthy and COVID-19 status of each donor). (E, F) Average gene expression of known cell-type markers for different cell types in the liver (E) and heart (F). The fraction of cells expressing the gene is represented by the size of the circles.
Figure 1—figure supplement 2

Clustering and annotation of additional organs.
(A) Relative sizes of the different cell populations identified in the prostate. The numbers of cells are normalized to add up to 100% for COVID-19 and healthy cells independently. (B) UMAP visualization of the prostate data. Single cells are colored by their cell-type annotation. (C) UMAP visualization of the kidney COVID Tissue Atlas (CTA) data after integration with a kidney single-nuclei atlas from healthy donors (Muto et al., 2021). Cells from CTA samples were annotated by transferring labels from Muto et al., 2021, using scanVI (Xu et al., 2021). (D) UMAP of the integrated kidney dataset shown in (C), colored by dataset source (CTA kidney samples only contained cells from COVID-19-positive donors).
Figure 1—figure supplement 3

Comparison between whole-cell and single-nuclei RNA-seq.
(A) Distribution of total RNA counts per cell from whole-cell sequencing of two different liver samples (Tabula Sapiens Consortium* et al. 2022). (B) Distribution of the total number of detected genes per cell from whole-cell sequencing of two different liver samples (Tabula Sapiens Consortium* et al. 2022) (C) Number of total RNA counts for the same two liver samples sequenced from single nuclei instead of whole cell. (D) Same as (B) for the single-nuclei samples.
Figure 1—figure supplement 4
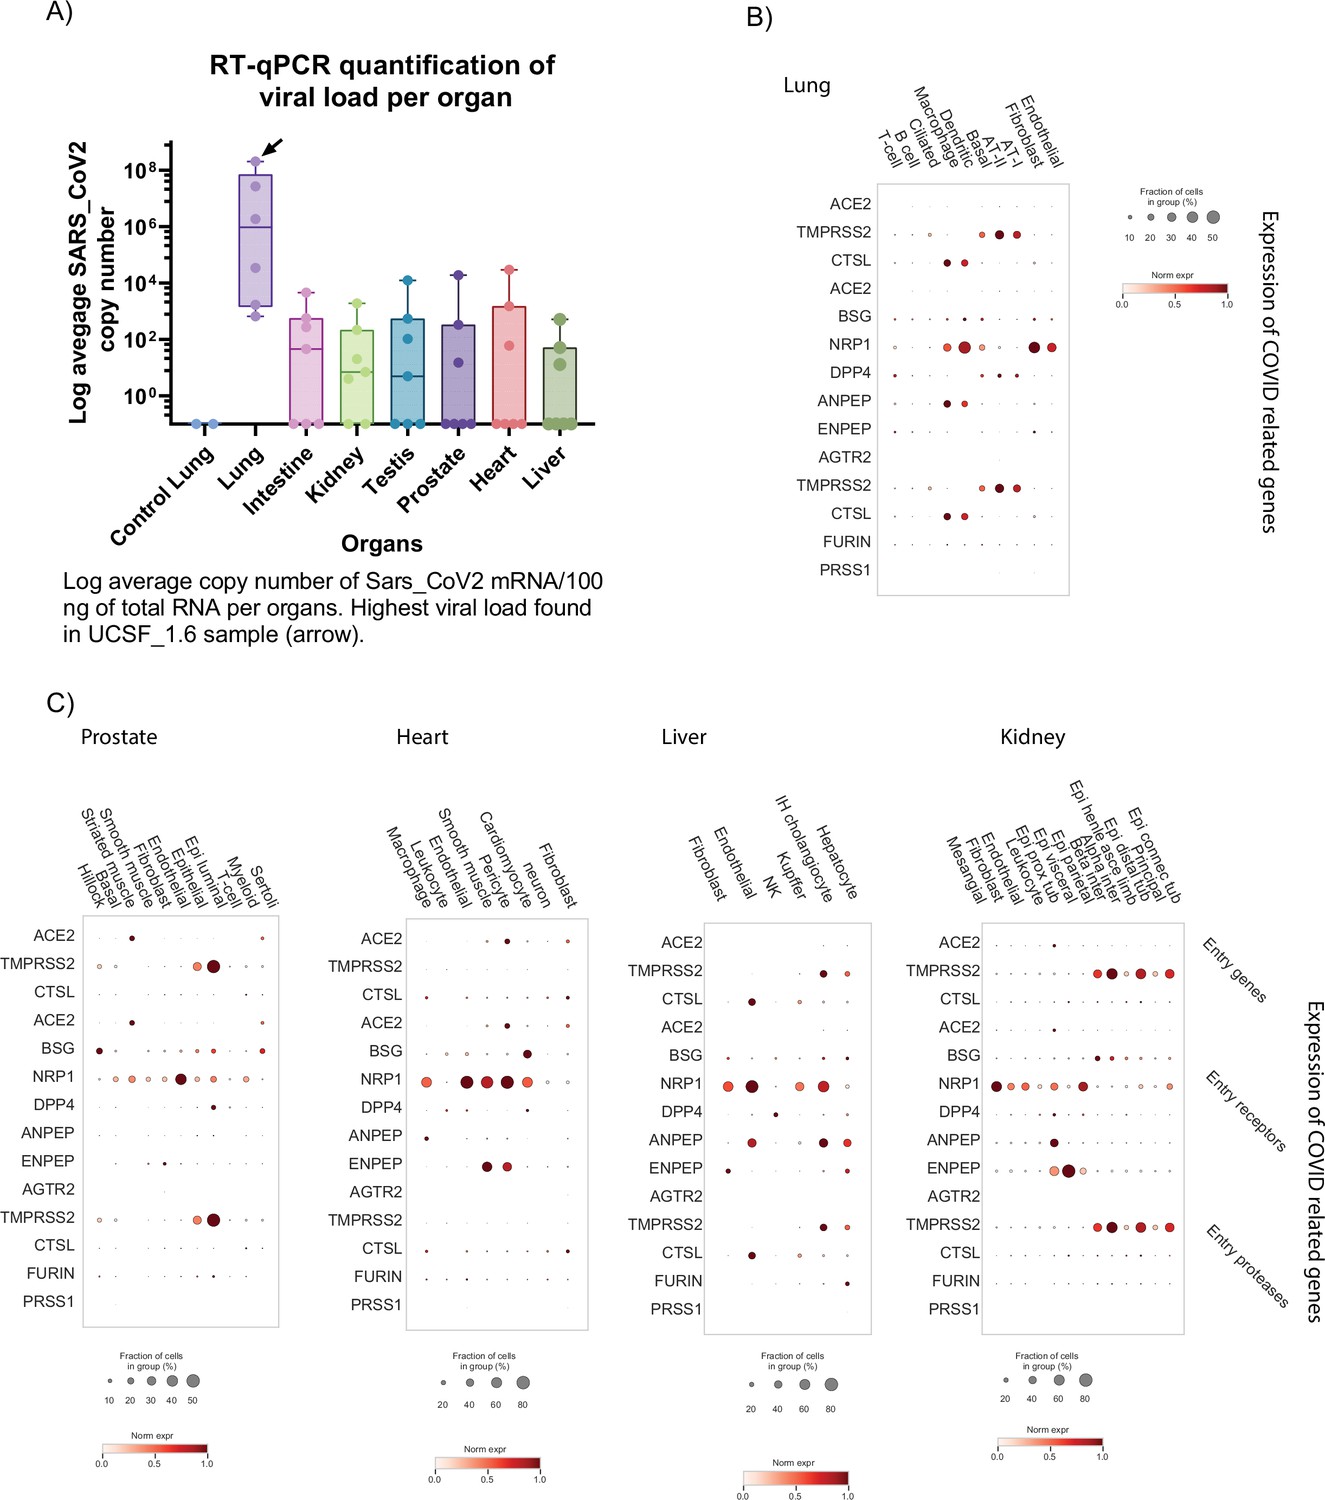
Detection of viral mRNA and expression of COVID-19 associated genes.
(A) Average copy number of SARS-CoV2 mRNA (log) measured by RT-qPCR for all samples. (B) Average gene expression of known COVID-19 associated genes in the lung. The fraction of cells expressing the gene is represented by the size of the circles. (C) Average gene expression of known COVID-19 associated genes in the other organs. The fraction of cells expressing the gene is represented by the size of the circles.
Figure 2 with 1 supplement
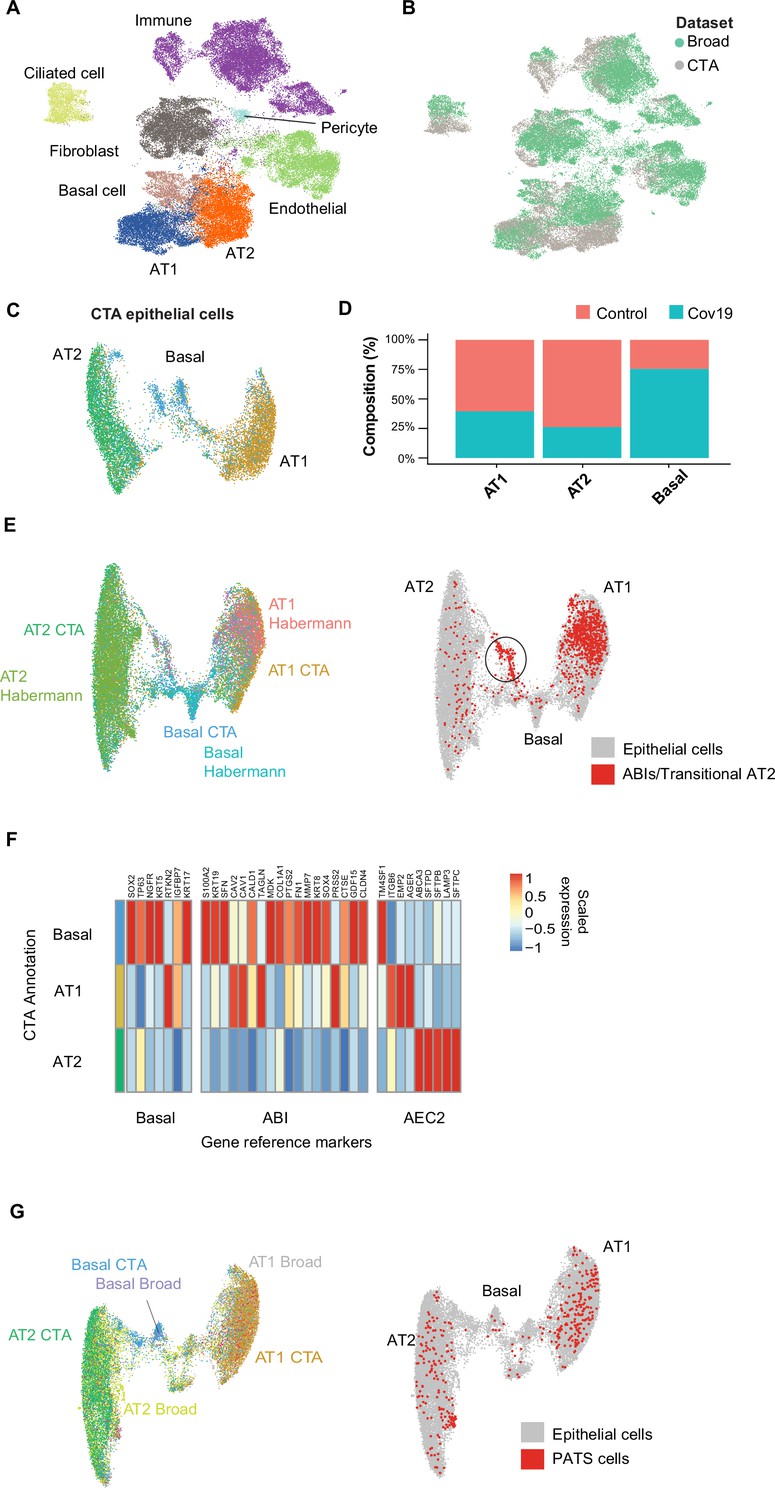
Cell type composition changes in the COVID-19 lung.
(A) Integration of the COVID Tissue Atlas (CTA) lung with the lung COVID atlas by the Broad Institute. A harmonized UMAP shows that cells from both datasets integrate by their corresponding cell-type annotation. (B) Integration of two lung COVID atlas colored by the dataset of origin. (C) Sub-clustering and UMAP projection of the CTA lung epithelial cells (AT1, AT2, and basal cells). (D) Relative cell composition in epithelial lung tissue from control and COVID-19 autopsies (CTA data only). (E) Integration of CTA epithelial cells and epithelial cells from Habermann et al., 2020 (AT1, AT2, basal cells, and transitional ABIs/AT2 populations). ABIs/transitional AT2 from Habermann et al., 2020, are shown in red (right). (F) Heatmap of scaled gene expression of marker genes for three different reference cell populations (x-axis) compared to the CTA lung cell types (y-axis). (G) Joint embedding of CTA and Delorey et al., 2021 (AT1, AT2, basal, and pre-transitional cell state [PATS] cells). The PATS cells identified by Delorey et al., 2021, are shown in red in the joint UMAP (right).
Figure 2—figure supplement 1
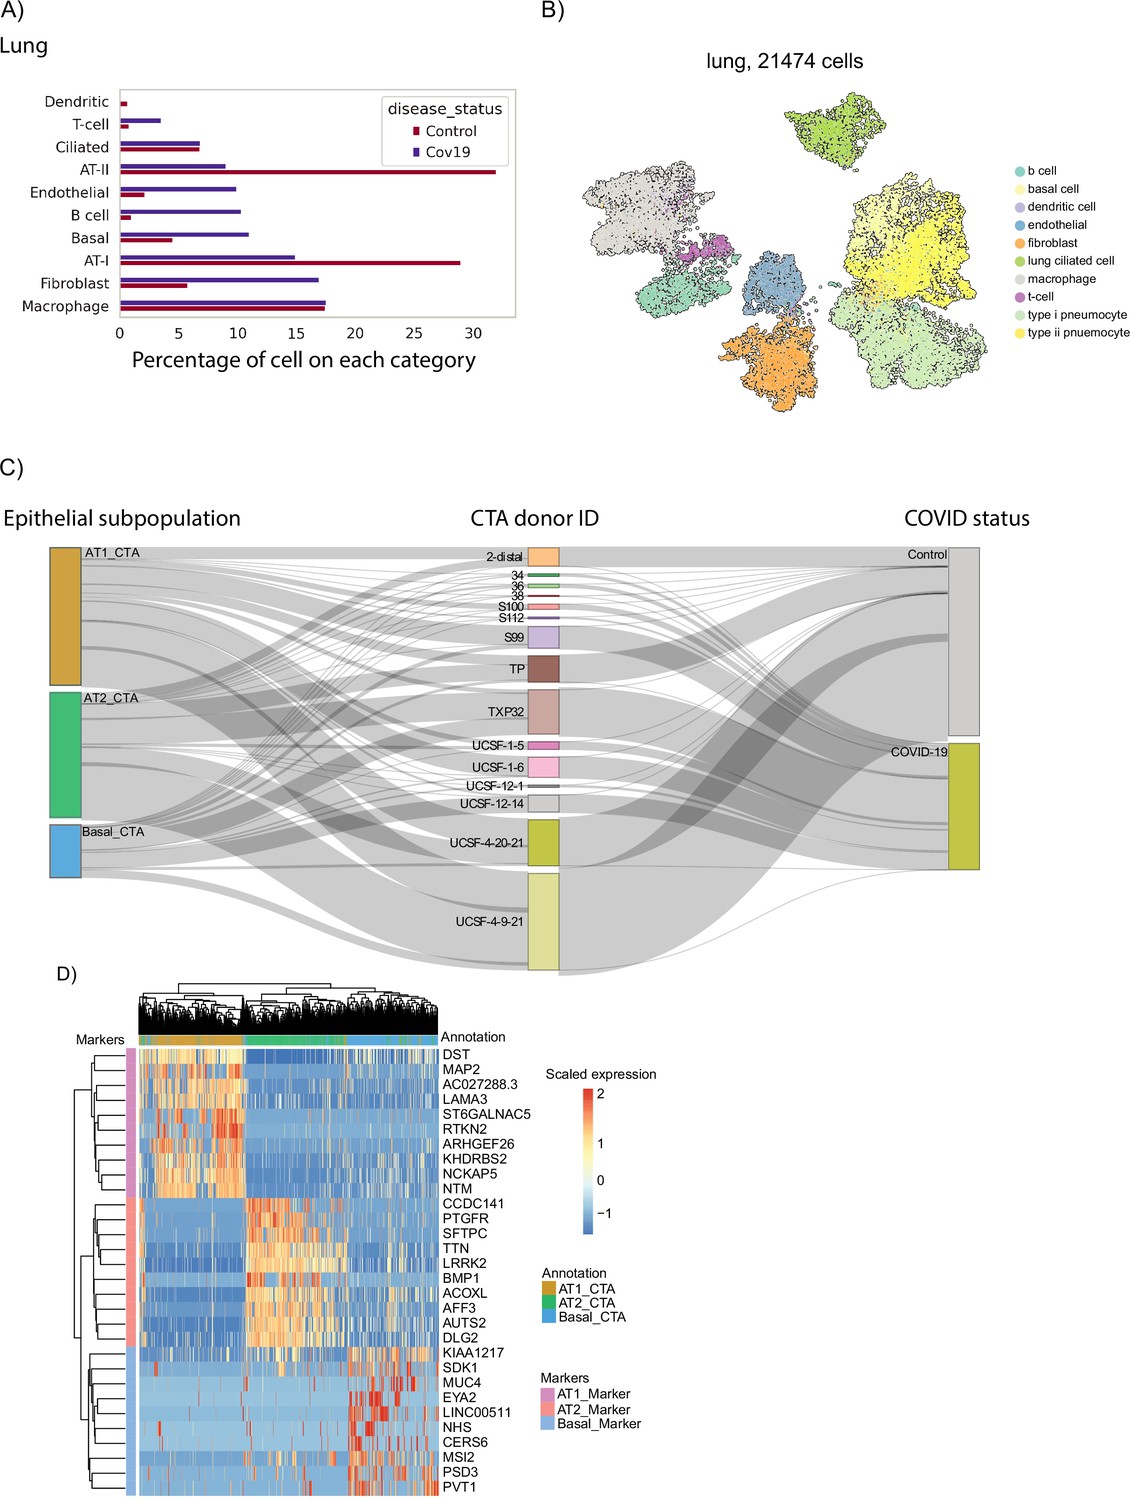
Cell-type composition of the COVID-19 lung.
(A) Relative sizes of the different cell populations identified in the lung. The numbers of cells are normalized to add up to 100% for COVID-19 cells and healthy cells independently. (B) UMAP visualization of the lung data. Single cells are colored by their cell type annotation. (C) Sankey diagram showing the distribution of individual cells across donors, COVID-19 status, and cell-type annotation of epithelial cells from the lung. (D) Expression of gene markers across the three populations of epithelial cells identified in the lung data.
Figure 3 with 3 supplements
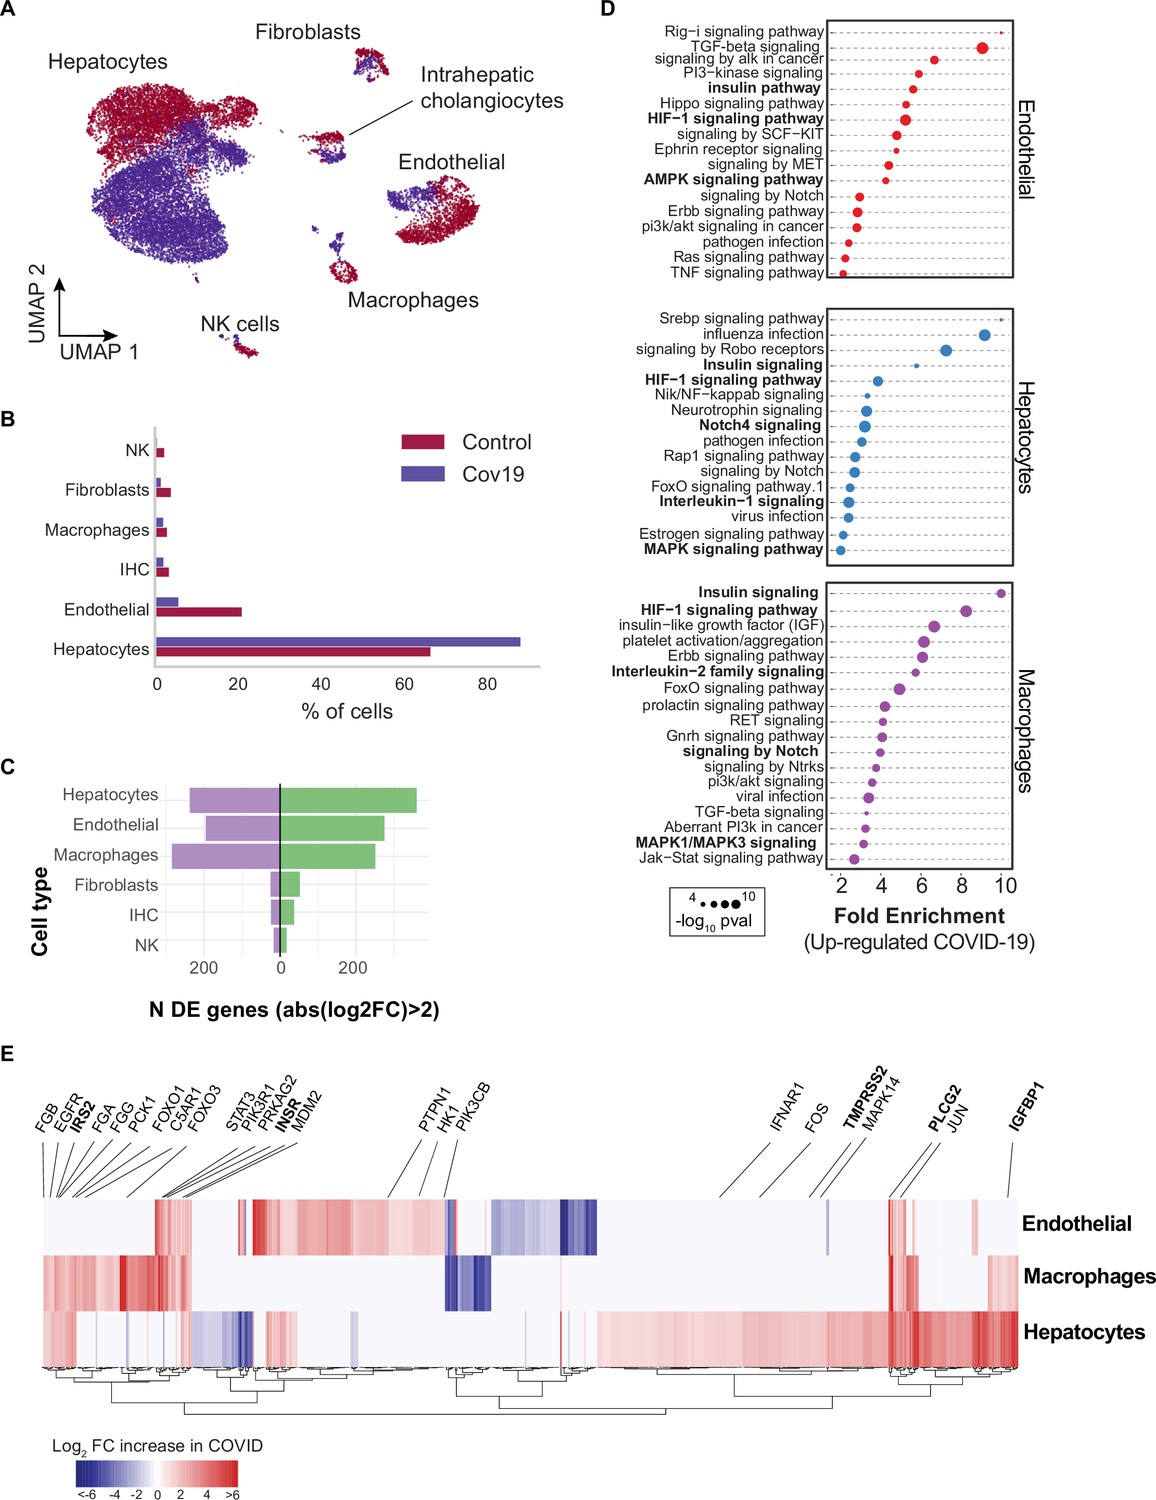
Transcriptional changes and dysregulation of cell signaling in the COVID-19 liver.
(A) UMAP plot showing all cells from liver samples (n=6 donors) colored by COVID-19 status. Cell-type annotations are indicated for each cluster. (B) Fraction of cells for each cell type grouped by COVID-19 status. (C) The number of differentially expressed (DE) genes found using MAST (Finak et al., 2015) (negative-binomial model, correcting for the number of detected genes, p<1e-6 and log2 fold change (log2-FC) >2). (D) The top enriched signaling pathways found for each cell type based on the DE genes shown in (C). (E) Heatmap of log2-FC for the top DE genes. A few relevant genes are highlighted with a text legend.
Figure 3—figure supplement 1
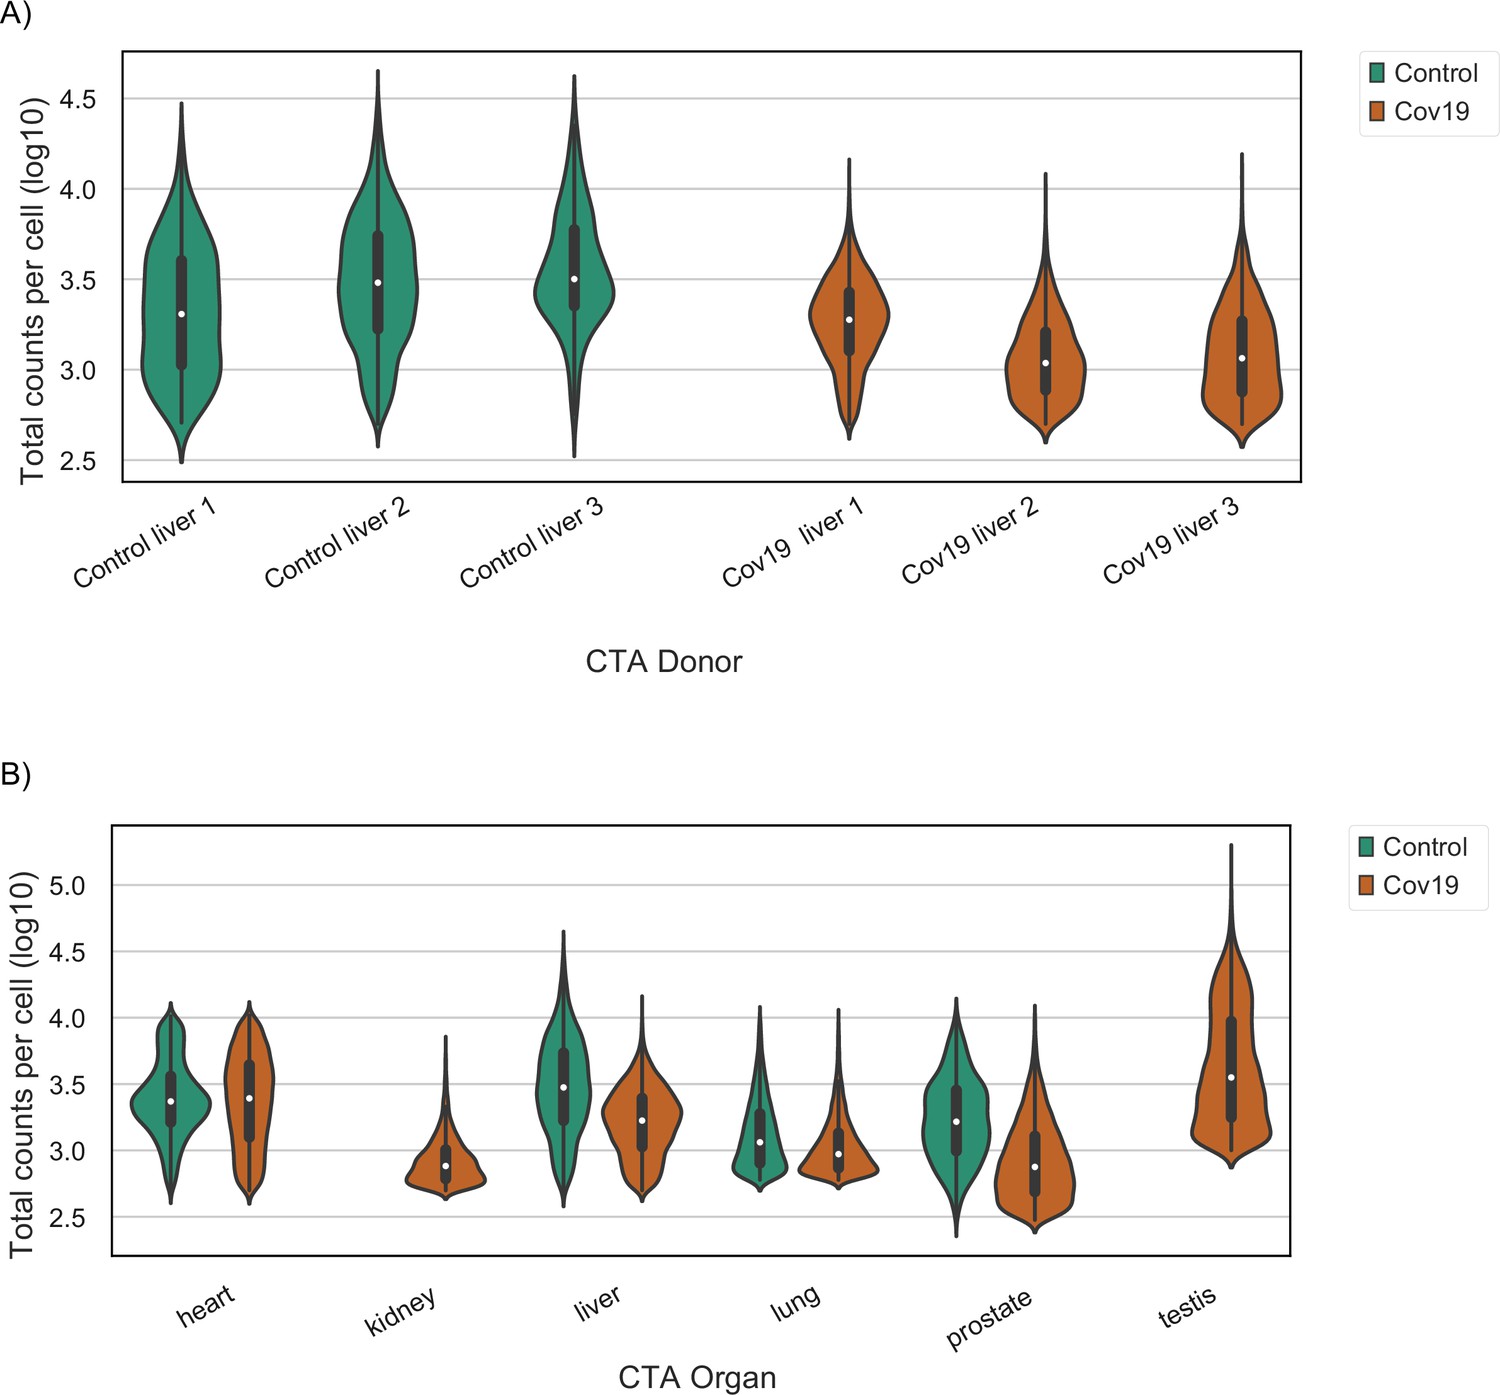
Sequencing depth in healthy and COVID-19 samples.
(A) Total counts per cell (after quality control) in liver samples grouped by their COVID-19 status. A violin plot is shown for each donor. (B) Total counts per cell (after quality control) across all organs grouped by their COVID-19 status. For kidney and testis, only samples from COVID-19-positive donors were collected. Each violin plot shows the distribution of an organ after pooling cells from all donors together.
Figure 3—figure supplement 2
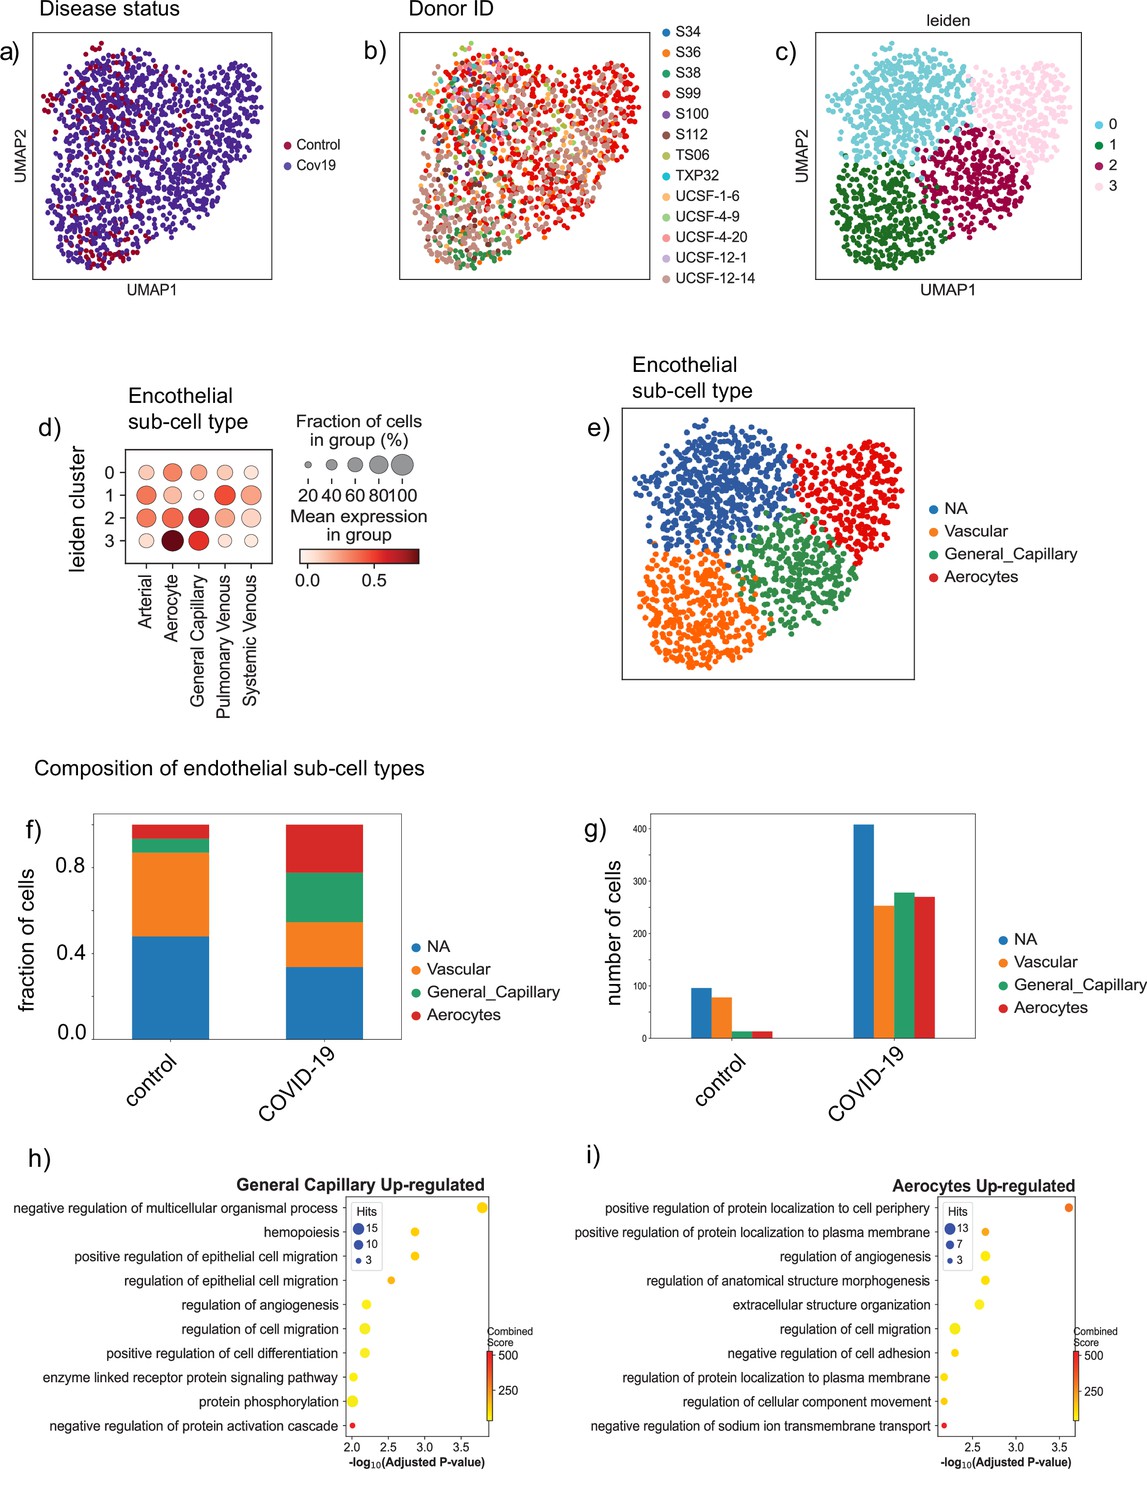
Endothelial subpopulations in the lung.
(a) Endothelial cells from the lung colored by disease status, (b) donor ID, and (c) Leiden cluster label. (d) Dot plot of cell-type score enrichment for different endothelial gene signatures. The score is calculated based on a list of known markers (Schupp et al., 2021) and shown for each cluster in (C). Cluster 0 is labeled as NA as it did not score high for any of the reference gene signatures. (d) Bar plot showing the proportions of the identified endothelial sub-cell types in both the control and COVID-19 groups. (e) Absolute numbers of cells for the identified cell types in both the control and COVID-19 groups. (f) The biological processes up-regulated in the general capillary population. (g) The biological processes up-regulated in the aerocyte population.
Figure 3—figure supplement 3
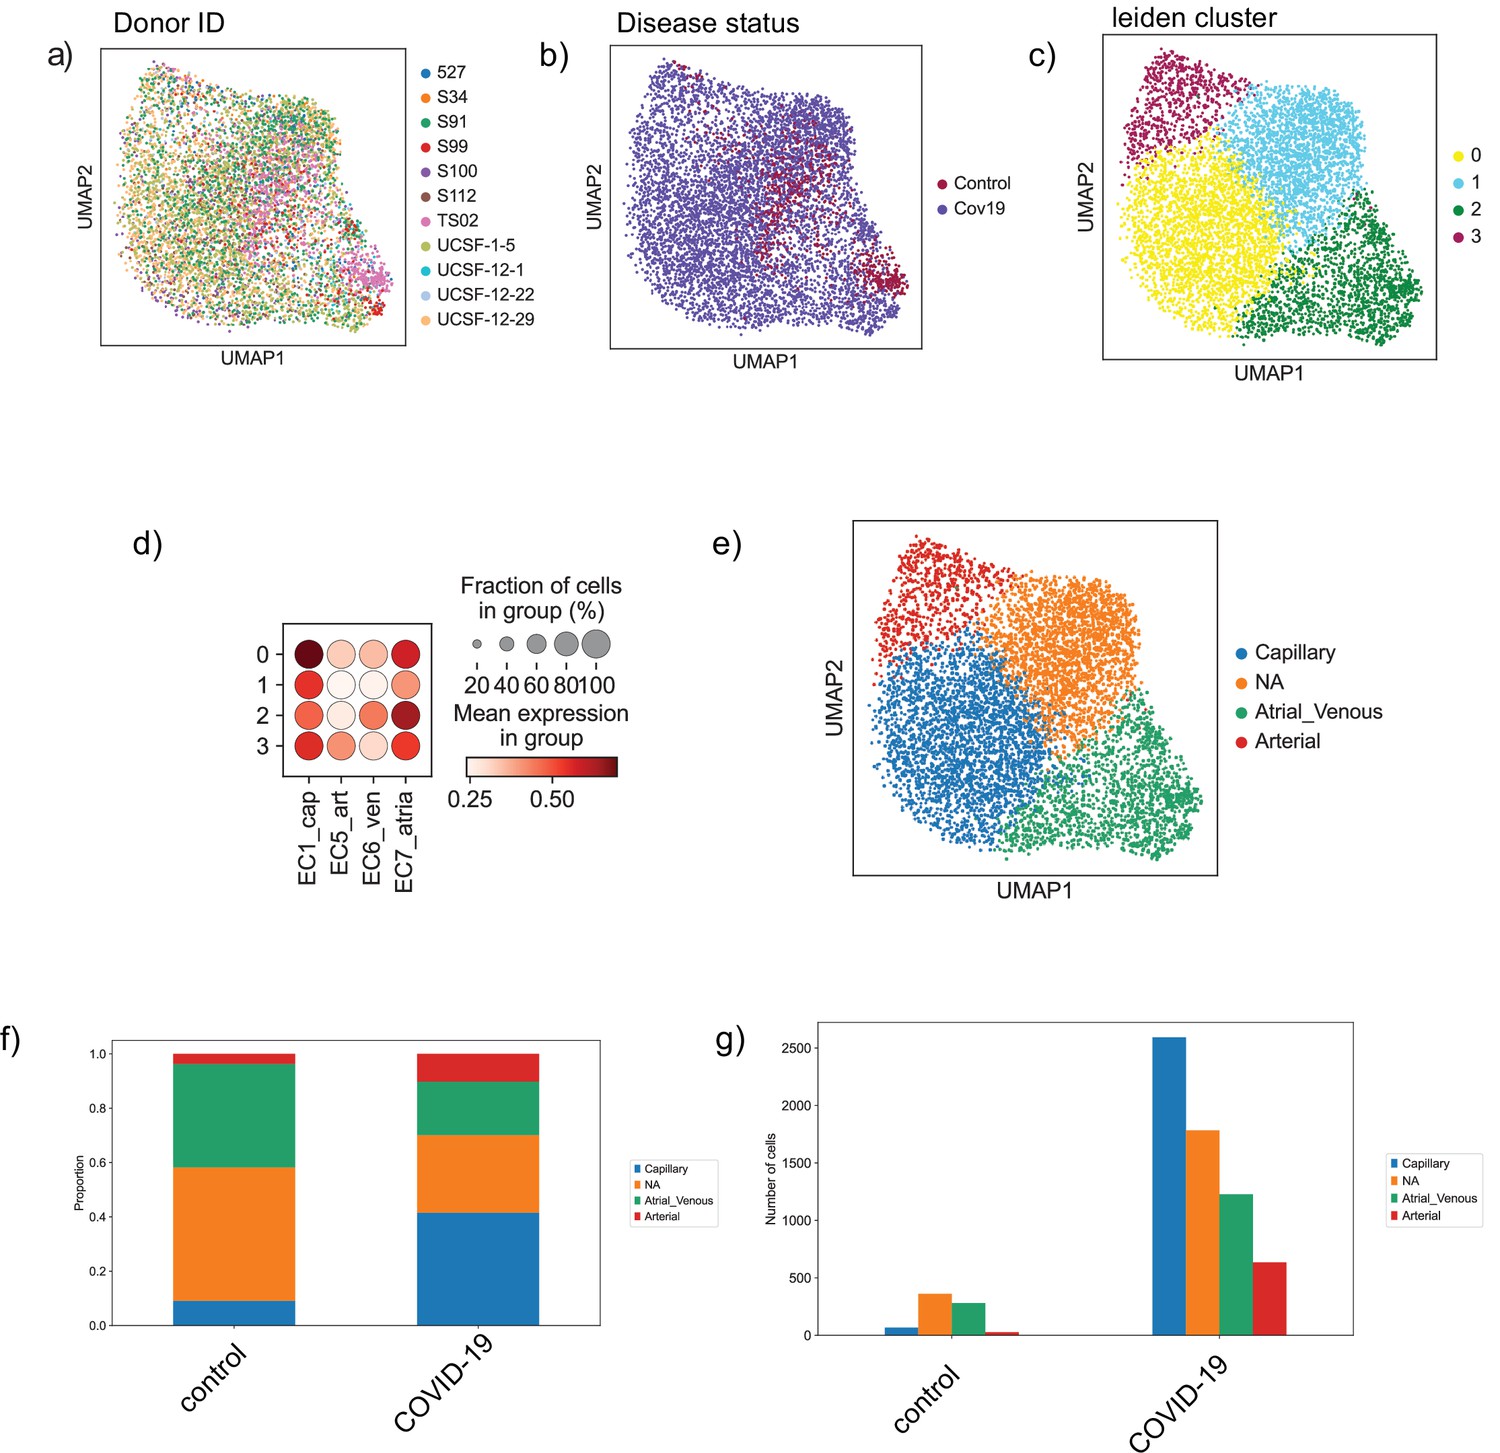
Endothelial subpopulations in the heart.
(a) Endothelial cells from the heart colored by donor ID, (b) disease status, and (c) Leiden cluster label. (d) Dot plot of cell-type score enrichment for different endothelial gene signatures. The score is calculated based on a list of known markers and shown for each cluster in (C). Cluster 1 is labeled as NA as it did not score high for any of the reference cell types. (d) Bar plot showing proportions of the identified endothelial sub-cell types in both the control and COVID-19 groups. (e) Absolute numbers of cells for the identified cell types in both the control and COVID-19 groups.
Figure 4
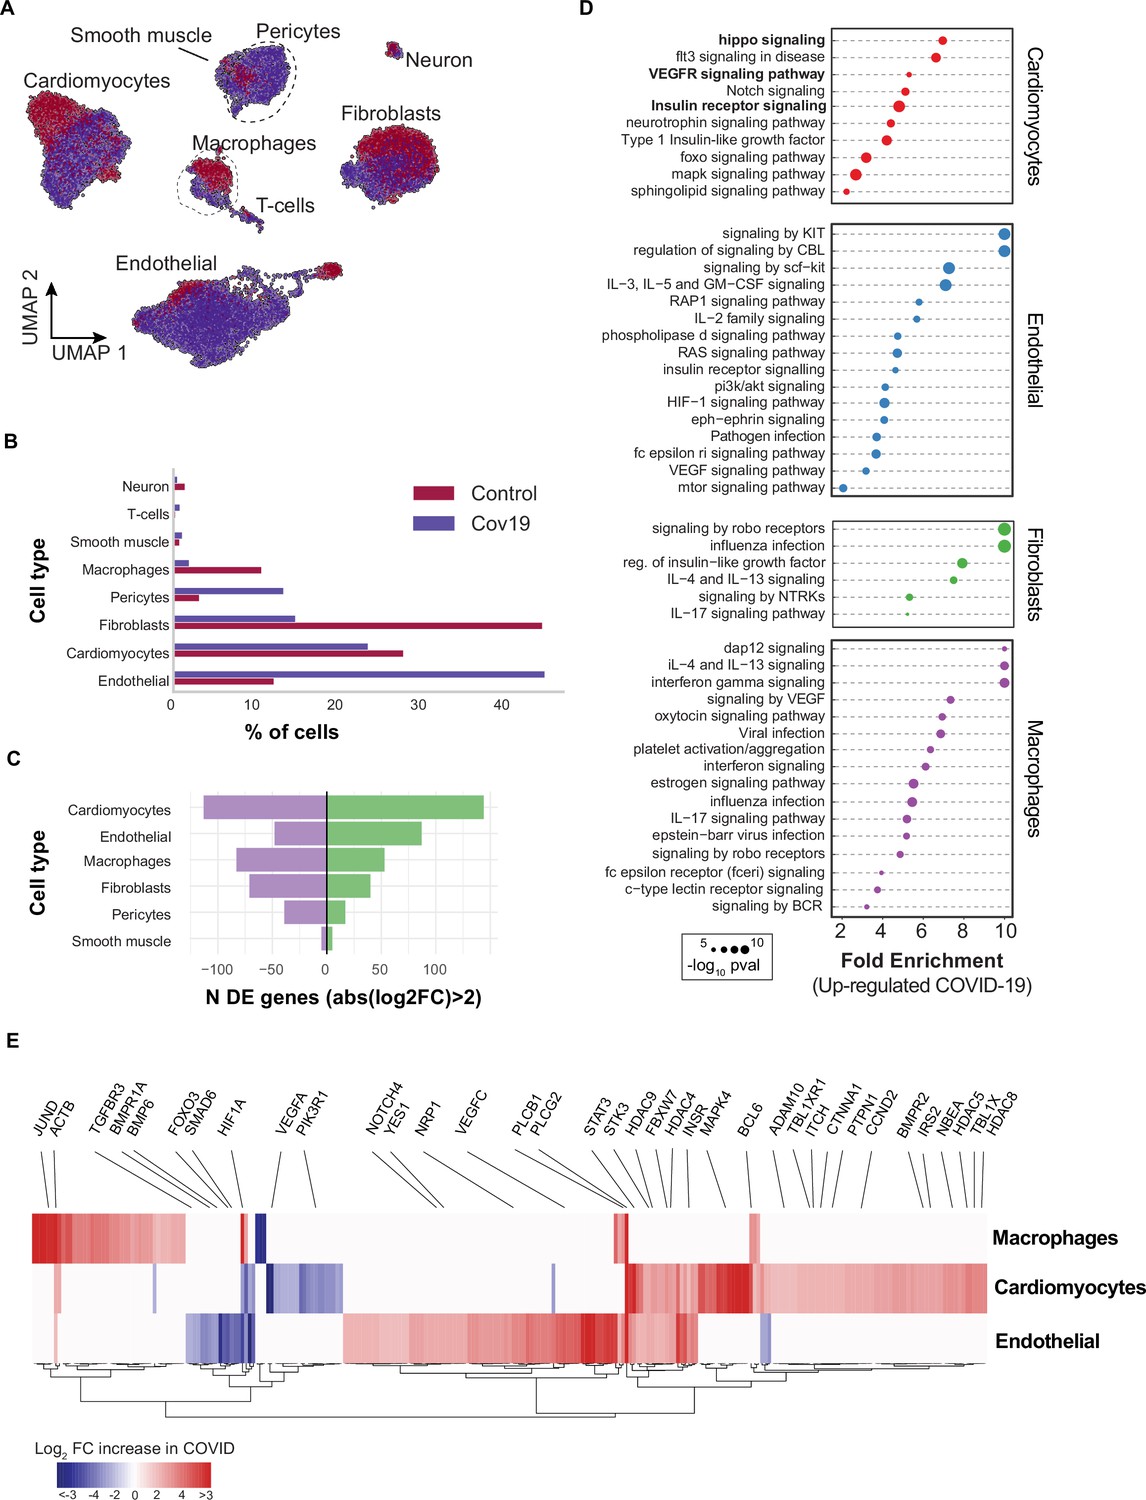
Transcriptional changes and dysregulation of cell signaling in the COVID-19 heart.
(A) UMAP plot showing all cells from heart samples (n=11 donors) colored by COVID-19 status. Cell-type annotations are indicated for each cluster. (B) Fraction of cells for each cell type grouped by COVID-19 status. (C) The number of differentially expressed genes found using MAST (Finak et al., 2015) (negative-binomial model, correcting for the number of detected genes, p<1e-6 and log2 fold change (log2-FC) >2). (D) The top signaling pathways found for each cell type using the genes in (C). (E) Heatmap of log2-FC for the top differentially expressed genes. A few relevant genes are highlighted with a text legend.
Figure 5 with 1 supplement
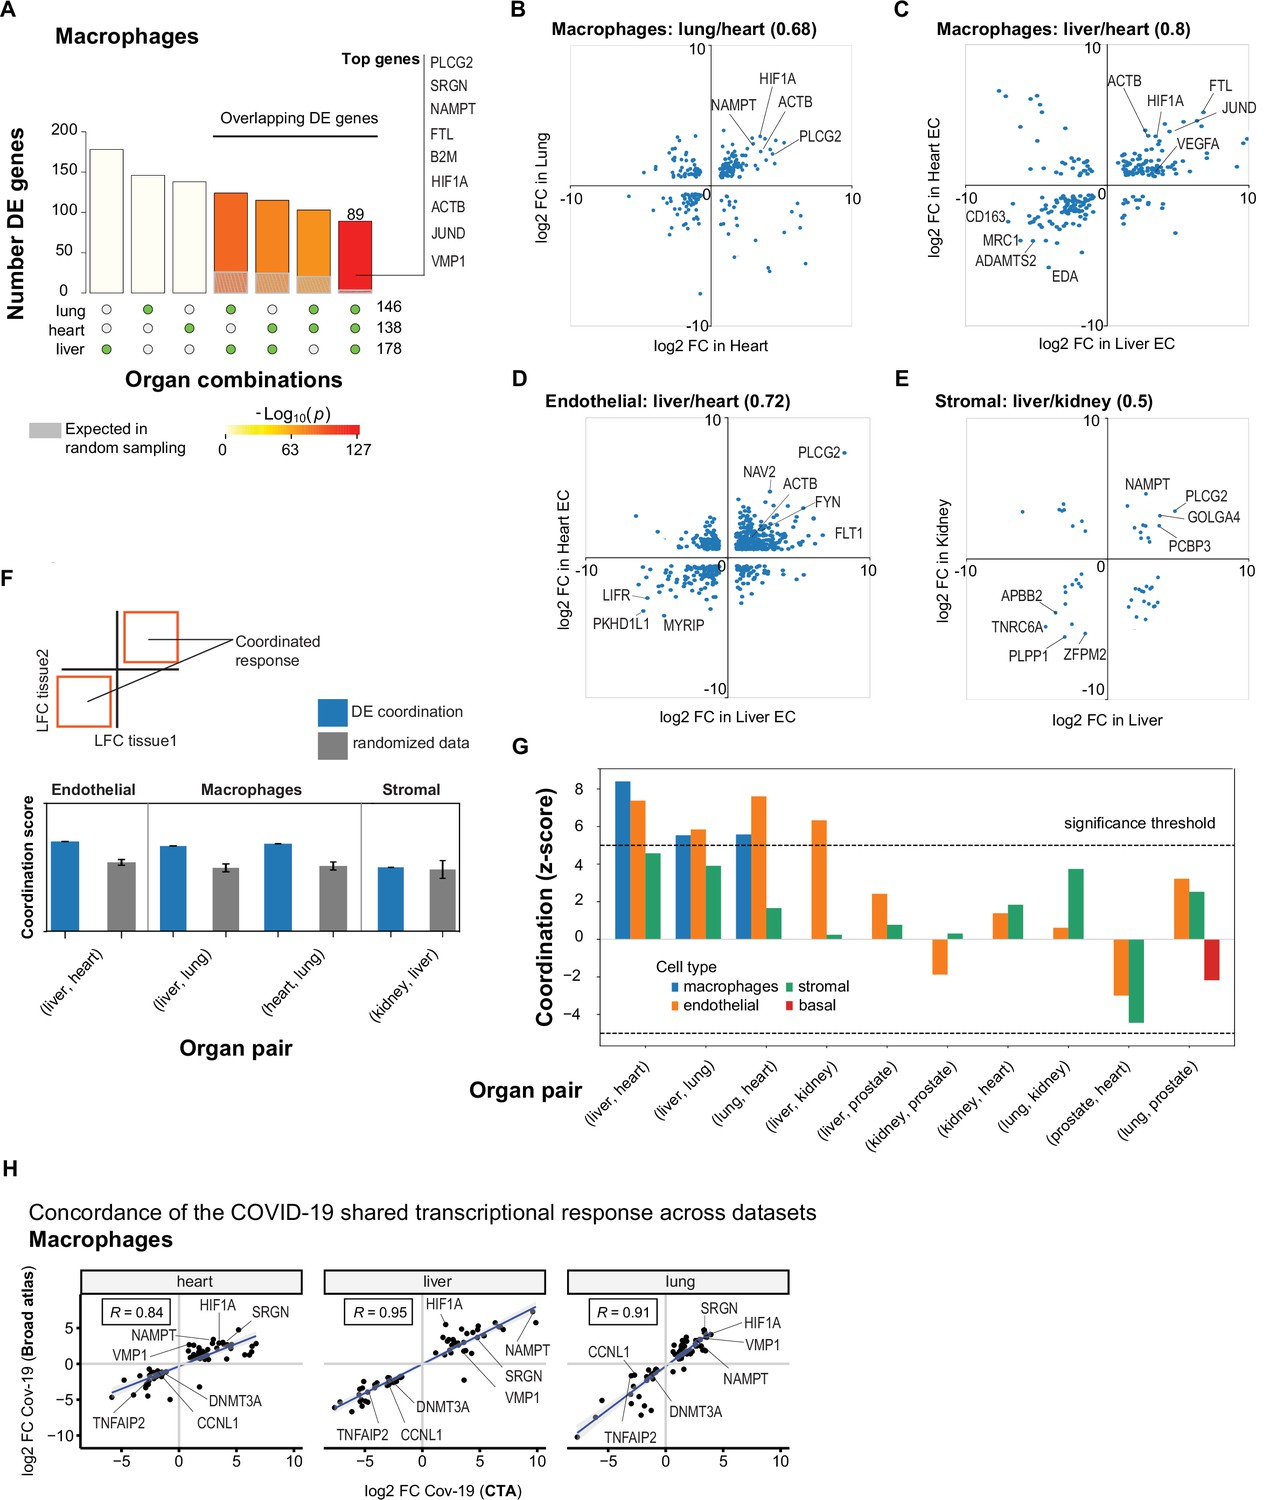
A shared transcriptional response in macrophages and endothelial cells across organs.
(A) Overlap of differentially expressed (DE) genes in COVID-19 macrophages across organs. The gray shaded area indicates the expected overlap for each organ combination (green circles) under a null hypothesis of random sampling (we computed the p-values against this null model). The white bars indicate the number of genes that showed DE in a single organ. The names of the top genes DE in all three organs are shown based on their log2-fold enrichment. (B) Scatter plot comparing the log2 fold change (log2-FC) for DE genes in COVID-19 macrophages from lung and heart. (C) Same as (B) but compares DE genes in COVID-19 macrophages from the liver and heart. (D) log2-FC for COVID-19 endothelial cells from the liver and heart. (E) log2-FC for COVID-19 stromal cells from the liver and kidney. (F) A fully coordinated transcriptional signature would imply that all genes lie in the bottom-left and top-right quadrants (red squares). We define the coordination score as the number of DE genes that show the same direction (up-up, down-down) for the two organs, divided by the number of shared DE genes (A). Gray bars show the score expectation when sampling DE genes randomly from each organ. (G) Coordination scores for different cell types across all pairs of organs. The dotted line indicates a significance threshold of z-score >5 standard deviations compared to the expectation by chance. (H) Scatterplot of log2-FC between control and COVID-19 for macrophages from three different organs. Each dot represents a gene; the x-axis shows the log2-FC found using data from the COVID Tissue Atlas (CTA), while the y-axis shows the corresponding log2-FC found using the Broad COVID-19 atlas. The same methods and significance thresholds were applied to both datasets. The scatterplot shows the genes that showed significant differences in both datasets. A few examples with coordinated upregulation across all three organs in both datasets are indicated by name.
Figure 5—figure supplement 1

Overlapping differentially expressed (DE) genes in endothelial cells across organs.
(A) Overlap of DE genes in COVID-19 endothelial cells across organs. The gray shaded area indicates the expected overlap for each organ combination (green circles) under a null hypothesis of random sampling (we computed the p-values against this null model). The white bars indicate the number of genes that showed DE in a single organ. The names of the top DE genes in all three organs are shown based on their log2-fold enrichment. (B) Scatterplot of log2 fold change (log2-FC) between control and COVID-19 for endothelial cells from three different organs. Each dot represents a gene; the x-axis shows the log2-FC found using data from the COVID Tissue Atlas (CTA), while the y-axis shows the corresponding log2-FC found using the Broad COVID-19 atlas. The same methods and significance thresholds were applied to both datasets. The scatterplot includes the genes that showed significant differences in both datasets. The Pearson correlation coefficient is shown for each organ.
Figure 6
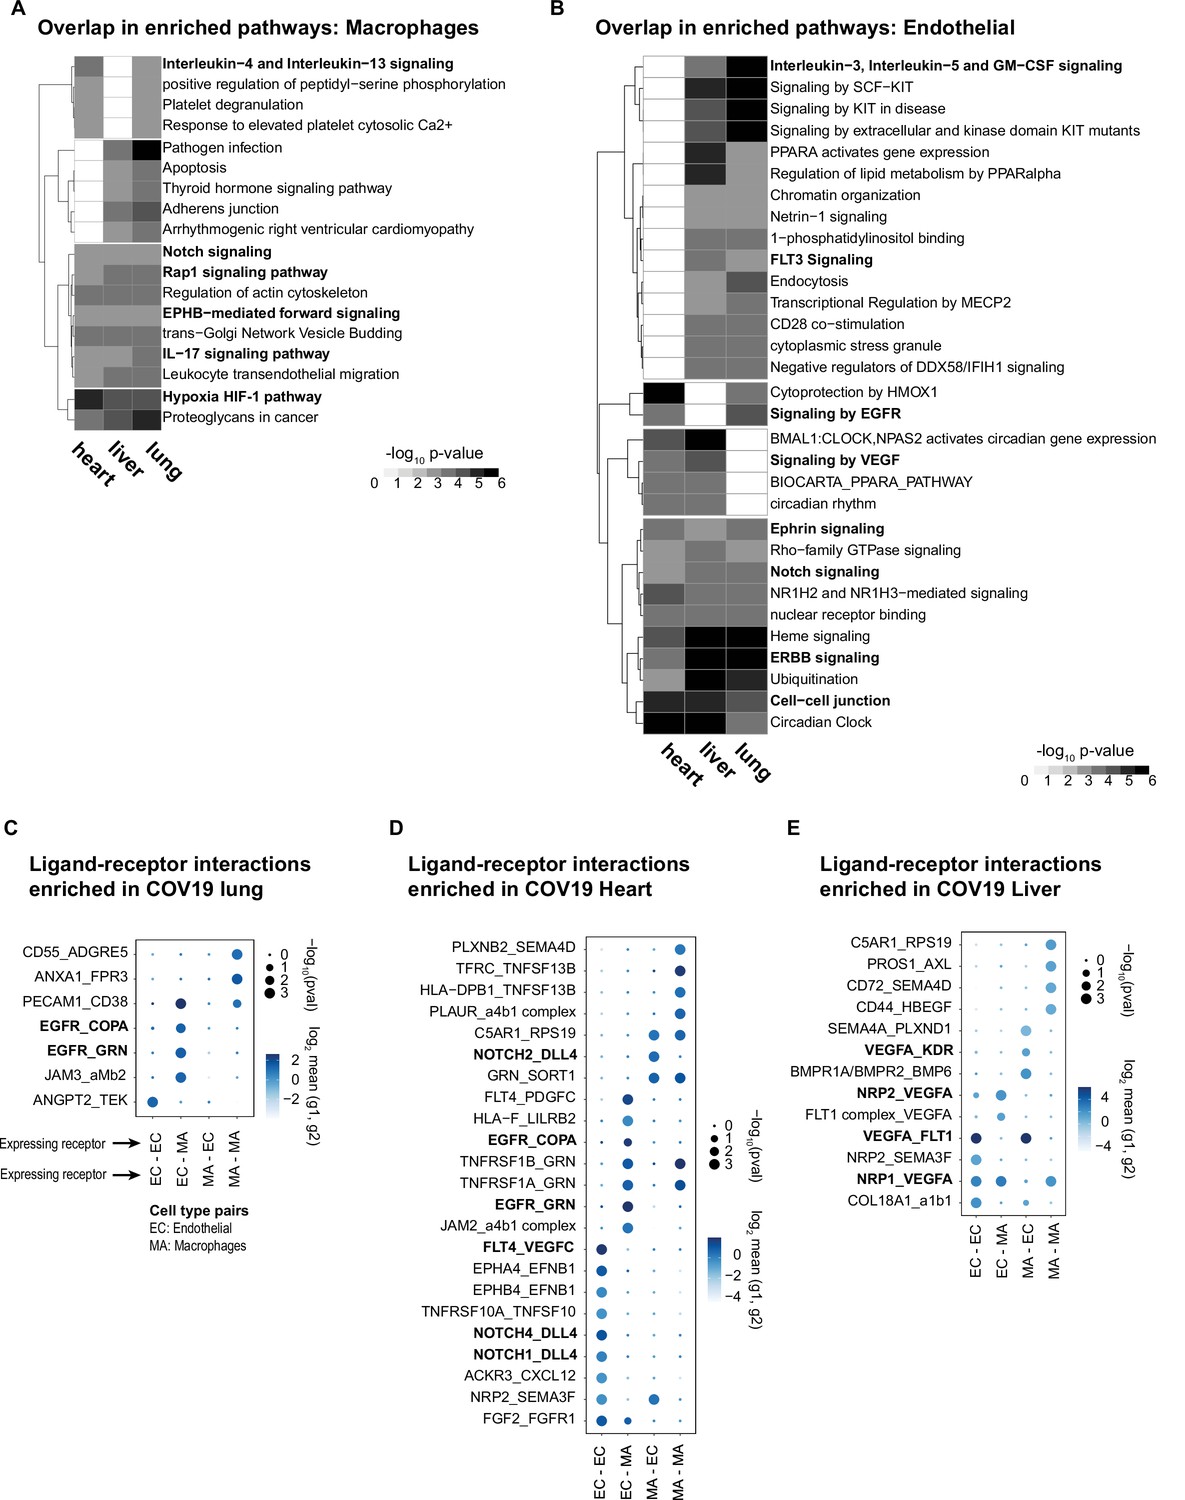
Identifying interactions between endothelial cells and macrophages.
(A) From the shared differentially expressed (DE) genes across organs, we identified the top enriched signaling pathways for COVID-19 macrophages across the lung, liver, and heart. The value in the heatmap is the log10 p-value for the gene pathway. Only pathways with fold enrichment >3 and adjusted p-value <1e-3 in at least two organs are shown. (B) Enriched pathways in the shared transcriptional response of endothelial cells across the lung, liver, and heart (using the same significance thresholds as (A)). (C–E) Enriched expression of ligand-receptor components in COVID-19 macrophages and endothelial cells in the lung (C), heart (D), and liver (E). The x-axis indicates the pair of cell types considered (EC endothelial cells, MA macrophages). The y-axis indicates all the enriched signaling interactions found, and the circles indicate the significance and magnitude of enrichment. We calculated enrichment using CellPhoneDB on the raw sequencing counts. Only ligand-receptor pairs with adjusted p-value <1e-3 are shown.
Additional files
-
Supplementary file 1
Patient characteristics.
- https://cdn.elifesciences.org/articles/81090/elife-81090-supp1-v1.xlsx
-
Supplementary file 2
Differential gene expression COVID-19 vs. healthy across all cell types in the COVID Tissue Atlas (CTA).
- https://cdn.elifesciences.org/articles/81090/elife-81090-supp2-v1.csv
-
Supplementary file 3
Pathway enrichment analysis for all cell types in COVID Tissue Atlas (CTA).
- https://cdn.elifesciences.org/articles/81090/elife-81090-supp3-v1.xlsx
-
Supplementary file 4
Shared DGE (differential gene expression) signatures in macrophages and endothelial.
- https://cdn.elifesciences.org/articles/81090/elife-81090-supp4-v1.csv
-
Supplementary file 5
Upregulated pathways in the shared transcriptional response of macrophages.
- https://cdn.elifesciences.org/articles/81090/elife-81090-supp5-v1.xlsx
-
Supplementary file 6
Upregulated pathways in the shared transcriptional response of endothelial cells.
- https://cdn.elifesciences.org/articles/81090/elife-81090-supp6-v1.xlsx
-
Supplementary file 7
Shared transcriptional signatures in macrophages and endothelial cells in the Broad atlas and their overlap with the COVID Tissue Atlas (CTA).
- https://cdn.elifesciences.org/articles/81090/elife-81090-supp7-v1.csv
-
Transparent reporting form
- https://cdn.elifesciences.org/articles/81090/elife-81090-transrepform1-v1.pdf
Download links
A two-part list of links to download the article, or parts of the article, in various formats.
Downloads (link to download the article as PDF)
Open citations (links to open the citations from this article in various online reference manager services)
Cite this article (links to download the citations from this article in formats compatible with various reference manager tools)
Single-nuclei characterization of pervasive transcriptional signatures across organs in response to COVID-19
eLife 12:e81090.
https://doi.org/10.7554/eLife.81090


