Hemocyte differentiation to the megacyte lineage enhances mosquito immunity against Plasmodium
- Laboratory of Malaria and Vector Research, National Institute of Allergy and Infectious Diseases, National Institutes of Health, United States
- Instituto de Bioquímica Médica Leopoldo de Meis, Universidade Federal do Rio de Janeiro, Brazil
Figures
Figure 1 with 1 supplement
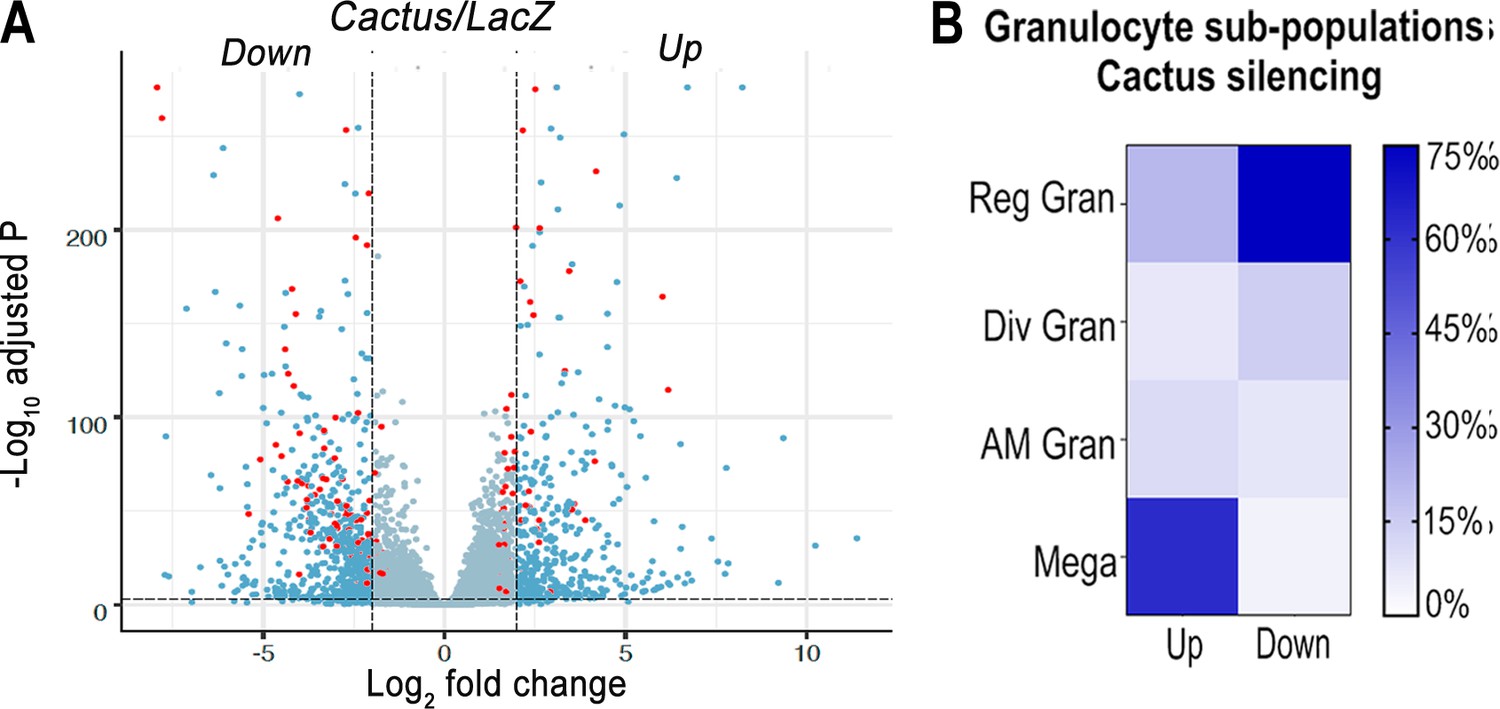
Effect of Toll pathway activation on mRNA markers of granulocyte populations.
(A) Differential expression (DE) of Cactus dsRNA knockdown. From a total of 9421 filtered genes. Volcano plot of DE genes in Cactus-silenced hemocytes compared to LacZ control filtered for log2 fold change >2 and Q value <0.001. Dark blue dots on the right represent upregulated DE genes and on the left the downregulated ones. Red dots show genes that are hemocyte-specific markers. Complete list of up- and downregulated genes is listed in Supplementary file 1 and Supplementary file 2. (B) Percentage of granulocyte subpopulation markers up- and downregulated in Cactus-silenced hemocytes. Complete list of up- and downregulated genes for each hemocyte subpopulation is in Supplementary file 1 and Supplementary file 2. Reg Gran: regular granulocytes; Div Gran: dividing granulocytes; AM Gran: antimicrobial granulocytes; Mega: megacytes.
Figure 1—figure supplement 1
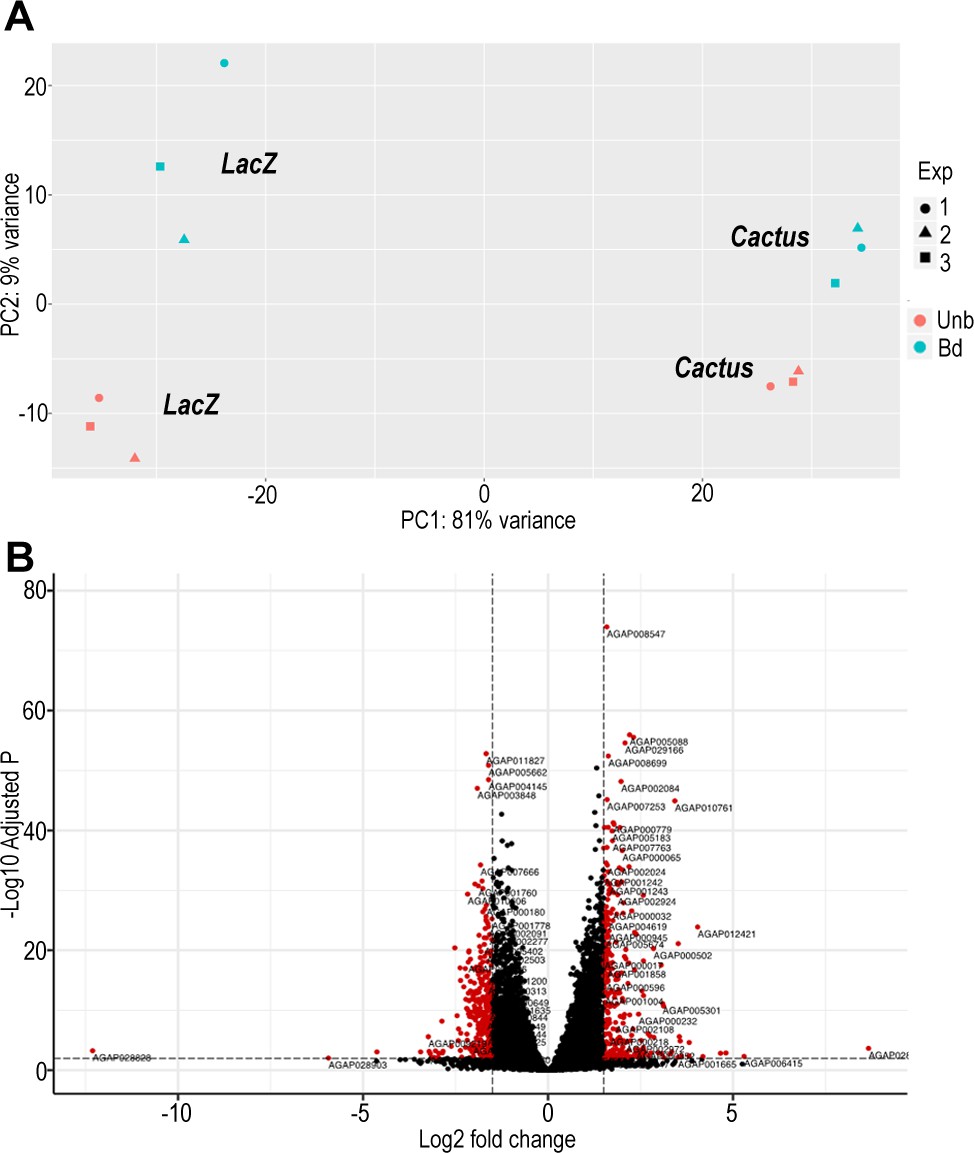
Quality control of dsCactus knockdown bulk RNAseq and differential expression (DE) between bound and unbound fractions.
(A) PCA plot showing first and second principal components of dsRNA Cactus and control LacZ knockdown, for bound and unbound hemocyte fractions. Cactus and LacZ cluster separately, and so do bound and unbound hemocyte fractions. Bd = bound. UnB = unbound. One, two, and three represent different biological replicates for each condition. (B) Volcano plot of DE genes between bound and unbound hemocytes filtered for log2 fold change >1.5 and Q value <0.01. From a total of 9421 filtered genes.
Figure 2 with 2 supplements
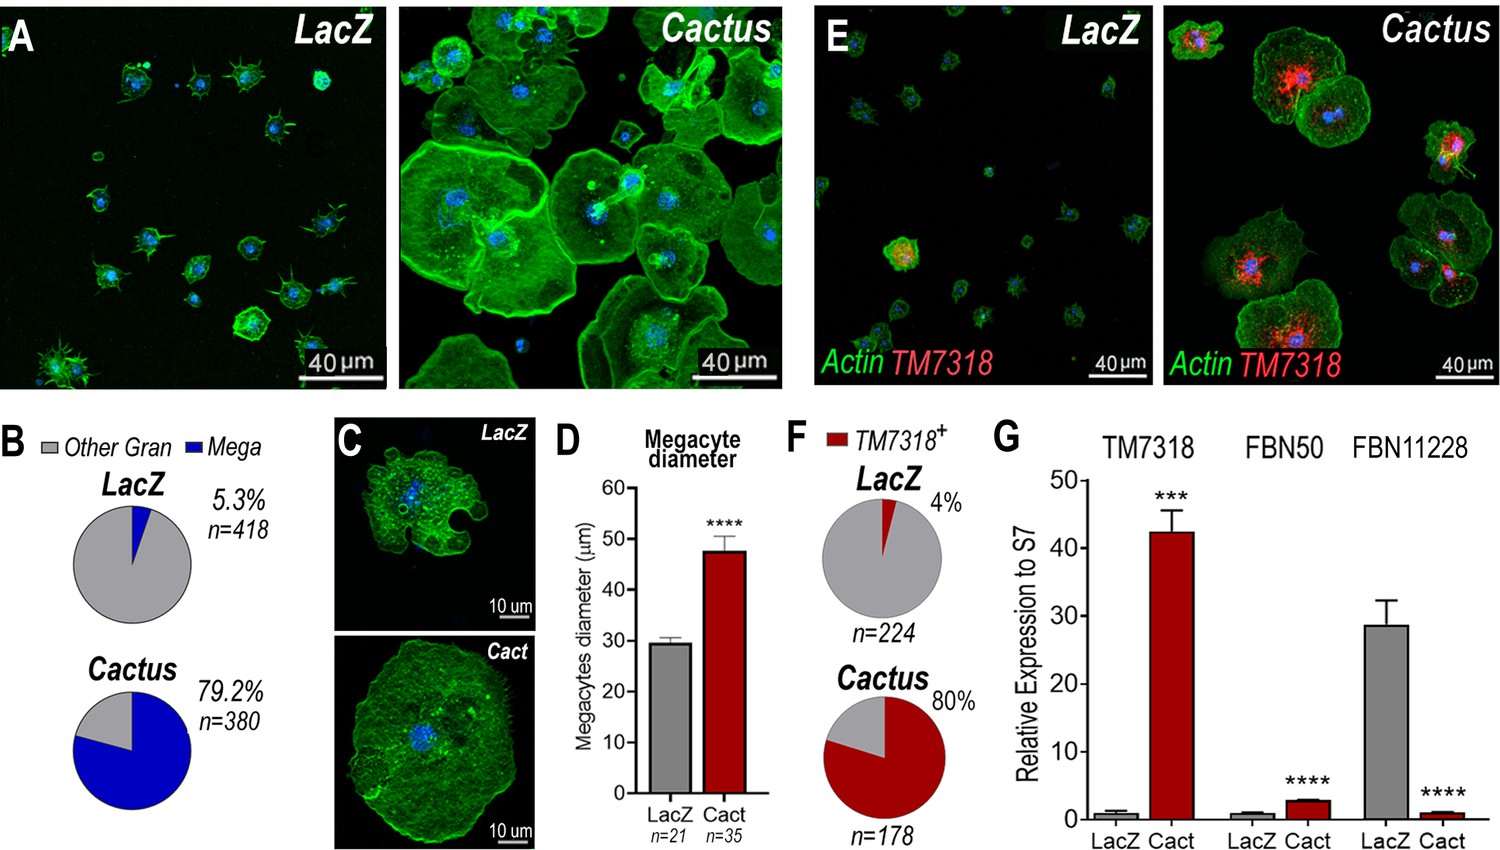
Cactus silencing promotes granulocyte differentiation into megacytes.
(A) A. gambiae hemocytes in LacZ control and Cactus attached to a glass surface. Actin is shown in green and nuclei in blue. Scale bar: 40 µm. (B) Percentage of megacytes among all granulocytes in dsLacZ and dsCactus mosquitoes. Percentages were compared using X2 test. **** = p ≤ 0.0001. (C) Megacyte in control LacZ mosquitoes (upper) and in Cactus-silenced mosquitoes (lower). Actin is showing in green, and nuclei is in blue. Scale bar: 10 µm. (D) Diameter of megacytes from LacZ control and Cactus-silenced mosquitoes. Error bars represent mean ± standard error of the mean (SEM). Unpaired T-test. **** = p ≤ 0.0001. (E) RNA in situ hybridization for megacyte-specific marker TM7318. Actin is shown in green (phalloidin), TM7318 mRNA in red, and the nuclei in blue (Hoechst). Scale bar: 40 µm. (F) Percentage of TM7318-positive cells in LacZ and Cactus-silenced granulocytes. Percentages were compared using X2 test. **** = p ≤ 0.0001. (G) Relative mRNA expression of hemocyte-specific markers in LacZ control and Cactus hemocytes for transcriptome validation. Megacyte marker (TM7318), antimicrobial granulocytes (FBN50), and regular granulocytes (FBN11228). Gene expression was normalized using RpS7 expression. Error bars represent mean ± SEM. Unpaired T-test, ***=p ≤0.001, = p ≤ 0.0001. Two independent experiments with 3 replicates each experiment, a total of 6 pools of 15 mosquitoes each.
Figure 2—figure supplement 1
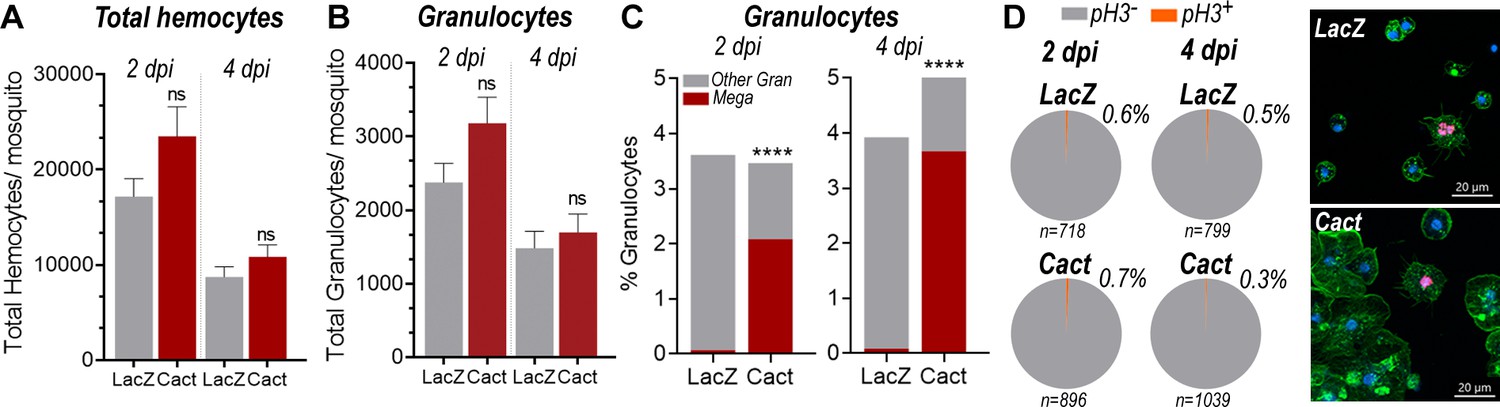
Megacyte increase in response to Cactus silencing is not a result of hemocyte proliferation.
(A) Total hemocyte counts per mosquito, at day 2 and 4 post-dsRNA injection. Unpaired T-test, p = 0.1339 for day 2 and p = 0.1892 (B) Total granulocyte counts per mosquito, at day 2 and 4 post-dsRNA injection. Unpaired T-test, p = 0.1663 for day 2 and p = 0.4465 (C) Granulocyte and megacyte percentages per mosquito against total hemocyte count, at day 2 and 4 post-dsRNA injection. Unpaired T-test. **** = p ≤ 0.0001. (D) Percentage of phospho-Histone H3 (PHH3) cells among all granulocytes at day 2 and 4 post-dsRNA injection. Actin is showing in green, nuclei in blue, and PHH3 in red. Scale bar: 20 µm. Percentages were compared using X2 test, p = 0.7746, nonsignificant for day 2 and p = 0.4647, nonsignificant for day 4. Total hemocyte counts and percentages were calculated from two independent experiments.
Figure 2—figure supplement 2
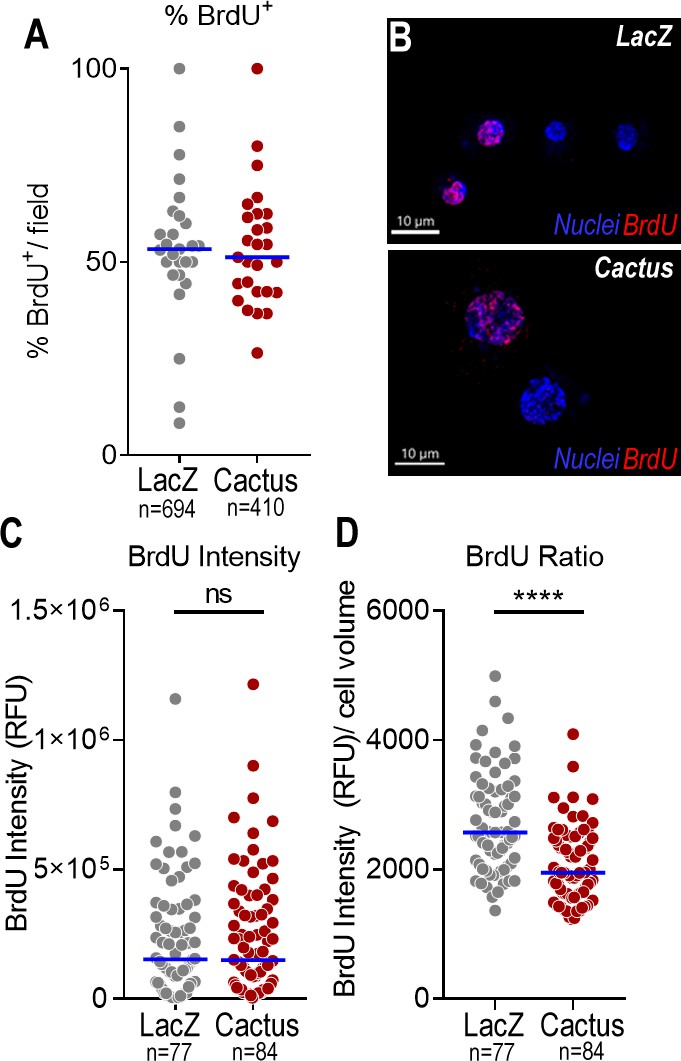
Toll activation controls megacyte differentiation and not proliferation.
(A) Percentage of BrdU+ hemocytes in dsLacZ and dsCactus mosquitoes 4 days after silencing. (B) Representative pictures of positive BrdU nuclei in LacZ and Cactus hemocytes. Nuclei is in blue and BrdU is showing in red. Scale bar: 10 µm. (C) BrdU fluorescence intensity (relative fluorescent units) in hemocytes from dsLacZ and dsCactus female mosquitoes. (D) Ratio between BrdU fluorescence intensity (relative fluorescent units) and cell volume calculated based on the fluorescence of the nuclei (Hoechst staining). Quantification of cells was performed from two independent experiments. In each experiment 10 fields were collected, counted, and analyzed for BrdU staining. Blue bar in A, C, and D represent medians. Mann–Whitney T-test, ****p < 0.0001, ns – nonsignifican, p = 0.9395 .
Figure 3
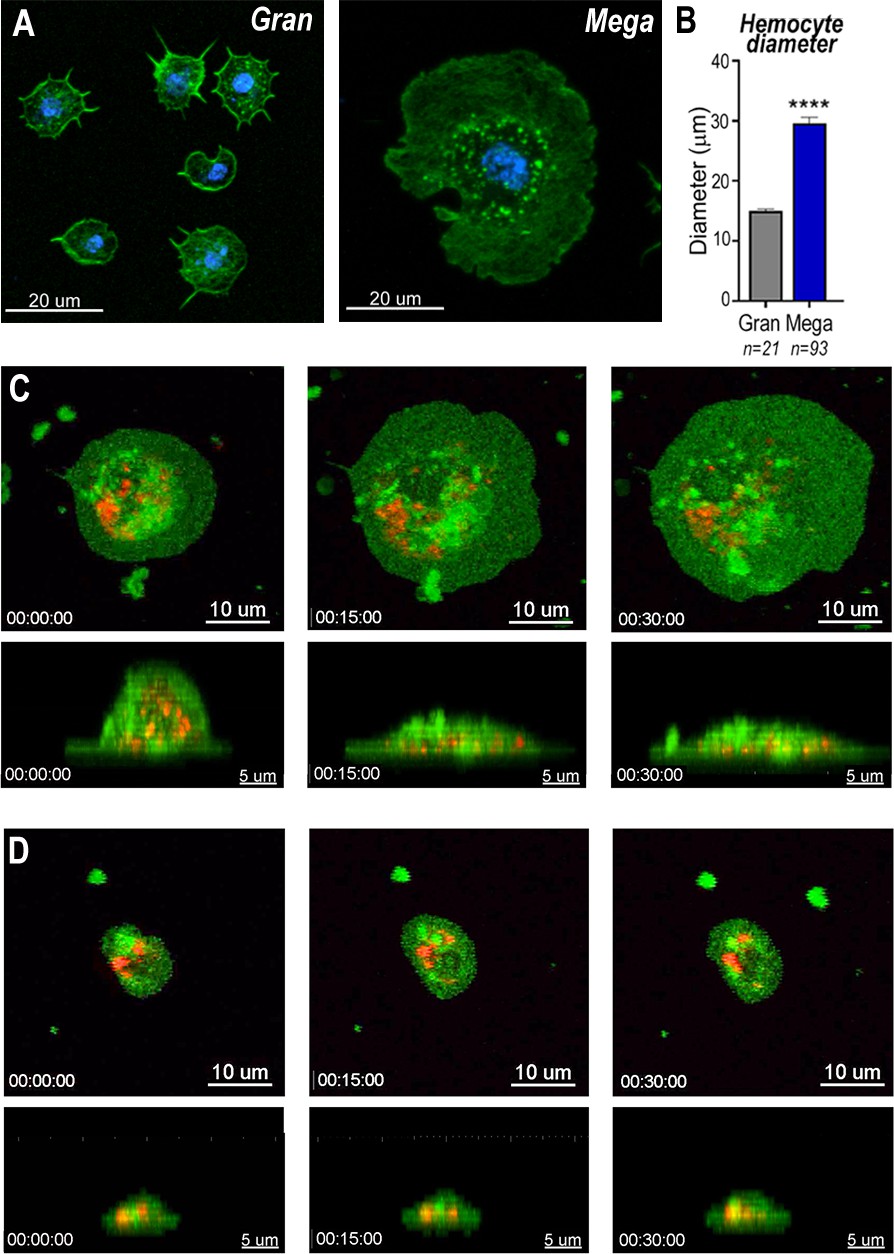
Snapshots of megacyte and granulocyte cell dynamics.
(A) Regular granulocytes and megacytes from A. gambiae females spread on a glass surface. Actin, green (phalloidin) and nuclei, blue (Hoechst). Scale bar: 20 µm. (B) Granulocyte diameter of sugar-fed mosquitoes after spreading on a glass surface. Error bars represent mean ± standard error of the mean (SEM). Unpaired T-test. ****p ≤ 0.0001. (C) Live imaging time-lapse of a megacyte spreading in a glass surface for 30 min. Plasma membrane stained in green and microvesicles in red. Top (XY) and lateral view (XZ) of a megacyte. Scale bars: 10 and 5 µm, respectively. (D) Live imaging time-lapse of a granulocyte spreading on a glass surface for 30 min. Top (XY) and lateral view (XZ) of a regular granulocyte. Scale bars: 10 and 5 µm, respectively (see Videos 1–4).
Figure 4
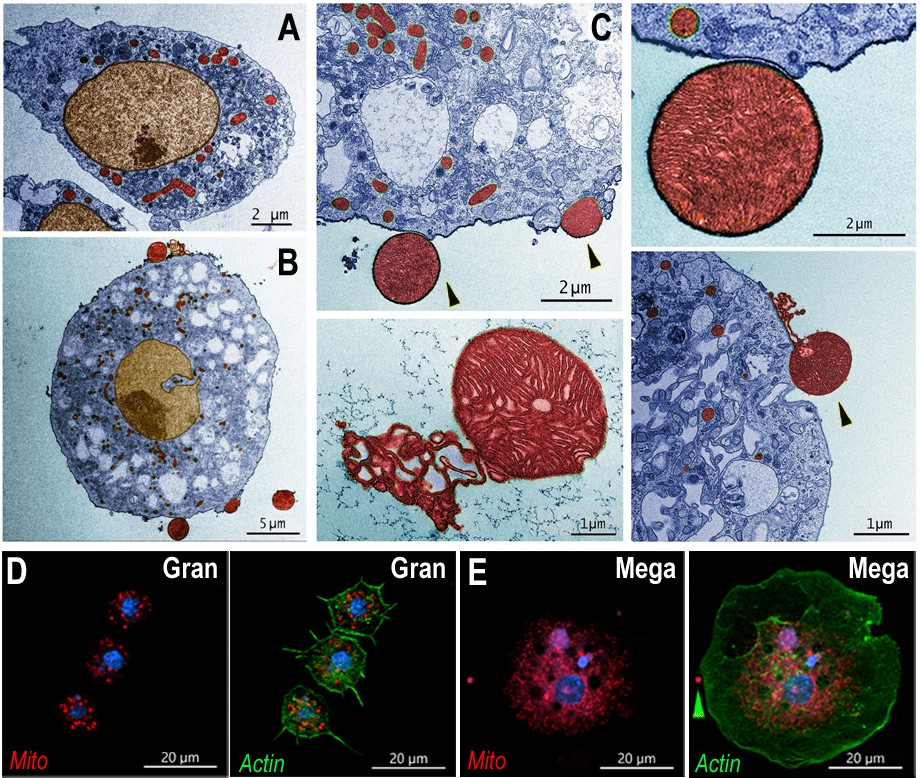
Ultrastructure of megacytes in Cactus-silenced mosquitoes.
(A) Transmission electron microscopy (TEM) of regular granulocytes from Cactus-silenced mosquitoes. Scale bar: 2 µm. (B) TEM of megacytes from Cactus-silenced mosquitoes. Scale bar: 5 µm. (C) Extracellular giant mitochondria-like structures (black arrows). Closeup of a mitochondria-like structure (lower center). Scale bars: 2 and 1 µm. TEM images were digitally colorized, cytoplasm is shown in blue, mitochondria in red, and nuclei in golden yellow. (D) Mitotracker staining in regular granulocytes. Scale bar: 20 µm. (E) Mitochondrial staining of Cactus-silenced megacytes. Actin is stained in green (phalloidin), mitochondria in red (mitotracker), and nuclei in blue (Hoechst). Yellow arrow indicates an extracellular mitochondrion like structure outside of a megacyte. Scale bar: 20 µm.
Figure 5
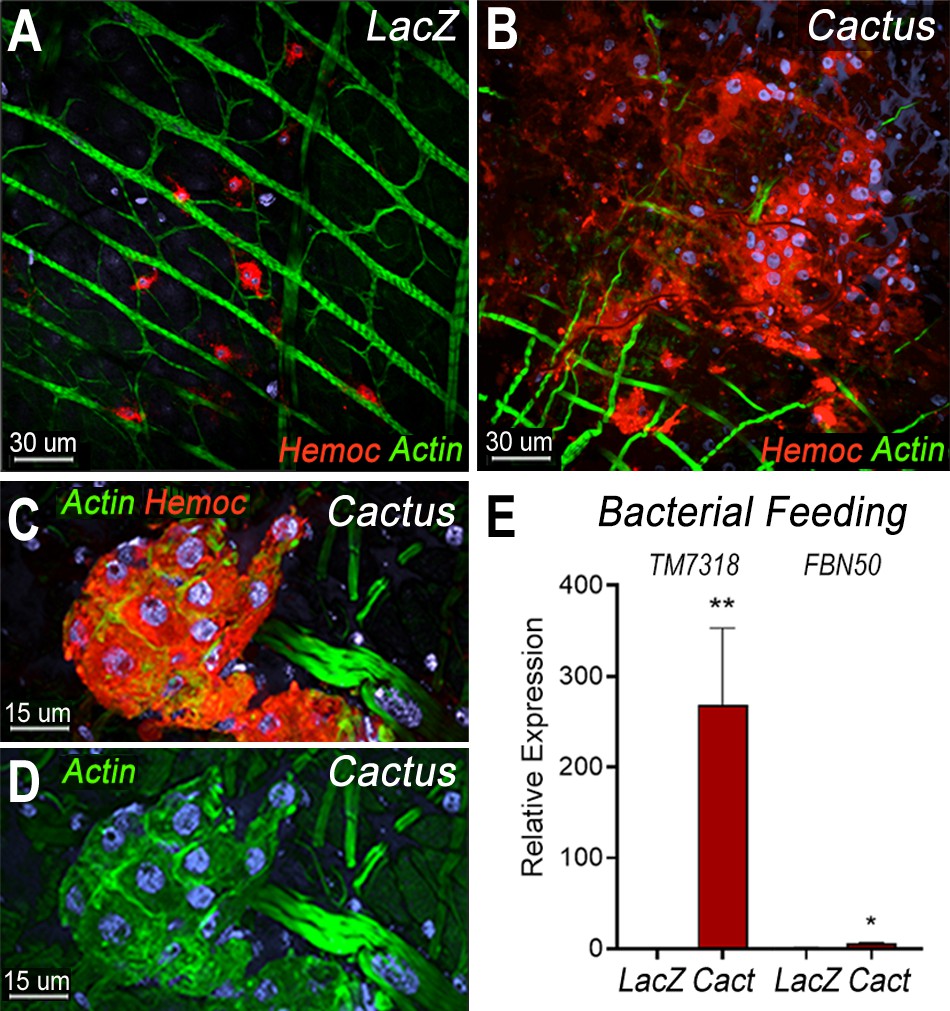
Bacterial feeding increases megacyte association to the midgut basal surface.
(A) Effect of bacterial feeding in LacZ-injected controls on hemocytes associated to the midgut basal surface. (B) Effect of Cactus silencing on the hemocytes associated to the basal surface of the midgut 4 hr post-bacterial feeding. (A, B) Scale bar: 30 µm. (C, D) Hemocyte cluster attached to the midgut surface in Cactus-silenced mosquitoes 4 hr post-bacterial feeding. Scale bar: 15 µm. (A–D) Midgut actin is shown in green (phalloidin), hemocytes (stained with Vybrant CM-DiI) in red, and nuclei in blue (Hoechst). (E) Relative mRNA levels of effector hemocyte markers in the midgut 4 hr after bacterial feeding in LacZ and Cactus-silenced mosquitoes. Scale bar: 15 µm. Error bars in (E) represent mean ± standard error of the mean (SEM). Unpaired T-test, *p ≤ 0.05, **p ≤ 0.01. Two independent experiments with 3 replicates for each experiment, a total of 6 pools of 15 mosquitoes each.
Figure 6 with 2 supplements
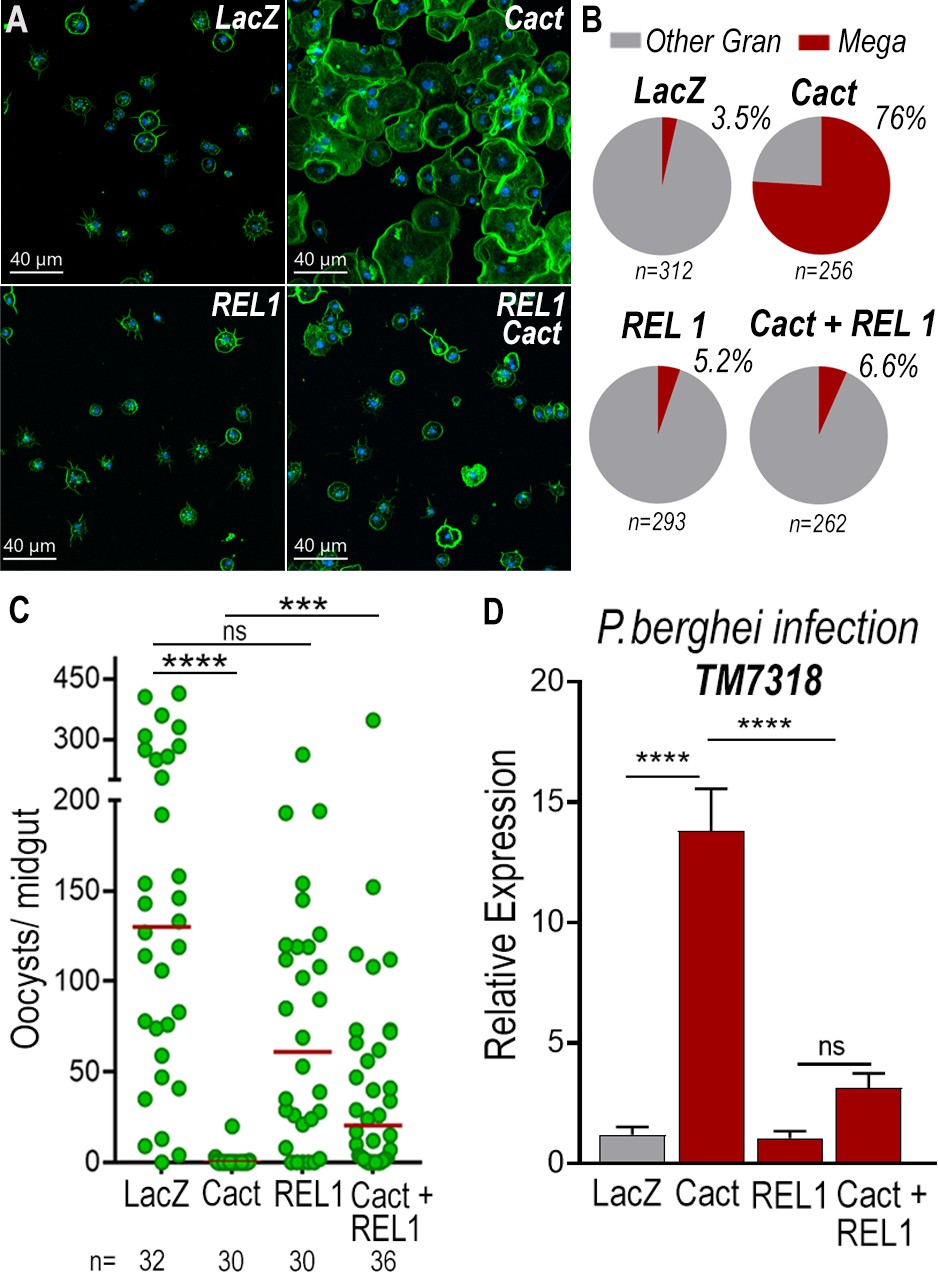
Toll signaling is required for megacyte differentiation and Plasmodium ookinete elimination in dsCactus females.
(A) A. gambiae hemocytes in LacZ control, Cactus, Rel1, and Cactus + Rel1 attached to a glass surface. Actin is shown in green and nuclei in blue. Scale bar: 40 µm. (B) Percentage of megacytes among all granulocytes in dsLacZ, dsCactus, ds Rel1, and dsCactus + Rel1 mosquitoes. Percentages were compared using X2 test. ****p ≤ 0.0001. (C) Mosquito susceptibility to P. berghei infection after dsRNA injection for LacZ, Cactus, Rel1, and Cactus + Rel1. Each dot in C represents the number of oocysts or hemocytes, respectively, for individual midguts. The median is indicated by the red line. Analysis of variance (ANOVA) Kruskal–Wallis test, ****p ≤ 0.0001; ***p ≤ 0.001, NS, p = 0.1074. (D) Relative mRNA levels of TM7318, megacyte marker, in the midgut 26 hr post-P. berghei infection (post-invasion) in LacZ, Cactus, Rel1, and Cactus + Rel1 silenced mosquitoes. Error bars in (D) represent mean ± standard error of the mean (SEM). Unpaired T-test, ****p ≤ 0.0001, NS, p = 0.6238. A total of 6–7 pools of 15 mosquitoes each per condition.
Figure 6—figure supplement 1

Plasmodium berghei infection increases megacyte association to the midgut basal surface.
Relative mRNA levels of effector hemocyte markers in the midgut 26 hr post-P. berghei infection (post-invasion) in LacZ and Cactus-silenced mosquitoes. TM7318, as a megacyte and FBN50, as an antimicrobial granulocyte marker. Error bars represent mean ± standard error of the mean (SEM). Unpaired T-test, , **p ≤ 0.01.
Figure 6—figure supplement 2
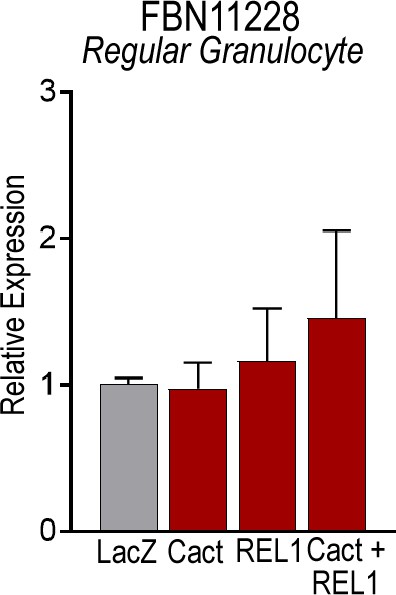
Regular granulocytes are not associated with the midgut basal lamina in response to P. berghei invasion in Cactus-silenced mosquitoes.
Relative mRNA levels of FBN11228, a marker for regular granulocytes, in the midgut 26 hr post-P. berghei infection (post-invasion) in LacZ, Cactus, Rel1, and Cactus + Rel1- silenced mosquitoes. Error bars represent mean ± standard error of the mean (SEM). One-way ANOVA , p = 0.7770.
Videos
Video 1
Top view (XY) of a regular granulocyte from A. gambiae mosquito female.
Showing in red is the microvesicle staining and in green the plasma membrane. Scale bar: 10 µm. Hemocyte was imaged for 1 hr in intervals of 5 min.
Video 2
Side view (XZ) of a regular granulocyte from A. gambiae mosquito female.
Showing in red is the microvesicle staining and in green the plasma membrane. Scale bar: 5 µm. Hemocyte was imaged for 1 hr in intervals of 5 min.
Video 3
Top view (XY) of a megacyte from A. gambiae mosquito female.
Showing in red is the microvesicle staining and in green the plasma membrane. Scale bar: 10 µm. Hemocyte was imaged for 1 hr in intervals of 5 min.
Video 4
Side view (XZ) of a megacyte from A. gambiae mosquito females. Showing in red is the microvesicle staining and in green the plasma membrane.
Scale bar: 5 µm. Hemocyte was imaged for 1 hr in intervals of 5 min.
Video 5
In vivo hemocyte patrolling activity in dsLacZ mosquitoes.
Hemocytes stained in red were imaged through the cuticle of the mosquito for 1 hr and 20 min. Scale bar: 30 µm.
Video 6
In vivo hemocyte patrolling activity in dsCactus mosquitoes.
Hemocytes stained in red were imaged through the cuticle of the mosquito for 1 hr and 20 min. Scale bar: 30 µm.
Video 7
In vitro dynamics of dsCactus megacytes.
Perfused hemocytes from dsCactus mosquitoes. Plasma membrane is showing in green, microvesicles in red, and nuclei in blue. Scale bar: 20 µm.
Additional files
-
Supplementary file 1
List of upregulated genes in Cactus-silenced hemocytes.
- https://cdn.elifesciences.org/articles/81116/elife-81116-supp1-v2.xlsx
-
Supplementary file 2
List of downregulated genes in Cactus-silenced hemocytes.
- https://cdn.elifesciences.org/articles/81116/elife-81116-supp2-v2.xlsx
-
Supplementary file 3
List of Toll pathway components and final effectors upregulated in Cactus-silenced hemocytes.
- https://cdn.elifesciences.org/articles/81116/elife-81116-supp3-v2.xlsx
-
MDAR checklist
- https://cdn.elifesciences.org/articles/81116/elife-81116-mdarchecklist1-v2.pdf
Download links
A two-part list of links to download the article, or parts of the article, in various formats.
Downloads (link to download the article as PDF)
Open citations (links to open the citations from this article in various online reference manager services)
Cite this article (links to download the citations from this article in formats compatible with various reference manager tools)
Hemocyte differentiation to the megacyte lineage enhances mosquito immunity against Plasmodium
eLife 11:e81116.
https://doi.org/10.7554/eLife.81116


