International multicenter study comparing COVID-19 in patients with cancer to patients without cancer: Impact of risk factors and treatment modalities on survivorship
- Department of Infectious Diseases, Infection Control and Employee Health, The University of Texas MD Anderson Cancer Center, United States
- Division of Infectious Diseases, McGovern Medical School, The University of Texas Health Science Center at Houston, United States
- Médica Hematologista Hospital Israelita Albert Einstein, Brazil
- MD Anderson Cancer Network, UT MD Anderson Cancer Center, United States
- Department of Investigational Cancer Therapeutics, The University of Texas MD Anderson Cancer Center, United States
- Department of Hematology Oncology, Community Health Network, United States
- Department of Medical Oncology, Gustave Roussy, Université Paris-Saclay, France
- Cooper Medical School of Rowan University, Cooper University Health Care, United States
- Unidad de Enfermedades Infecciosas, Servicio de Medicina Interna, Hospital Universitario Puerta de Hierro, Spain
- Department of Hematology Oncology, Baptist Health, United States
- Department of Hematology/Oncology, Ohio Health Marion, United States
- Department of Infectious Diseases, St. Luke's International Hospital, Japan
- Banner MD Anderson Cancer Center – North Colorado, United States
- Division of Cancer Medicine, Banner MD Anderson Cancer Center, United States
- Department of Medical Oncology, Tan Tock Seng Hospital, Singapore
- Department of Infectious Diseases, Rafik Hariri University Hospital, Lebanon
- Department of Emergency Medicine, The University of Texas MD Anderson Cancer Center, United States
- Department of Gastroenterology, The University of Texas MD Anderson Cancer Center, United States
- Department of Hospital Medicine, The University of Texas MD Anderson Cancer Center, United States
- Department of Breast Surgical Oncology, The University of Texas MD Anderson Cancer Center, United States
- Oncology Department, Hospital Universitario Puerta de Hierro-Majadahonda, Spain
- Hematology Department, Hospital Universitario Puerta de Hierro-Majadahonda, Spain
- Division of Infectious Diseases, Department of Internal Medicine, Vaccine Bio Research Institute, The Catholic University of Korea, Republic of Korea
- Department of Infectious Diseases and National Centre for Infections in Cancer, Peter MacCallum Cancer Centre, Australia
- Data-Driven Determinants for COVID-19 Oncology Discovery Effort (D3CODE) Team at The University of Texas MD Anderson Cancer Center, United States
Figures
Figure 1
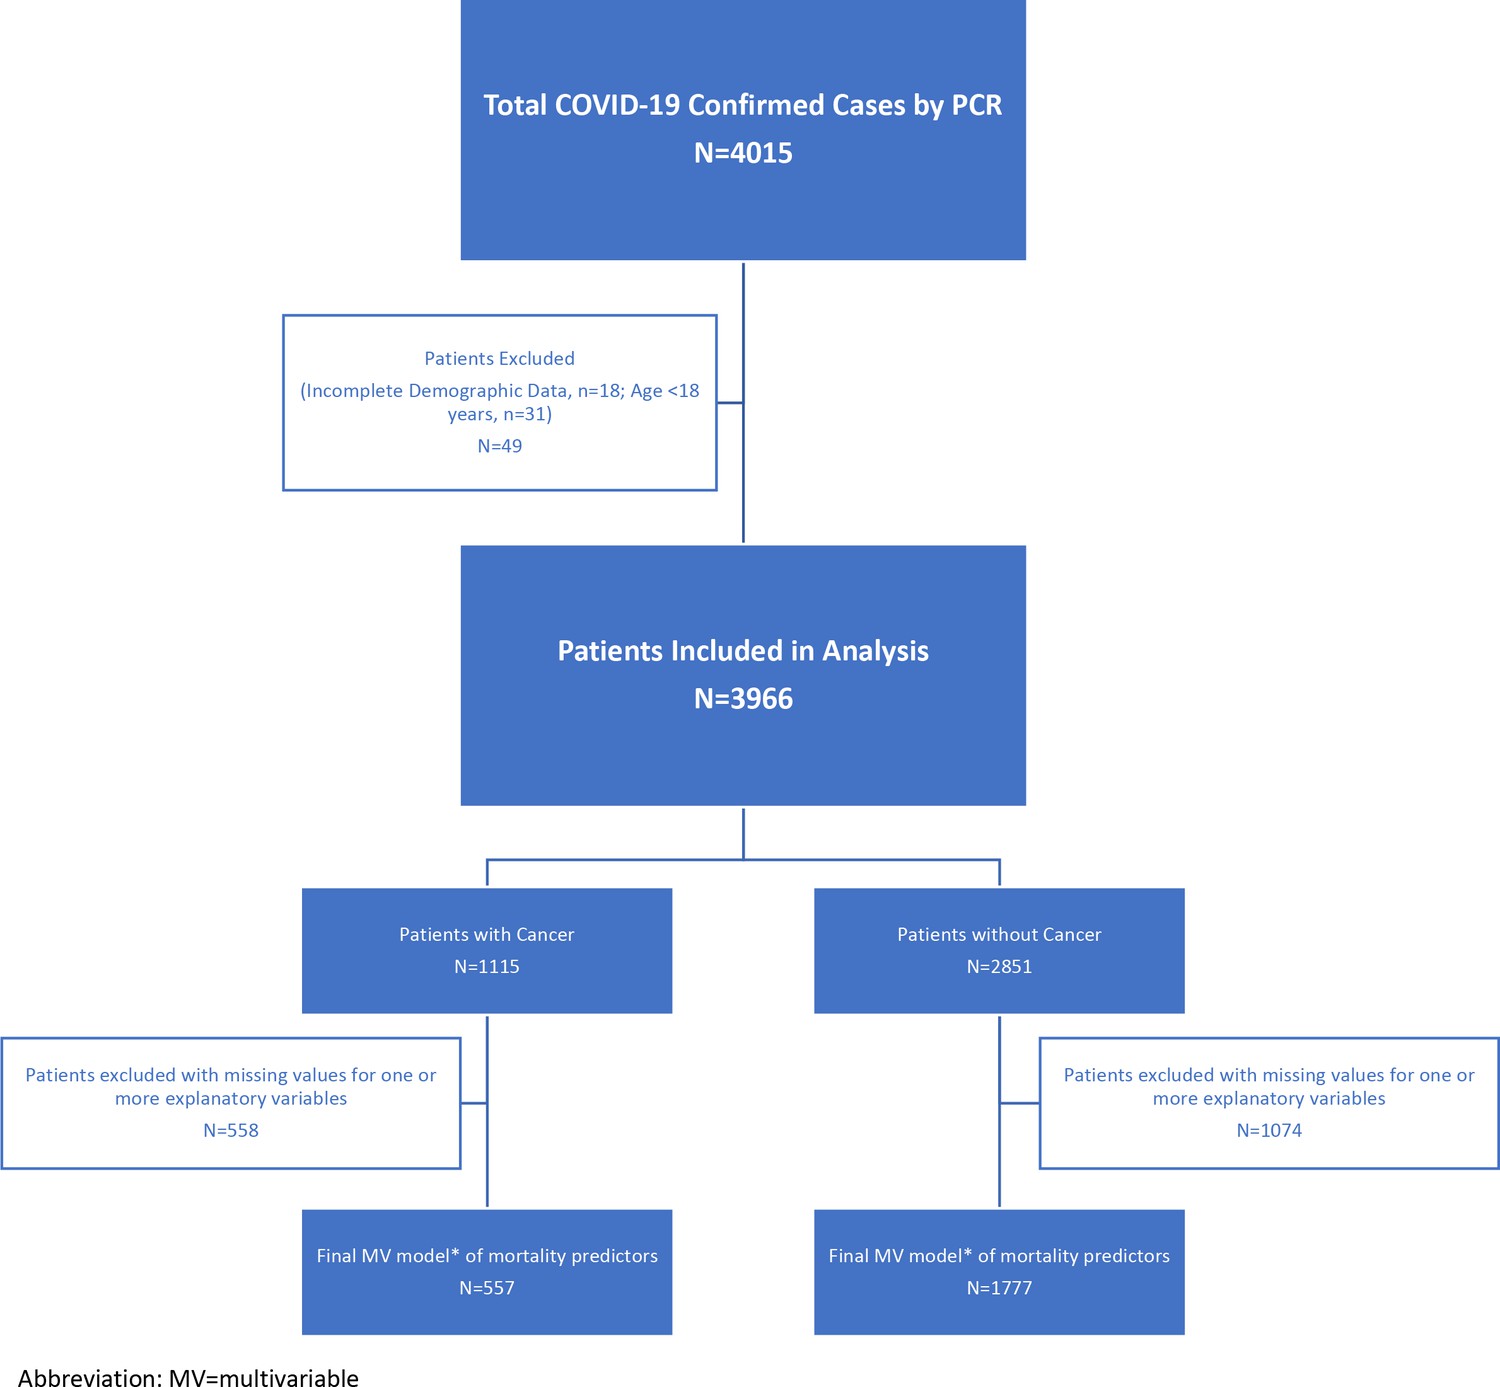
Consort diagram of patient attrition.
Tables
Table 1
Comparing COVID-19 patients with and without cancer.
| Characteristic | Without cancer (n=2851) N (%) | With cancer (n=1115) N (%) | p-value |
|---|---|---|---|
| Demographic and baseline clinical characteristics | |||
| Age (years), median (range) | 50 (18–100) | 61 (18–100) | <0.0001 |
| Sex, male | 1335 (47) | 506 (45) | 0.41 |
| Race/ethnicity | <0.0001 | ||
| White | 720/2674 (27) | 534/916 (58) | |
| Black | 517/2674 (19) | 155/916 (17) | |
| Hispanic | 547/2674 (20) | 178/916 (19) | |
| Asian | 275/2674 (10) | 33/916 (4) | |
| Middle Eastern | 63/2674 (2) | 3/916 (0.3) | |
| Other | 552/2674 (21) | 13/916 (1) | |
| Prior pulmonary disorders | 431/2064 (21) | 275/1017 (27) | <0.001 |
| COPD/bronchiolitis obliterans | 175/2054 (9) | 75 (7) | 0.07 |
| Asthma | 178 (6) | 106 (10) | <0.001 |
| Obstructive sleep apnea | 98/2054 (5) | 89/948 (9) | <0.0001 |
| History of heart failure | 240/2036 (12) | 85/1098 (8) | <0.001 |
| History of ischemic heart disease | 226/2830 (8) | 94/1101 (9) | 0.57 |
| History of hypertension | 1020/2837 (36) | 546/1110 (49) | <0.0001 |
| History of diabetes mellitus | 659/2837 (23) | 299/1104 (27) | 0.01 |
| Current or previous smoker | 348/2055 (17) | 409/1066 (38) | <0.0001 |
| Corticosteroid treatment within 2wk prior to COVID-19 diagnosis | 40/1041 (4) | 189/1097 (17) | <0.0001 |
| Presenting symptoms | 981/1061 (92) | 813/1102 (74) | <0.0001 |
| Cough | 685/1061 (65) | 505/1102 (46) | <0.0001 |
| Fever | 698/1061 (66) | 498/1102 (45) | <0.0001 |
| Shortness of breath | 508/1061 (48) | 387/1102 (35) | <0.0001 |
| Chest pain | 100/1061 (9) | 66/1102 (6) | 0.003 |
| Headache | 133/1061 (13) | 80/1102 (7) | <0.0001 |
| Gastrointestinal symptoms | 148/1061 (14) | 104/1102 (9) | 0.001 |
| Loss of smell | 84/1061 (8) | 58/1102 (5) | 0.013 |
| Loss of taste | 78/1061 (7) | 55/1102 (5) | 0.022 |
| ICU admission | 225/1846 (12) | 141/1100 (13) | 0.62 |
| Abnormal laboratory values | |||
| ANC <0.5K/μl | 2/1434 (0.1) | 30/419 (7) | <0.0001 |
| ALC <0.5K/μl | 487/1537 (32) | 225/463 (49) | <0.0001 |
| Platelet count<100K/μl | 187/1446 (13) | 151/387 (39) | <0.0001 |
| Hemoglobin<10g/dL | 437/1533 (29) | 283/601 (47) | <0.0001 |
| D-dimer, median (range), μg/ml | 1.51 (0.04–735.0) | 1.95 (0.25–93.24) | 0.013 |
| Ferritin, median (range), ng/ml | 823 (1.10–89672) | 1015 (1.5–100001) | <0.0001 |
| Procalcitonin, median (range), ng/ml | 0.21 (0.009–163.5) | 0.25 (0–101.8) | 0.008 |
| IL-6, median (range), pg/ml | 61 (0–5001) | 44 (0–7525) | 0.13 |
| Imaging findings | |||
| New infiltrates | 151/622 (24) | 138/424 (33) | 0.003 |
| Ground-glass opacities | 487/622 (78) | 287/425 (68) | <0.0001 |
| Peripheral distribution of infiltrates | 253/622 (41) | 60/347 (17) | <0.0001 |
| Treatment | |||
| Hydroxychloroquine | 475/2054 (23) | 196/1114 (18) | <0.001 |
| Azithromycin | 972/2054 (47) | 201/1114 (18) | <0.0001 |
| Remdesivir | 338 (12) | 97 (9) | 0.004 |
| Tocilizumab | 75/2054 (4) | 67 (6) | 0.002 |
| Convalescent plasma | 253/2054 (12) | 61/948 (6) | <0.0001 |
| Steroids | 879/2054 (43) | 192/1114 (17) | <0.0001 |
| Others* | 166/2054 (8) | 124/953 (13) | <0.0001 |
| Outcomes | |||
| Co-infection after COVID-19 diagnosis | 158/1994 (8) | 116/1066 (11) | 0.006 |
| Multi-organ failure | 130/1052 (12) | 135/1096 (12) | 0.98 |
| Thrombotic complication | 56/1048 (5) | 48/1072 (5) | 0.36 |
| Discharged on supplemental oxygen among hospitalized | 90/776 (12) | 75/438 (17) | 0.007 |
| patients | |||
| Hospital re-admission within 30 days of COVID-19 diagnosis | <0.0001 | ||
| No | 667/806 (83) | 318/481 (66) | |
| Yes | 60/806 (7) | 63/481 (13) | |
| Stayed in hospital (throughout 30 days) | 79/806 (10) | 100/481 (21) | |
| Death within 30 days of COVID-19 diagnosis | 226 (8) | 122 (11) | 0.003 |
-
Note:*Other treatment included chloroquine, favipiravir, lopinavir-ritonavir, anakina, baricitinib, type 1 interferons, and immunoglobulin.
-
Note: If a variable had missing data then the number of patients evaluable for this variable is added as denominator in its analysis result.
-
COPD = Chronic obstructive pulmonary disease; ANC = Absolute neutrophil count; ALC = Absolute lymphocyte count; IL-1=interleukin 1; IL-6=Interleukin 6; NA = Not applicable.
Table 2
Country-adjusted multivariars of 30 day mortality among all patients.
| Independent predictor | Complete Case (CC) | Multiple imputation (MI) | ||||
|---|---|---|---|---|---|---|
| (N=2349) | (N=3966) | |||||
| aOR | 95%CI | p-value | aOR | 95%CI | p-value | |
| Age ≥65y | 4.47 | (3.27, 6.11) | <0.0001 | 4.73 | (3.54, 6.32) | <0.0001 |
| Prior COPD/bronchiolitis obliterans | 1.95 | (1.33, 2.85) | <0.001 | 1.73 | (1.21, 2.48) | 0.003 |
| History of heart failure | 1.61 | (1.13, 2.28) | 0.008 | 1.64 | (1.17, 2.29) | 0.004 |
| History of hypertension | 1.44 | (1.03, 2.01) | 0.036 | 1.52 | (1.11, 2.07) | 0.008 |
| Cancer | 1.30 | (0.89, 1.90) | 0.18 | 1.23 | (0.87, 1.75) | 0.24 |
| Hypoxia at diagnosis | 4.58 | (2.92, 7.19) | <0.0001 | 5.74 | (3.91, 8.45) | <0.0001 |
| Mechanical ventilation/intubation at diagnosis | 2.20 | (1.23, 3.93) | 0.008 | 2.23 | (1.30, 3.84) | 0.004 |
| ALC at diagnosis <0.5K/µl | 1.86 | (1.30, 2.64) | <0.001 | 1.79 | (1.27, 2.51) | <0.001 |
| Creatinine at diagnosis >1.5mg/dl | 1.68 | (1.21, 2.31) | 0.002 | 1.70 | (1.22, 2.38) | 0.002 |
| Hemoglobin at diagnosis <10g/dl | 1.54 | (1.06, 2.25) | 0.024 | 1.67 | (1.18, 2.38) | 0.004 |
| Coinfection after diagnosis | 1.83 | (1.25, 2.68) | 0.002 | 1.79 | (1.25, 2.56) | 0.001 |
| Remdesivir treatment | 0.64 | (0.42, 0.97) | 0.036 | |||
-
The model was adjusted for country, tocilizumb treatment, and convalescent plasma treatment.
-
The significant difference between the models by CC analysis and by MI analysis was shown in the gray area - remdesivir treatment was an independent predictor of 30 day mortality in the multivariable model by CC analysis but not in the model by MI analysis.
-
COPD=Chronic obstructive pulmonary disease; ALC=Absolute lymphocyte count.
Table 3
Country-adjusted multivariable logistic regression analysis of independent predictors of 30 day mortality among different patients.
| A) Patients with cancer | ||||||
|---|---|---|---|---|---|---|
| Independent predictor | Complete case (CC) | Multiple imputation (MI) | ||||
| (N=557) | (N=1115) | |||||
| aOR | 95%CI | p-value | aOR | 95%CI | p-value | |
| Age ≥65y | 6.64 | (3.51, 12.55) | <0.0001 | 4.22 | (2.51, 7.07) | <0.0001 |
| History of heart failure | 2.29 | (1.19, 4.42) | 0.014 | |||
| Hypoxia at diagnosis | 2.52 | (1.18, 5.35) | 0.017 | 2.46 | (1.17, 5.17) | 0.017 |
| Non-invasive ventilation at diagnosis | 2.13 | (1.01, 4.53) | 0.049 | 2.67 | (1.28, 5.57) | 0.009 |
| ALC at diagnosis <0.5K/µl | 2.10 | (1.16, 3.79) | 0.014 | 1.98 | (1.14, 3.45) | 0.017 |
| Hemoglobin at diagnosis <10g/dl | 2.40 | (1.30, 4.44) | 0.005 | 1.74 | (0.98, 3.08) | 0.056 |
| Platelet at diagnosis <100K/µl | 2.21 | (1.15, 4.24) | 0.017 | |||
| LRTI at diagnosis or progression to LRTI | 3.70 | (1.94, 7.08) | <.0001 | 4.16 | (1.95, 8.82) | <0.001 |
| Remdesivir treatment | 0.44 | (0.20, 0.96) | 0.04 | 0.45 | (0.21, 0.98) | 0.04 |
| B) Patients without cancer | ||||||
| Independent predictor | Complete Case (CC) | Multiple Imputation (MI) | ||||
| (N=1777) | (N=2851) | |||||
| aOR | 95%CI | p-value | aOR | 95%CI | p-value | |
| Age ≥65y | 4.91 | (3.39, 7.13) | <.0001 | 4.96 | (3.46, 7.10) | <0.0001 |
| Prior COPD/bronchiolitis obliterans | 1.81 | (1.16, 2.83) | 0.009 | 1.84 | (1.19, 2.84) | 0.006 |
| History of ishemic heart disease | 1.68 | (1.10, 2.56) | 0.017 | 1.69 | (1.12, 2.56) | 0.013 |
| History of hypertension | 1.98 | (1.30, 3.03) | 0.002 | 2.15 | (1.42, 3.24) | <0.001 |
| Hypoxia at diagnosis | 7.53 | (3.72, 15.26) | <0.0001 | 7.91 | (4.22, 14.86) | <0.0001 |
| Mechanical ventilation/intubation | 2.38 | (1.22, 4.62) | 0.011 | 2.15 | (1.13, 4.08) | 0.019 |
| At diagnosis | ||||||
| ALC at diagnosis <0.5K/µl | 1.62 | (1.01, 2.59) | 0.044 | |||
| Creatinine at diagnosis >1.5mg/dL | 1.96 | (1.35, 2.84) | <0.001 | 1.95 | (1.32, 2.87) | <0.001 |
| Coinfection after diagnosis | 3.03 | (1.87, 4.89) | <0.0001 | 2.83 | (1.79, 4.48) | <0.0001 |
-
ALC=Absolute lymphocyte count; LRTI=Lower respiratory tract infection; COPD=Chronic obstructive pulmonary disease.
-
The model was adjusted for country and tocilizumb treatment.
-
The significant differences between the models by CC analysis and by MI analysis were shown in the gray area - (a) History of heart failure and platelet level at diagnosis were independent predictors of 30 day mortality in the multivariable model by MI analysis, but not in the model by CC analysis; (b) Hemoglobin level at diagnosis was an independent predictor of 30 day mortality in the multivariable model by CC analysis, but not in the model by MI analysis.
-
Hemoglobin level at diagnosis was kept in the final model by MI analysis due to its confounding effect despite its non-significant p-value.
-
The model was adjusted for country and convalescent plasma treatment.
-
The significant difference between the models by CC analysis and by MI analysis was shown in the gray area - ALC level at diagnosis was an independent predictor of 30 day mortality in the multivariable model by MI analysis, but not in the model by CC analysis.
Table 4
30 day mortality among different groups of COVID-19 patients with cancer.
| Patient group | No. of patients | No. (%) who died within 30 days† | ||
|---|---|---|---|---|
| Hematological malignancy | 283 | 37 (13) | ||
| Transplant within 1y of COVID-19 diagnosis | 15 | 2 (13) | ||
| Lymphoma or myeloma | 164 | 19 (12) | ||
| Lymphocytic leukemia (ALL/CLL) | 44 | 6 (14) | ||
| Myelocytic leukemia | 62 | 8 (13) | ||
| Solid tumor* | 632 | 47 (7) | ||
| Lung cancer | 64 | 14 (22) | ||
| Metastatic non-lung cancer solid tumor | 261 | 17 (7) | ||
| Non-metastatic non-lung cancer solid tumor | 307 | 16 (5) | ||
-
*
Patients with missing metastasis data were excluded from the analysis.
-
†
30 day mortality comparisons for the groups below. (1) Lung cancer vs metastatic non-lung cancer solid tumor: p< 0.001; (2) Lung cancer vs non-metastatic non-lung cancer solid tumor: p< 0.0001; (3) Hematological malignancy vs lung cancer: p=0.07; (4) Hematological malignancy vs non-lung cancer solid tumor: p< 0.001; (5) None of the above significant differences detected remained significant in multivariable analysis of 30 d mortality in cancer patients.
Additional files
-
Supplementary file 1
Comparing mortality in patients treated with remdesivir alone or with steroids for COVID-19.
- https://cdn.elifesciences.org/articles/81127/elife-81127-supp1-v2.docx
-
Supplementary file 2
Timing of administration of corticosteroids as COVID-19 treatment and 30 d mortality.
- https://cdn.elifesciences.org/articles/81127/elife-81127-supp2-v2.docx
-
MDAR checklist
- https://cdn.elifesciences.org/articles/81127/elife-81127-mdarchecklist1-v2.docx
Download links
A two-part list of links to download the article, or parts of the article, in various formats.
Downloads (link to download the article as PDF)
Open citations (links to open the citations from this article in various online reference manager services)
Cite this article (links to download the citations from this article in formats compatible with various reference manager tools)
International multicenter study comparing COVID-19 in patients with cancer to patients without cancer: Impact of risk factors and treatment modalities on survivorship
eLife 12:e81127.
https://doi.org/10.7554/eLife.81127


