The wtf meiotic driver gene family has unexpectedly persisted for over 100 million years
- Stowers Institute for Medical Research, United States
- Open University, United Kingdom
- PTN Joint Graduate Program, School of Life Sciences, Tsinghua University, China
- National Institute of Biological Sciences, Beijing, China
- Department of Molecular and Integrative Physiology, University of Kansas Medical Center, United States
- Tsinghua Institute of Multidisciplinary Biomedical Research, Tsinghua University, China
Figures
Figure 1 with 1 supplement

wtf homologs are found outside of Schizosaccharomyces pombe.
(A) Model for meiotic drive of wtf genes in S. pombe, modified from Nuckolls et al., 2017. All spores are exposed to the poison protein, but those that inherit the wtf driver are rescued by the antidote protein. (B) Schematic phylogeny of Schizosaccharomyces species based on published reports (Brysch-Herzberg et al., 2019; Rhind et al., 2011). Our analyses of percent identity between orthologs (Supplementary file 1a) agree with this tree topology. MYA represents million years ago. Annotations of all the identified S. osmophilus genes can be found in Figure 1—source data 2. To the right of the phylogeny, we list the numbers of wtf homologs found by position-specific iterated-basic local alignment search tool (PSI-BLAST) and BLASTn searches. *The S. osmophilus genome is not fully assembled, so the number represents the wtf homologs found within the assembled contigs.
-
Figure 1—source data 1
Schizosaccharomyces osmophilus genome assembly.
Fasta file containing the partial genome assembly of S. osmophilus from this study.
- https://cdn.elifesciences.org/articles/81149/elife-81149-fig1-data1-v1.zip
-
Figure 1—source data 2
Predicted Schizosaccharomyces osmophilus gene annotations.
We used the Augustus program (Stanke et al., 2006) to predict S. osmophilus gene annotations using a model based on S. octosporus genes. Augustus generated a GFF file with all the predicted genes.
- https://cdn.elifesciences.org/articles/81149/elife-81149-fig1-data2-v1.zip
-
Figure 1—source data 3
Orthologous genes in Schizosaccharomyces.
A list of orthologous gene sets within Schizosaccharomyces generated by Orthovenn 2 (Xu et al., 2019), and each comparison between orthologs was assessed by basic local alignment search tool (Altschul et al., 1990). The columns display in order query species, query gene, subject species, subject gene, percentage of identity, and length of the query.
- https://cdn.elifesciences.org/articles/81149/elife-81149-fig1-data3-v1.txt
-
Figure 1—source data 4
Schizosaccharomyces octosporus genome annotation.
GFF file of S. octosporus genome.
- https://cdn.elifesciences.org/articles/81149/elife-81149-fig1-data4-v1.zip
-
Figure 1—source data 5
Schizosaccharomyces osmophilus genome annotation.
GFF file of S. osmophilus genome.
- https://cdn.elifesciences.org/articles/81149/elife-81149-fig1-data5-v1.zip
-
Figure 1—source data 6
Schizosaccharomyces cryophilus genome annotation.
GFF file of S. cryophilus genome.
- https://cdn.elifesciences.org/articles/81149/elife-81149-fig1-data6-v1.zip
Figure 1—figure supplement 1
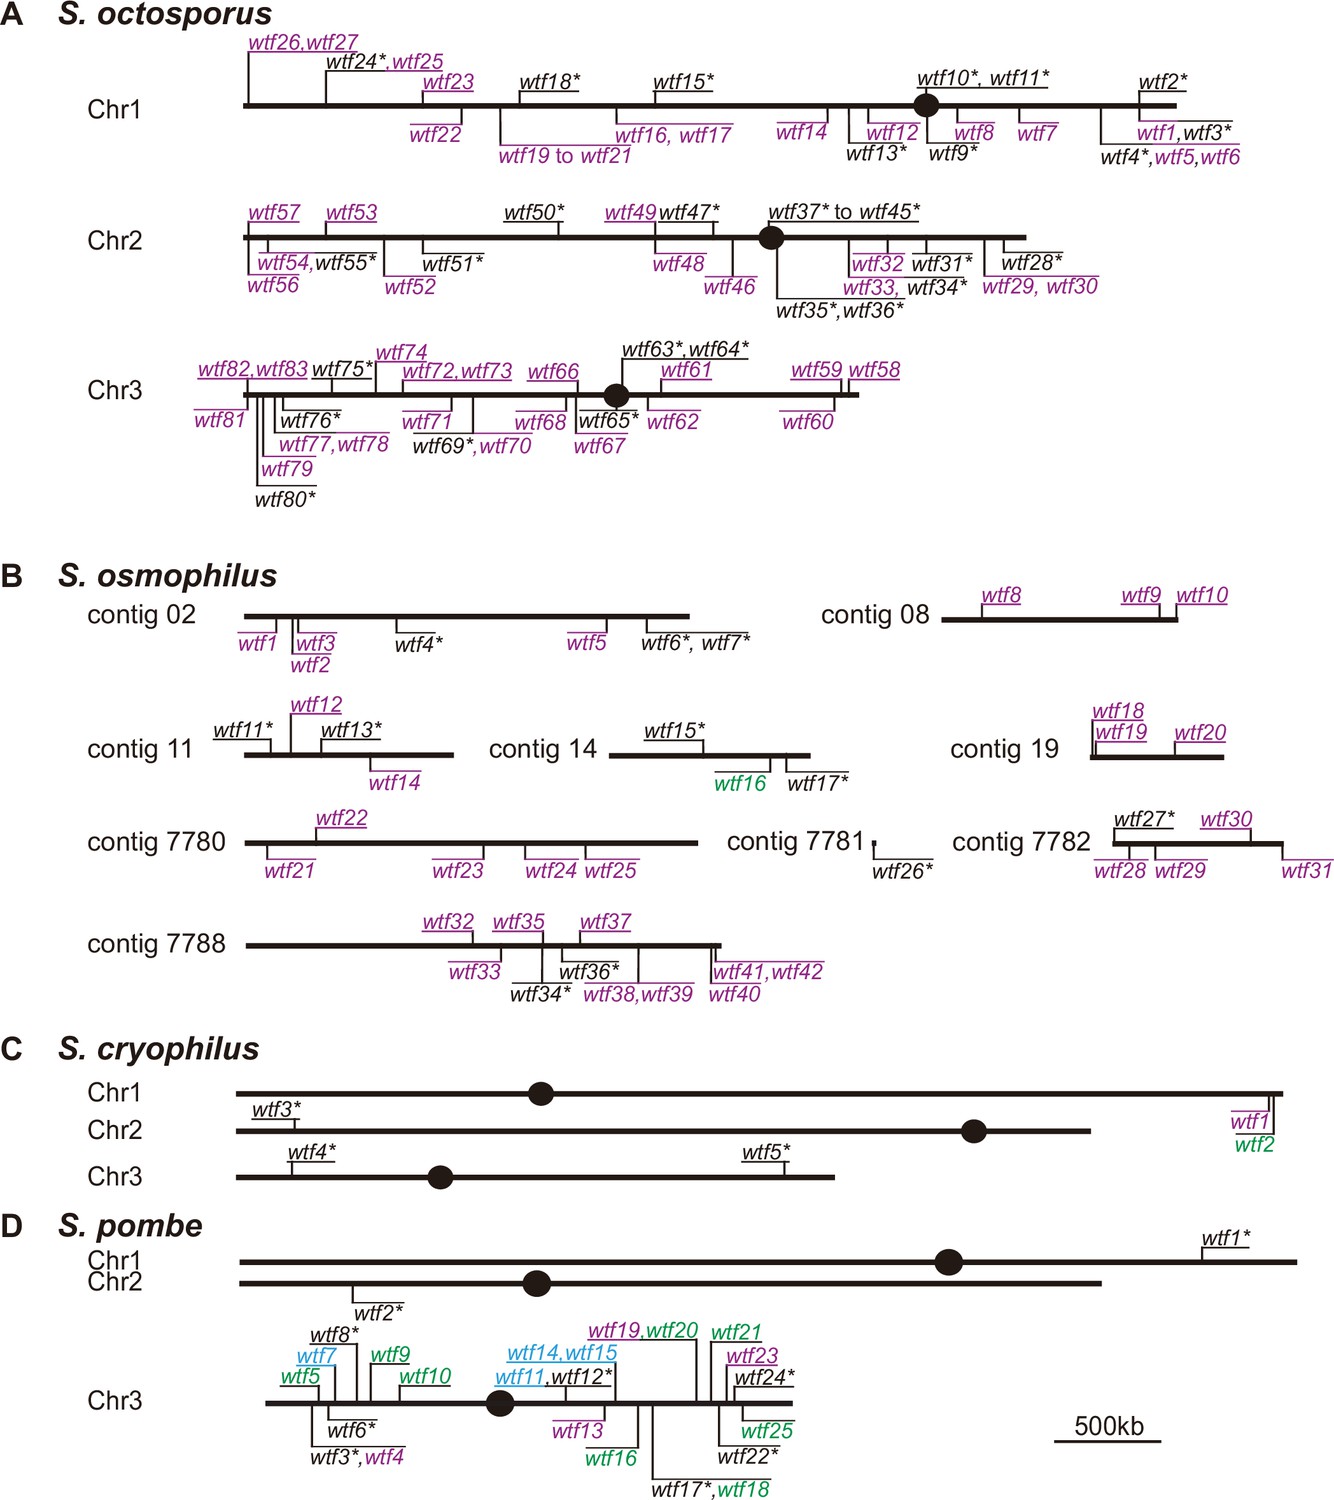
Maps of the wtf gene family members in Schizosaccharomyces octosporus, S. osmophilus, S. cryophilus, and S. pombe.
Genome maps of wtf genes from (A) S. octosporus, (B) S. osmophilus, (C) S. cryophilus, and (D) S. pombe. Genes on the forward strand are shown above each chromosome, whereas genes on the reverse strand are shown below chromosomes. Genes that contain an alternate translational start site near the beginning of exon 2 are shown in purple. Such an alternate translational start site is used to encode Wtfpoison proteins in S. pombe wtf drivers. Genes that lack the potential alternate start site are shown in green. Genes lacking the alternate translational start site in S. pombe can encode Wtfantidote proteins and act as suppressors of drive. Predicted pseudogenes are indicated with an asterisk (*). The four S. pombe wtf genes with unknown functions are shown in light blue. The S. pombe map is modified from Eickbush et al., 2019. Annotations of the novel wtf genes can be found in Supplementary file 1b-1d.
Figure 2 with 3 supplements
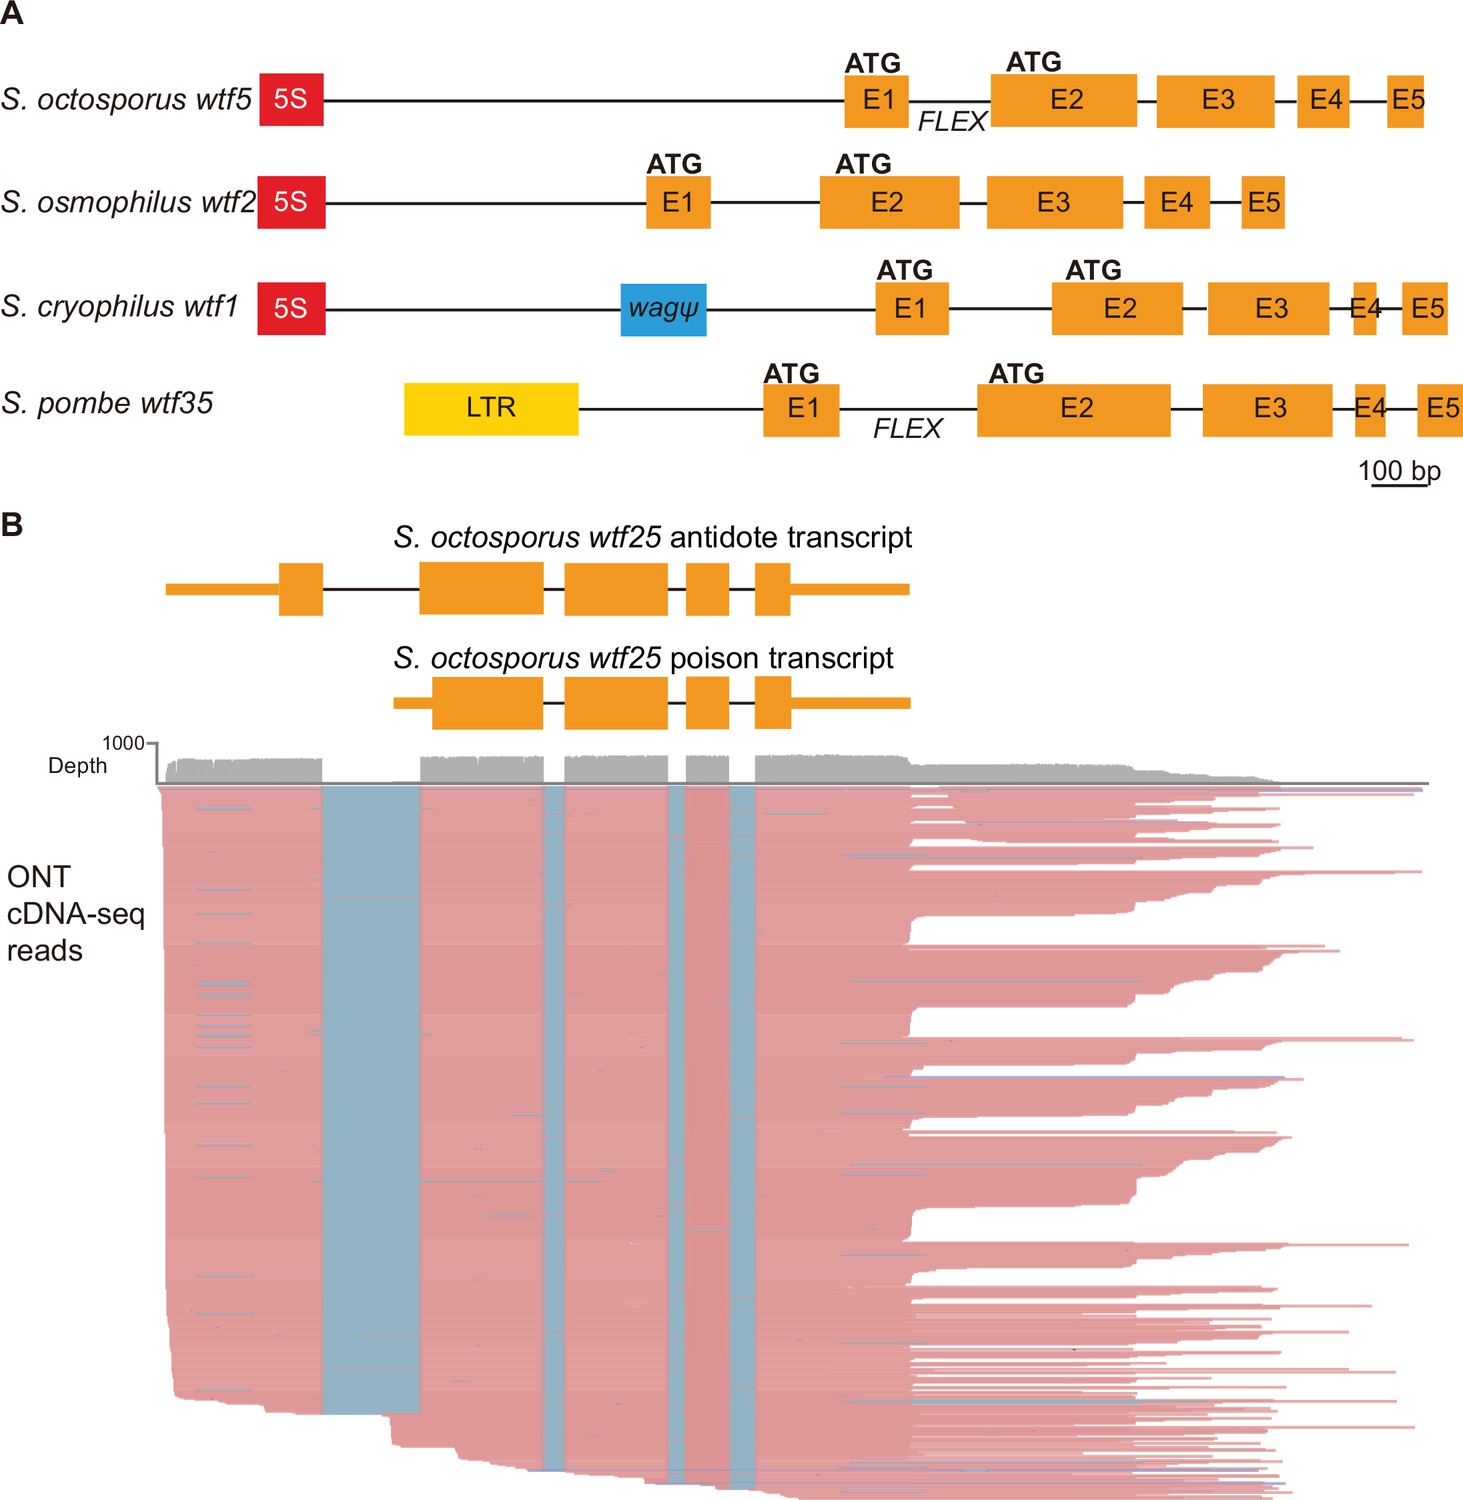
Schizosaccharomyces pombe wtf genes share features with other wtf genes outside of S. pombe.
(A) Schematic wtf loci of the Schizosaccharomyces species. Orange boxes correspond to exons (E1 indicates exon 1, E2 indicates exon 2, etc.), the red boxes represent 5S rDNA genes, the blue box represents a pseudogenized wag gene, and the yellow box is a long terminal repeat (LTR) from a Tf transposon. The predicted translational start sites for the antidote (ATG in exon 1) and poison (ATG in exon 2) proteins are indicated, as is the FLEX transcriptional regulatory motif (Supplementary file 1b-d). (B) Long-read RNA sequencing of mRNAs from meiotic S. octosporus cells revealed two main transcript isoforms of the wtf25 gene, presumably encoding an antidote and a poison protein, respectively. cDNA reads obtained using the Oxford Nanopore Technologies (ONT) platform are shown in pink. Blue lines indicate sequences missing in the reads due to splicing. The diagram at the top depicts the two main transcript isoforms. The 3' transcript ends shown in the diagram correspond to the major transcript end revealed by cDNA reads.
-
Figure 2—source data 1
wtf genes share similar exon and intron sizes.
Table of the average size (in base pairs) of the exons and introns of intact wtf genes in all Schizosaccharomyces species. For S.chizosaccharomyces pombe, only the genes containing 5 exons were considered.
- https://cdn.elifesciences.org/articles/81149/elife-81149-fig2-data1-v1.xlsx
Figure 2—figure supplement 1
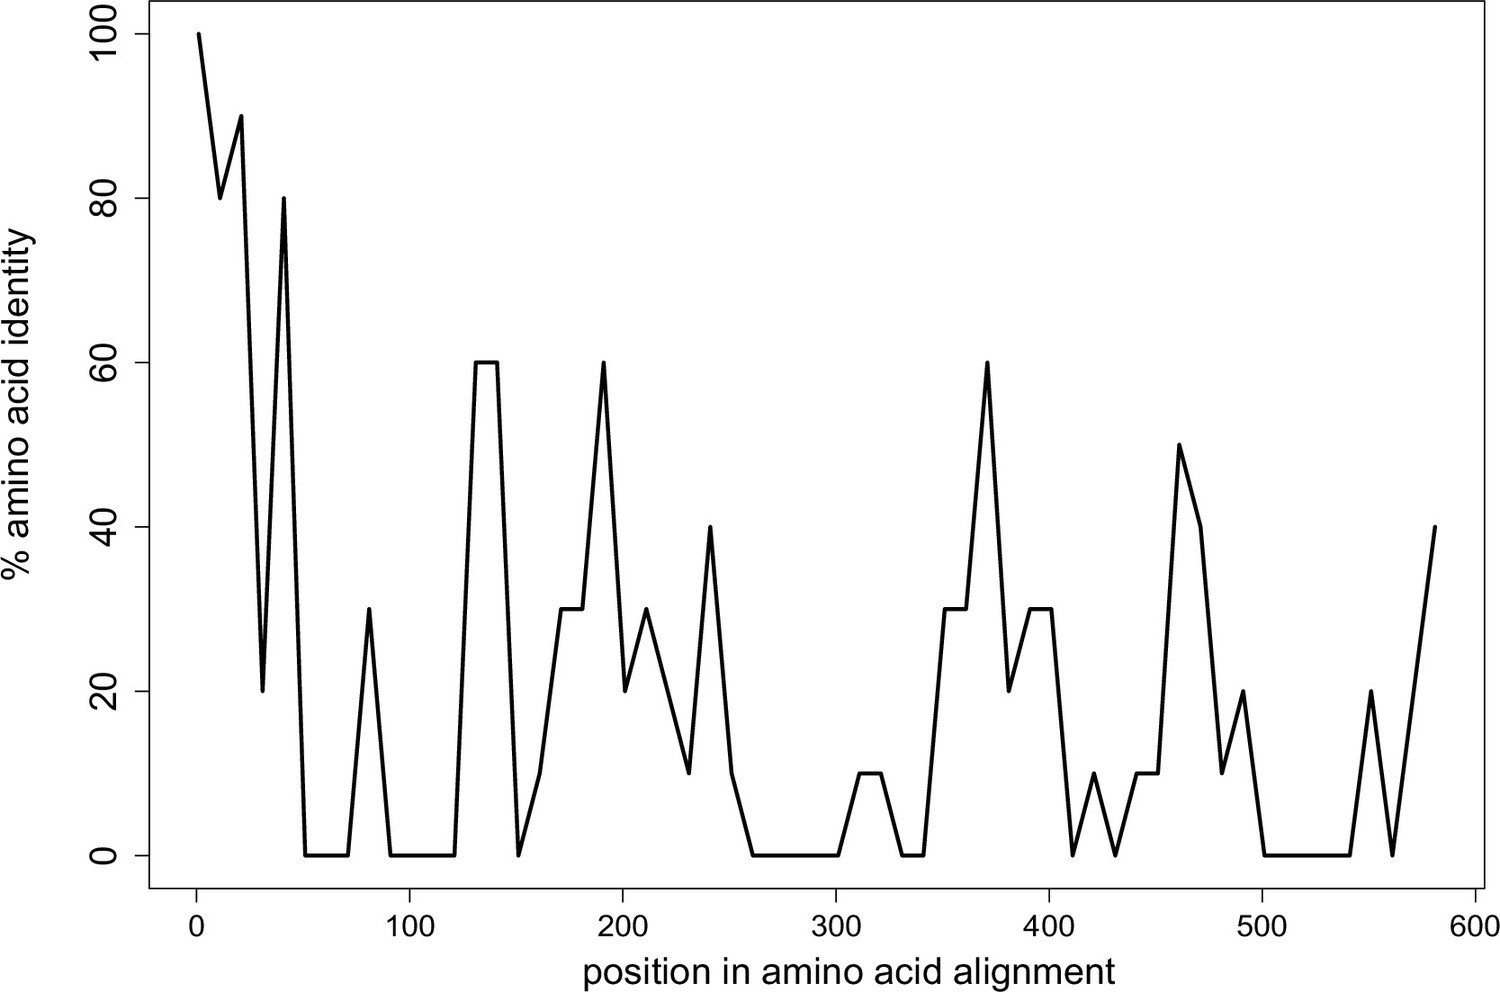
Limited conservation of Wtf proteins.
The percent identity shared among all 113 Wtf predicted antidote proteins from Schizosaccharomyces octosporus, S. osmophilus, S. cryophilus, and S. pombe (isolate FY29033) aligned with MAFFT (L-INS-I; BLOSSUM62 scoring matrix/k=2; Gap open penalty of 2; offset of 0.123; Katoh et al., 2002; Katoh and Standley, 2013). Note that the antidote protein sequences are the same as the poison protein sequences except the antidotes contain an additional ~35–45 amino acids at the N terminus encoded by exon 1, which is not found in the poison proteins. The plot shows highest conservation at the N terminal sequences, which are found only in the antidote proteins. Pseudogenes were excluded from the analyses. The data are shown in 10 amino acid sliding windows. The alignment can be found in Figure 2—figure supplement 1—source data 1.
-
Figure 2—figure supplement 1—source data 1
Multi-alignment of all 113 Wtf predicted antidote proteins of Schizosaccharomyces octosporus, S. osmophilus, S. cryophilus, and S. pombe.
Alignment of 113 predicted antidotes Wtf proteins made using MAFFT (Katoh et al., 2002; Katoh and Standley, 2013). This alignment was used to generate Figure 2—figure supplement 1.
- https://cdn.elifesciences.org/articles/81149/elife-81149-fig2-figsupp1-data1-v1.zip
Figure 2—figure supplement 2
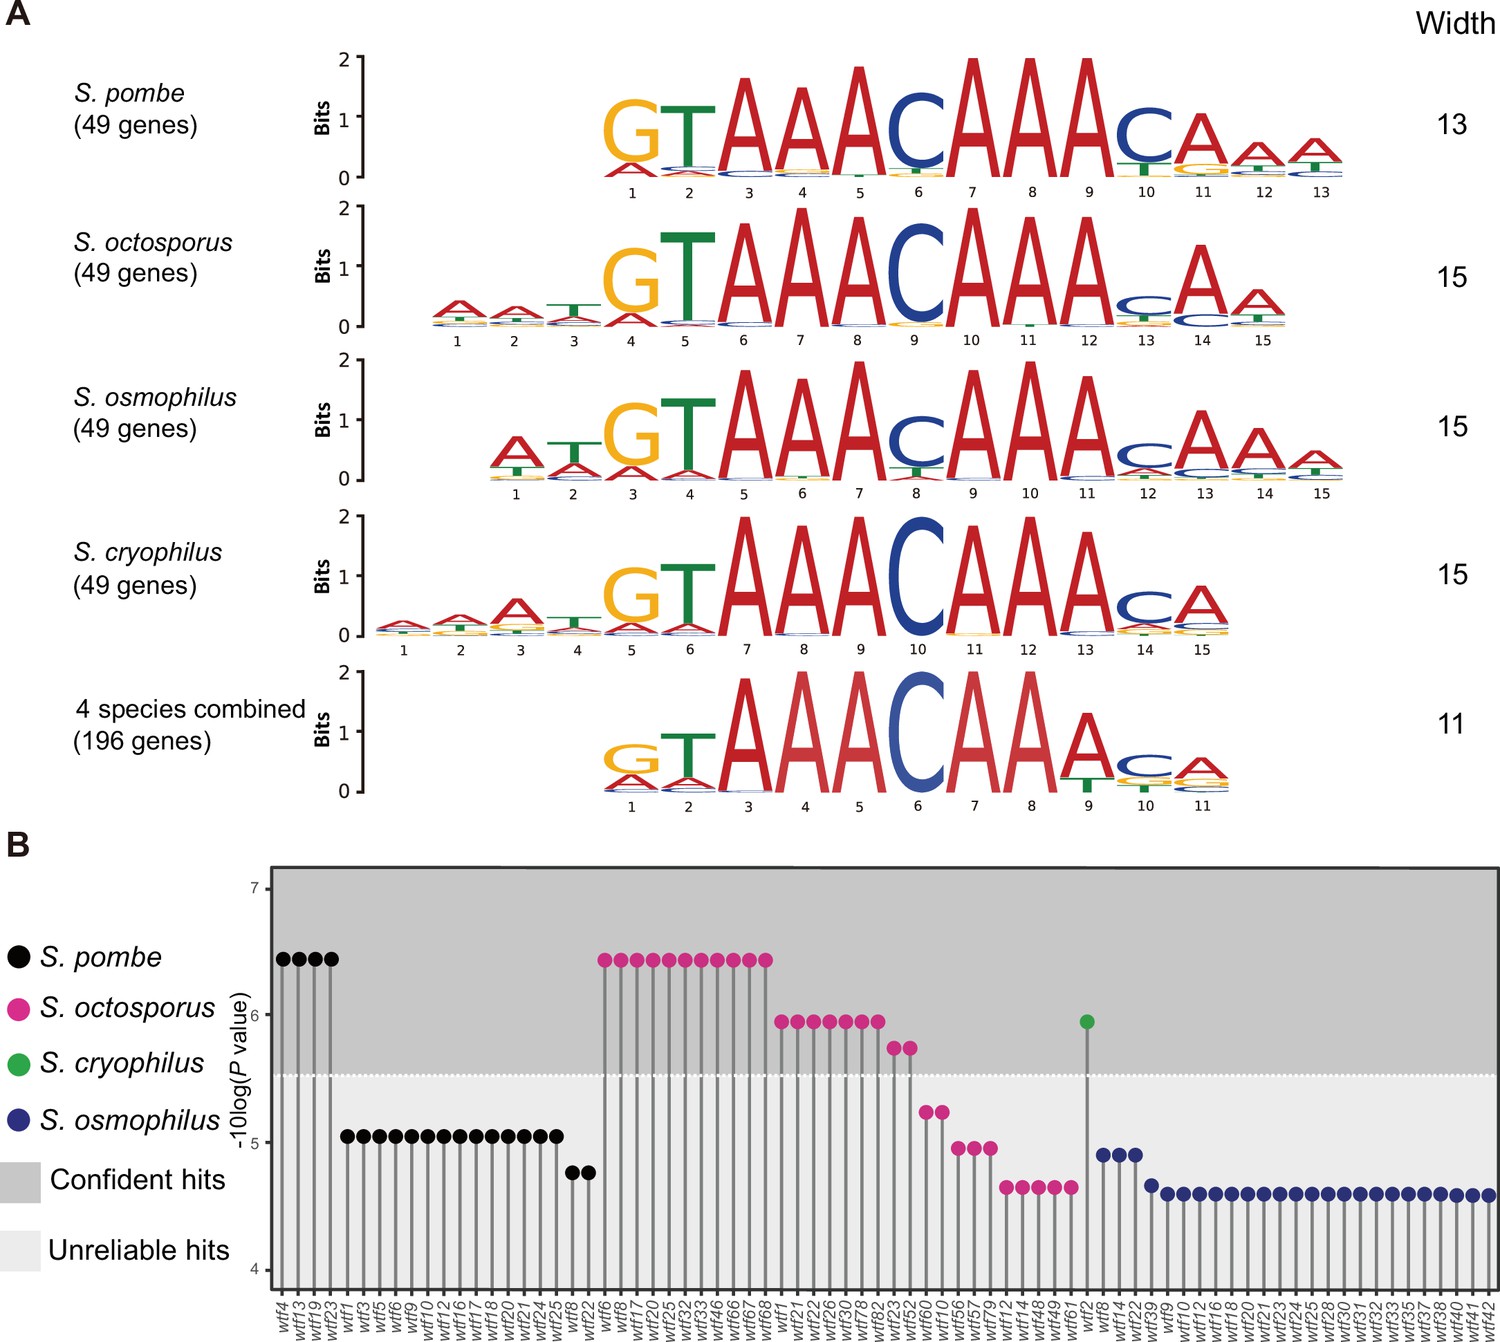
Many wtf genes in Schizosaccharomyces octosporus harbor the FLEX motif in intron 1.
(A) The FLEX motif identified by the de novo motif discovery tool multiple em for motif elicitation (MEME). A total of 49 Mei4 target genes in S. pombe and their orthologs in S. octosporus, S. osmophilus, and S. cryophilus were used as input for MEME. MEME analyses were conducted for each species separately and for all species combined. (B) wtf genes containing the FLEX motif in intron 1. The motif scanning tool find individual motif occurrence (FIMO) was used to find the FLEX motif in the genomes of S. pombe, S. octosporus, S. cryophilus, and S. osmophilus. The 11-bp FLEX motif identified by the MEME analysis using 146 genes as input was provided to FIMO for motif scanning. All wtf genes containing a FIMO hit in intron 1 are shown with the p-value of the FIMO hit in intron 1 presented on a –log10 scale. We found the default p-value cutoff of FIMO (1E-4) being too permissive and applied a cutoff of 3E-6 to distinguish confident hits from unreliable hits.
Figure 2—figure supplement 3
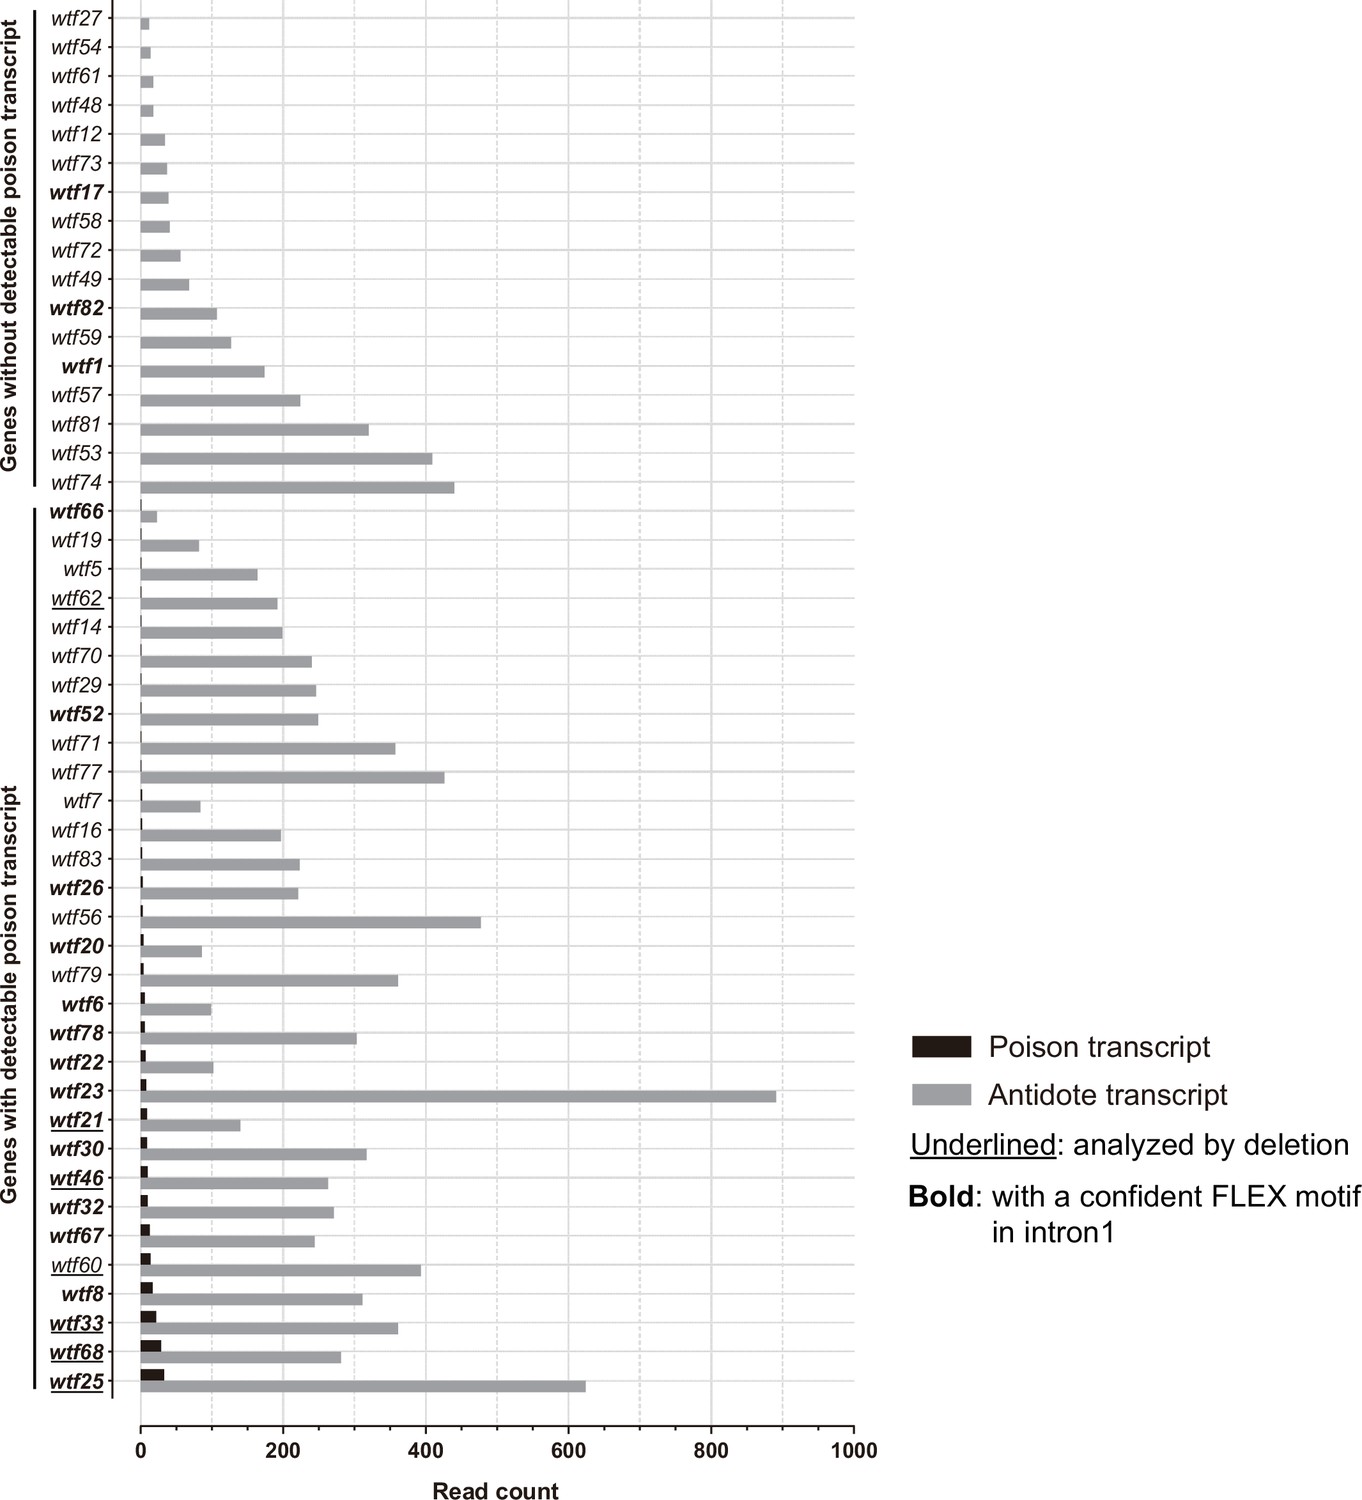
Transcription levels of predicted poison and antidote isoforms of intact wtf genes in Schizosaccharomyces octosporus.
Long-read (Oxford Nanopore) RNA sequencing was performed on mRNAs isolated from S. octosporus cells undergoing meiosis. All intact wtf genes are shown with the read count of the long transcript (encoding putative antidote) in gray and the read count of the short transcript (encoding putative poison) in black. The bold gene names indicate the genes with a confident FLEX motif hit in intron 1. The underlined gene names indicate the genes analyzed by deletion (Figure 8). The read counts of the two isoforms can be found in Supplementary file 1b.
Figure 3 with 6 supplements
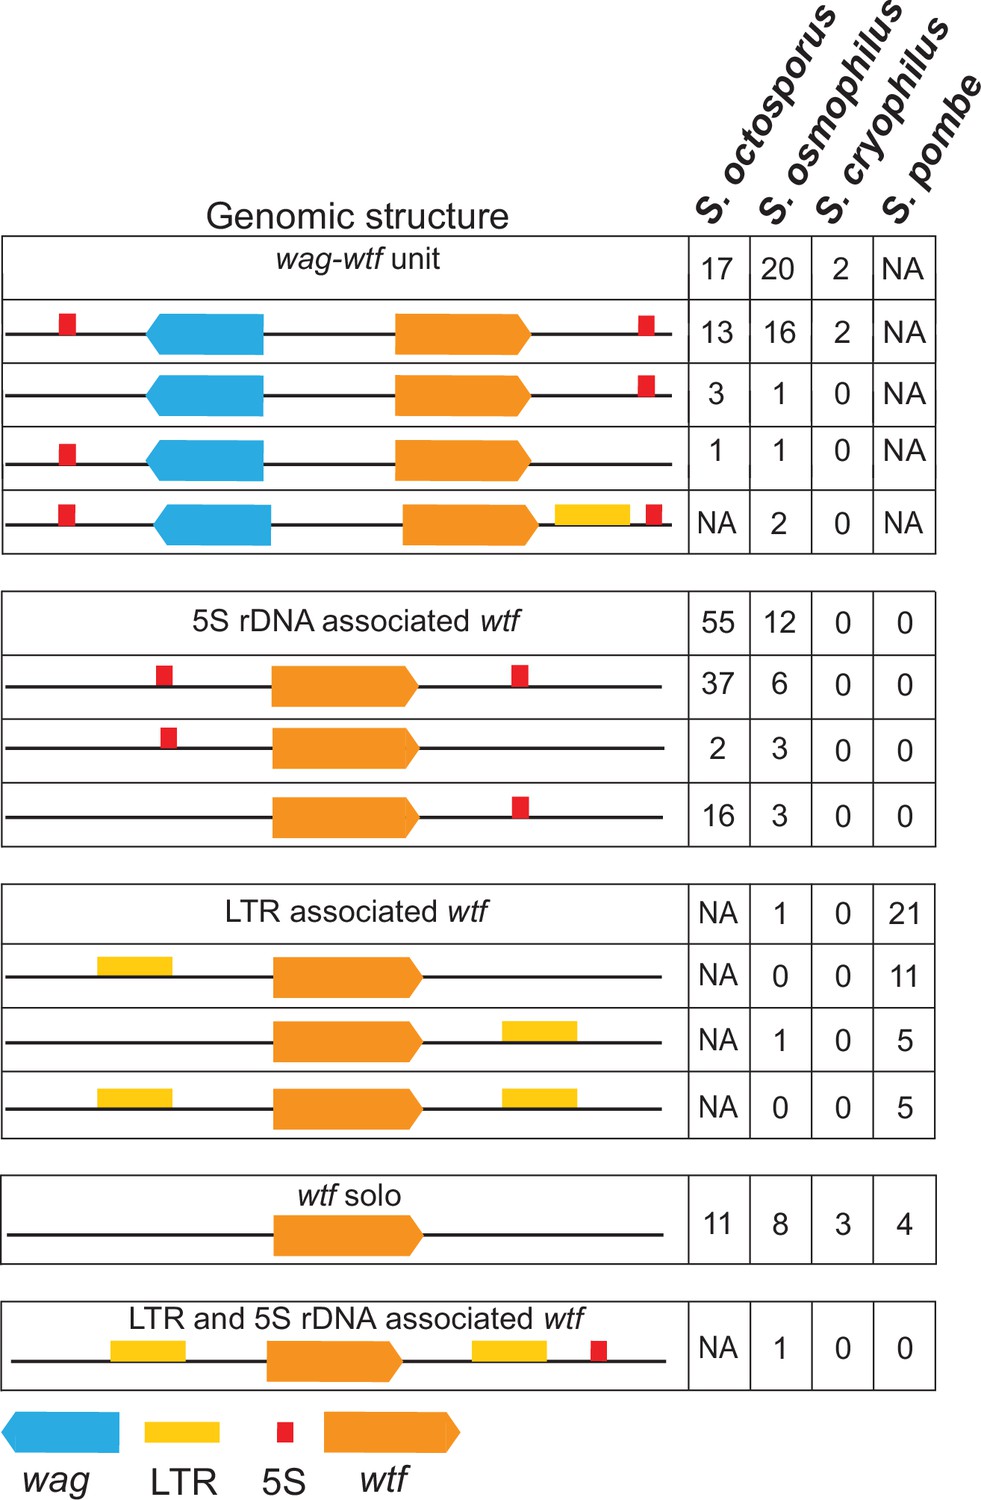
Genomic context of wtf genes.
The wtf genes are found in a limited number of genomic contexts. The wtf genes are represented as orange boxes, wag genes are in blue, and long terminal repeats (LTRs) are in yellow. NA indicates not applicable as wag genes are absent from Schizosaccharomyces pombe, and LTRs are absent from S. octosporus.
Figure 3—figure supplement 1
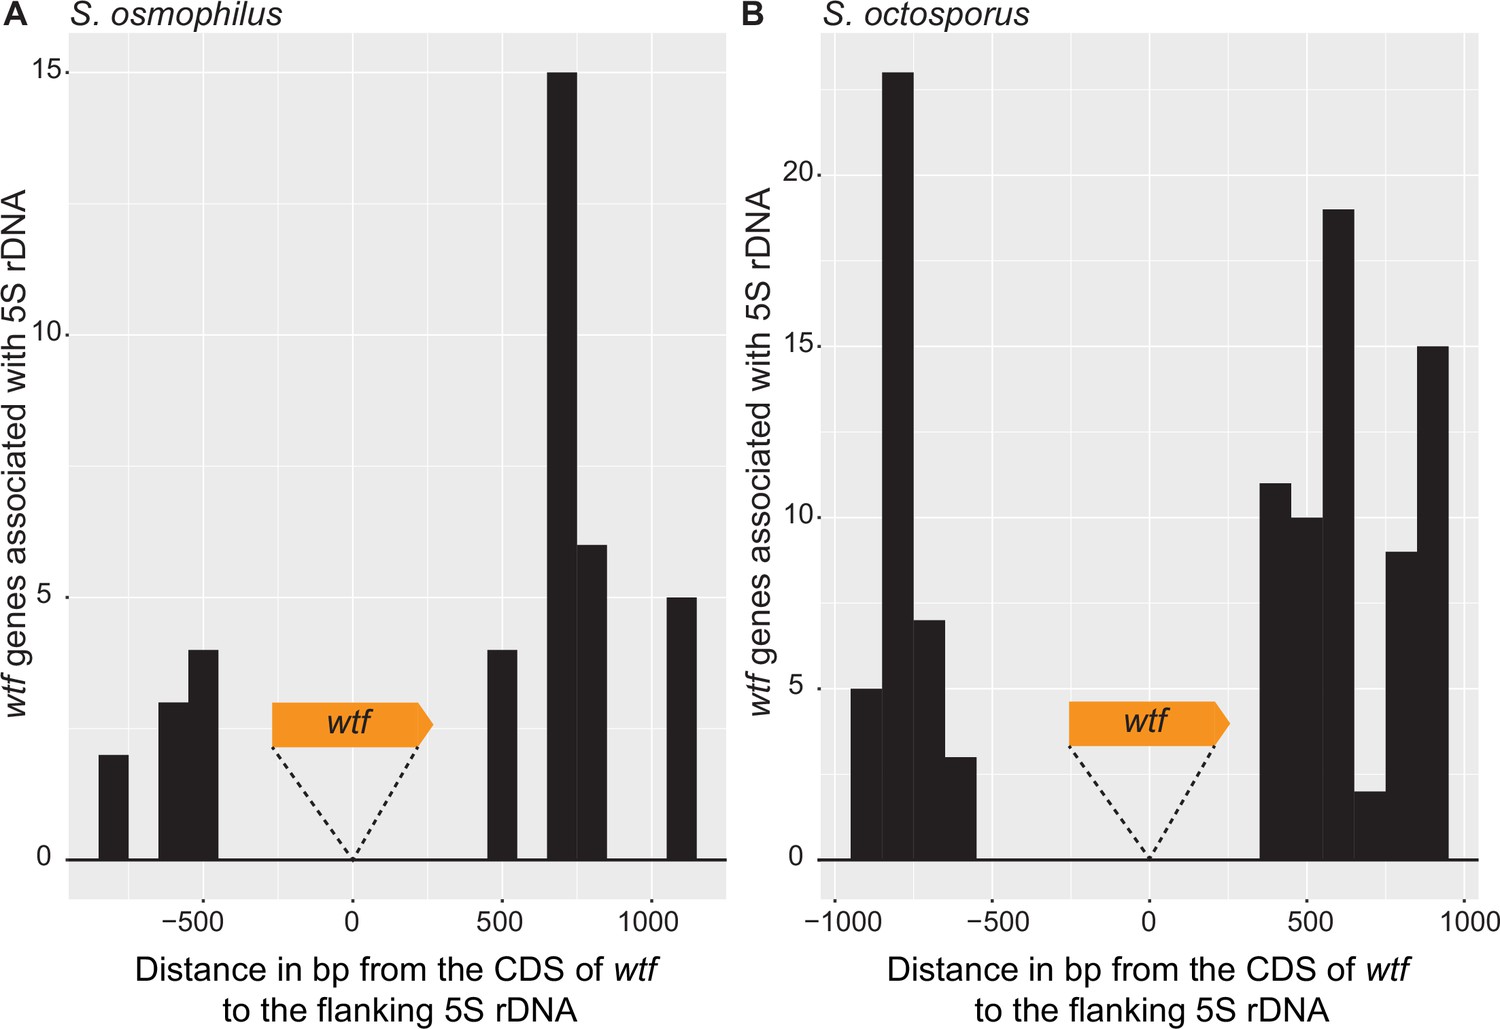
Distance between 5S rDNA and wtf genes.
The distance in base pairs between 5S rDNA and the coding sequence of a wtf gene in (A) Schizosaccharomyces osmophilus and (B) S. octosporus. Only wtf genes with a flanking 5S rDNA were considered. The wtf gene is collapsed at 0, and the flanking sequences were considered in 100 base pair bins.
Figure 3—figure supplement 2
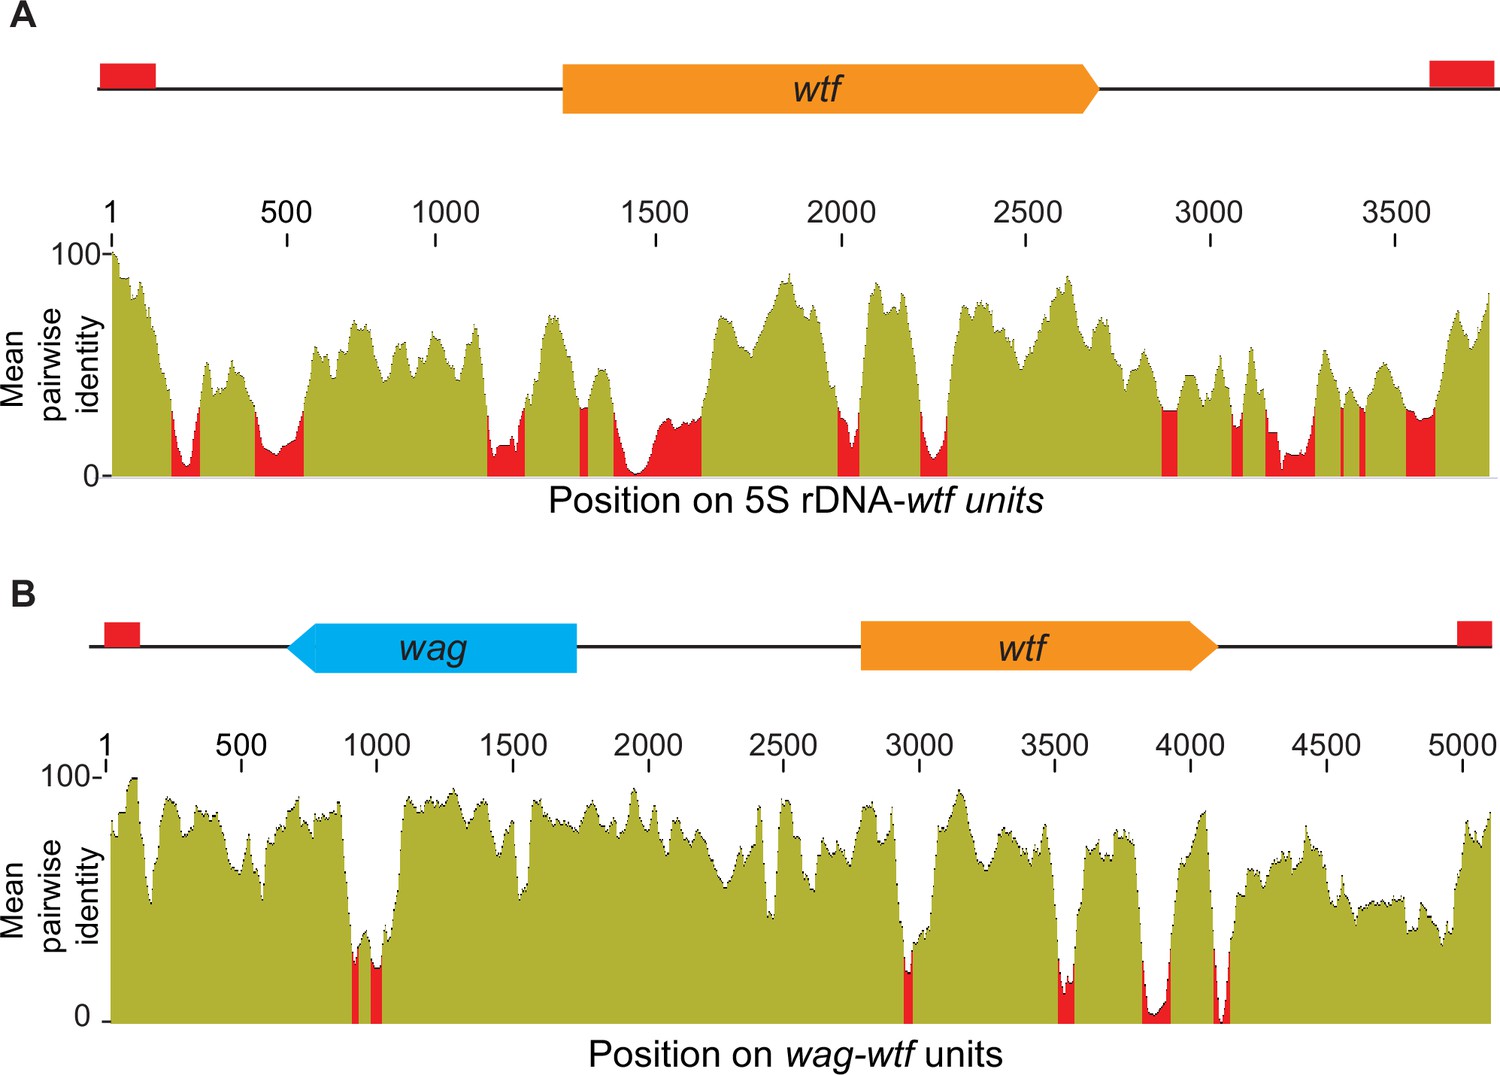
Homology between distinct 5S rDNA-wtf and wag-wtf units.
The regions containing wtf genes with the indicated genomic contexts were aligned with MAFFT to find the percent sequences identity (Katoh et al., 2002; Katoh and Standley, 2013). The percent identity is shown in 50 base pair sliding windows. (A) The percent identity shared among 37 wtf-5S rDNA units from Schizosaccharomyces octosporus. (B) The percent identity shared among 17 wtf-wag units from S. octosporus.
-
Figure 3—figure supplement 2—source data 1
Multi-alignment of 37 Schizosaccharomyces octosporus 5S rDNA-wtf units.
DNA MAFFT alignment of 37 5S rDNA-wtf-5S rDNA unit of S. octosporus used to make Figure 3—figure supplement 2A.
- https://cdn.elifesciences.org/articles/81149/elife-81149-fig3-figsupp2-data1-v1.zip
-
Figure 3—figure supplement 2—source data 2
Multi-alignment of 17 Schizosaccharomyces octosporus wtf-wag units.
Multi-DNA alignment using MAFFT of 17 wtf-wag units from S. octosporus used to make Figure 3—figure supplement 2B.
- https://cdn.elifesciences.org/articles/81149/elife-81149-fig3-figsupp2-data2-v1.zip
Figure 3—figure supplement 3
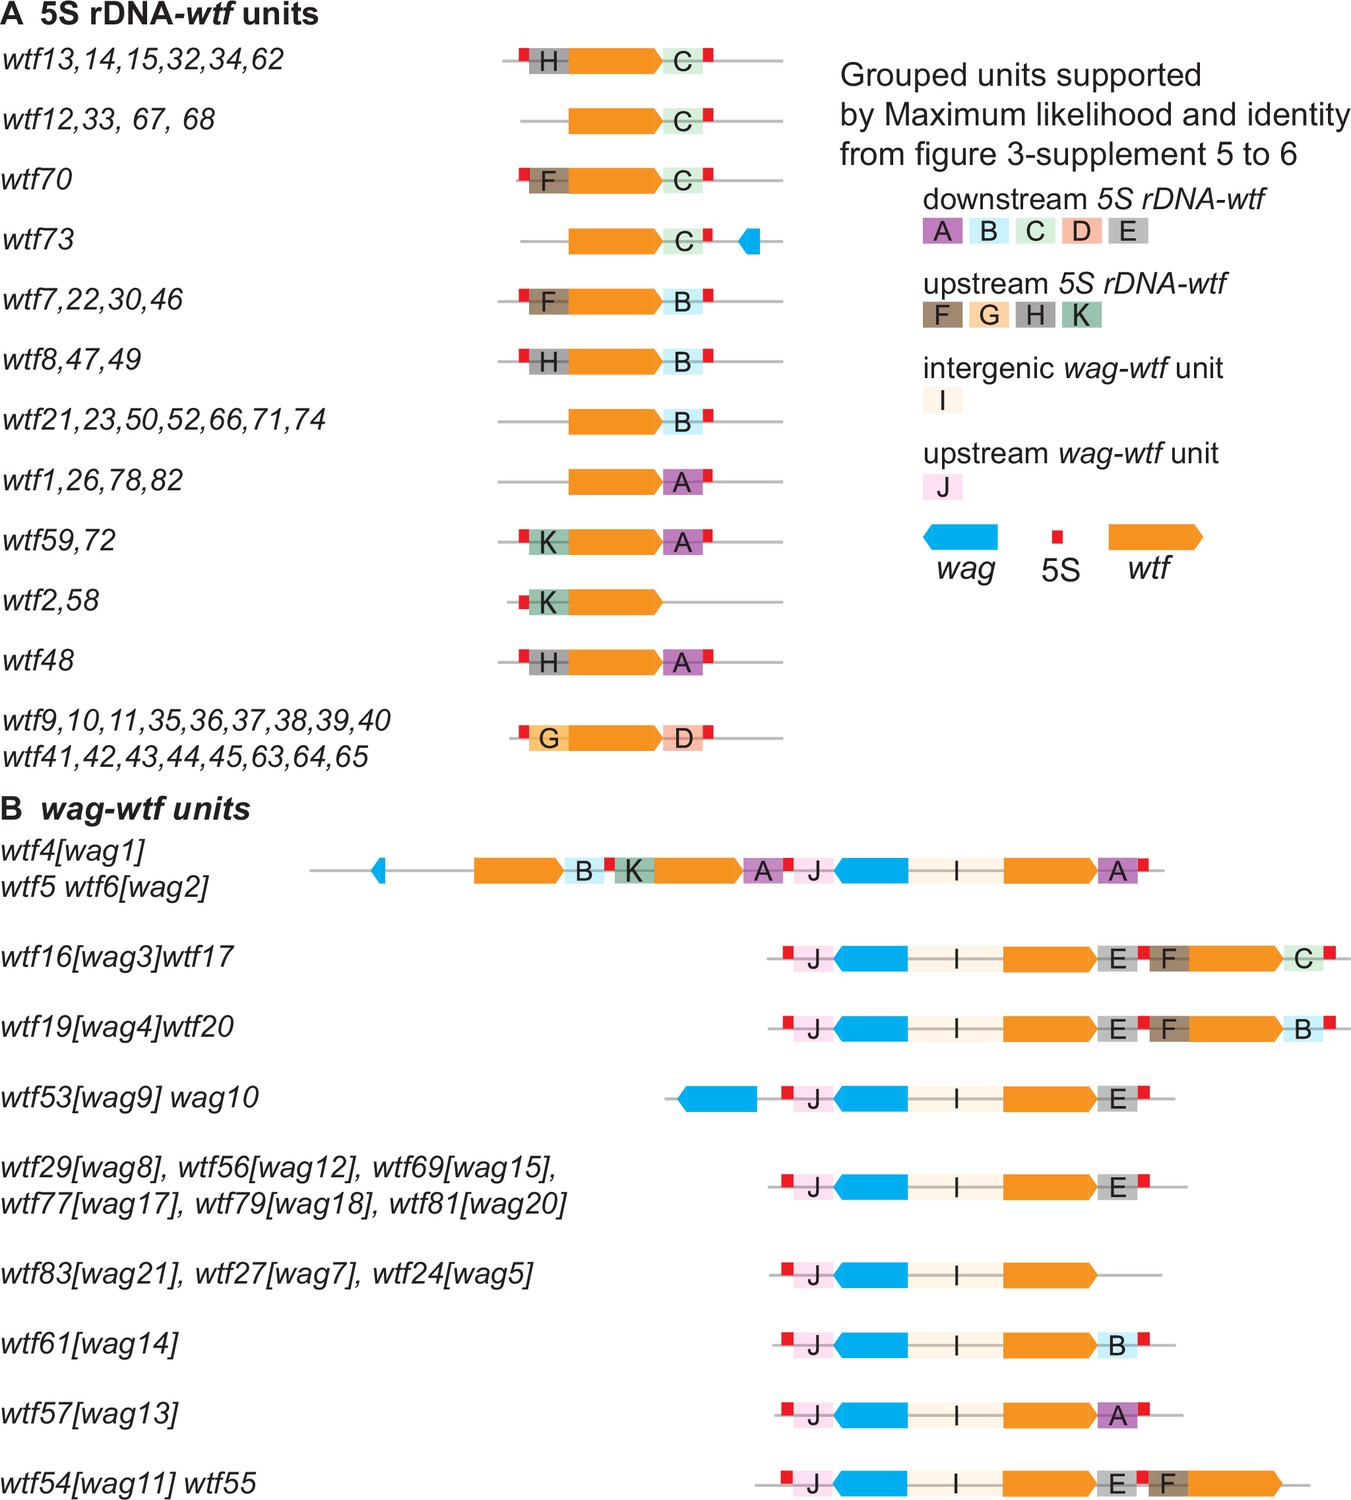
Schizosaccharomyces octosporus wtf gene units supported by maximum likelihood phylogeny.
The regions flanking the wtf genes in S. octosporus were sorted into the color-coded groups shown based on maximum phylogenies shown in Figure 3—figure supplement 4 and Figure 3—figure supplement 5. Orange boxes correspond to wtf genes, the red boxes represent 5S rDNA genes, and the blue boxes represent wag genes. Genomic contexts without wag genes and with wag genes are shown separately in (A) and (B).
Figure 3—figure supplement 4
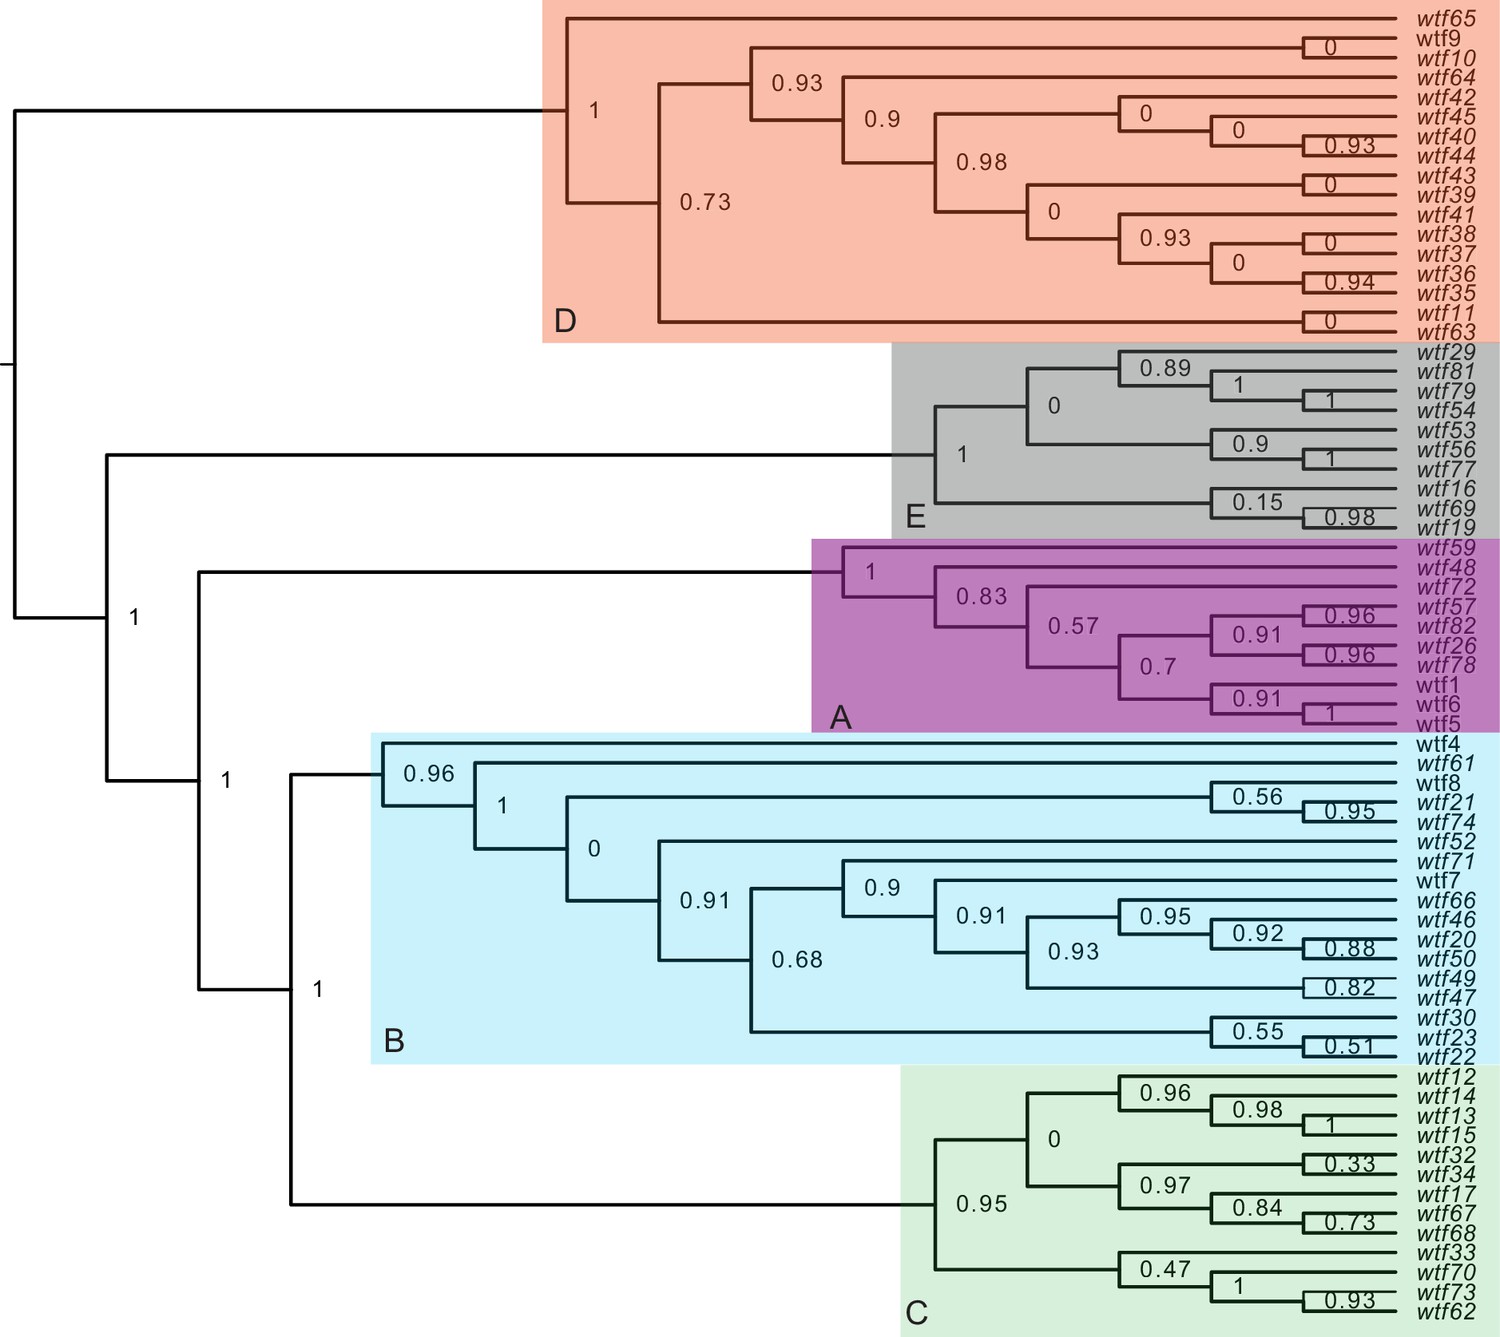
Maximum likelihood phylogeny of the regions between Schizosaccharomyces octosporus wtf genes and a downstream flanking 5S rDNA gene.
The regions downstream of 67 S. octosporus wtf genes with a downstream 5S rDNA gene were aligned with MAFFT (Katoh et al., 2002), and a maximum likelihood phylogeny was built with PhyML (Guindon et al., 2010). Branch support values shown at the nodes (0–1) are SH-like aLRT values. The shaded clades and letter designations correspond to the colors and letters shown in Figure 3—figure supplement 3.
-
Figure 3—figure supplement 4—source data 1
Multi-alignment of the regions downstream of 67 Schizosaccharomyces octosporus wtf with a downstream 5S rDNA.
DNA alignment built using MAFFT of the regions downstream of 67 S. octosporus wtf with a downstream 5S rDNA.
- https://cdn.elifesciences.org/articles/81149/elife-81149-fig3-figsupp4-data1-v1.zip
-
Figure 3—figure supplement 4—source data 2
Phylogeny of the regions downstream of 67 Schizosaccharomyces octosporus wtf genes with a downstream 5S rDNA.
Phylogeny generated by PhyML of the downstream regions of 67 S. octosporus wtf genes with a downstream 5S rDNA in Newick format (Guindon et al., 2010). The labels are SH-like aLRT values for support of the nodes (0–1).
- https://cdn.elifesciences.org/articles/81149/elife-81149-fig3-figsupp4-data2-v1.zip
Figure 3—figure supplement 5
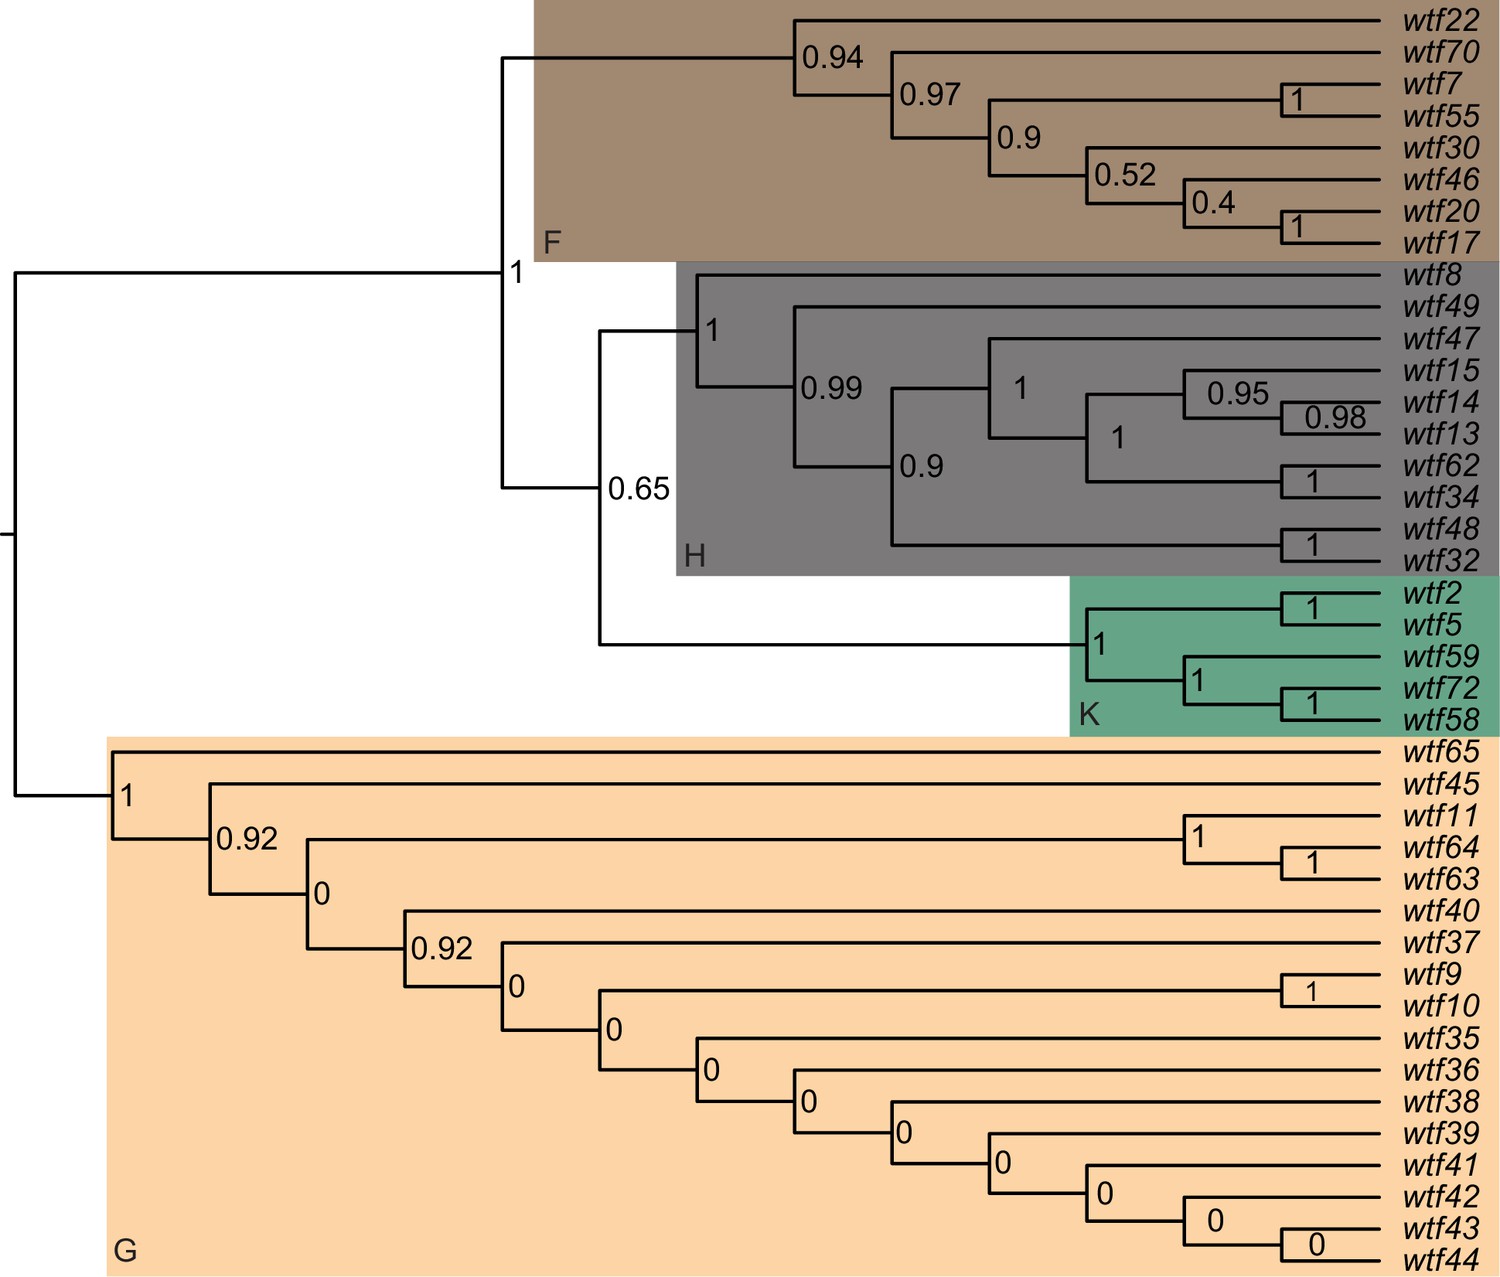
Maximum likelihood phylogeny of the regions between Schizosaccharomyces octosporus wtf genes and an upstream flanking 5S rDNA gene.
The regions upstream of 40 S. octosporus wtf genes with an upstream 5S rDNA gene were aligned with MAFFT, and a maximum likelihood phylogeny was built with PhyML. Branch support values shown at the nodes (0–1) are SH-like aLRT values. The shaded clades and letter designations correspond to the colors and letters shown in Figure 3—figure supplement 3.
-
Figure 3—figure supplement 5—source data 1
Multi-alignment of the regions upstream of 40 Schizosaccharomyces octosporus wtf with an upstream 5S rDNA.
DNA alignment made using MAFFT of the regions upstream of 40 S. octosporus wtf genes with an upstream 5S rDNA.
- https://cdn.elifesciences.org/articles/81149/elife-81149-fig3-figsupp5-data1-v1.zip
-
Figure 3—figure supplement 5—source data 2
Phylogeny of the regions upstream of 40 Schizosaccharomyces octosporus wtf genes with an upstream 5S rDNA.
Phylogeny generated by PhyML of the upstream regions of 40 S. octosporus wtf genes with an upstream 5S rDNA in a Newick format. The labels are SH-like aLRT values for support of the nodes (0–1).
- https://cdn.elifesciences.org/articles/81149/elife-81149-fig3-figsupp5-data2-v1.zip
Figure 3—figure supplement 6
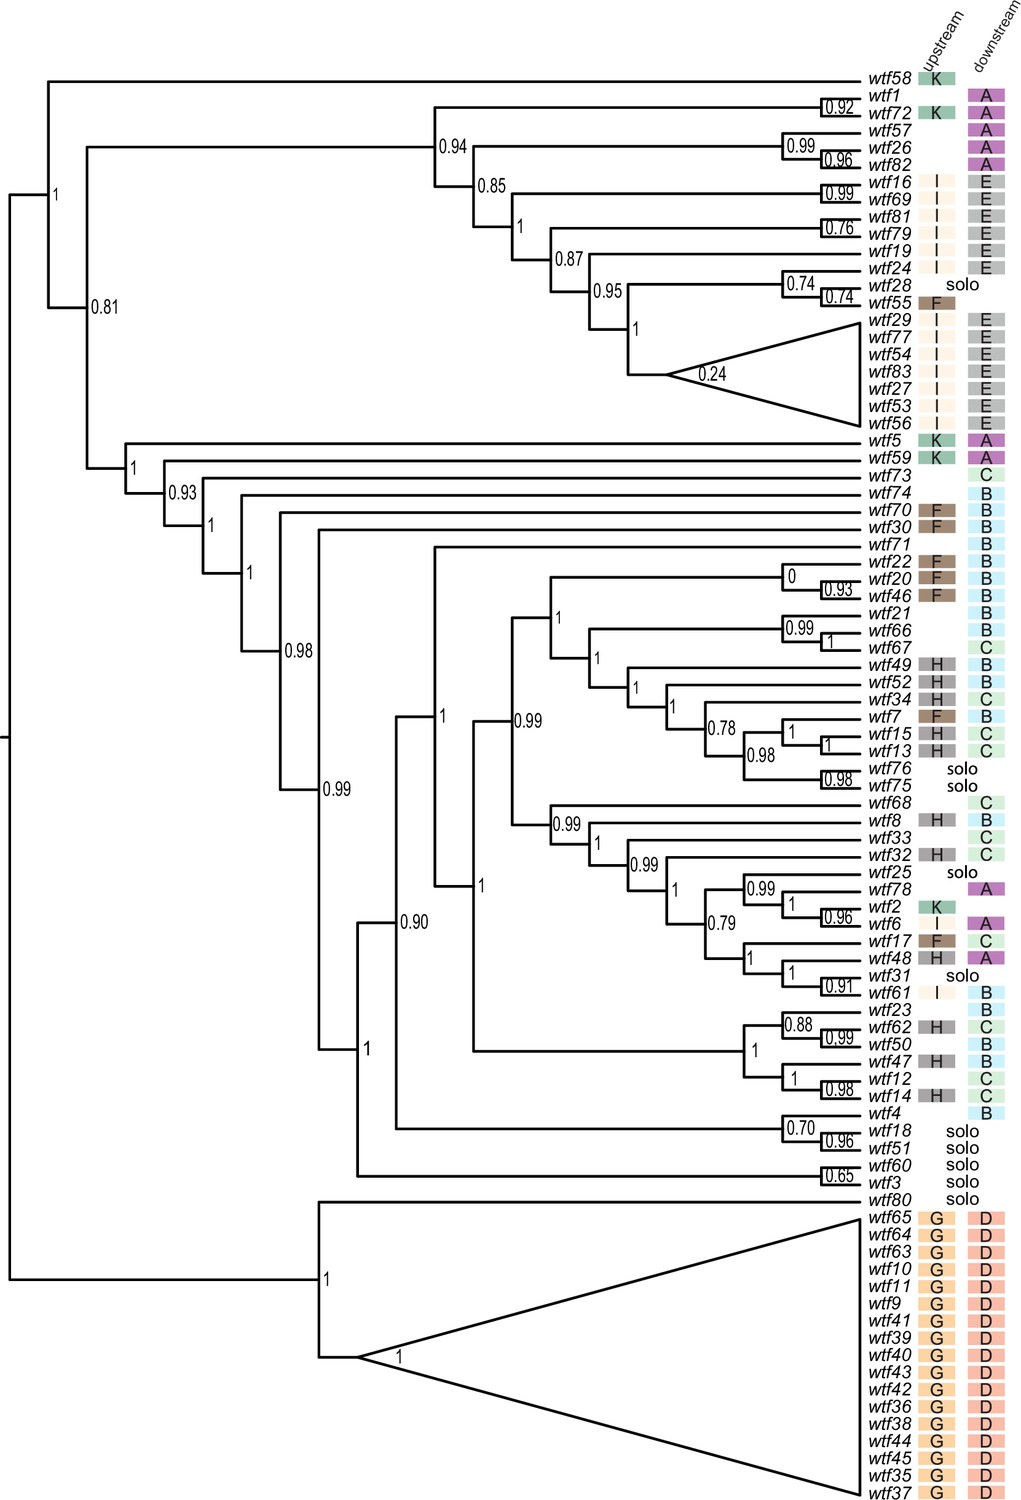
Maximum likelihood phylogeny of Schizosaccharomyces octosporus wtf genes.
The sequences of 83 S. octosporus wtf genes were aligned using MAFFT, and a maximum likelihood phylogeny was constructed using PhyML. Branch support values shown at the nodes (0–1) are SH-like aLRT values. The color-coded letter designations to the right of the gene names indicate the phylogenetic groupings of the sequences flanking the wtf genes from Figure 3—figure supplement 3.
-
Figure 3—figure supplement 6—source data 1
Multi-alignment of 83 Schizosaccharomyces octosporus wtf genes.
DNA multi-alignment using MAFFT of 83 S. octosporus wtf genes in PHYLIP format.
- https://cdn.elifesciences.org/articles/81149/elife-81149-fig3-figsupp6-data1-v1.zip
-
Figure 3—figure supplement 6—source data 2
Phylogeny of 83 Schizosaccharomyces octosporus wtf genes.
Phylogeny generated by PhyML of 83 S. octosporus wtf genes in Newick format. Support values are SH-like aLRT values (0–1).
- https://cdn.elifesciences.org/articles/81149/elife-81149-fig3-figsupp6-data2-v1.zip
Figure 4 with 1 supplement
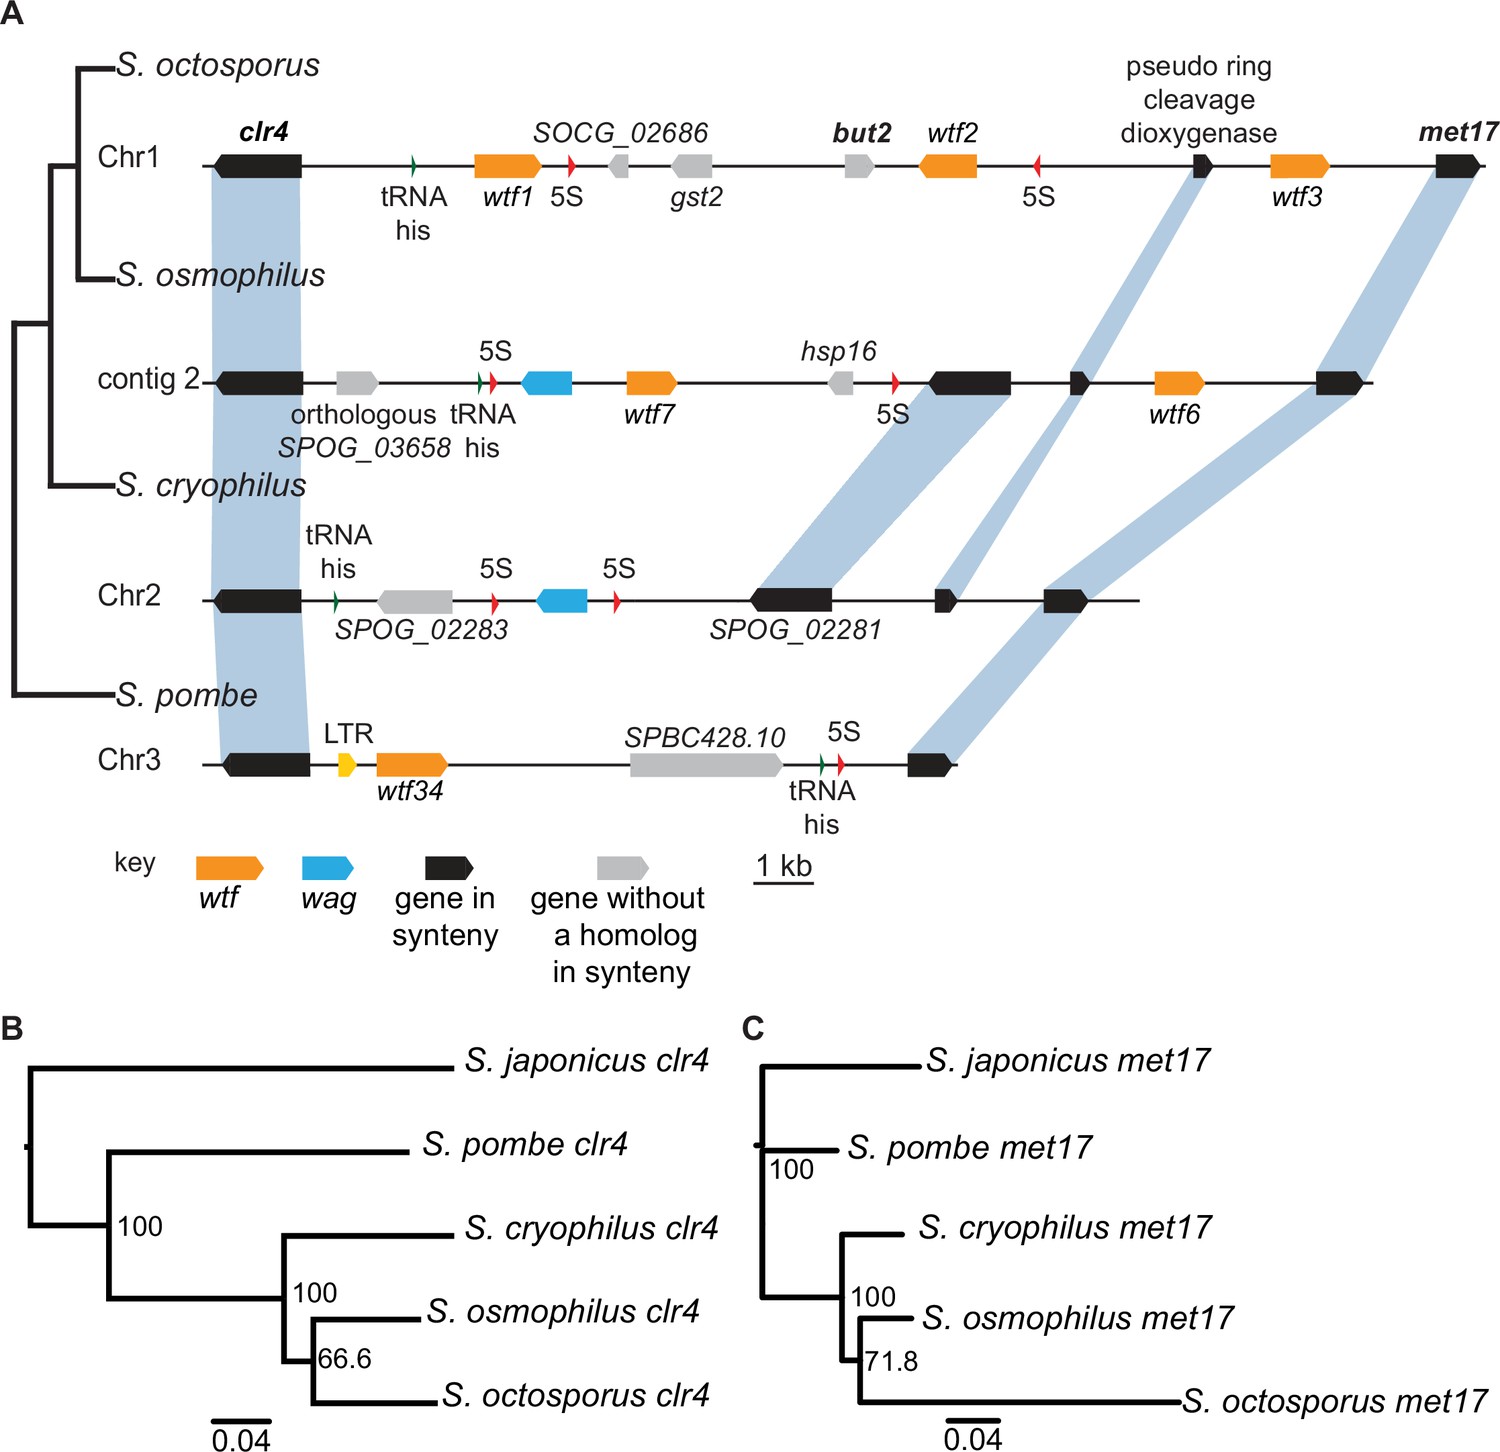
Shared wtf locus in three fission yeast species.
(A) The syntenic region between clr4 and met17 in Schizosaccharomyces octosporus, S. osmophilus, S. cryophilus, and S. pombe is shown. The S. pombe locus shown is from the S. kambucha isolate. The orange boxes represent wtf genes, the blue boxes represent wag genes, the red arrows represent 5S rDNA, the green arrow represents tRNA-his, the gray boxes represent genes without a homolog in this region in the species shown, and the black boxes represent genes that are syntenic between the species. The phylogenetic relationship between species is shown to the left of the DNA representation. The orthologs of clr4 (B) and met17 (C) were aligned and used to build neighbor-joining trees that were midpoint rooted. Branch support (0–100) was calculated using bootstrap.
-
Figure 4—source data 1
Multi-alignment of Schizosaccharomyces clr4 genes and neighbor-joining tree.
DNA MAFFT alignment of Schizosaccharomyces clr4 from Schizosaccharomyces octosporus, S. osmophilus, S. cryophilus, S. pombe, and S. japonicus in PHYLIP format.
- https://cdn.elifesciences.org/articles/81149/elife-81149-fig4-data1-v1.zip
-
Figure 4—source data 2
Neighbor-joining tree of Schizosaccharomyces clr4 genes.
Phylogenetic tree of Schizosaccharomyces clr4 from Schizosaccharomyces octosporus, S. osmophilus, S. cryophilus, S. pombe, and S. japonicus in Newick format. Bootstrap values are displayed from 0 to 100.
- https://cdn.elifesciences.org/articles/81149/elife-81149-fig4-data2-v1.zip
-
Figure 4—source data 3
Multi-alignment of Schizosaccharomyces met17 genes.
DNA MAFFT alignment of Schizosaccharomyces met17 from Schizosaccharomyces octosporus, S. osmophilus, S. cryophilus, S. pombe, and S. japonicus in PHYLIP format.
- https://cdn.elifesciences.org/articles/81149/elife-81149-fig4-data3-v1.zip
-
Figure 4—source data 4
Neighbor-joining tree of Schizosaccharomyces met17 genes.
Neighbor-joining tree of Schizosaccharomyces met17 from Schizosaccharomyces octosporus, S. osmophilus, S. cryophilus, S. pombe, and S. japonicus in Newick format. Bootstrap values are displayed from 0 to 100.
- https://cdn.elifesciences.org/articles/81149/elife-81149-fig4-data4-v1.zip
Figure 4—figure supplement 1
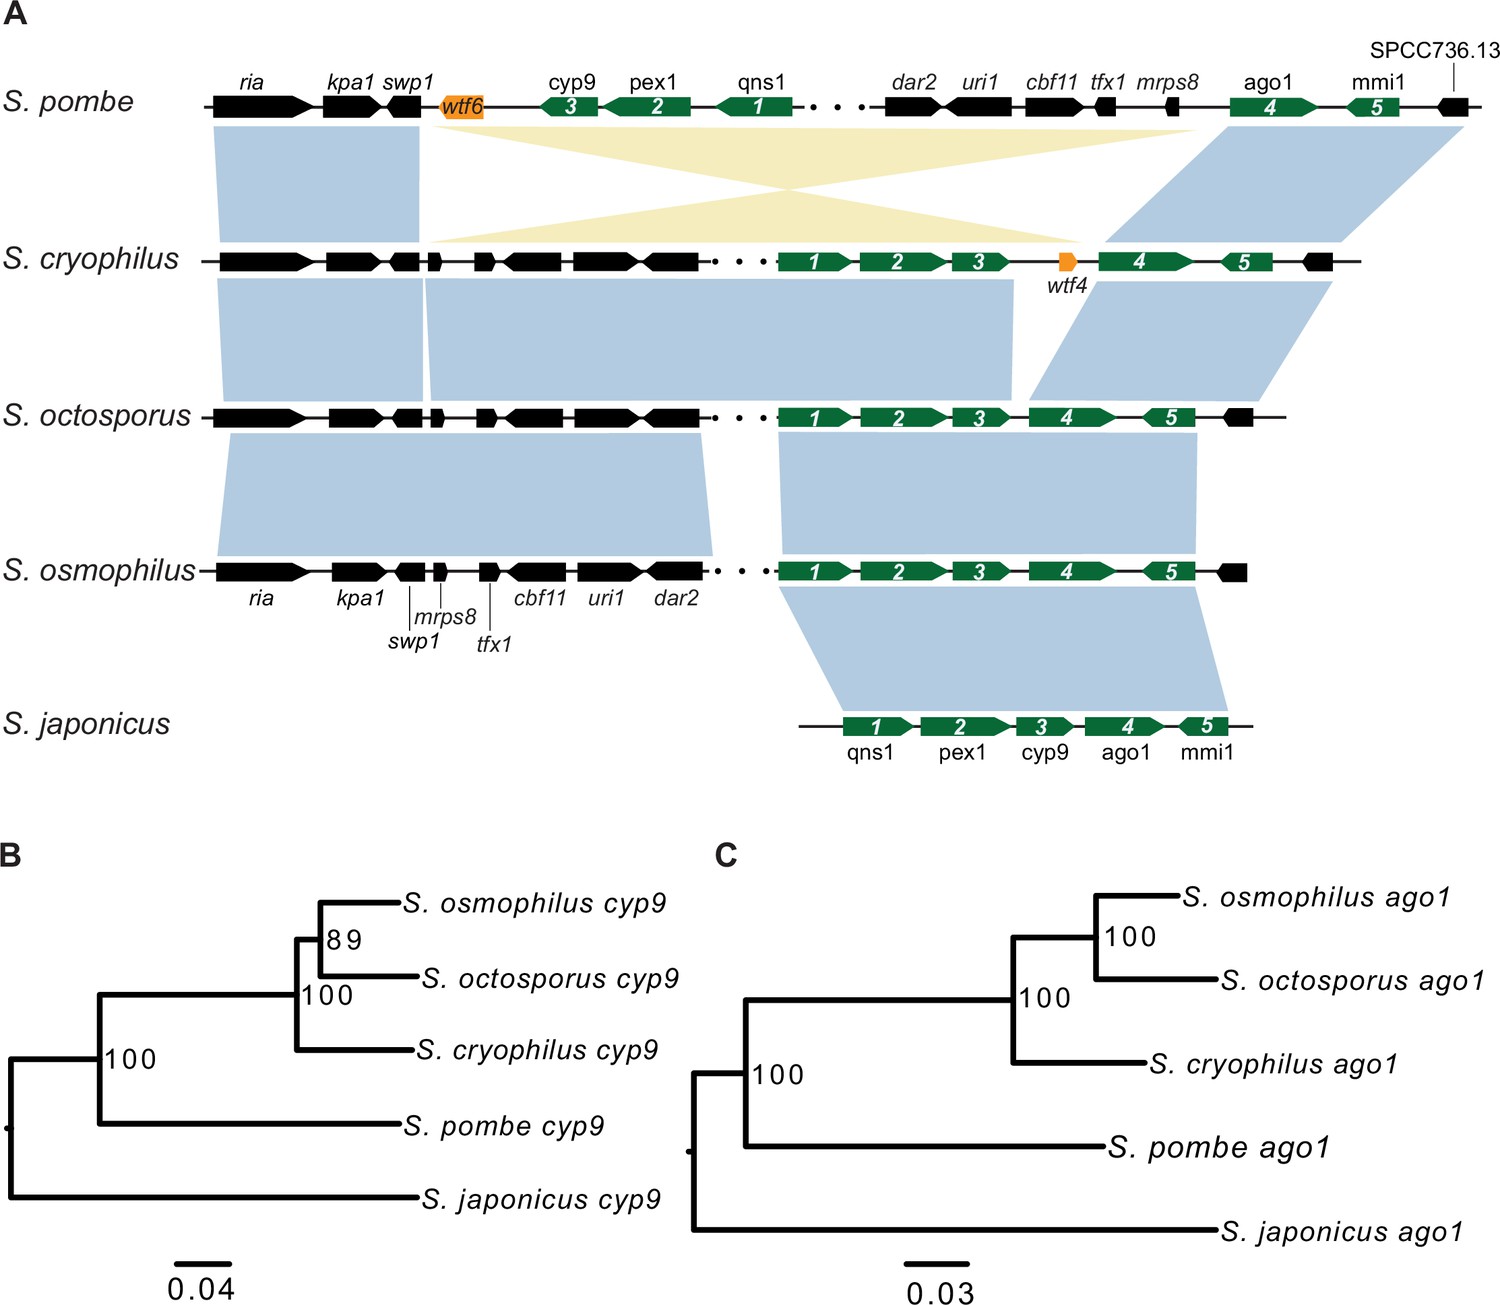
Synteny between Schizosaccharomyces cryophilus wtf4 and S. pombe wtf6.
(A) The syntenic region containing cyp9 and ago1 is shown for all fission yeast species. An inversion in the S. pombe lineage separated cyp9 and ago1. There is a wtf gene upstream of ago1 in both S. pombe and S. cryophilus. The orange boxes represent the wtf genes. Five genes are numbered and shown in green to illustrate that the ancestor of S. pombe and S. cryophilus likely had a wtf gene between cyp9 and ago1. The black boxes represent additional orthologous genes in synteny. The orthologs of cyp9 (B) and ago1 (C) were aligned and used to build neighbor-joining trees that were midpoint rooted. Branch support (0–100) was calculated using bootstrap.
-
Figure 4—figure supplement 1—source data 1
Multi-alignment of Schizosaccharomyces ago1 genes and neighbor-joining tree.
DNA alignment built using MAFFT of Schizosaccharomyces ago1 from Schizosaccharomyces octosporus, S. osmophilus, S. cryophilus, S. pombe, and S. japonicus in PHYLIP format.
- https://cdn.elifesciences.org/articles/81149/elife-81149-fig4-figsupp1-data1-v1.zip
-
Figure 4—figure supplement 1—source data 2
Neighbor-joining tree of Schizosaccharomyces ago1 genes.
Neighbor-joining tree of Schizosaccharomyces ago1 in Newick format. Bootstrap values are displayed from 0 to 100.
- https://cdn.elifesciences.org/articles/81149/elife-81149-fig4-figsupp1-data2-v1.zip
-
Figure 4—figure supplement 1—source data 3
Multi-alignment of Schizosaccharomyces cyp9 genes.
DNA alignment built using MAFFT of Schizosaccharomyces cyp9 from Schizosaccharomyces octosporus, S. osmophilus, S. cryophilus, S. pombe, and S. japonicus in PHYLIP format.
- https://cdn.elifesciences.org/articles/81149/elife-81149-fig4-figsupp1-data3-v1.zip
-
Figure 4—figure supplement 1—source data 4
Neighbor-joining tree of Schizosaccharomyces cyp9 genes.
Phylogeny of Schizosaccharomyces cyp9 from Schizosaccharomyces octosporus, S. osmophilus, S. cryophilus, S. pombe, and S. japonicus phylogenetic tree of Schizosaccharomyces met17 in Newick format.
- https://cdn.elifesciences.org/articles/81149/elife-81149-fig4-figsupp1-data4-v1.zip
Figure 5 with 3 supplements

Gene duplication and non-allelic gene conversion within wtf gene family.
All the predicted intact Wtf antidote amino acid sequences were aligned using MAFFT from Figure 2—figure supplement 1—source data 1 and used to build a maximum likelihood tree using PhyML. The Schizosaccharomyces pombe sequences were from the FY29033 isolate as it has more wtf genes than the reference genome. The S. pombe genes are shown in black, S. octosporus genes are in magenta, S. osmophilus genes are dark blue, and the S. cryophilus genes are cyan. The triangles represent multiple genes with the precise number indicated on the right. The branch support values (0–1) are SH-like aLRT values and are shown at each node.
-
Figure 5—source data 1
Maximum likelihood phylogeny of 113 wtf genes.
Phylogenetic tree of 113 wtf genes from Schizosaccharomyces octosporus, S. cryophilus, S. osmophilus, and S. pombe in Newick format. Branch support values are SH-like aLRT values.
- https://cdn.elifesciences.org/articles/81149/elife-81149-fig5-data1-v1.zip
Figure 5—figure supplement 1
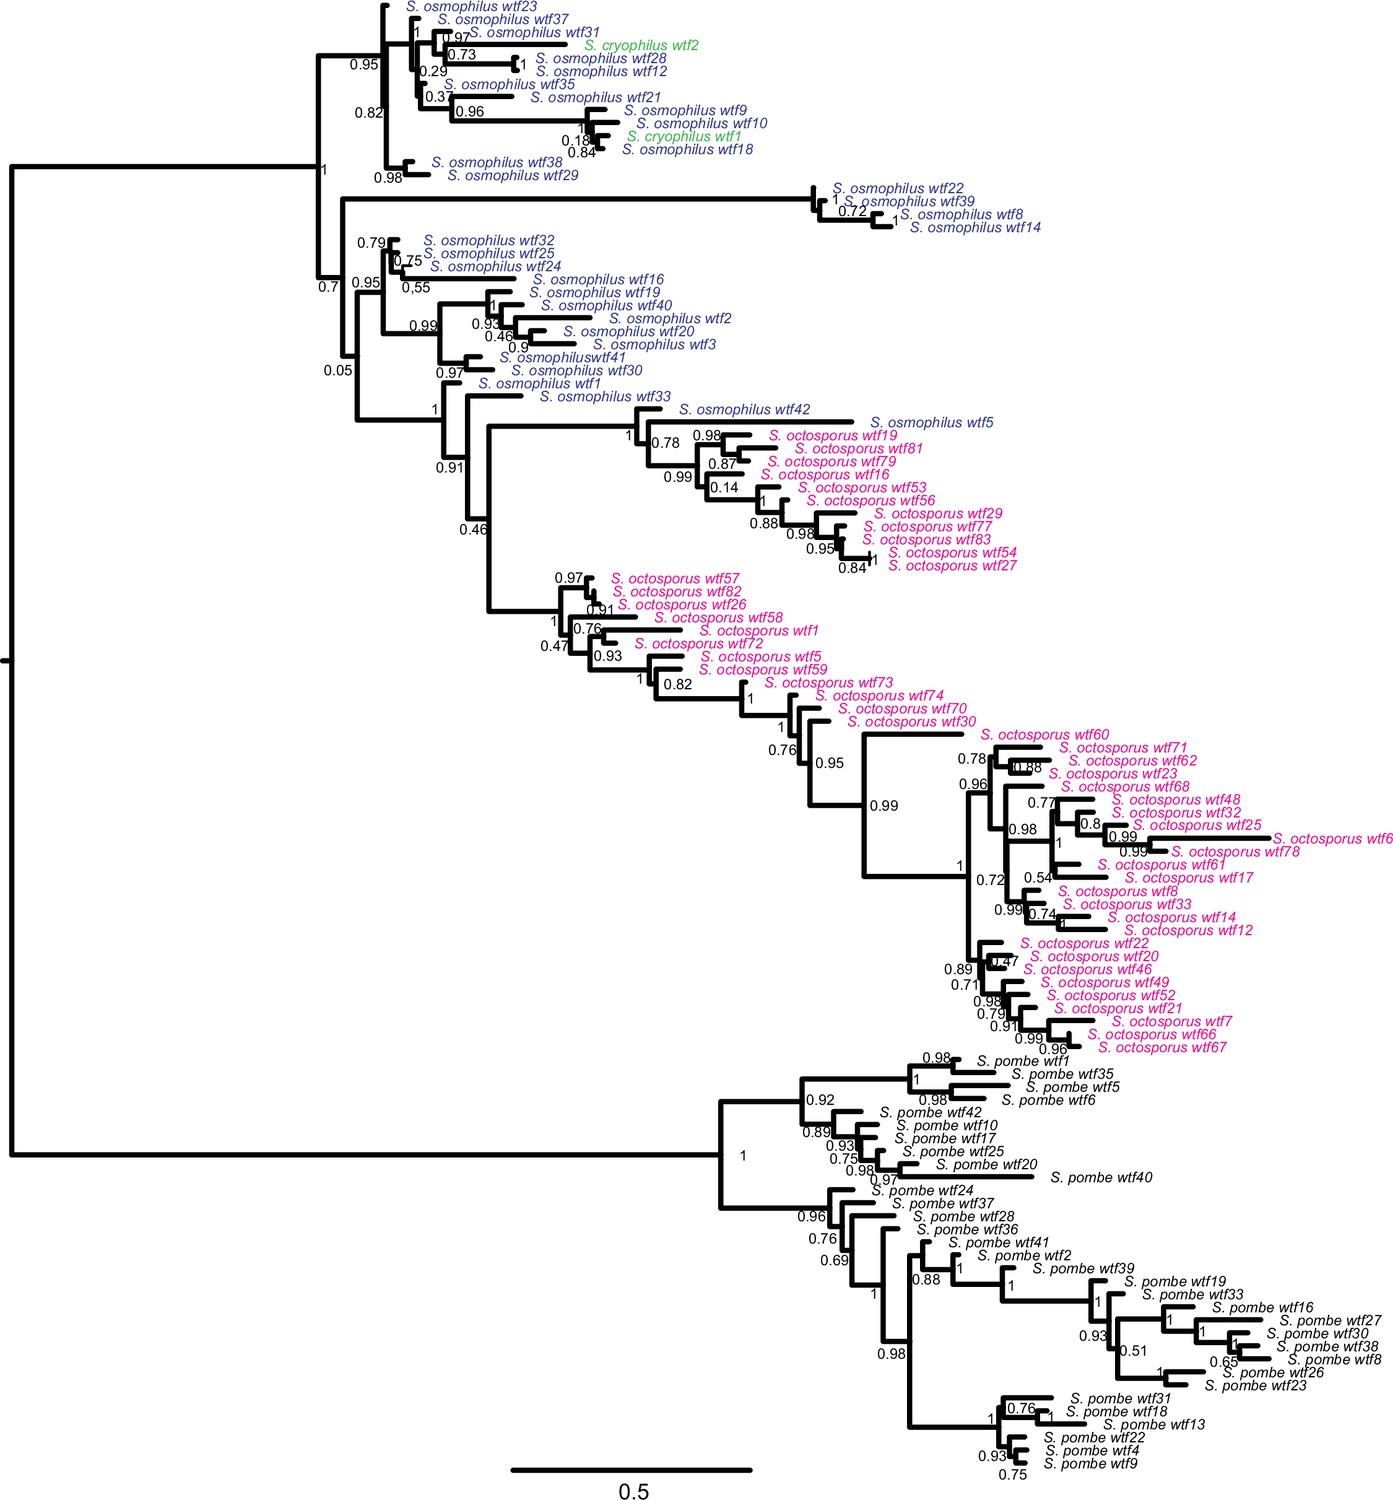
Gene duplication and non-allelic gene conversion within wtf gene family.
This depicts the same tree as Figure 5 but with all the tip labels displayed.
Figure 5—figure supplement 2
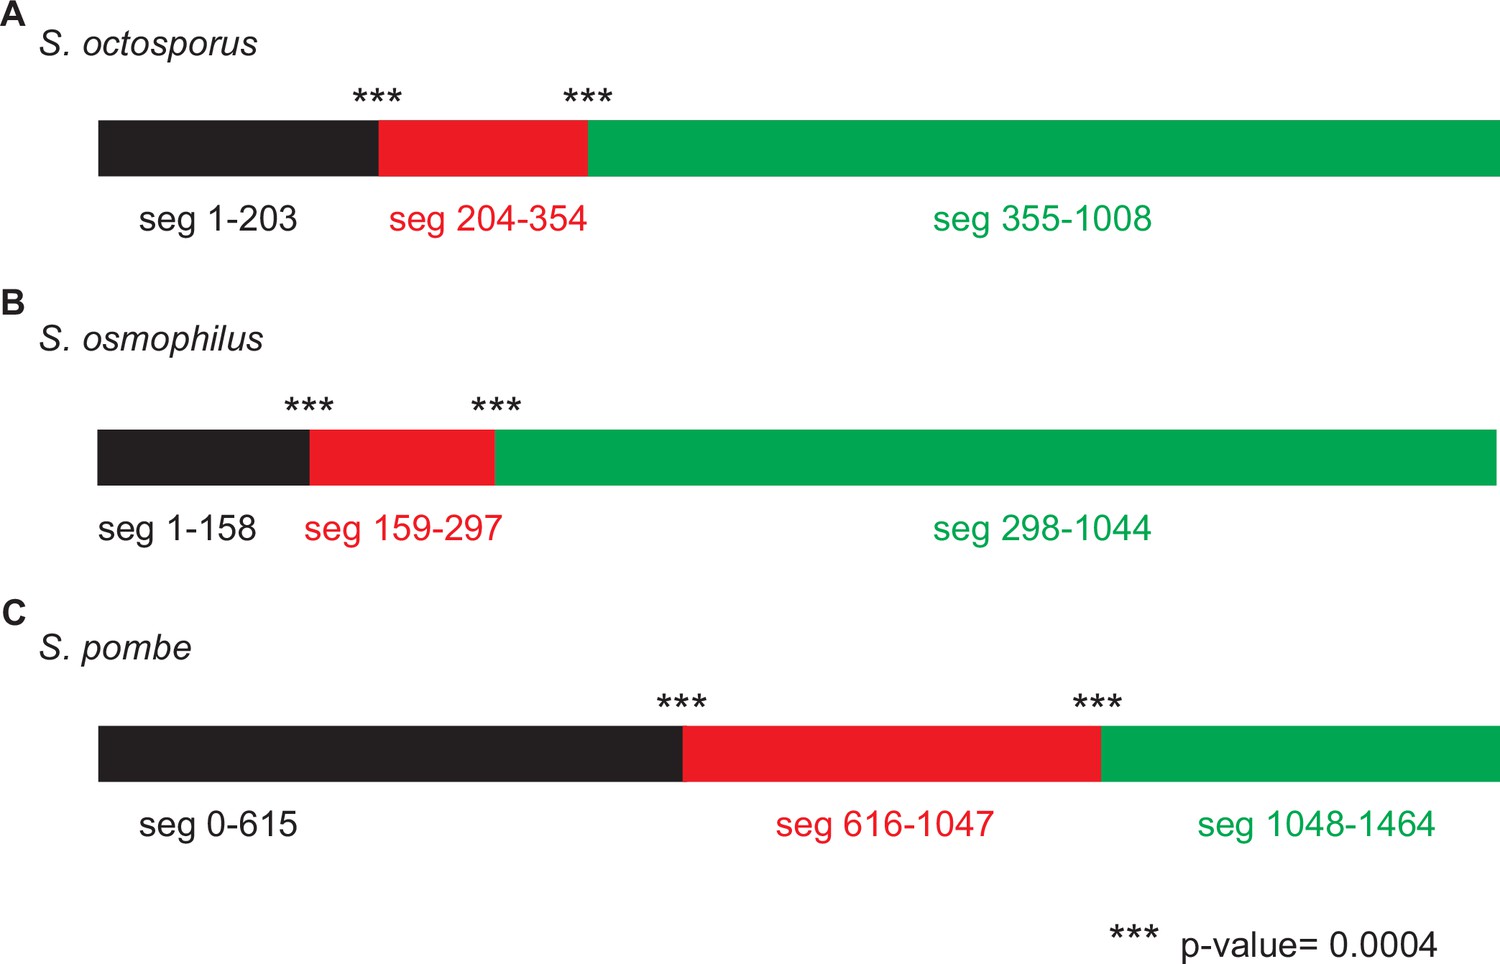
Genetic algorithm recombination detection (GARD) analysis consistent with non-allelic gene conversion within wtf genes.
We used GARD (Kosakovsky Pond et al., 2006b) analysis to look for evidence of gene conversion within the wtf genes of (A) Schizosaccharomyces octosporus, (B) S. osmophilus, and (C) S. pombe. We considered only genes predicted to be meiotic drivers or suppressors. This analysis found that a hypothesis allowing multiple trees for different segments of the alignment is >100 times more likely than a hypothesis allowing only a single tree, supporting that non-allelic recombination has occurred within wtf genes. The analysis identified two likely breakpoints in each species. For S. pombe, the analysis is from Eickbush et al., 2019.
-
Figure 5—figure supplement 2—source data 1
Genetic algorithm recombination detection (GARD) analysis of Schizosaccharomyces octosporus wtf genes.
GARD analysis of S. octosporus wtf predicted meiotic drivers and suppressors. This analysis found that a hypothesis allowing multiple trees for different segments of the alignment is >100 times more likely than a hypothesis allowing only a single tree, supporting that non-allelic recombination has occurred within the gene family. The analysis identified two likely breakpoints corresponding to positions 204 and 355 in the alignment, yielding three segments as depicted by the colored rectangles at the top of the figure. Both breakpoints have strong statistical support (***; p<0.0004). The trees generated for each segment (below) are distinct. The yellow highlighting is to help illustrate the incongruence between the trees.
- https://cdn.elifesciences.org/articles/81149/elife-81149-fig5-figsupp2-data1-v1.pdf
-
Figure 5—figure supplement 2—source data 2
Genetic algorithm recombination detection (GARD) analysis of Schizosaccharomyces osmophilus wtf genes.
GARD analysis of S. osmophilus wtf predicted meiotic drivers and suppressors. This analysis found that a hypothesis allowing multiple trees for different segments of the alignment is >100 times more likely than a hypothesis allowing only a single tree, supporting that non-allelic recombination has occurred within the gene family. The analysis identified two likely breakpoints corresponding to positions 159 and 298 in the alignment, yielding three segments as depicted by the colored rectangles at the top of the figure. Both breakpoints have strong statistical support (***; p<0.0004). The trees generated for each segment (below) are distinct. The yellow highlighting is to help illustrate the incongruence between the trees.
- https://cdn.elifesciences.org/articles/81149/elife-81149-fig5-figsupp2-data2-v1.pdf
Figure 5—figure supplement 3
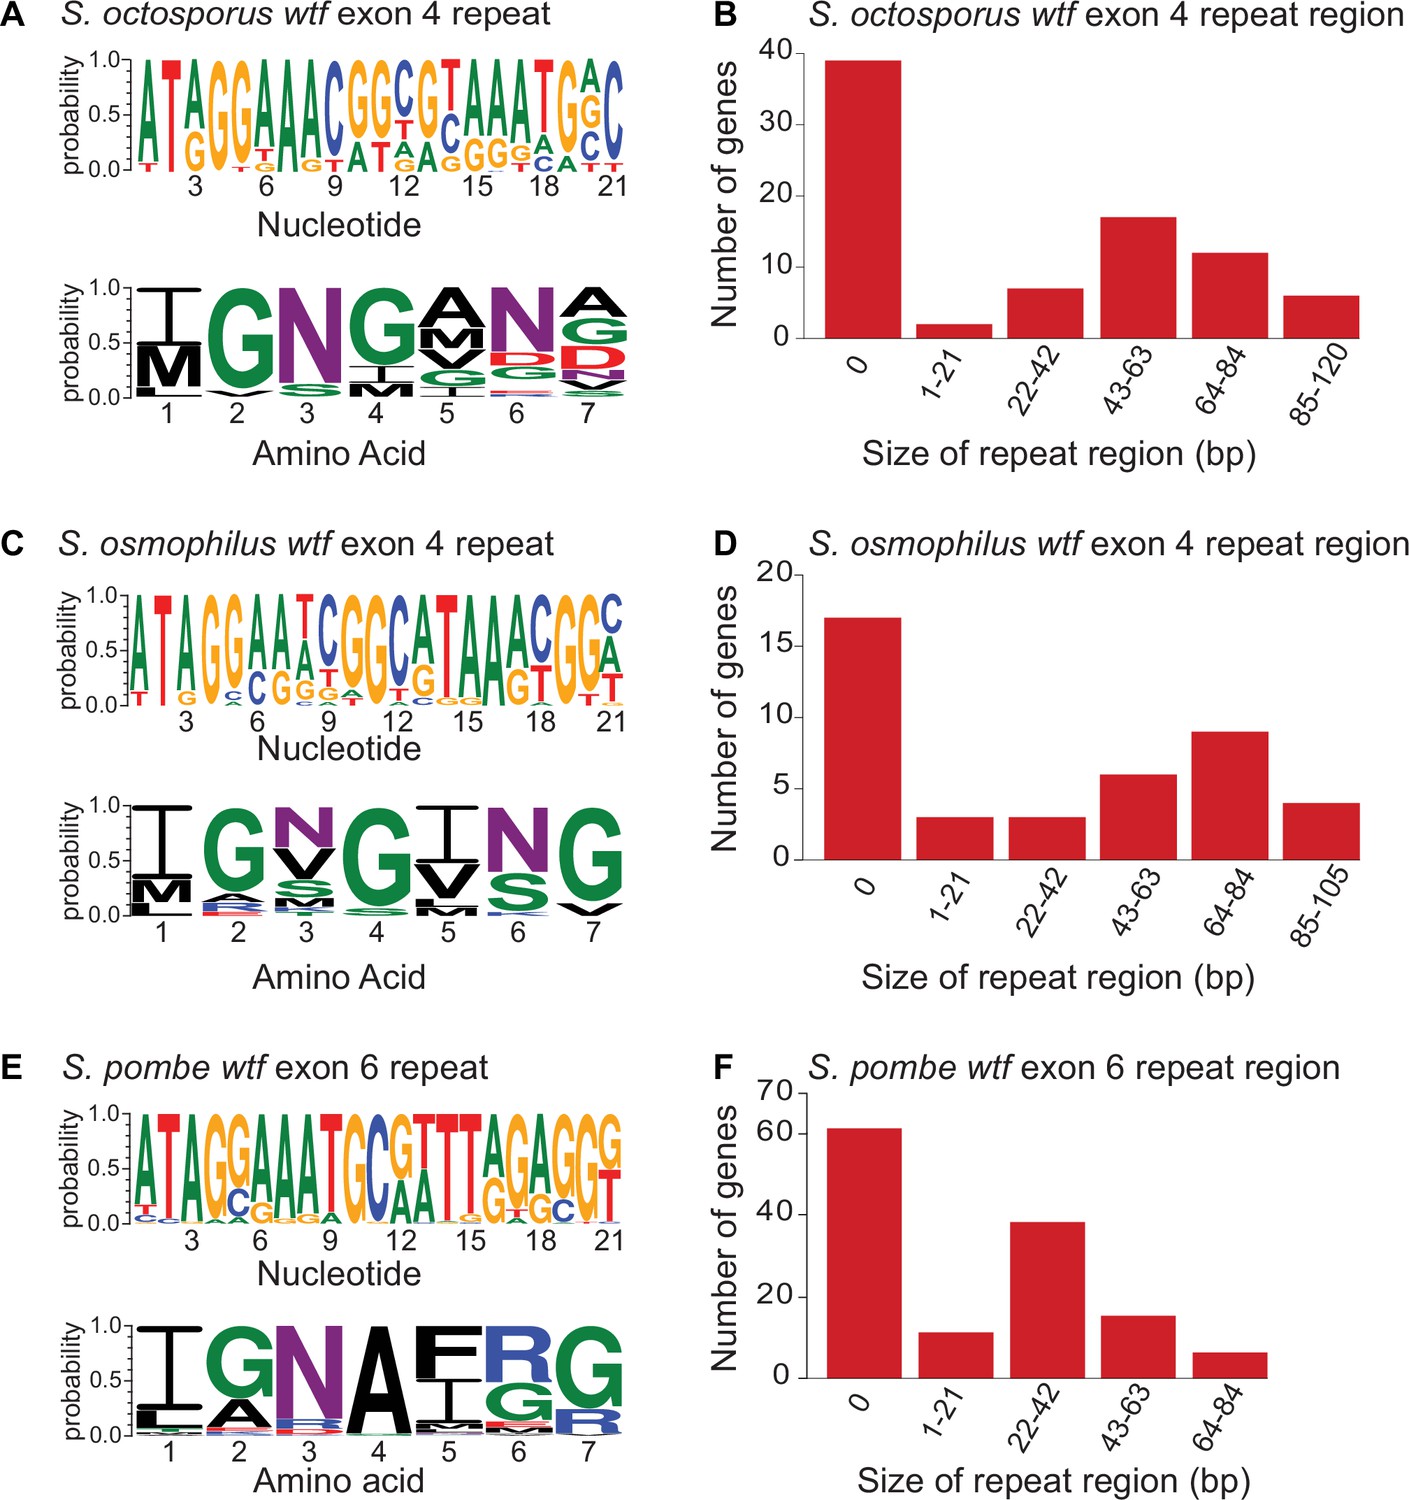
Contraction and expansion of repeat sequences in wtf genes.
The wtf genes of Schizosaccharomyces octosporus (A), S. osmophilus (C), and S. pombe (E) can contain the indicated repetitive sequences. The DNA (top) and amino acid (bottom) sequence logos representing the repeat regions are shown for each species. The size distribution of the repeat regions for all S. octosporus (A), S. osmophilus (C), and S. pombe (E) wtf genes is shown. The sizes are presented in base pairs instead of repeat units because the terminal repeats are not always full length. The S. pombe data are from Eickbush et al., 2019 and includes wtf genes from four different isolates. The repeat count in exon 4 of S. octosporus wtf genes, and the repeat count in exon 4 of S. osmophilus wtf genes is shown in Supplementary file 1r.
Figure 6 with 1 supplement
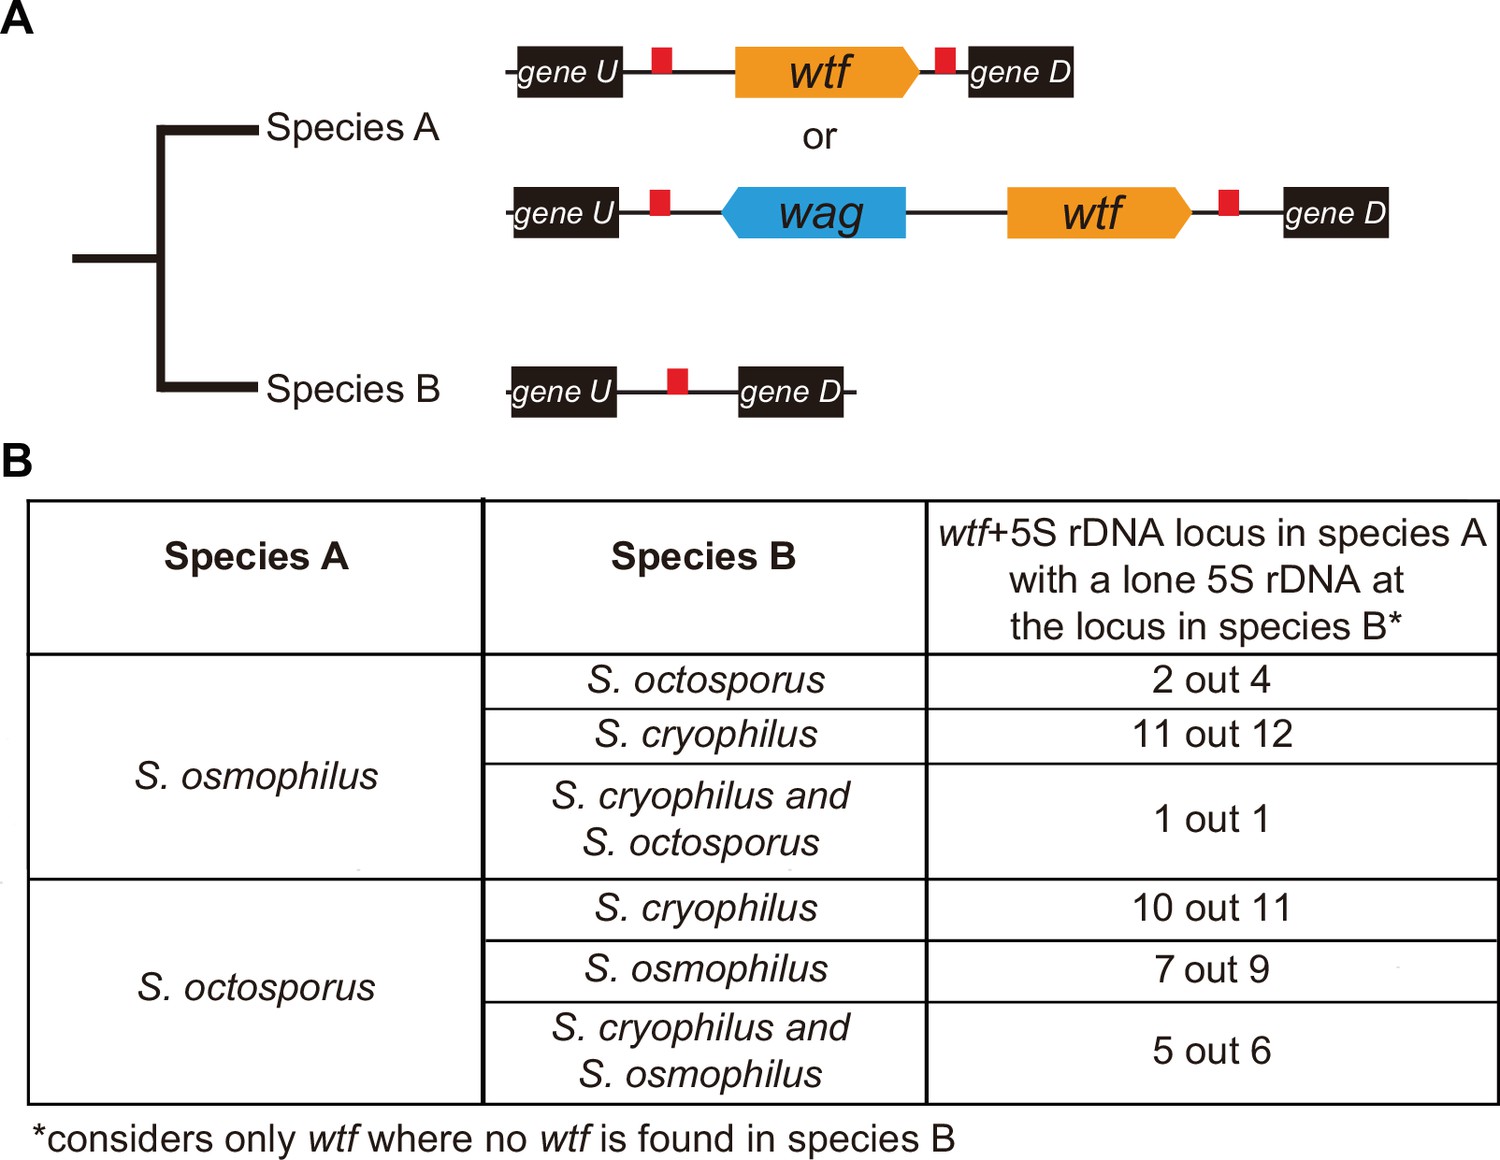
wtf genes duplicated into pre-existing 5S rDNA.
Testing if lineage restricted wtf genes occur at sites where the ancestral species is inferred to have had a 5S rDNA gene. An example of this situation is illustrated in (A) where species A has a 5S-rDNA-flanked wtf gene, and species B has a 5S rDNA gene at the syntenic locus. (B) Number of wtf + 5S rDNA loci in species A (any of the gene layouts illustrated in (A)) with 5S rDNA at the syntenic locus in species B. This analysis only considers loci that contain 5S-rDNA-flanked wtf gene in species A but contain no wtf genes in species B. Data in Supplementary file 1p and q were used to test this hypothesis.
Figure 6—figure supplement 1
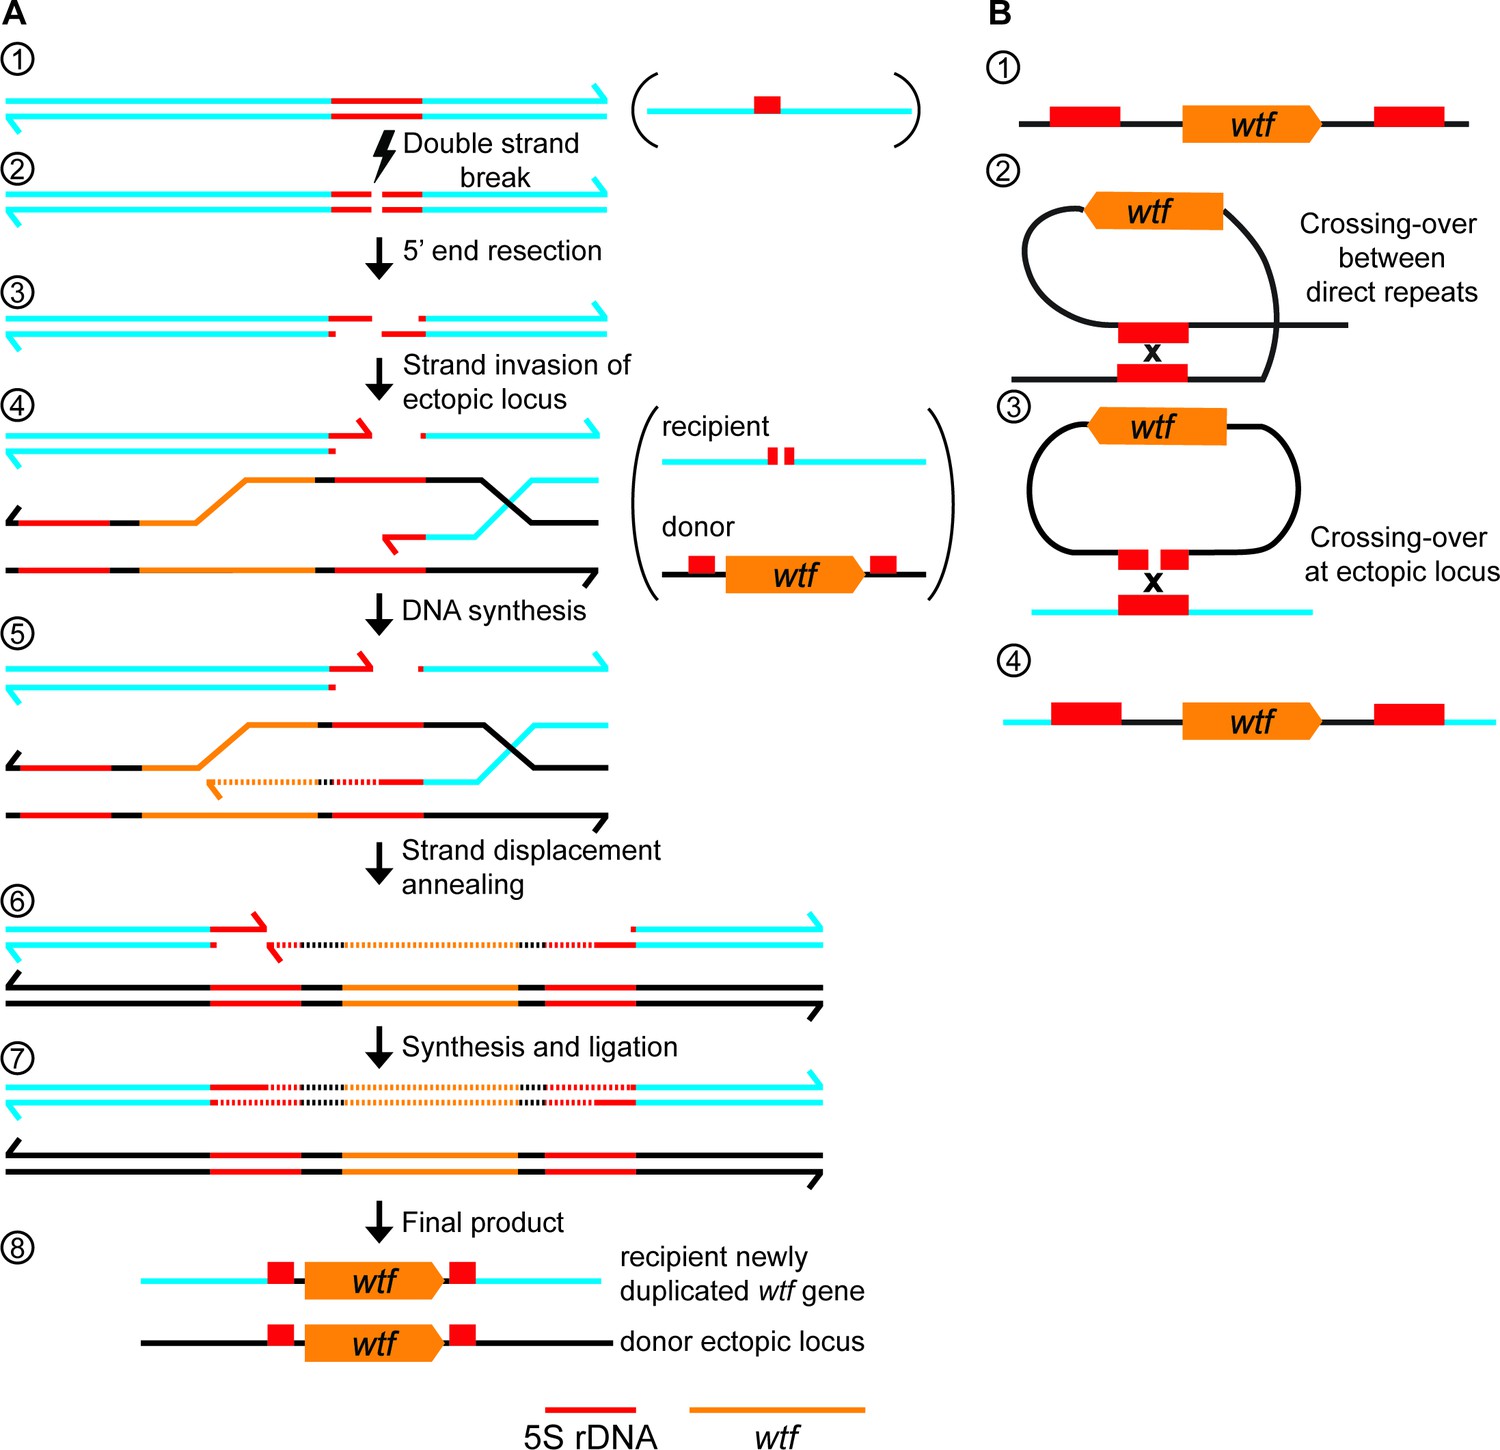
wtf gene duplication models.
(A) Model of duplication via non-allelic gene conversion: (1) double strand of DNA with 5S rDNA depicted in red. (2) A double-strand DNA break (DSB) within the 5S rDNA and (3) 5’ end resection. (4) Strand invasion of an ectopic locus with a wtf gene flanked by 5S rDNA genes. (5) The repair template containing the wtf gene is copied to the site of the initiating DSB. (6) Strand displacement and annealing of the broken DNA. (7) Synthesis of DNA with wtf gene in the other strand and ligation to finalize repair. (8) wtf gene duplicated in a new locus (B) (1) 5S rDNA-wtf-5S rDNA unit. (2) Crossing-over between 5S rDNA repeats flanking a wtf gene can generate an extrachromosomal circular DNA. (3) This circle can recombine with an ectopic locus containing a 5S rDNA. (4) Generation of a new wtf locus.
Figure 7 with 3 supplements
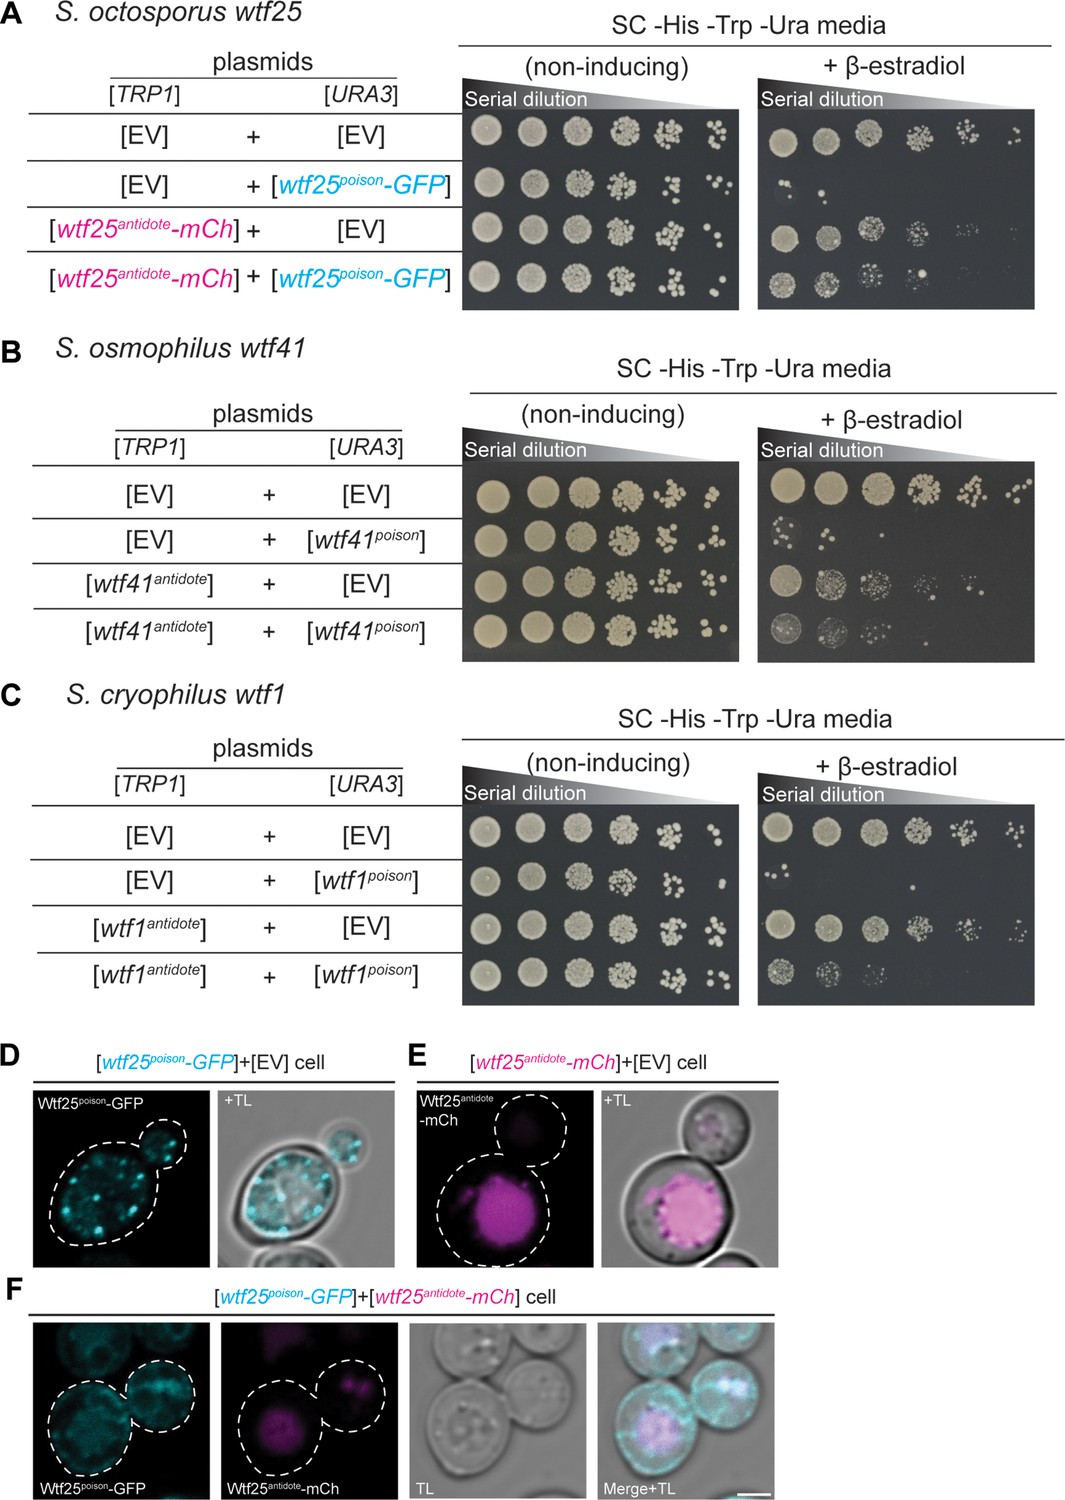
wtf genes can encode for poison and antidote proteins.
Spot assay of serial dilutions of Saccharomyces cerevisiae cells on non-inducing (SC -His -Trp -Ura) and inducing (SC -His -Trp -Ura+500 nM β-estradiol) media. Each strain contains [TRP1] and [URA3] ARS CEN plasmids that are either empty (EV) or carry the indicated β-estradiol inducible wtf alleles. (A) Schizosaccharomyces octosporus wtf25poison-GFP and wtf25antiddote-mCherry (B) S. osmophilus wtf41poison and wtf41antidote, and (C) S. cryophilus wtf1poison and wtf1antidote. The dilution factor is 0.2 starting at OD = 1. (D) A representative cell carrying a [URA3] plasmid with β-estradiol inducible S. octosporus wtf25poison-GFP (cyan). (E) A representative cell carrying a [TRP1] plasmid with β-estradiol inducible S. octosporus wtf25antidote-mCherry (magenta). (F) A representative S. cerevisiae cell carrying a [URA3] plasmid with β-estradiol inducible S. octosporus wtf25poison-GFP (cyan) and [TRP1] plasmid with β-estradiol inducible S. octosporus wtf25antidote-mCherry (magenta). In all the experiments, the cells were imaged approximately 4 hr after induction with 500 nM β-estradiol. TL = transmitted light. Scale bar represents 2 µm.
Figure 7—figure supplement 1
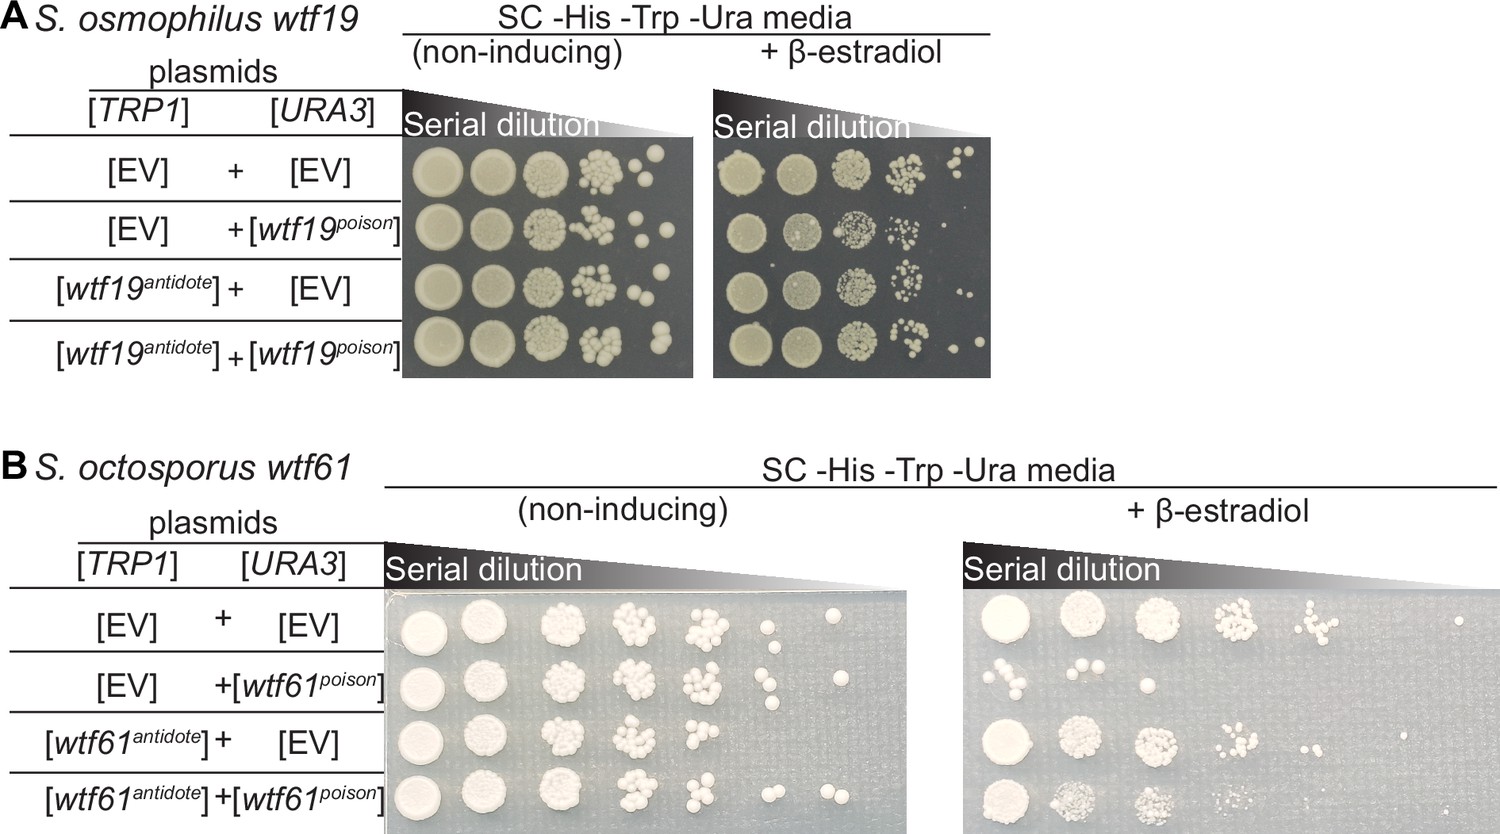
Some wtf genes outside of Schizosaccharomyces pombe encode for poison and antidote proteins.
Spot assay of serial dilutions of Saccharomyces cerevisiae cells on non-inducing (SC -His -Trp -Ura) and inducing (SC -His -Trp -Ura+500 nM β-estradiol) media. Each strain contains [TRP1] and [URA3] ARS CEN plasmids that are either empty (EV) or carry the indicated β-estradiol inducible alleles. (A) S. osmophilus wtf19poison and wtf19antidote, (B) S. octosporus wtf61poison and wtf61antidote. The dilution factor is 0.1 for (A) 0.2 for (B) with a starting OD = 1 for both panels.
Figure 7—figure supplement 2
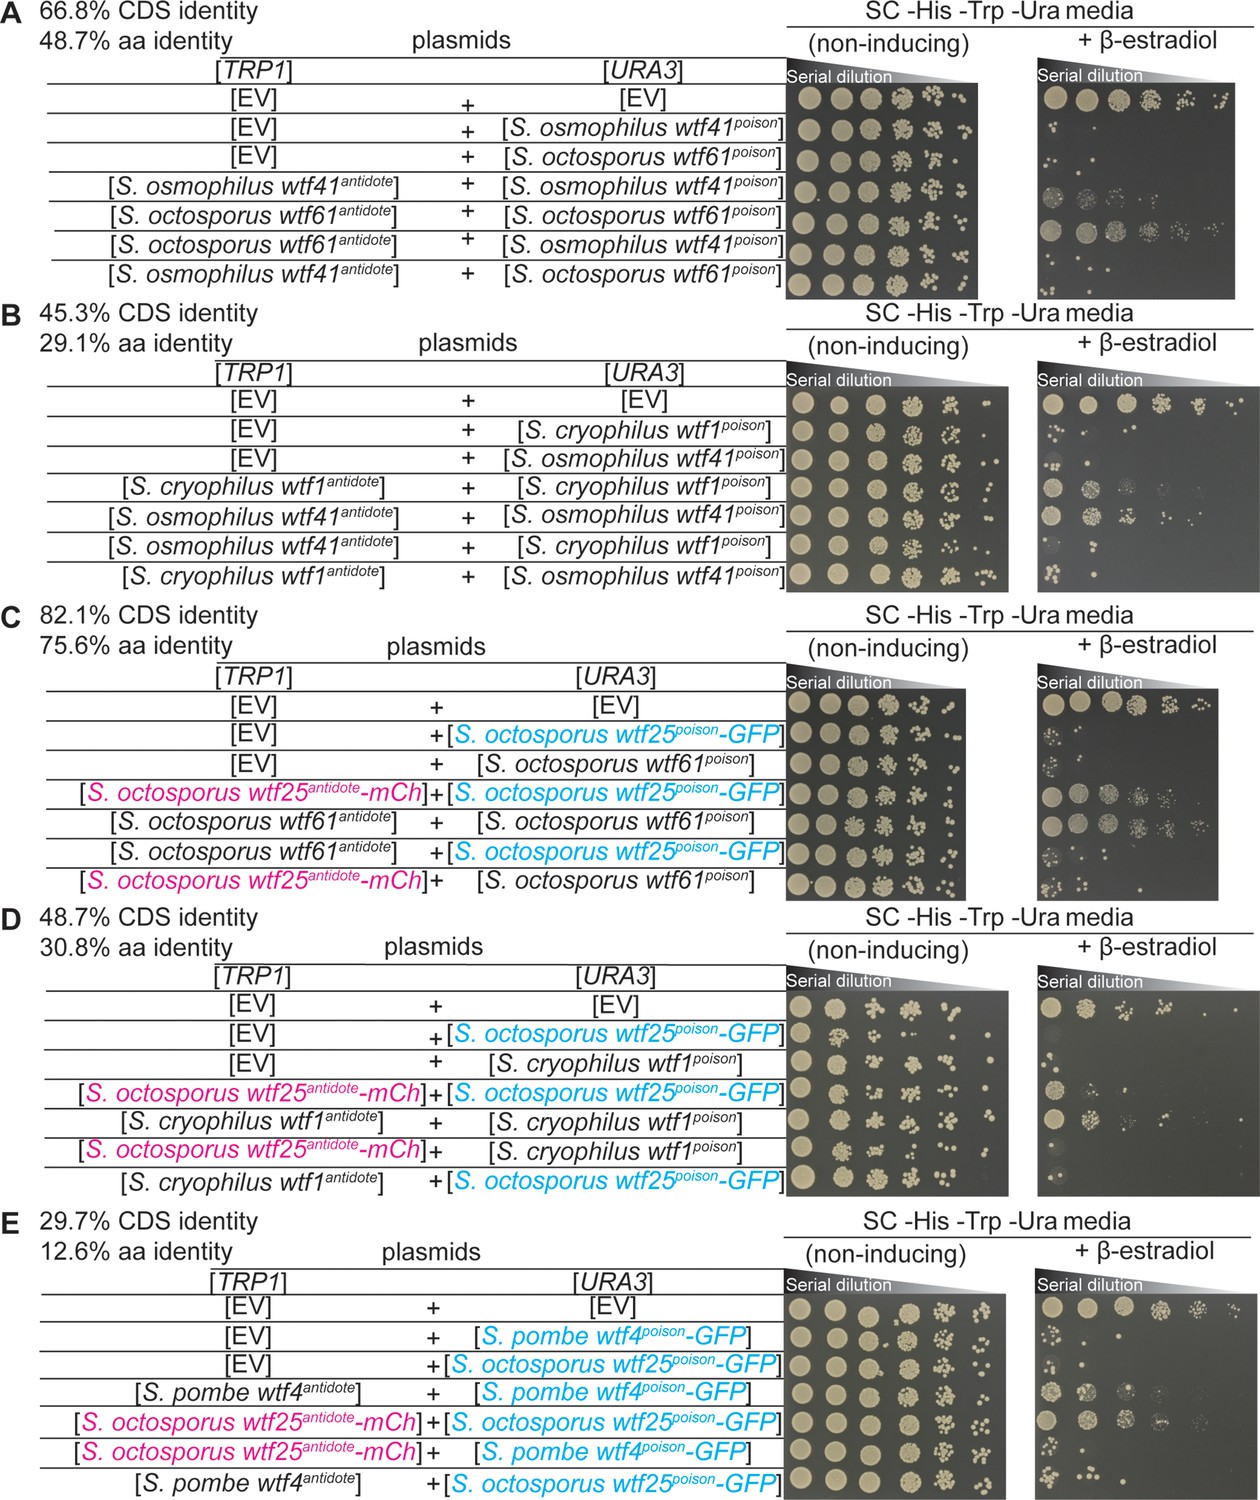
Non-cognate Wtfantidotes fail to rescue cells from Wtfpoisons.
Spot assay of serial dilutions of Saccharomyces cerevisiae cells on non-inducing (SC -His -Trp -Ura) and inducing (SC -His -Trp -Ura+500 nM β-estradiol) media. Each strain contains [TRP1] and [URA3] ARS CEN plasmids that are either empty (EV) or carry the indicated β-estradiol inducible Wtfpoison and wtfantidote alleles. (A) Schizosaccharomyces octosporus wtf61 and S. osmophilus wtf41, (B) S. cryophilus wtf1 and S. osmophilus wtf41, (C) S. octosporus wtf61 and S. octosporus wtf25, (D) S. cryophilus wtf1 and S. octosporus wtf25, and (E) S. pombe wtf4 and S. octosporus wtf25. In (C–E), the Wtf25poison protein was tagged with GFP, and the Wtf25antidote protein was tagged with mCherry. The percent identity between the coding sequences of the wtfpoison alleles and the percent amino acid identity shared by the Wtfpoison proteins are shown at the top of each panel. The dilution factor for all plates is 0.2 starting at OD = 1.
Figure 7—figure supplement 3
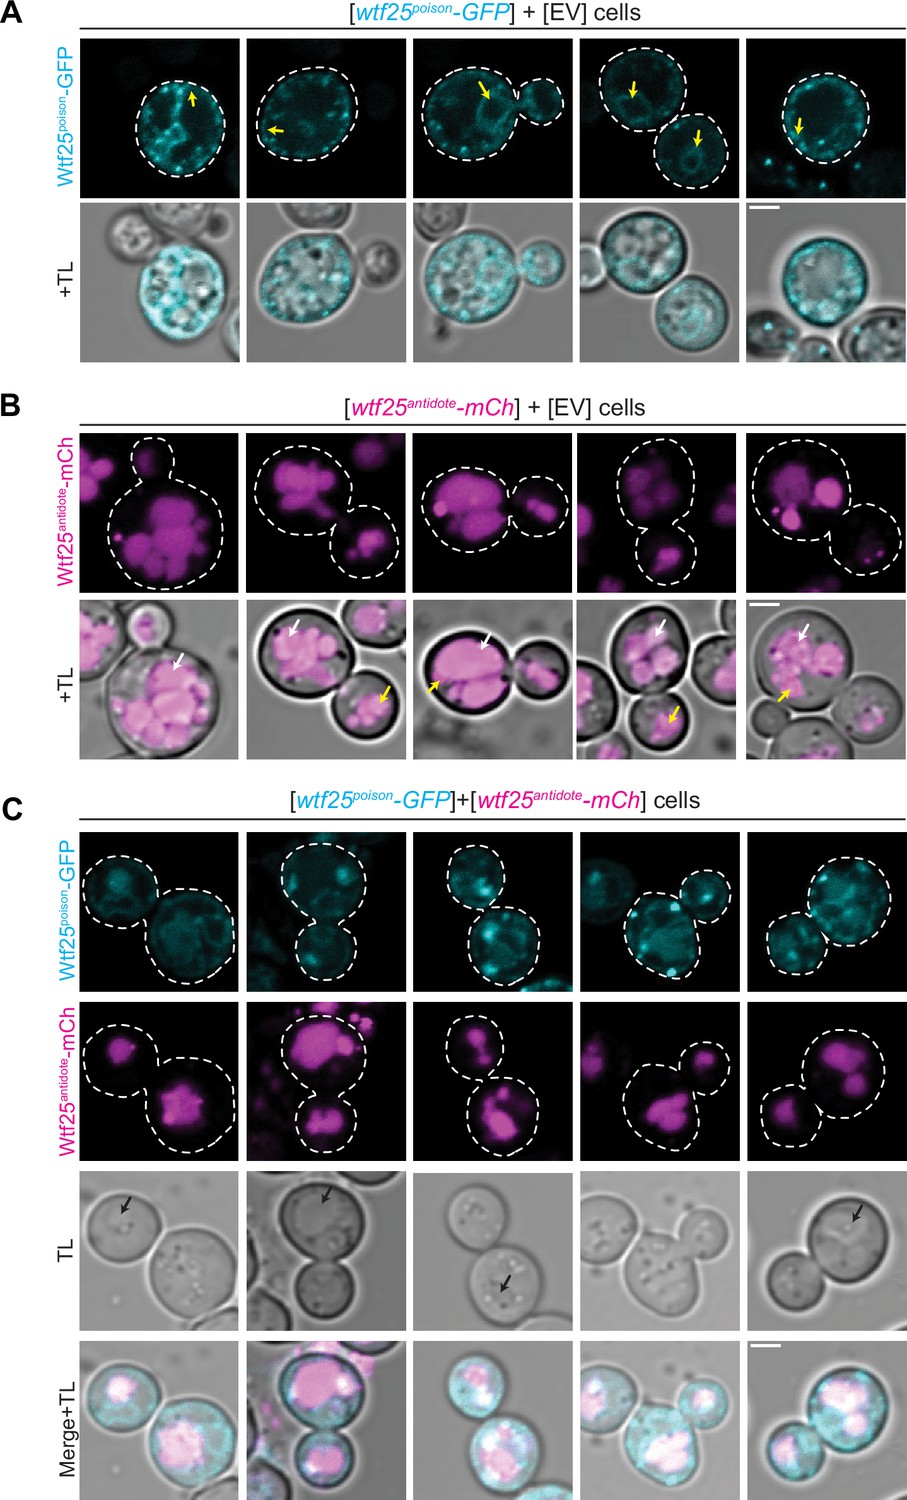
The distribution of Schizosaccharomyces octosporus Wtf25 proteins is similar to S. pombe Wtf4 proteins.
(A) Images of cells carrying a [URA3] plasmid with β-estradiol inducible S. octosporus wtf25poison-GFP. Wtf25poison-GFP signal is distributed in the cytoplasm, with potential endoplasmic reticulum localization (yellow arrows). (B) Images of cells carrying a [TRP1] plasmid with β-estradiol inducible S. octosporus wtf25antidote-mCherry (magenta). Wtf25antidote-mCherry signal can be observed within vacuoles (white arrows) and as large aggregates (yellow arrows). (C) Images of cells carrying a [URA3] plasmid with β-estradiol inducible S. octosporus wtf25poison-GFP (cyan) and [TRP1] plasmid with β-estradiol inducible S. octosporus wtf25antidote-mCherry (magenta). There is colocalization of Wtf25poison-GFP and Wtf25antidote-mCherry signal within vacuoles (black arrows). In all the experiments, the cells were imaged approximately 4 hr after induction with 500 nM β-estradiol. TL = transmitted light. Scale bars represent 2 µm. All images were captured with the same settings. Images in panel A are not shown at the same brightness and contrast as panels B and C to better visualize the signal.
Figure 8
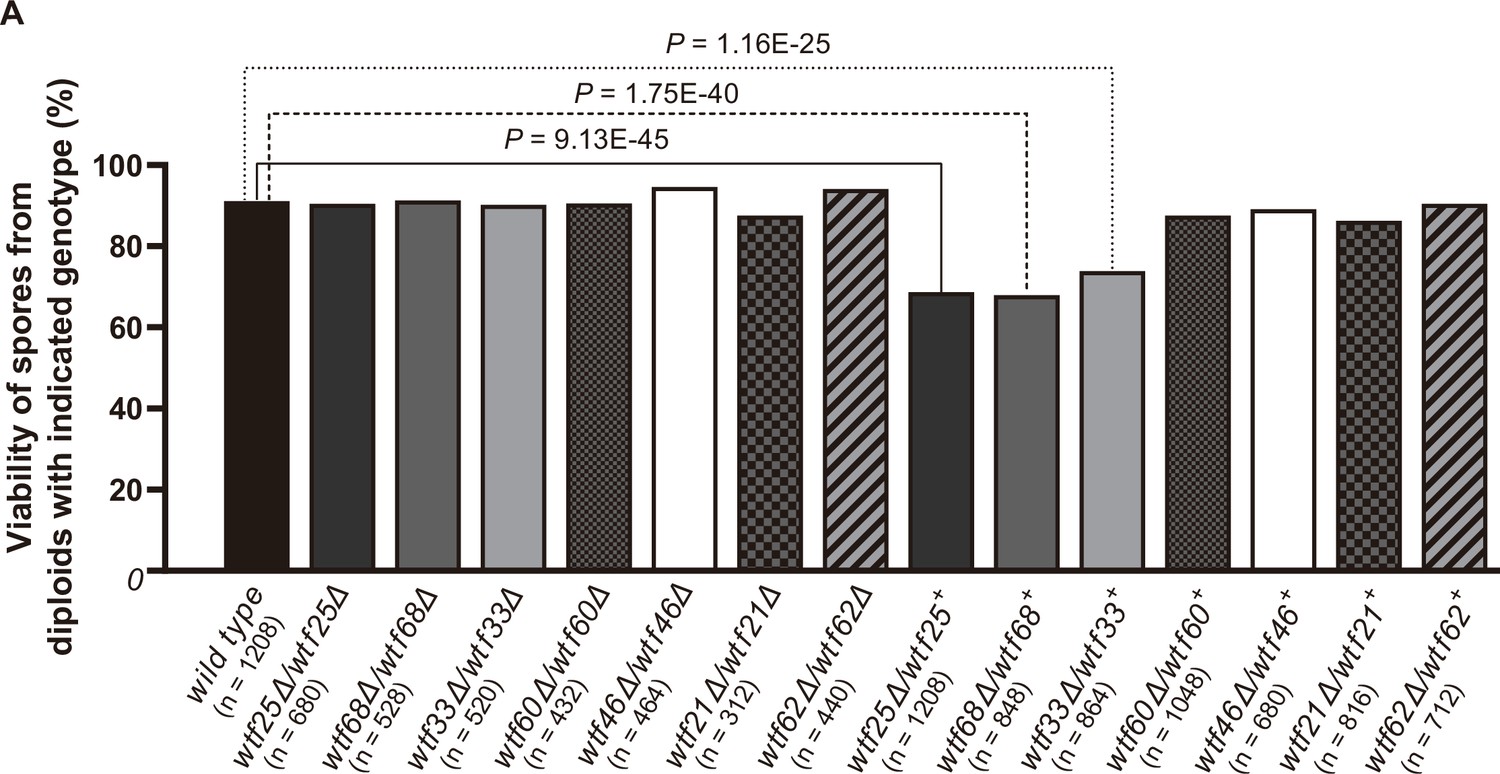
Three Schizosaccharomyces octosporus wtf genes, when individually deleted, caused spore viability loss in heterozygous crosses but not in homozygous crosses.
Deletion mutants of seven S. octosporus wtf genes were obtained, and crosses were performed. Heterozygous deletion cross but not homozygous deletion cross of wtf25, wtf68, or wtf33 resulted in significant spore viability loss. Spore viability was measured using octad dissection analysis (see Materials and methods). Representative octads are shown in Figure 9, Figure 9—figure supplements 1–6 and Figure 8 and Figure 9—source data 2. Numerical data are provided in Supplementary file 2b. p-Values (Fisher’s exact test) for crosses with >5% spore viability reduction compared to the wild-type control are shown and calculated in Figure 8—source data 1.
-
Figure 8—source data 1
Octad analysis tables.
Summary of spore viability is shown in Table 1, and Tables 2–8 test the significance of the difference of spore viability by Fisher’s exact test.
- https://cdn.elifesciences.org/articles/81149/elife-81149-fig8-data1-v1.xlsx
-
Figure 8—source data 2
Octad dissection raw data.
Wild-type cross raw data files are shown as a pdf file with each cross in the upper left of the images.
- https://cdn.elifesciences.org/articles/81149/elife-81149-fig8-data2-v1.pdf
Figure 9 with 6 supplements
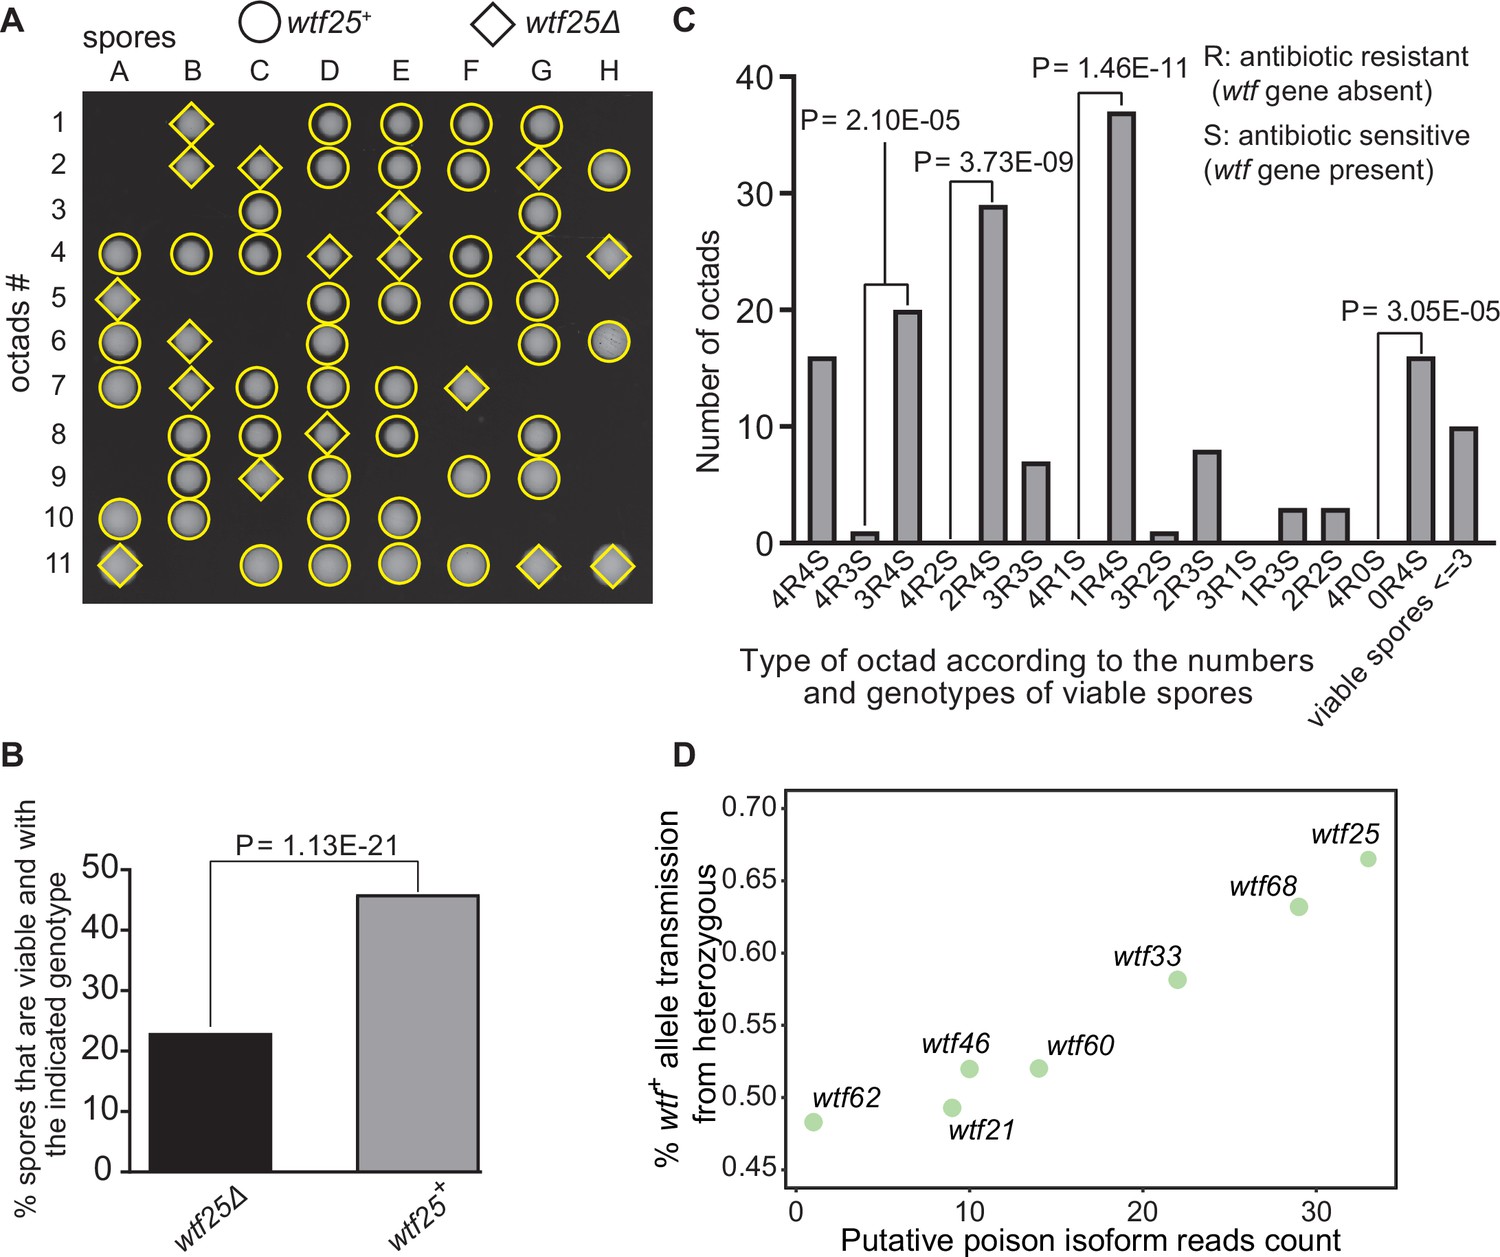
Some Schizosaccharomyces octosporus wtf genes cause meiotic drive.
(A) Representative octads dissected from asci produced from a wtf25 heterozygous deletion cross. The labels A–H indicate the 8 spores dissected from each ascus, and the labels 1–11 indicate the 11 asci analyzed. The genotypes of clones were determined by replica plating onto antibiotic-containing plates. Raw data of all octads can be found in Figure 9—source data 2. (B) The percentages of spores that were viable and with indicated genotypes produced by wtf25+/wtf25Δ cross. The p-value was calculated using exact binomial test, and numerical data are provided in Figure 9—source data 1. (C) Classification of octads derived from wtf25+/wtf25Δ cross according to the number of viable spores with and without a wtf gene deletion. The p-values were calculated using the exact binomial test. The p-values are only displayed if a pair of octad types have more than five octads in total, as p-values cannot reach the significance threshold if the total number of octads ≤5. (D) Correlation between transmission distortion ratio and poison isoform expression level. The transmission distortion ratio represents the proportion of wtf containing spores in total viable spores produced by a wtf+/wtfΔ heterozygote, and the read counts are those shown in Figure 2—figure supplement 3. Numerical data of transmission distortion ratio of each wtf gene can be found in Supplementary files 2b-h.
-
Figure 9—source data 1
Numerical data of the octad dissection analysis of wtf25 heterozygous deletion cross.
Octad analysis table with spore viability of wtf25+/wtf25Δ heterozygous cross can be found in Table 1.1. Corresponding octad genotypes are found in Table 1.2. Spore viability data of homozygous diploid are in Table 2. Exact binomial test was performed in Table 3.1, and the Fisher’s exact test is calculated in Table 3.2.
- https://cdn.elifesciences.org/articles/81149/elife-81149-fig9-data1-v1.xlsx
-
Figure 9—source data 2
wtf25 heterozygous diploid octad dissection raw data.
wtf25+/wtf25Δ heterozygous diploid raw data files are shown as a pdf file with each cross in the upper left of the images.
- https://cdn.elifesciences.org/articles/81149/elife-81149-fig9-data2-v1.pdf
-
Figure 9—source data 3
wtf25 homozygous diploid octad dissection raw data.
wtf25Δ/wtf25Δ homozygous diploid raw data files are shown as a pdf file with each cross in the upper left of the images.
- https://cdn.elifesciences.org/articles/81149/elife-81149-fig9-data3-v1.pdf
Figure 9—figure supplement 1
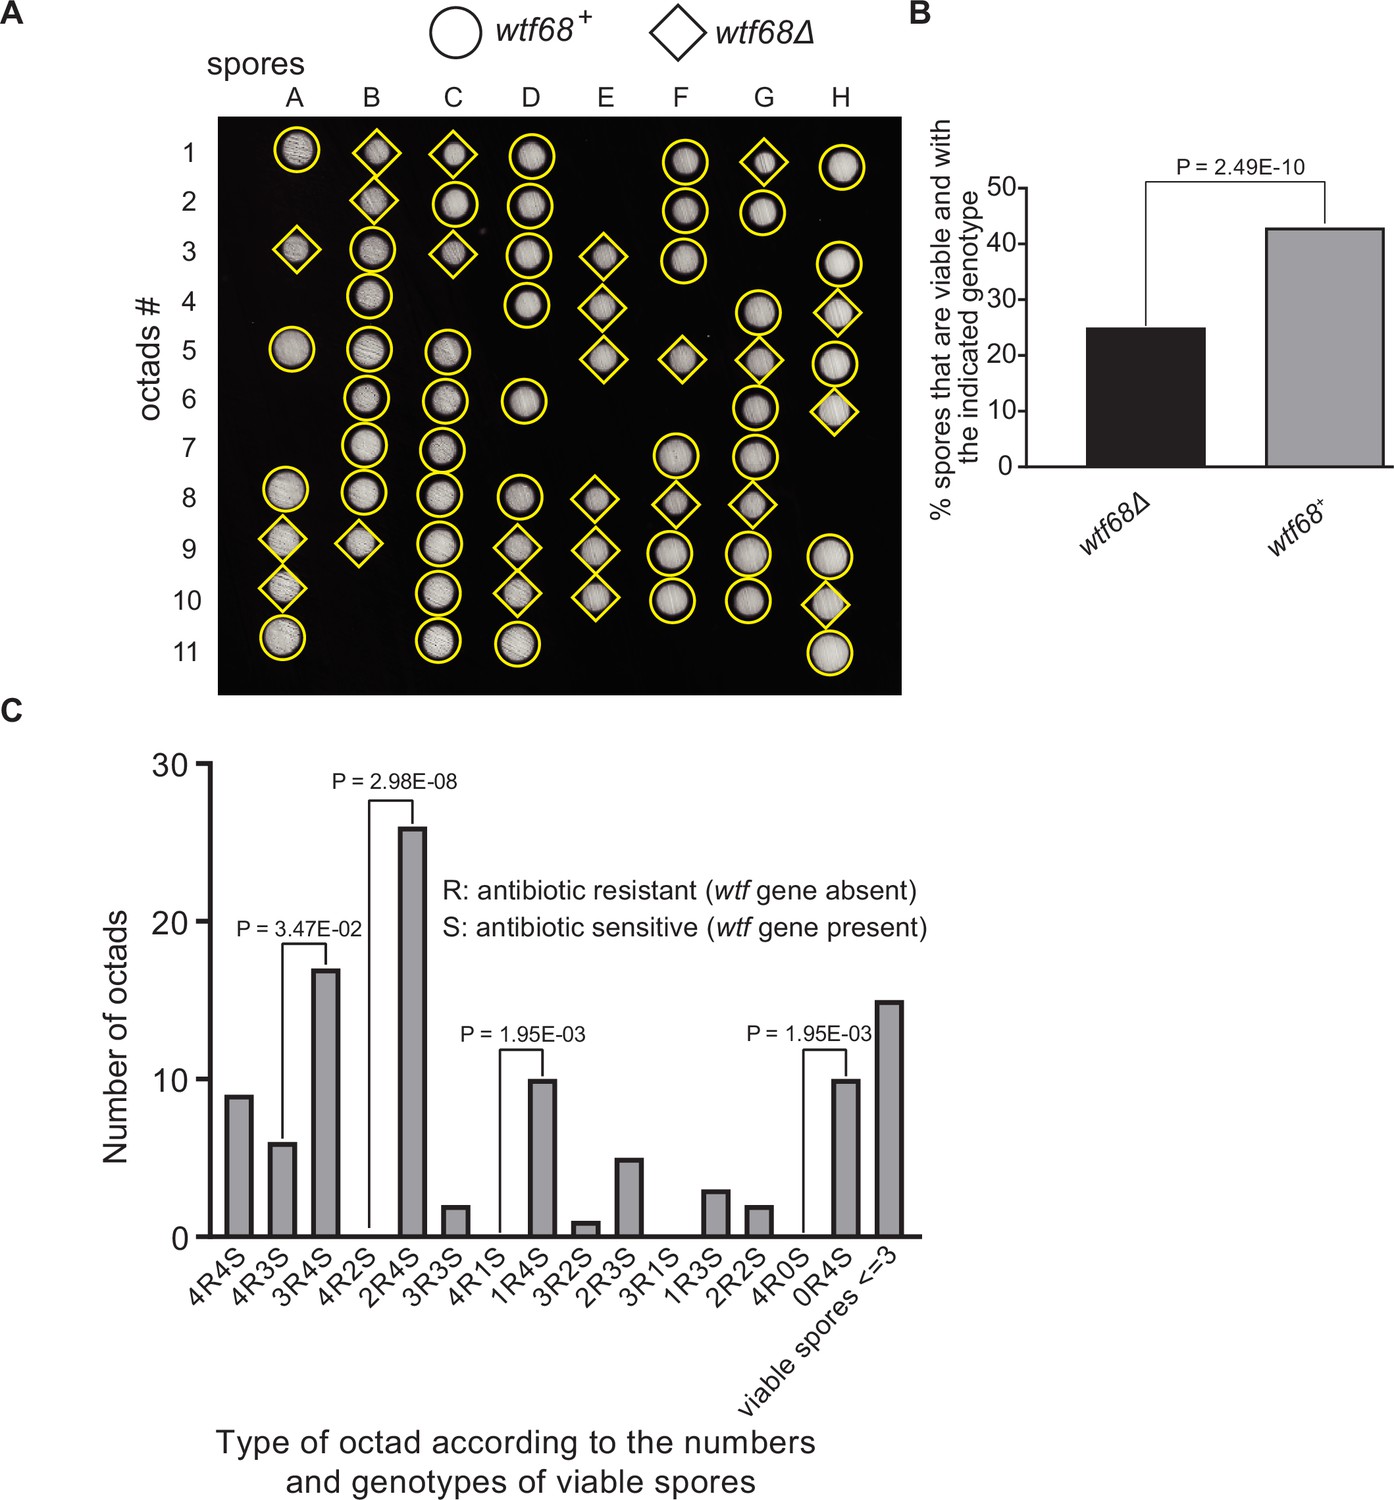
Octad dissection analysis of wtf68 heterozygous deletion cross.
(A) Representative octads dissected from asci produced from a wtf68 heterozygous deletion cross. The labels A–H indicate the 8 spores dissected from each ascus, and the labels 1–11 indicate the 11 asci analyzed. The genotypes of clones were determined by replica plating. Raw data of all octads can be found in Figure 9—figure supplement 1—source data 2. (B) The percentages of spores that were viable and with indicated genotypes in wtf68+/wtf68Δ cross. The p-value was calculated using exact binomial test, and numerical data are provided in Figure 9—figure supplement 1—source data 1. (C) Classification of octads derived from wtf68+/wtf68Δ cross according to the number of viable spores with and without a wtf gene deletion. The p-values were calculated using the exact binomial test. The p-values are only displayed if a pair of octad types have more than five octads in total, as p-values cannot reach the significance threshold if the total number of octads ≤5.
-
Figure 9—figure supplement 1—source data 1
Numerical data of the octad dissection analysis of wtf68 heterozygous deletion cross.
Raw data file with spore viability of wtf68+/wtf68Δ heterozygous cross can be found in Table 1.1. Corresponding octad genotypes are found in Table 1.2. Spore viability data of homozygous diploid are in Table 2. Exact binomial test was performed in Table 3.1, and the Fisher’s exact test is calculated in Table 3.2.
- https://cdn.elifesciences.org/articles/81149/elife-81149-fig9-figsupp1-data1-v1.xlsx
-
Figure 9—figure supplement 1—source data 2
wtf68 heterozygous diploid octad dissection raw data.
wtf68+/wtf68Δ heterozygous diploid raw data files are shown as a pdf file with each cross in the upper left of the images.
- https://cdn.elifesciences.org/articles/81149/elife-81149-fig9-figsupp1-data2-v1.pdf
-
Figure 9—figure supplement 1—source data 3
wtf68 homozygous diploid octad dissection raw data.
wtf68Δ/wtf68Δ homozygous diploid raw data files are shown as a pdf file with each cross in the upper left of the images.
- https://cdn.elifesciences.org/articles/81149/elife-81149-fig9-figsupp1-data3-v1.pdf
Figure 9—figure supplement 2
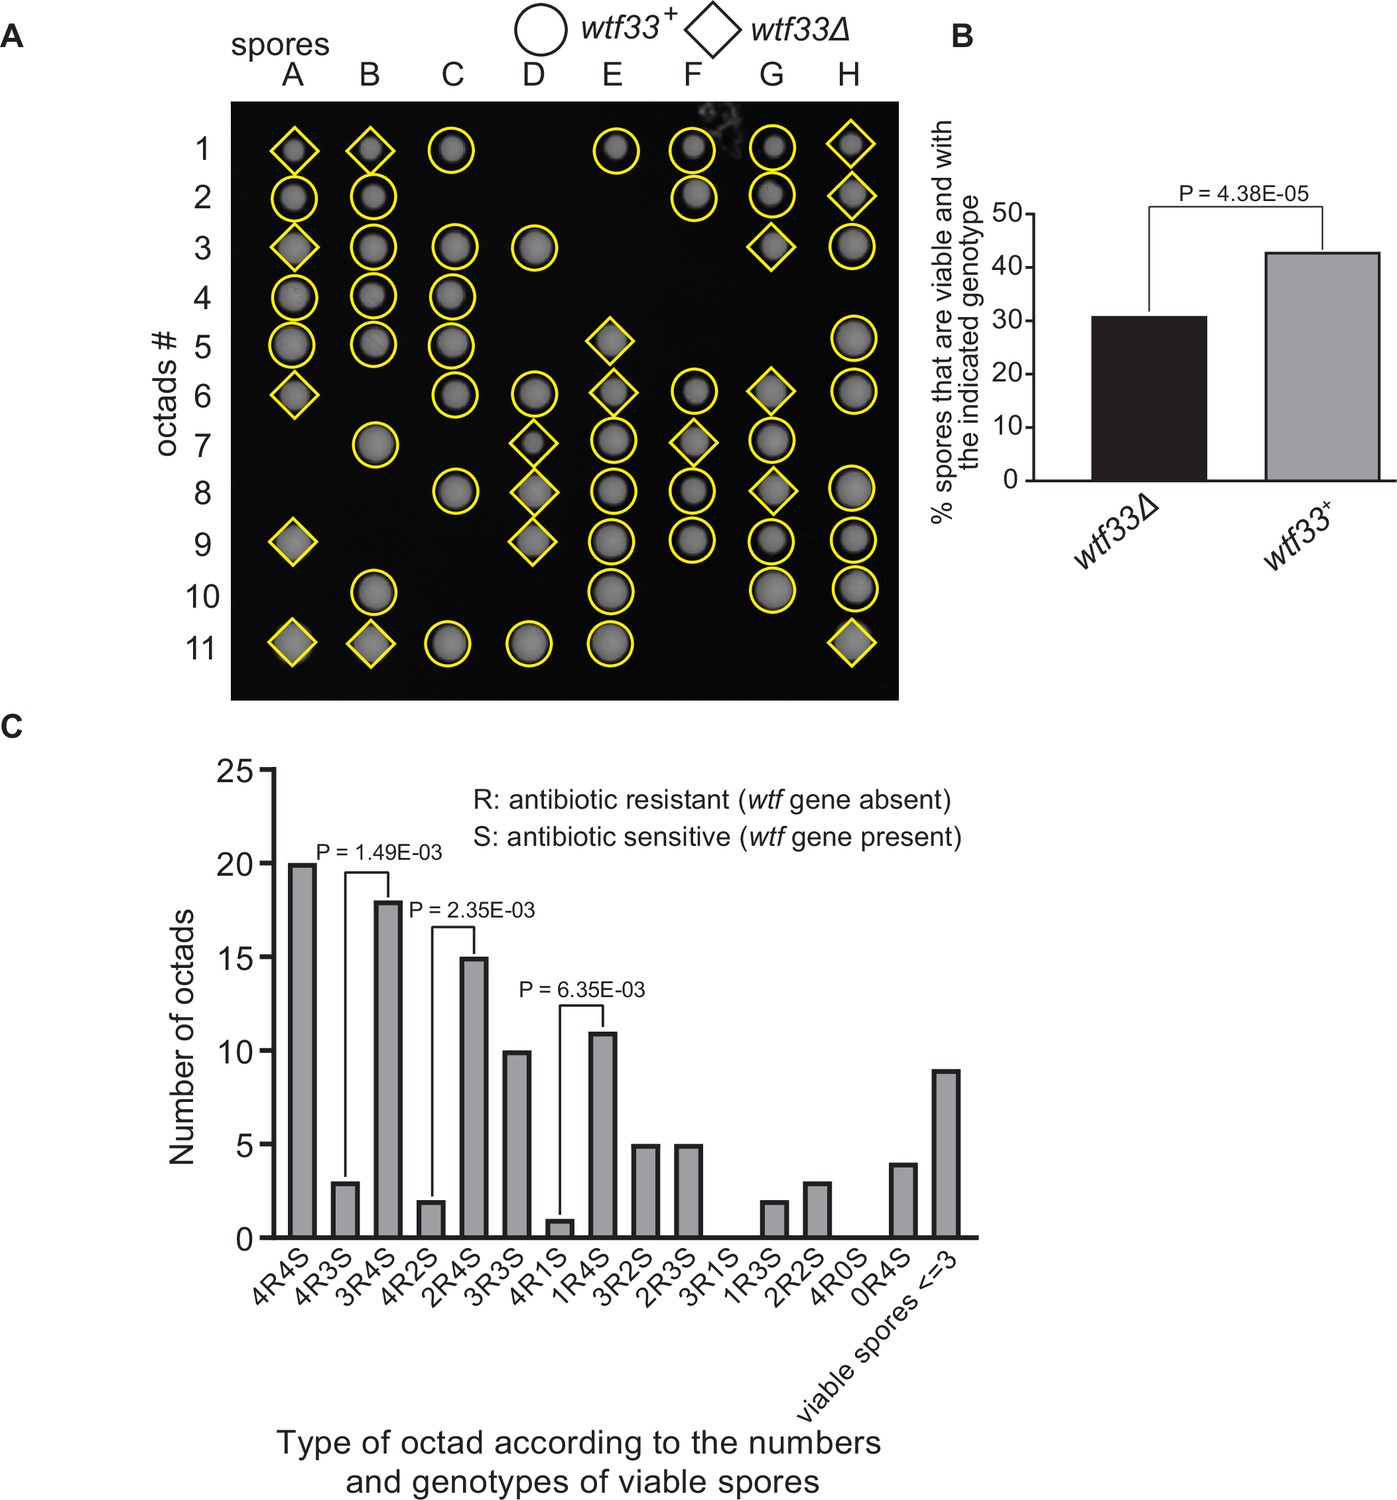
Octad dissection analysis of wtf33 heterozygous deletion cross.
(A) Representative octads dissected from asci produced from a wtf33 heterozygous deletion cross. The labels A–H indicate the 8 spores dissected from each ascus, and the labels 1–11 indicate the 11 asci analyzed. The genotypes of clones were determined by replica plating. Raw data of all octads can be found in Figure 9—figure supplement 2—source data 2. (B) The percentages of spores that were viable and with indicated genotypes in wtf33+/wtf33Δ cross. The p-value was calculated using exact binomial test, and numerical data are provided in Figure 9—figure supplement 2—source data 1. (C) Classification of octads derived from wtf33+/wtf33Δ cross according to the number of viable spores with and without a wtf gene deletion. The p-values were calculated using the exact binomial test. The p-values are only displayed if a pair of octad types have more than five octads in total, as p-values cannot reach the significance threshold if the total number of octads ≤5.
-
Figure 9—figure supplement 2—source data 1
Numerical data of the octad dissection analysis of wtf33 heterozygous deletion cross.
Raw data file with spore viability of wtf33+/wtf33Δ heterozygous cross can be found in Table 1.1. Corresponding octad genotypes are found in Table 1.2. Spore viability data of homozygous diploid are in Table 2. Exact binomial test was performed in Table 3.1, and the Fisher’s exact test is calculated in Table 3.2.
- https://cdn.elifesciences.org/articles/81149/elife-81149-fig9-figsupp2-data1-v1.xlsx
-
Figure 9—figure supplement 2—source data 2
wtf33 heterozygous diploid octad dissection raw data.
wtf33+/wtf33Δ heterozygous diploid raw data files are shown as a pdf file with each cross in the upper left of the images.
- https://cdn.elifesciences.org/articles/81149/elife-81149-fig9-figsupp2-data2-v1.pdf
-
Figure 9—figure supplement 2—source data 3
wtf33 homozygous diploid octad dissection raw data.
wtf33Δ/wtf33Δ homozygous diploid raw data files are shown as a pdf file with each cross in the upper left of the images.
- https://cdn.elifesciences.org/articles/81149/elife-81149-fig9-figsupp2-data3-v1.pdf
Figure 9—figure supplement 3
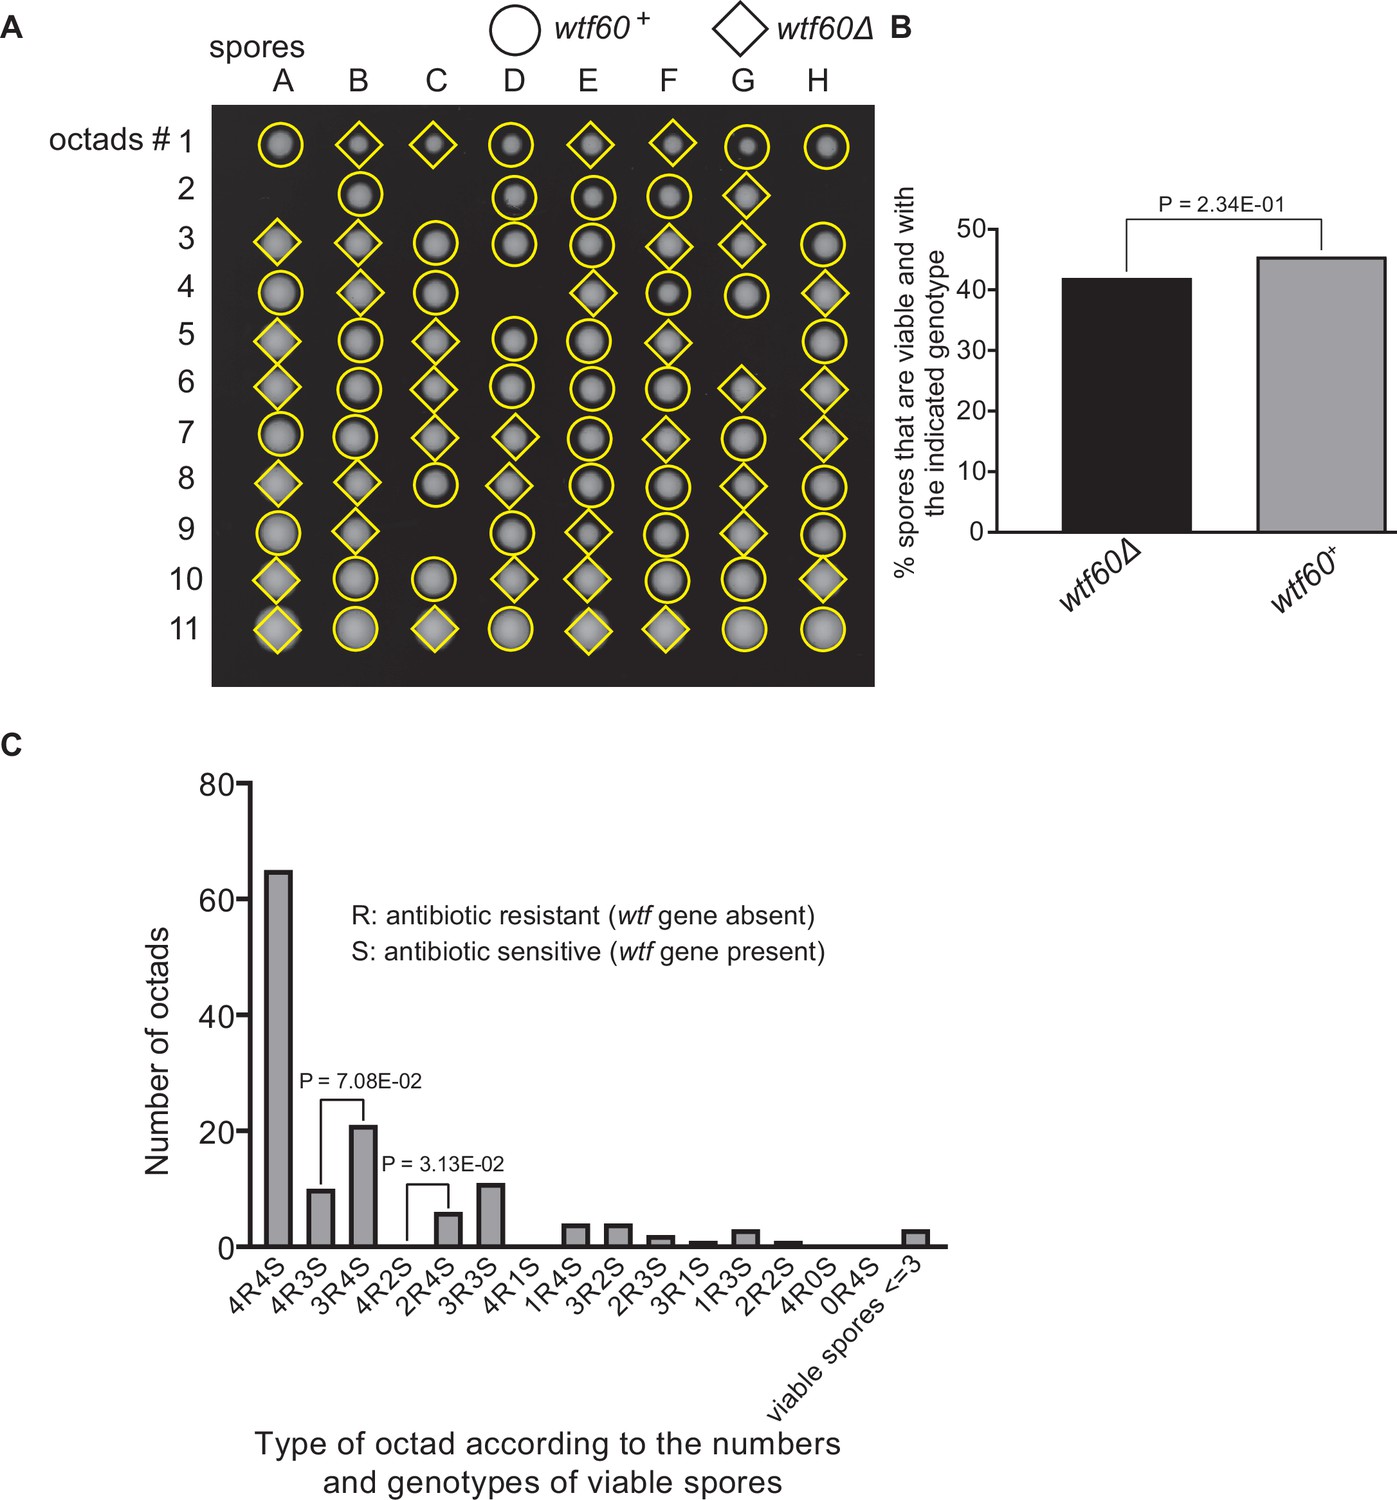
Octad dissection analysis of wtf60 heterozygous deletion cross.
(A) Representative octads dissected from asci produced from a wtf60 heterozygous deletion cross. The labels A–H indicate the 8 spores dissected from each ascus, and the labels 1–11 indicate the 11 asci analyzed. The genotypes of clones were determined by replica plating. Raw data of all octads can be found in Figure 9—figure supplement 4—source data 2. (B) The percentage of spores that were viable and with indicated genotypes in wtf60+/wtf60Δ cross. The p-value was calculated using exact binomial test, and numerical data are provided in Figure 9—figure supplement 4—source data 1. (C) Classification of octads derived from wtf60+/wtf60Δ cross according to the number of viable spores with and without a wtf gene deletion. The p-values were calculated using the exact binomial test. The p-values are only displayed if a pair of octad types have more than five octads in total, as P values cannot reach the significance threshold if the total number of octads ≤5.
-
Figure 9—figure supplement 3—source data 1
Numerical data of the octad dissection analysis of wtf60 heterozygous deletion cross.
Raw data file with spore viability of wtf60+/wtf60Δ heterozygous cross can be found in Table 1.1. Corresponding octad genotypes are found in Table 1.2. Spore viability data of homozygous diploid are in Table 2. Exact binomial test was performed in Table 3.1, and the Fisher’s exact test is calculated in Table 3.2.
- https://cdn.elifesciences.org/articles/81149/elife-81149-fig9-figsupp3-data1-v1.xlsx
-
Figure 9—figure supplement 3—source data 2
wtf60 heterozygous diploid octad dissection raw data.
wtf60+/wtf60Δ heterozygous diploid raw data files are shown as a pdf file with each cross in the upper left of the images.
- https://cdn.elifesciences.org/articles/81149/elife-81149-fig9-figsupp3-data2-v1.pdf
-
Figure 9—figure supplement 3—source data 3
wtf60 homozygous diploid octad dissection raw data.
wtf60Δ/ wtf60Δ homozygous diploid raw data files are shown as a pdf file with each cross in the upper left of the images.
- https://cdn.elifesciences.org/articles/81149/elife-81149-fig9-figsupp3-data3-v1.pdf
Figure 9—figure supplement 4
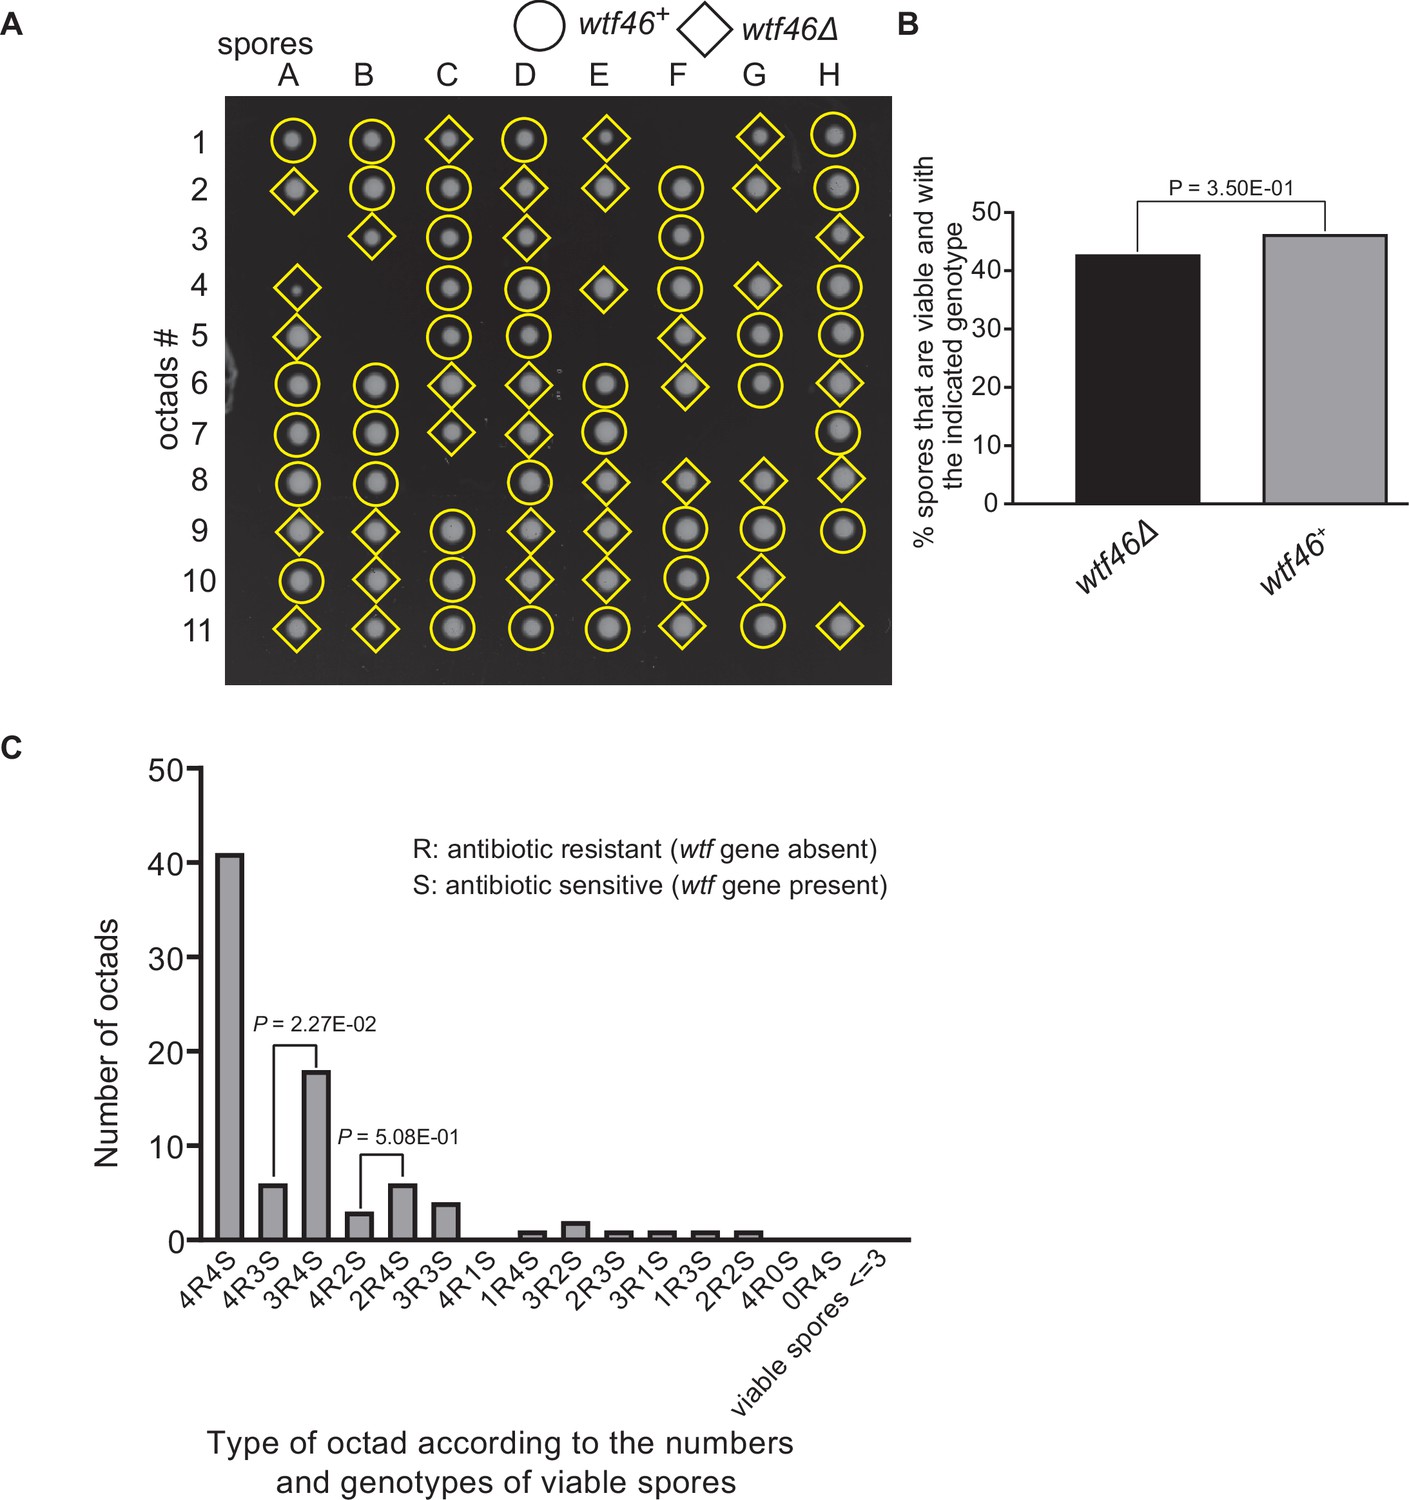
Octad dissection analysis of wtf46 heterozygous deletion cross.
(A) Representative octads dissected from asci produced from a wtf46 heterozygous deletion cross. The labels A–H indicate the 8 spores dissected from each ascus, and the labels 1–11 indicate the 11 asci analyzed. The genotypes of clones were determined by replica plating. Raw data of all octads can be found in Figure 9—figure supplement 3—source data 2. (B) The percentage of spores that were viable and with indicated genotypes in wtf46+/wtf46Δ cross. The p-value was calculated using exact binomial test, and numerical data are provided in Figure 9—figure supplement 3—source data 1. (C) Classification of octads derived from wtf46+/wtf46Δ cross according to the number of viable spores with and without a wtf gene deletion. The p-values were calculated using the exact binomial test. The p-values are only displayed if a pair of octad types have more than five octads in total, as p-values cannot reach the significance threshold if the total number of octads ≤5.
-
Figure 9—figure supplement 4—source data 1
Numerical data of the octad dissection analysis of wtf46 heterozygous deletion cross.
Raw data file with spore viability of wtf46+/wtf46Δ heterozygous cross can be found in Table 1.1. Corresponding octad genotypes are found in Table 1.2. Spore viability data of homozygous diploid are in Table 2. Exact binomial test was performed in Table 3.1, and the Fisher’s exact test is calculated in Table 3.2.
- https://cdn.elifesciences.org/articles/81149/elife-81149-fig9-figsupp4-data1-v1.xlsx
-
Figure 9—figure supplement 4—source data 2
wtf46 heterozygous diploid octad dissection raw data.
wtf46+/wtf46Δ heterozygous diploid raw data files are shown as a pdf file with each cross in the upper left of the images.
- https://cdn.elifesciences.org/articles/81149/elife-81149-fig9-figsupp4-data2-v1.pdf
-
Figure 9—figure supplement 4—source data 3
wtf46 homozygous diploid octad dissection raw data.
wtf46Δ/wtf46Δ homozygous diploid raw data files are shown as a pdf file with each cross in the upper left of the images.
- https://cdn.elifesciences.org/articles/81149/elife-81149-fig9-figsupp4-data3-v1.pdf
Figure 9—figure supplement 5
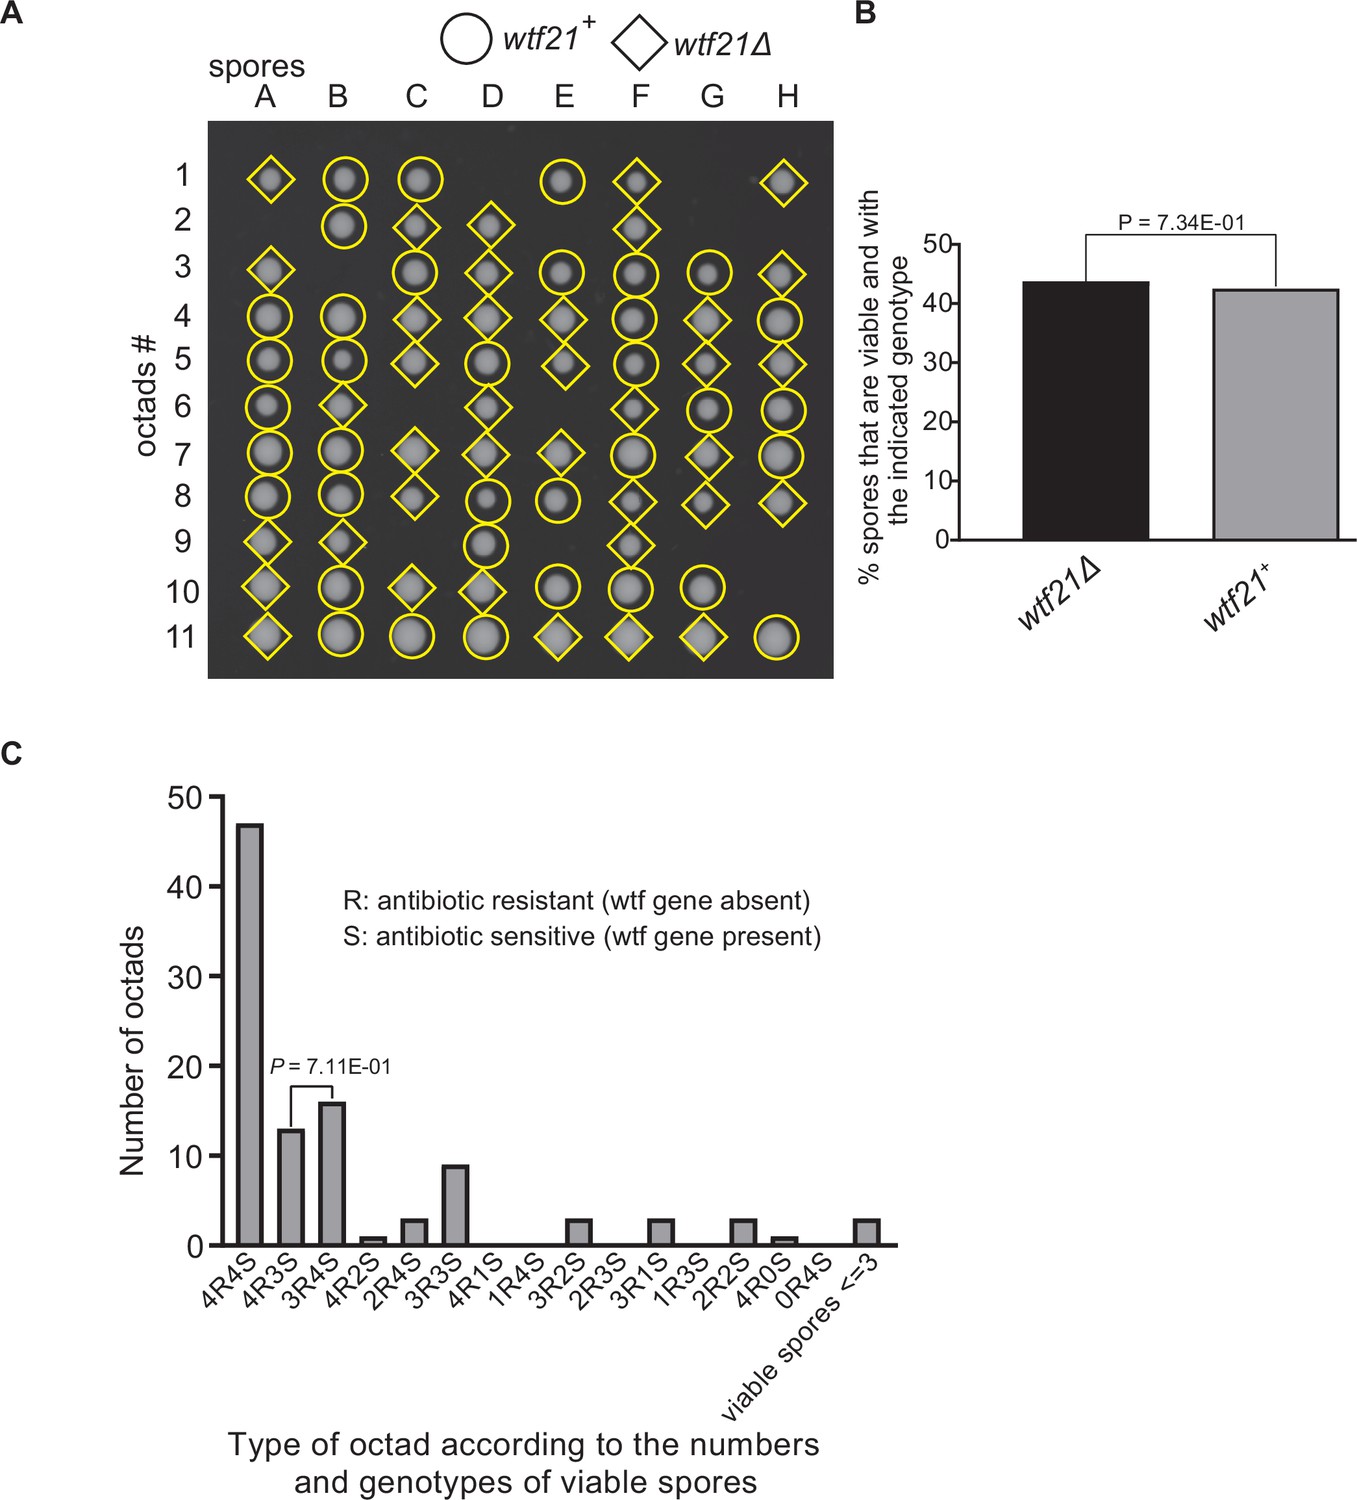
Octad dissection analysis of wtf21 heterozygous deletion cross.
(A) Representative octads dissected from asci produced from a wtf21 heterozygous diploid. The coordinates A–H stand for 8 spores dissected from 1 ascus, and rows 1–11 represent 11 octad asci analyzed. The genotypes of clones were determined by replica plating. Raw data of all octads can be found in Figure 9—figure supplement 6—source data 1. (B) The percentage of spores that were viable and with indicated genotypes in wtf21+/wtf21Δ cross. The p-value was calculated using exact binomial test, and numerical data are provided in Figure 9—figure supplement 6—source data 1. (C) Classification of octads derived from wtf21+/wtf21Δ cross according to the number of viable spores with and without a wtf gene deletion. The p-values were calculated using the exact binomial test. The p-values are only displayed if a pair of octad types have more than five octads in total, as p-values cannot reach the significance threshold if the total number of octads ≤5.
-
Figure 9—figure supplement 5—source data 1
Numerical data of the octad dissection analysis of wtf21 heterozygous deletion cross.
Raw data file with spore viability of wtf21+/wtf21Δ heterozygous cross can be found in Table 1.1. Corresponding octad genotypes are found in Table 1.2. Spore viability data of homozygous diploid are in Table 2. Exact binomial test was performed in Table 3.1, and the Fisher’s exact test is calculated in Table 3.2.
- https://cdn.elifesciences.org/articles/81149/elife-81149-fig9-figsupp5-data1-v1.xlsx
-
Figure 9—figure supplement 5—source data 2
wtf21 heterozygous diploid octad dissection raw data.
wtf21+/wtf21Δ heterozygous diploid raw data files are shown as a pdf file with each cross in the upper left of the images.
- https://cdn.elifesciences.org/articles/81149/elife-81149-fig9-figsupp5-data2-v1.pdf
-
Figure 9—figure supplement 5—source data 3
wtf21 homozygous diploid octad dissection raw data.
wtf21Δ/wtf21Δ homozygous diploid raw data files are shown as a pdf file with each cross in the upper left of the images.
- https://cdn.elifesciences.org/articles/81149/elife-81149-fig9-figsupp5-data3-v1.pdf
Figure 9—figure supplement 6
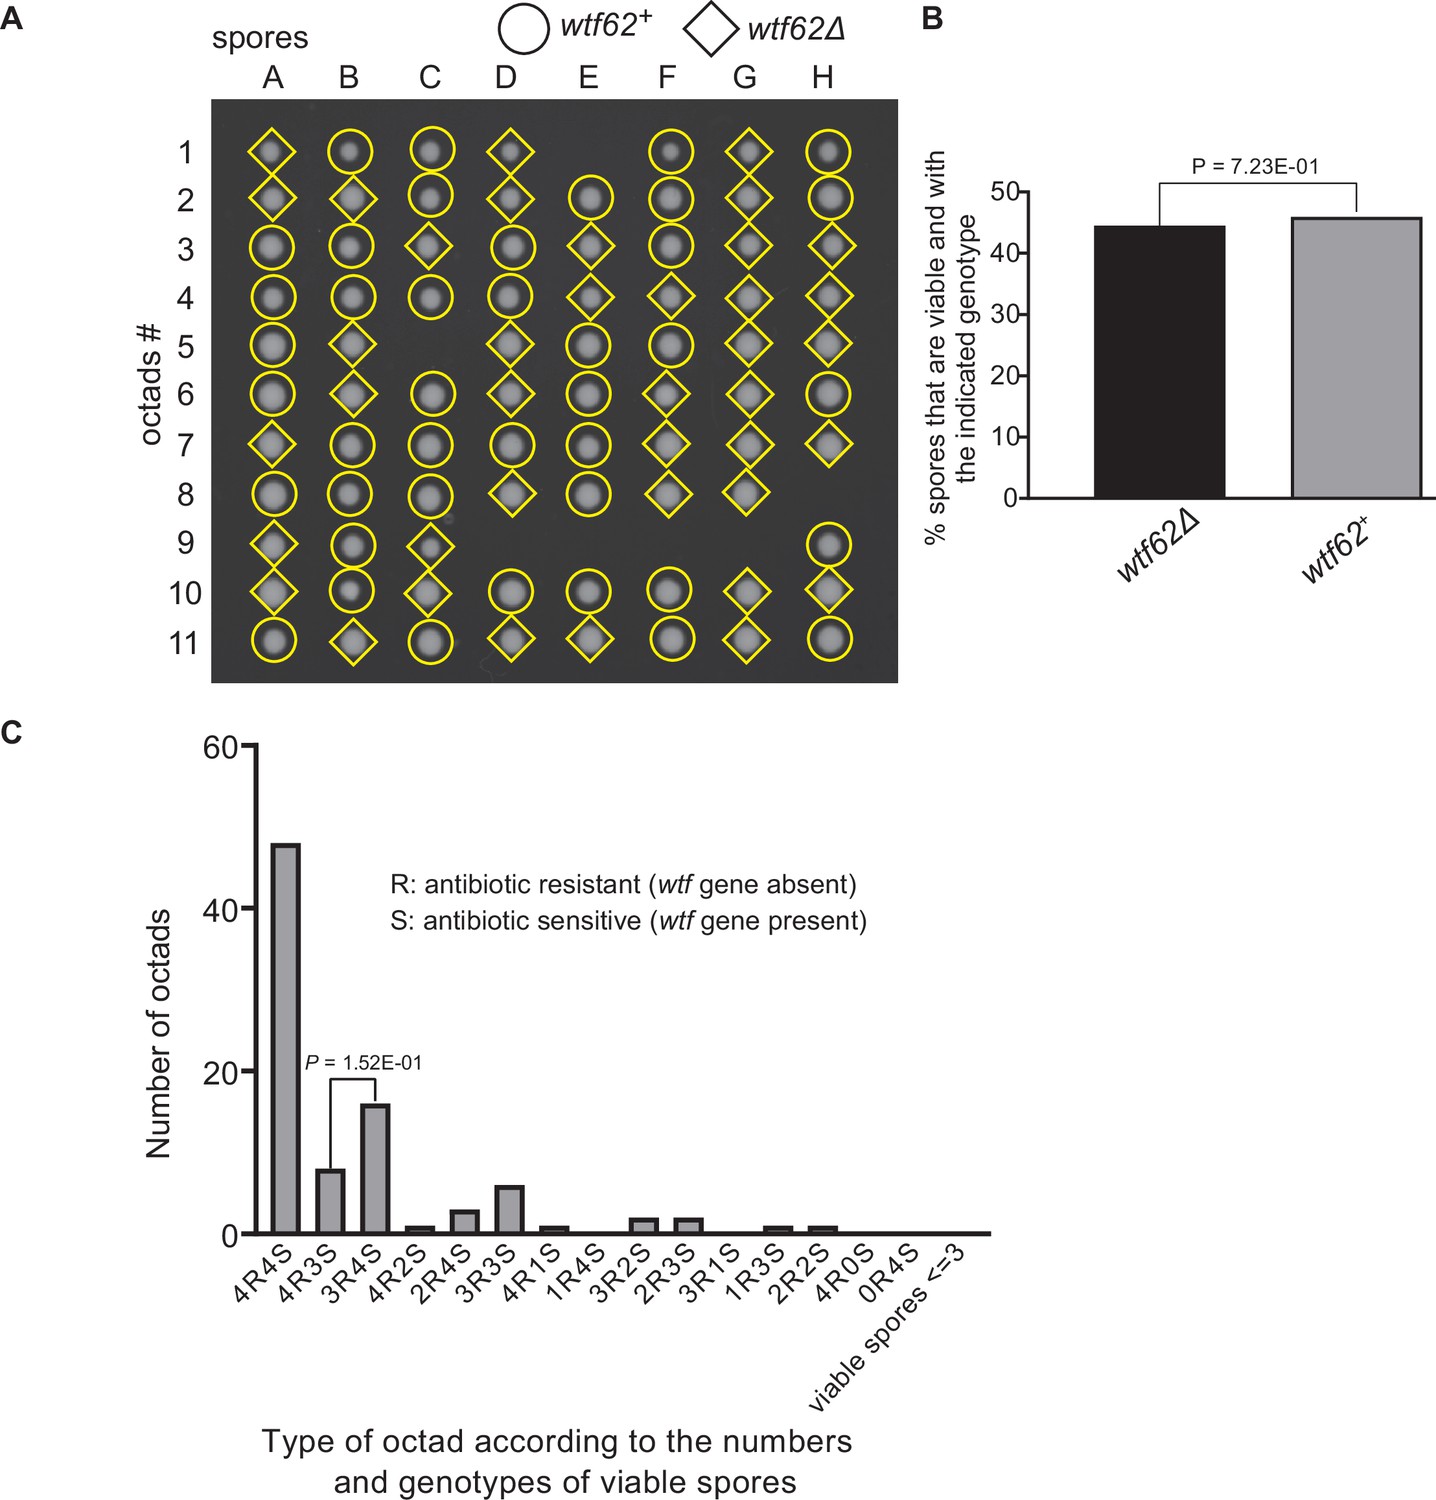
Octad dissection analysis of wtf62 heterozygous deletion cross.
(A) Representative octads dissected from asci produced from a wtf62 heterozygous deletion cross. The labels A–H indicate the 8 spores dissected from each ascus, and the labels 1–11 indicate the 11 asci analyzed. The genotypes of clones were determined by replica plating. Raw data of all octads can be found in Figure 9—figure supplement 6—source data 2. (B) The percentage of spores that were viable and with indicated genotypes in wtf62+/wtf62Δ cross. The p-value was calculated using exact binomial test, and numerical data are provided in Figure 9—figure supplement 6—source data 1. (C) Classification of octads derived from wtf62+/wtf62Δ cross according to the number of viable spores with and without a wtf gene deletion. The p-values were calculated using the exact binomial test. The p-values are only displayed if a pair of octad types have more than five octads in total, as p-values cannot reach the significance threshold if the total number of octads ≤5.
-
Figure 9—figure supplement 6—source data 1
Numerical data of the octad dissection analysis of wtf62 heterozygous deletion cross.
Raw data file with spore viability of wtf62+/wtf62Δ heterozygous cross can be found in Table 1.1. Corresponding octad genotypes are found in Table 1.2. Spore viability data of homozygous diploid are in Table 2. Exact binomial test was performed in Table 3.1, and the Fisher’s exact test is calculated in Table 3.2.
- https://cdn.elifesciences.org/articles/81149/elife-81149-fig9-figsupp6-data1-v1.xlsx
-
Figure 9—figure supplement 6—source data 2
wtf62 heterozygous diploid octad dissection raw data.
wtf62+/wtf62Δ heterozygous diploid raw data files are shown as a pdf file with each cross in the upper left of the images.
- https://cdn.elifesciences.org/articles/81149/elife-81149-fig9-figsupp6-data2-v1.pdf
-
Figure 9—figure supplement 6—source data 3
wtf62 homozygous diploid octad dissection raw data.
wtf62Δ/wtf62Δ homozygous diploid raw data files are shown as a pdf file with each cross in the upper left of the images.
- https://cdn.elifesciences.org/articles/81149/elife-81149-fig9-figsupp6-data3-v1.pdf
Figure 10
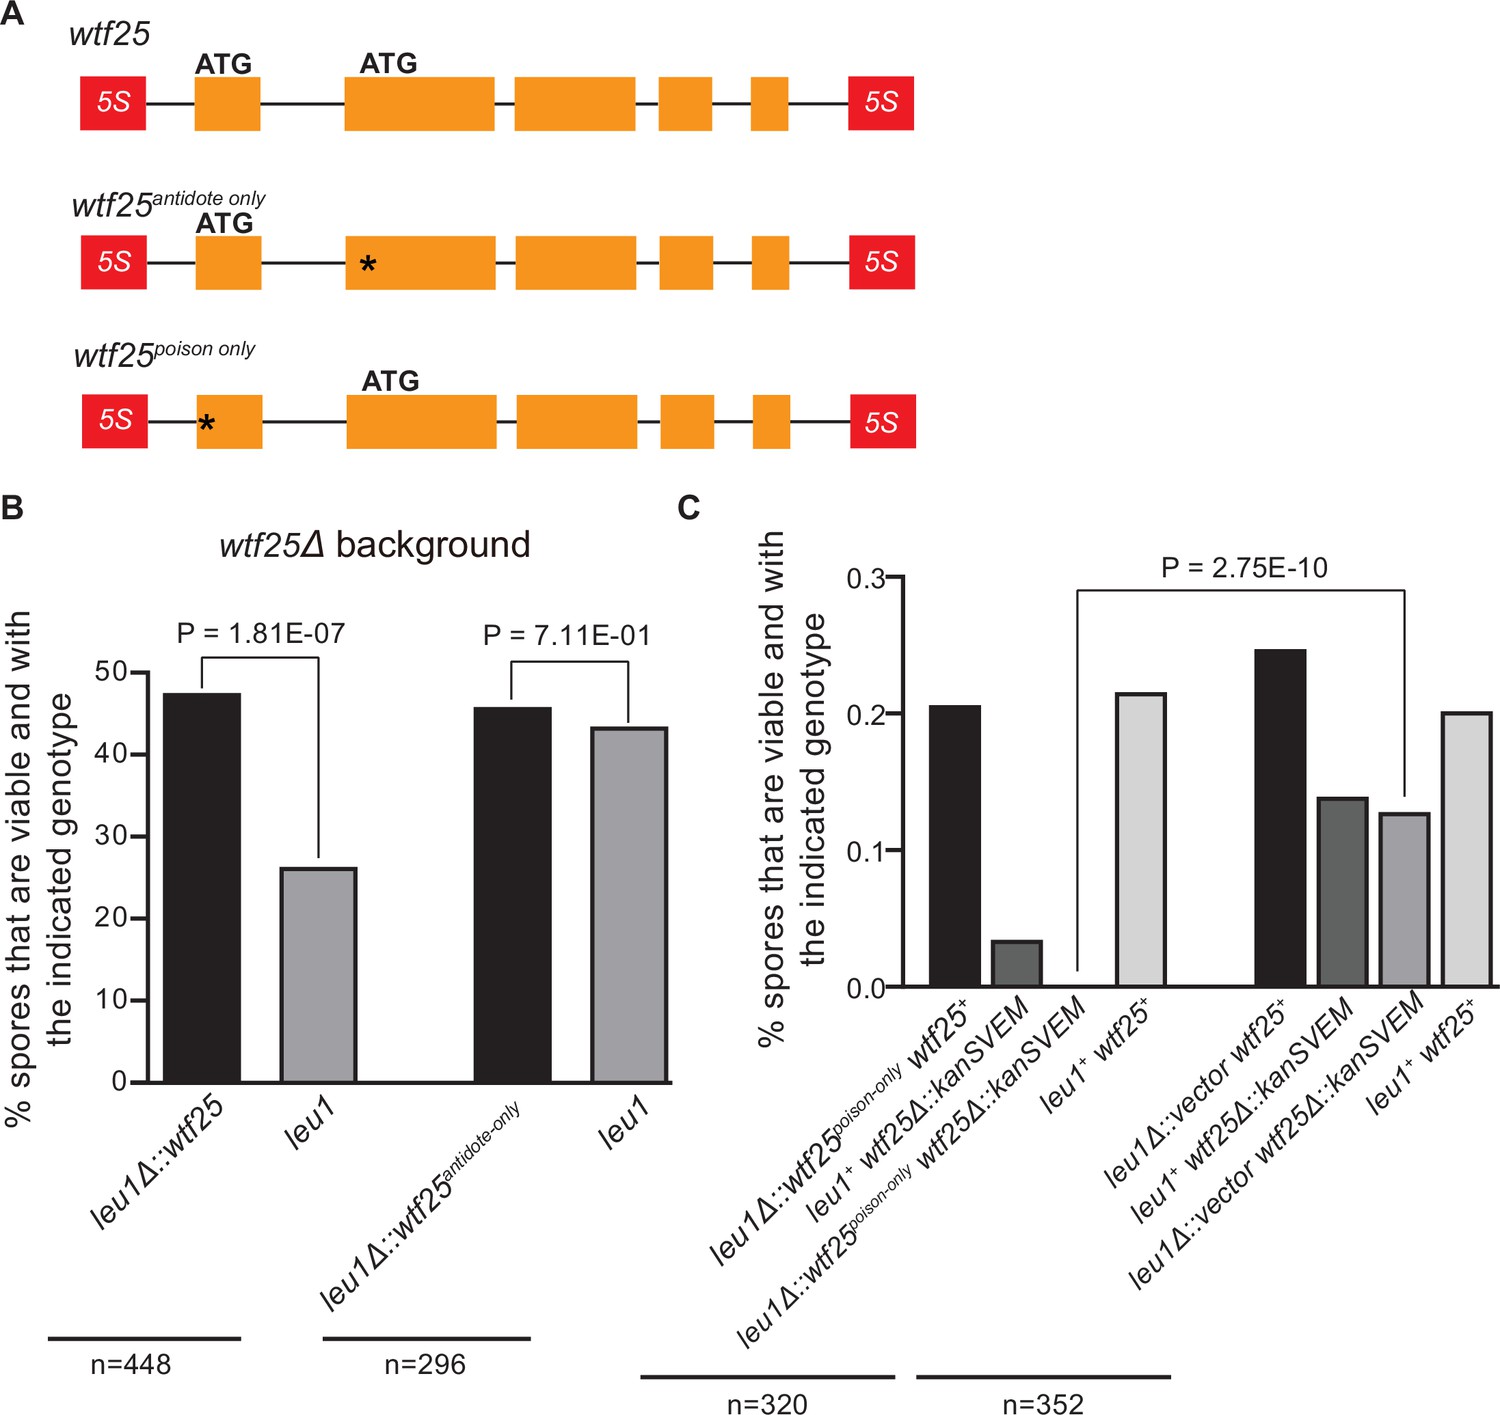
Schizosaccharomyces octosporus wtf25 is a poison-and-antidote killer meiotic driver.
(A) Schematic of the wtf25 alleles integrated at the leu1 (SOCG_02003) locus. Black asterisks indicate start codon mutations. The start codon for the putative wtf25poison coding sequence is mutated in the wtf25antidote-only allele, and the start codon for the putative wtf25antidote coding sequence is mutated in the wtf25poison-only allele. (B) The wild-type wtf25 allele integrated at the leu1 locus can act as a meiotic driver by killing spores not inheriting it in a heterozygous cross, while wtf25antidote-only mutant allele integrated at the same locus was unable to kill spores not inheriting it in a heterozygous cross. p-Value calculations using a binomial test of goodness-of-fit are shown in Figure 10—source data 1 and 2. (C) The wtf25poison-only allele integrated at leu1 can cause self-killing in spores that do not inherit wild-type wtf25 at the endogenous locus. The effects of the wtf25poison-only allele were compared to a control cross in which an empty vector was integrated at leu1. Numerical data are provided in Supplementary file 2i, and the p-value calculation is shown in Figure 10—source data 3.
-
Figure 10—source data 1
Raw data of the octad dissection analysis of wtf25 integrated at leu1.
Table 1 shows the viability of heterozygous diploid spores. Exact binomial test of goodness-of-fit was calculated in Table 2, and the resulting p-value is displayed in Figure 10B.
- https://cdn.elifesciences.org/articles/81149/elife-81149-fig10-data1-v1.xlsx
-
Figure 10—source data 2
Raw data of the octad dissection analysis of wtf25antidote-only integrated at leu1.
Table 1 shows the viability of heterozygous diploid spores. Exact binomial test of goodness-of-fit was calculated in Table 2, and the resulting p-value is displayed in Figure 10B.
- https://cdn.elifesciences.org/articles/81149/elife-81149-fig10-data2-v1.xlsx
-
Figure 10—source data 3
Raw data of the octad dissection analysis of wtf25poison-only integrated at leu1.
Empty plasmid control strain spore viability can be found in Table 1.1. wtf25poison-only octad dissection spore viability results can be found in Table 1.2. The p-value was calculated with a Fisher’s exact test in Table 2.
- https://cdn.elifesciences.org/articles/81149/elife-81149-fig10-data3-v1.xlsx
Additional files
-
Supplementary file 1
Annotations, regulatory motifs, conservation, and genomic context of wtf genes.
(a) Percent amino acid identity of all 1:1 orthologs in Schizosaccharomyces. Orthologous gene sets between pairs of Schizosaccharomyces species were identified using a combination of Orthovenn2 and BLASTp (Xu et al., 2019). All proteins from a given species were aligned the proteins of the other species, and the best hit for each was used to determine the amino acid identity. All the percent identity values between a pair of species were then used to calculate the average amino acid identity between the two species. The genome used for finding proteins sequences was generated by Rhind et al., 2011 for Schizosaccharomyces octosporus, S. cryophilus, S. pombe, and S. japonicus. The S. osmophilus genome was sequenced and annotated in this study (see Materials and methods). The orthologs list can be found in Figure 1—source data 3. (b) Location and features of S. octosporus wtf genes. S. octosporus wtf genes names are found in column A. The gene locations are described from columns B to F. If the gene is associated with a wag gene, the wag gene name and orientation are indicated in columns G and H. Column K indicates whether the wtf gene is associated with a 5S rDNA gene (immediately adjacent to the wtf or outside a flanking wag gene). The strand location of 5S rDNA genes that may be found upstream of the wtf gene is described in column I, while the strand location for 5S rDNA genes that may be downstream of the wtf gene is described in column J. wtf genes and the associated 5S rDNA are considered to be in tandem when they are encoded in the same strand and in the same direction. The wtf and wag genes are all in a divergent orientation in that they are on opposite strands and transcribed in opposite directions. Column L details if there is a 5S rDNA upstream, downstream or if there is a 5S rDNA gene both upstream and downstream the wtf gene. Column M describes our prediction if the wtf gene encodes a driver (intact poison start codon), an antidote-only gene (no start codon for poison), or is a pseudogene (premature stop codon). Columns N and O show the read counts of the two isoforms detected with long read RNA-seq, respectively, with the long isoform predicted to encode an antidote protein and the short isoform predicted to encode a poison protein. Column P indicates if a FIMO motif scanning hit of the FLEX motif was present in intron 1 of the wtf gene. Column Q provides the location of the FIMO hit in intron 1 (only the best scoring FIMO hit is shown if more than one hit was found). Column R shows the strand the FIMO hit is on. Columns S and T show the p-value of the FIMO hit and the sequence of the FIMO hit, respectively. (c) Location and features of S. osmophilus wtf genes. S. osmophilus wtf genes names are found in column A. The gene locations are described from columns B to F. If the gene is associated with a wag gene, the wag gene name and orientation are indicated in columns G and H. Column K indicates whether the wtf gene is associated with a 5S rDNA gene (immediately adjacent to the wtf or outside a flanking wag gene). The strand location of 5S rDNA genes that may be found upstream of the wtf gene is described in column I, while the strand location for 5S rDNA genes that may be downstream of the wtf gene is described in column J. wtf genes and the associated 5S rDNA are in tandem when they are encoded in the same strand and in the same direction. Column L details if there is a 5S rDNA upstream, downstream or if there is a 5S rDNA gene both upstream and downstream the wtf gene. Column M describes our prediction if the wtf gene encodes a driver (intact poison start codon), an antidote-only gene (no start codon for poison), or is a pseudogene (premature stop codon). Columns N and O indicated the strand of the LTR and orientation relative to the wtf gene. As above, tandem orientation means same orientation and same strand, convergent means the elements are on opposite strands but are transcribed toward each other. Divergent means that the elements are in different strands and are transcribed in opposite directions. Column P indicates if a FIMO motif scanning hit of the FLEX motif was present in intron 1 of the wtf gene. Column Q provides the location of the FIMO hit in intron 1 (only the best scoring FIMO hit is shown if more than one hit was found). Column R shows the strand the FIMO hit is on. Columns S and T show the p-value of the FIMO hit and the sequence of the FIMO hit, respectively. (d) Location and features of S. cryophilus wtf genes. S. cryophilus wtf genes names are found in column A. The gene locations are described from columns B to F. If the gene is associated with a wag gene, the wag gene name and orientation are indicated in columns G and H. Column K indicates whether the wtf gene is associated with a 5S rDNA gene (immediately adjacent to the wtf or outside a flanking wag gene). The strand location of 5S rDNA genes that may be found upstream of the wtf gene is described in column I, while the strand location for 5S rDNA genes that may be downstream of the wtf gene is described in column J. wtf genes and the associated 5S rDNA are in tandem (column L) when they are encoded in the same strand and in the same direction. Column L details if there is a 5S rDNA upstream, downstream, or if there is a 5S rDNA gene both upstream and downstream the wtf gene. Column M describes our prediction if the wtf gene encodes a driver (intact poison start codon), an antidote-only gene (no start codon for poison), or is a pseudogene (premature stop codon). Column N indicates if a FIMO motif scanning hit of the FLEX motif was present in intron 1 of the wtf gene. Column O provides the location of the FIMO hit in intron 1 (only the best scoring FIMO hit is shown if more than one hit was found). Column P shows the strand the FIMO hit is on. Columns Q and R show the p-value of the FIMO hit and the sequence of the FIMO hit, respectively. (e) Pairwise amino acid identity of intact wtf genes. Using MAFFT with parameters L-INS-I (200PAM scoring matrix/k=2; Gap open penalty of 2; offset of 0.123), we aligned all the predicted coding sequences of the intact wtf genes from S. octosporus, S. osmophilus, S. cryophilus, and S. pombe. The longest isoform (i.e. antidote) of each protein, when two isoforms are predicted, was used. The table shows the percent amino acid identity shared between all pairs of genes. The cells are color-coded such that pairs with higher similarity are shaded a darker red. (f) Genes used for FLEX motif discovery. This table lists the 49 S. pombe Mei4 target genes and their orthologs in three other fission yeast species used for FLEX motif discovery. (g) Summary statistics of genome-wide FLEX motif scanning. FIMO hits were classified into unreliable hits and confident hits using the p-value cutoff of 3E-6. This table lists the numbers of total FIMO hits, unreliable hits, and confident hits in each species. (h) Confident hits of FLEX motif scanning. This table lists the confident FIMO hits in the four fission yeast species. (i) Locations of LTR sequences in S. osmophilus. We used BLASTn with S. cryophilus LTR sequences as queries to identify S. osmophilus LTRs. In addition, we also used as LTR_retriever (see Materials and methods). The table reports the location, length, and orientation of each LTR identified. (j) Summary of association between 5S rDNA and wtf genes within Schizosaccharomyces genomes. The table lists the number of 5S rDNA genes in each species and details how many of those 5S rDNA genes are associated with a locus that contains one or more wtf genes. Additional unannotated 5S rDNA genes were identified within the S. octosporus and S. cryophilus genomes using BLASTn. In S. osmophilus, all 5S rDNA genes were identified by BLASTn. A gene was considered a bona fide 5S rDNA gene if it shared more than 70% sequence identity with another 5S rDNA gene in that genome. A 5S rDNA was considered associated with a wtf locus if it was immediately adjacent to a wtf gene, or if it was adjacent to a wag gene flanking a wtf gene. (k) wag gene transcripts in S. octosporus. Annotation of wag genes of S. octosporus with the corresponding SOCG names, where applicable, in column B. Genes with early stop codons relative to consensus sequences are considered pseudogenes (column H). (l) Synteny analysis of the regions containing wtf genes in S. pombe (i.e. Figure 4 and Figure 4—figure supplement 1). For each S. pombe wtf locus (from the S. kambucha isolate; column A), we noted the genes directly upstream and downstream excluding wag genes (columns H and I). We next found the orthologs of those wtf-flanking genes in S. osmophilus (columns J and K), S. octosporus (columns L and M), and S. cryophilus (columns N and O). If the orthologs of the genes that flank a wtf in S. pombe also flank a single wtf locus in another species, the wtf genes were considered to share ‘complete’ synteny. If the orthologs both flank wtf genes, but not the same wtf gene in a different species, we dubbed this scenario ‘double partial synteny’. If only one of the two orthologs flanks a wtf gene in another species, we considered that ‘partial synteny’. The synteny analyses results for S. cryophilus, S. octosporus, and S. osmophilus are reported in columns B-C, D-E, and F-G, respectively. (m) S. cryophilus wtf genes in synteny with S. octosporus, S. osmophilus, and S. pombe wtf genes (Figure 4—figure supplement 1). For each S. cryophilus wtf gene (column A), we noted the genes directly upstream and downstream, excluding wag genes (columns H and I). We next found the orthologs of those wtf-flanking genes in S. octosporus (columns J and K), S. pombe (columns L and M), and S. osmophilus (columns N and O). If the orthologs both flank wtf genes, but not the same wtf gene in a different species, we dubbed this scenario ‘double partial synteny’. If only one of the two orthologs flanks a wtf gene in another species, we considered that ‘partial synteny’. The synteny analyses results for S. octosporus, S. pombe, and S. osmophilus are reported in columns B-C, D-E, and F-G, respectively. (n) Percent amino acid identity of genes flanking wtf genes at syntenic loci (i.e. Figure 4 and Figure 4—figure supplement 1). The amino acid sequences of genes flanking the S. pombe wtf loci shown in Figure 4 (wtf34) and Figure 4—figure supplement 1 (wtf6) were aligned with their orthologs from all other Schizosaccharomyces species using MAFFT L-INS-I (200PAM scoring matrix/k=2; Gap open penalty of 2; offset of 0.123). The tables depict the pairwise percent amino acid identity between all ortholog pairs. Comparisons between the genes flanking S. pombe wtf34 (clr4 and met17) are shown at the top, while the comparisons between the genes flanking S. pombe wtf6 (ago1 and cyp9) are shown below. (o) Species-specific wtf genes. Summary of the species-specific wtf loci and genes found in each species. The S. kambucha isolate of S. pombe was used for this table, and the reference genomes were used for the other species. The gene names of the species-specific wtf genes are shown in the final column. Genes found at separate loci are separated by commas and genes found at a centromere are shown in bold. (p) Analyzing if 5S rDNA genes are found at loci syntenic to 5S rDNA-adjacent S. osmophilus wtf genes in other species (i.e. Figure 6). For each S. osmophilus wtf locus (column A), we noted the genes directly upstream and downstream (columns D and E) excluding any wag genes. We next found the orthologs of those wtf-flanking genes in S. octosporus (columns F and G), and S. cryophilus (columns H and I). The synteny analyses results comparing S. osmophilus wtf loci to S. octosporus are shown in columns B and C. If the orthologs of the genes that flank a wtf in S. osmophilus also flank a single wtf locus in the queried species, the wtf genes were considered to share ‘complete’ synteny. If the orthologs both flank a wtf locus but not the same wtf locus in the queried species, we dubbed this scenario ‘double partial synteny’. If only one of the two orthologs flanks a wtf gene in the queried species, we considered that ‘partial synteny’. For the analysis, we considered loci in complete synteny where there was a wtf gene flanked by a 5S rDNA gene in S. osmophilus (column J), but no wtf gene at the syntenic locus in the queried species (columns K and M, respectively). We evaluated if the wtf-lacking syntenic locus in S. octosporus or S. cryophilus contained a 5S rDNA gene (columns L and N, respectively). The loci that met our criteria and were considered in the analysis are listed in columns O and P for S. octosporus and S. cryophilus, respectively. In column Q, we considered each locus to be a lineage-specific locus meaning no synteny found in other species. (q) Analyzing if 5S rDNA genes are found at loci syntenic to 5S rDNA-adjacent S. octosporus wtf genes in other species (i.e. Figure 6). For each S. octosporus wtf locus (column A), we noted the genes directly upstream and downstream (columns D and E) excluding any wag genes. We next found the orthologs of those wtf-flanking genes in S. osmophilus (columns F and G) and S. cryophilus (columns H and I). The synteny analyses results comparing S. octosporus wtf loci to S. osmophilus are shown in columns B and C. If the orthologs of the genes that flank a wtf in S. octosporus also flank a single wtf locus in the queried species, the wtf genes were considered to share ‘complete’ synteny. If the orthologs both flank a wtf locus but not the same wtf locus in the queried species, we dubbed this scenario ‘double partial synteny’. If only one of the two orthologs flanks a wtf gene in the queried species, we considered that ‘partial synteny’. For the analysis, we considered loci in complete synteny where there was a wtf gene flanked by a 5S rDNA gene in S. octosporus (column J), but no wtf gene at the syntenic locus in the queried species (columns K and M, respectively). We evaluated if the wtf-lacking syntenic locus in S. osmophilus or S. cryophilus contained a 5S rDNA gene (columns L and N, respectively). The loci that met our criteria and were considered in the analysis are listed in columns O and P for S. osmophilus and S. cryophilus, respectively. In column Q, we considered each locus to be a lineage-specific locus meaning no synteny found in other species. (r) Repeat count within exon 4 in S. octosporus and S. osmophilus wtf genes (i.e. Figure 5—figure supplement 2). This tab contains 4 tables. From left to right, the first table displays the size, in base pairs of the repeat region found in each intact S. octosporus wtf genes. These sizes were determined manually in each gene. The next table summarizes how many S. octosporus wtf genes were found with repeat regions of the indicated ranges. The following two tables repeat the analyses with the S. osmophilus wtf genes. (s) Expanded analysis of wtf+5S rDNA loci in species A with 5S rDNA at the locus in species B (i.e. Figure 6). Expanded table of data presented in Figure 6. The analysis considers wtf+5S rDNA loci that are present in species A that are not found in species B. The total number of such sites, in addition to how many of the sites have a 5S rDNA gene at the syntenic site in species B is reported. The wtf genes considered are shown in the last column. Those with a 5S rDNA gene at the syntenic site in species B are shown in bold. Genes found at separate loci are separated by commas.
- https://cdn.elifesciences.org/articles/81149/elife-81149-supp1-v1.xlsx
-
Supplementary file 2
S. octosporus spore dissection analyses.
(a) Total viability numerical data summary. (b) wtf25(SOCG_04480) deletion related numerical data of the octad dissection analysis. (c) wtf68(SOCG_01240) deletion related numerical data of the octad dissection analysis. (d) wtf33 deletion related numerical data of the octad dissection analysis. (e) wtf46(SOCG_00084) deletion related numerical data of the octad dissection analysis. (f) wtf60(SOCG_04742) deletion related numerical data of the octad dissection analysis. (g) wtf62(SOCG_04077) deletion related numerical data of the octad dissection analysis. (h) wtf21(SOCG_02322) deletion related numerical data of the octad dissection analysis. (i) octo-pSIV-leu1-1D plasmid related numerical data of the octad spore dissection analysis.
- https://cdn.elifesciences.org/articles/81149/elife-81149-supp2-v1.xlsx
-
Supplementary file 3
Summary of yeast strains, plasmids and oligos.
(a) Yeast strain summary. (b) Oligos summary. (c) Plasmids summary.
- https://cdn.elifesciences.org/articles/81149/elife-81149-supp3-v1.xlsx
-
MDAR checklist
- https://cdn.elifesciences.org/articles/81149/elife-81149-mdarchecklist1-v1.pdf
Download links
A two-part list of links to download the article, or parts of the article, in various formats.
Downloads (link to download the article as PDF)
Open citations (links to open the citations from this article in various online reference manager services)
Cite this article (links to download the citations from this article in formats compatible with various reference manager tools)
The wtf meiotic driver gene family has unexpectedly persisted for over 100 million years
eLife 11:e81149.
https://doi.org/10.7554/eLife.81149


