The fat body cortical actin network regulates Drosophila inter-organ nutrient trafficking, signaling, and adipose cell size
- Department of Cell Biology, UT Southwestern Medical Center, United States
Figures
Figure 1 with 1 supplement
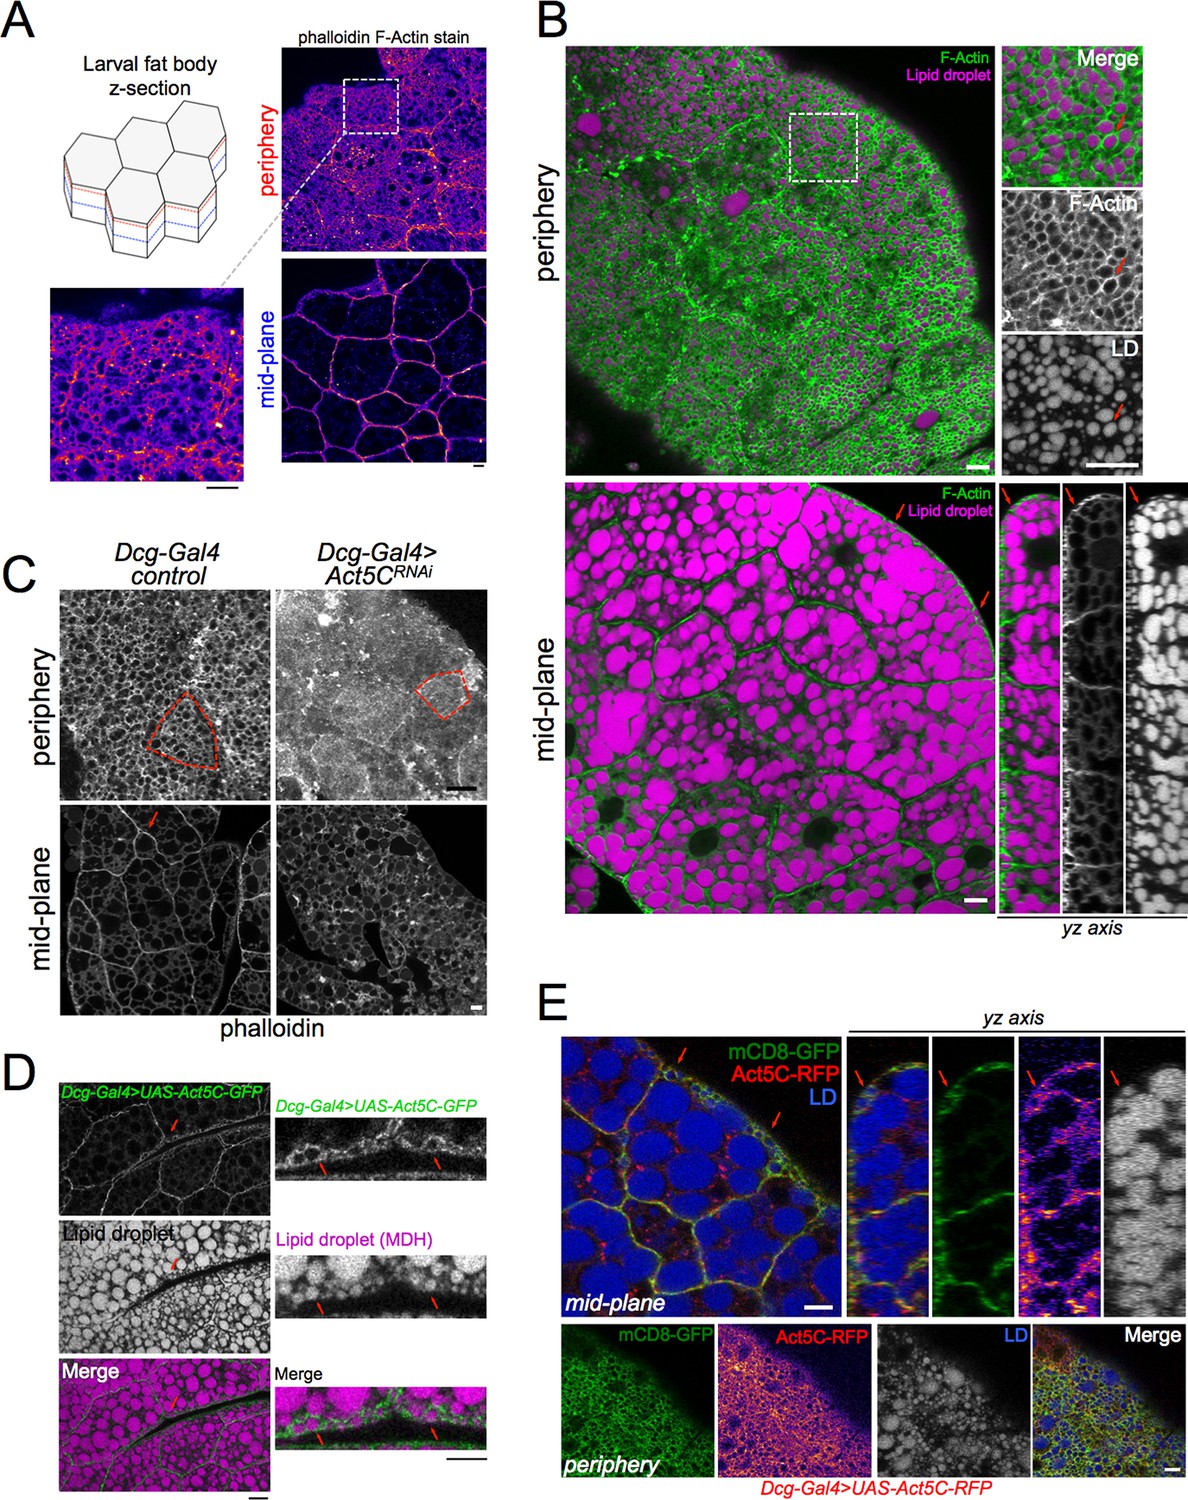
Act5C forms a cortical actin network at the surfaces of fat body cells.
(A) Confocal images of w1118 control L3 larval fat bodies (FBs) at their periphery or mid-plane stained with phalloidin, and Fire-LUT pseudo-colored (Fiji). Scale Bar 10 μm. (B) Confocal images of control L3 larval FB periphery (top) or mid-plane (bottom) sections stained with Cell Mask Actin Tracking Stain (green) and LD stain monodansylpentane (MDH, magenta). Red arrows mark peripheral LDs (pLDs) encircled by cortical actin. (bottom right) A side yz-axis profile of the z-section of the FB tissue, red arrows marking pLDs encircled by actin. Scale Bar 10 μm. (C) Larval FBs stained with phalloidin and viewed from periphery or mid-plane. Scale bar 10 μm. (D) Larval FB expressing Dcg-Gal4 >UAS-Act5C-GFP and with MDH-stained LDs. Scale Bar 10 μm. (L) Larval FB expressing PM marker mCD8-GFP and Act5C-RFP using Dcg-Gal4, and with LD stain MDH. Red arrows indicate pLDs encircled by Act5C-RFP. Scale Bar 10 μm.
Figure 1—figure supplement 1
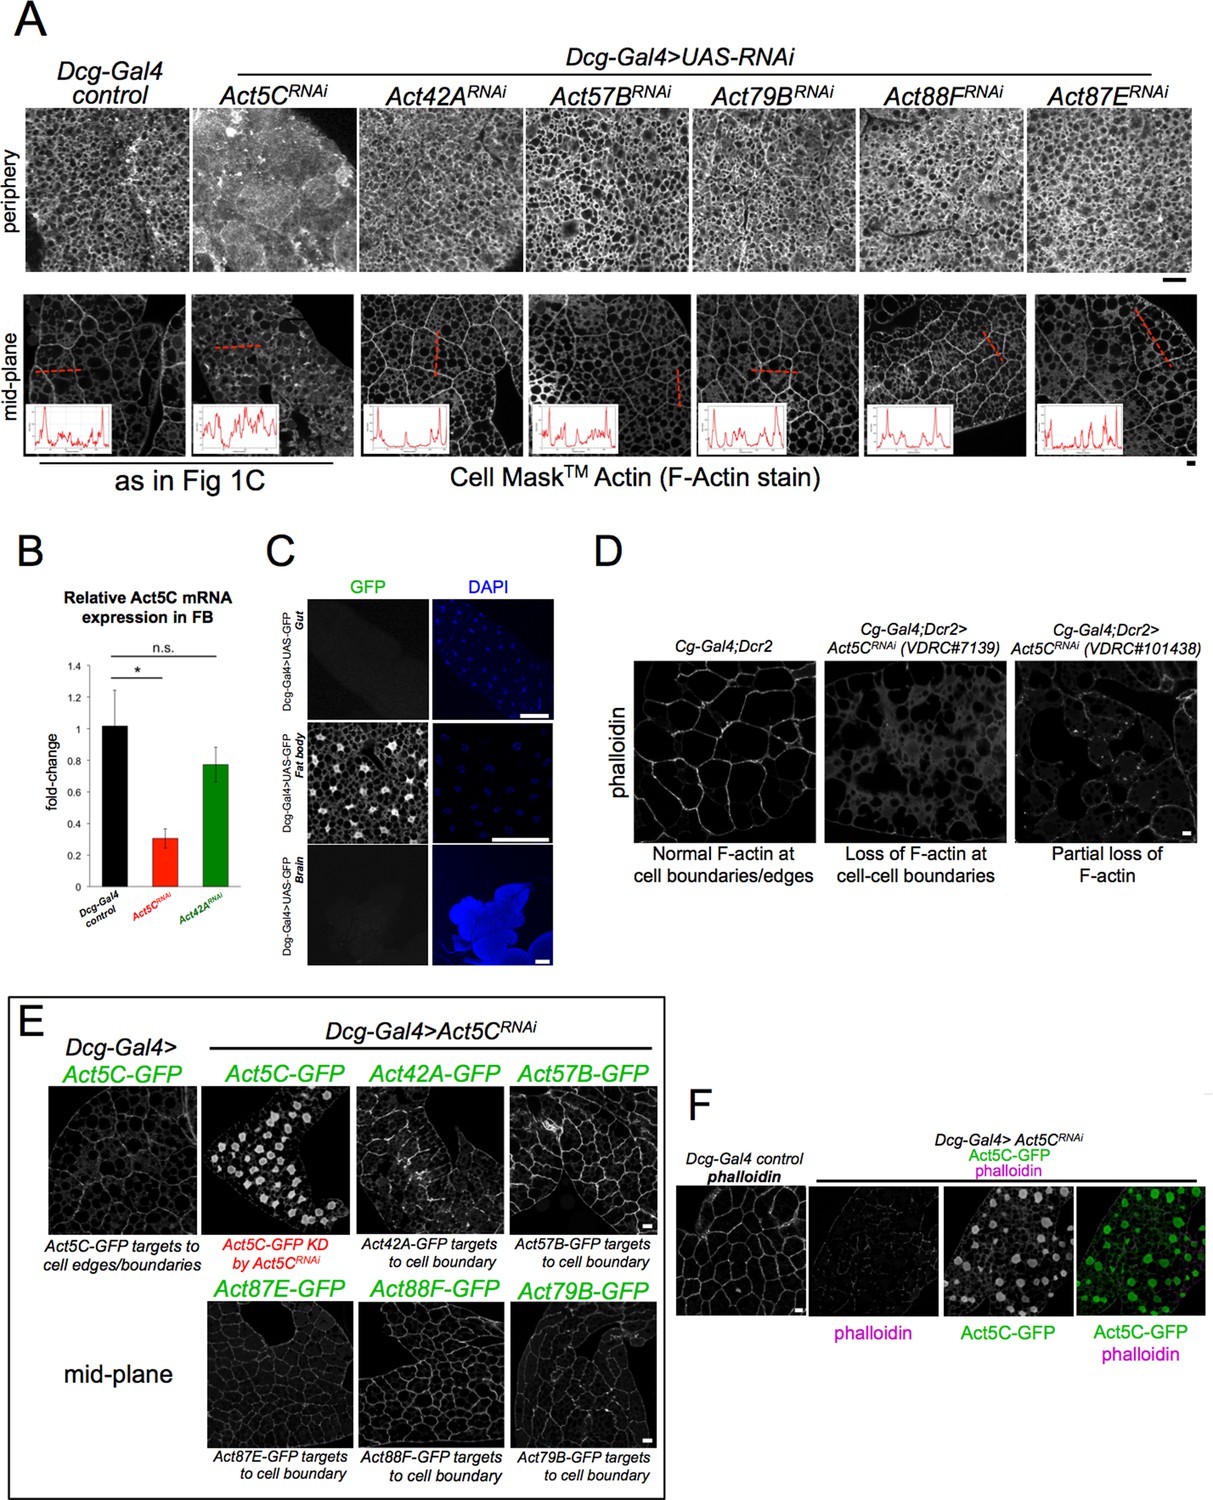
Act5C is required for the FB cortical actin network.
(A) Confocal section images of tissue periphery (top) or mid-plane (bottom) of L3 larval fat bodies (FBs) stained with Cell Mask Actin Tracking Stain (F-actin stain). Line-scans indicate actin signal across red dotted line in mid-plane. The Dcg-Gal4 control and Dcg-Gal4 >Act5CRNAi images are also displayed in Figure 1C. Scale bar 10 μm. (B) QPCR of Act5C mRNA levels from isolated FBs of control (Dcg-Gal4), Dcg-Gal4 >Act5CRNAi, and Dcg-Gal4 >Act42ARNAi larvae. (C) Confocal sections of different larval tissues expressing soluble UAS-GFP using Dcg-Gal4 driver. Larval gut, FB, and brain are shown, with fluorescence only detected in the FB. Nuclei stained with DAPI stain (blue). Scale bar 100 μm. (D) Confocal sections of phalloidin (F-actin) stained-FBs from control (Dcg-Gal4) and two VDRC Act5CRNAi lines. Scale bar 10 μm. (E) Confocal sections of larval FBs co-expressing different FB-specific GFP-tagged Actins with Dcg-Gal4 >Act5CRNAi. Act5CRNAi/Act5C-GFP cells display reduced GFP signal that does not target to cell-cell boundaries, (Panel F), whereas all other GFP-tagged Actins localize to the cell edges, indicating their expression is not significantly impacted by Act5CRNAi. Scale bar 10 μm. (F) Confocal sections of phalloidin-stained larval FBs co-expressing Act5C-GFP and Dcg-Gal4 >Act5CRNAi. Act5C-GFP signal does not co-localize with phalloidin and is mostly nuclear. Scale bar 10 μm.
Figure 2 with 1 supplement
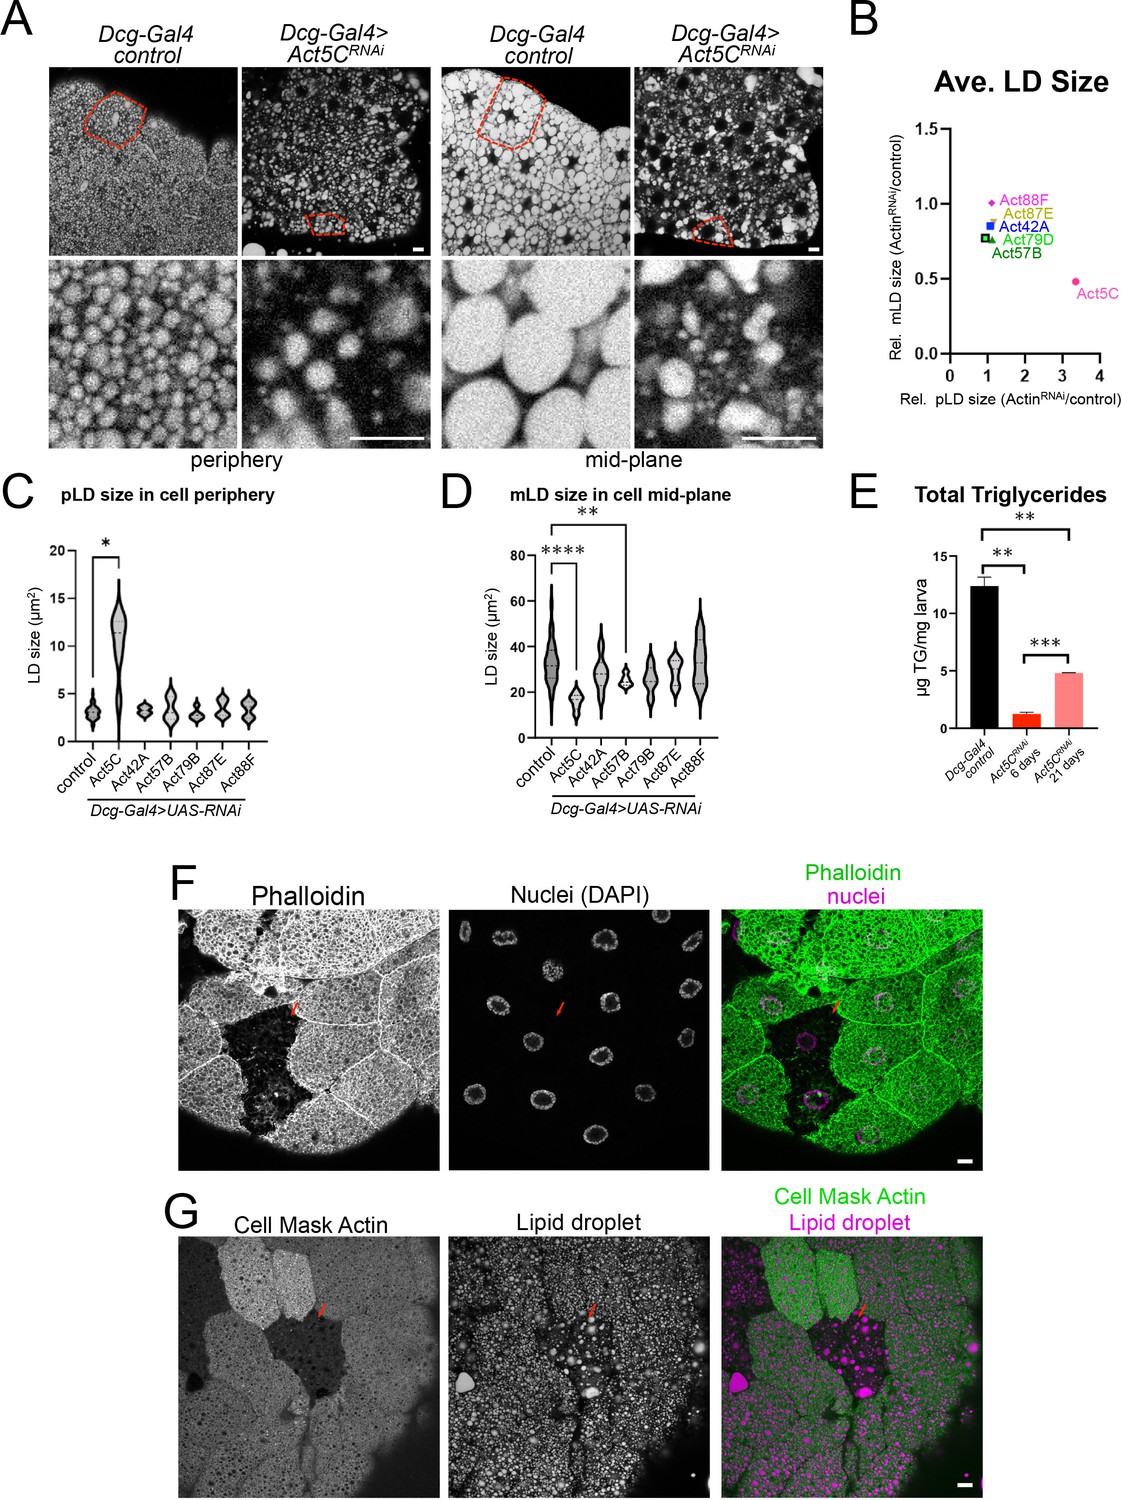
Fat body-specific Act5C loss perturbs LDs and reduces triglyceride stores.
(A) FBs from control (Dcg-Gal4) or Dcg-Gal4 >Act5CRNAi larvae stained for LDs (MDH). Scale Bar 10 μm. (B) Comparative chart of average pLD and mLD sizes from FB-specific RNAi depletions of six different Actins compared to control LDs. Act5C loss significantly altered pLDs and mLDs compared to Dcg-Gal4 control. (C) Average pLD sizes (μm2) for control and FB-specific Act5CRNAi depletions. (D) Average mLD sizes (μm2) for control and FB-specific Act5CRNAi depletions. (E) Total triglyceride (TG) for age-matched control and Act5CRNAi 6 day larvae, and developmentally delayed Act5CRNAi 21-day larvae. (F) Confocal sections of larval FBs from FRT/FLP recombination, which enabled loss of Act5C in subsets of FB cells. FBs stained for F-actin with phalloidin (green) and for nuclei with DAPI (magenta). Mutant cells are identified by loss of RFP marker. Scale Bar 10 μm. (G) Confocal sections of larval FBs from FRT/FLP recombination, which enabled loss of Act5C in subsets of FB cells. FBs stained for LDs with MDH dye (magenta) and Actin (Cell Mask Actin, green). Red arrows denote cells lacking Act5C, which display defective LD morphology. Scale Bar 10 μm.
Figure 2—figure supplement 1
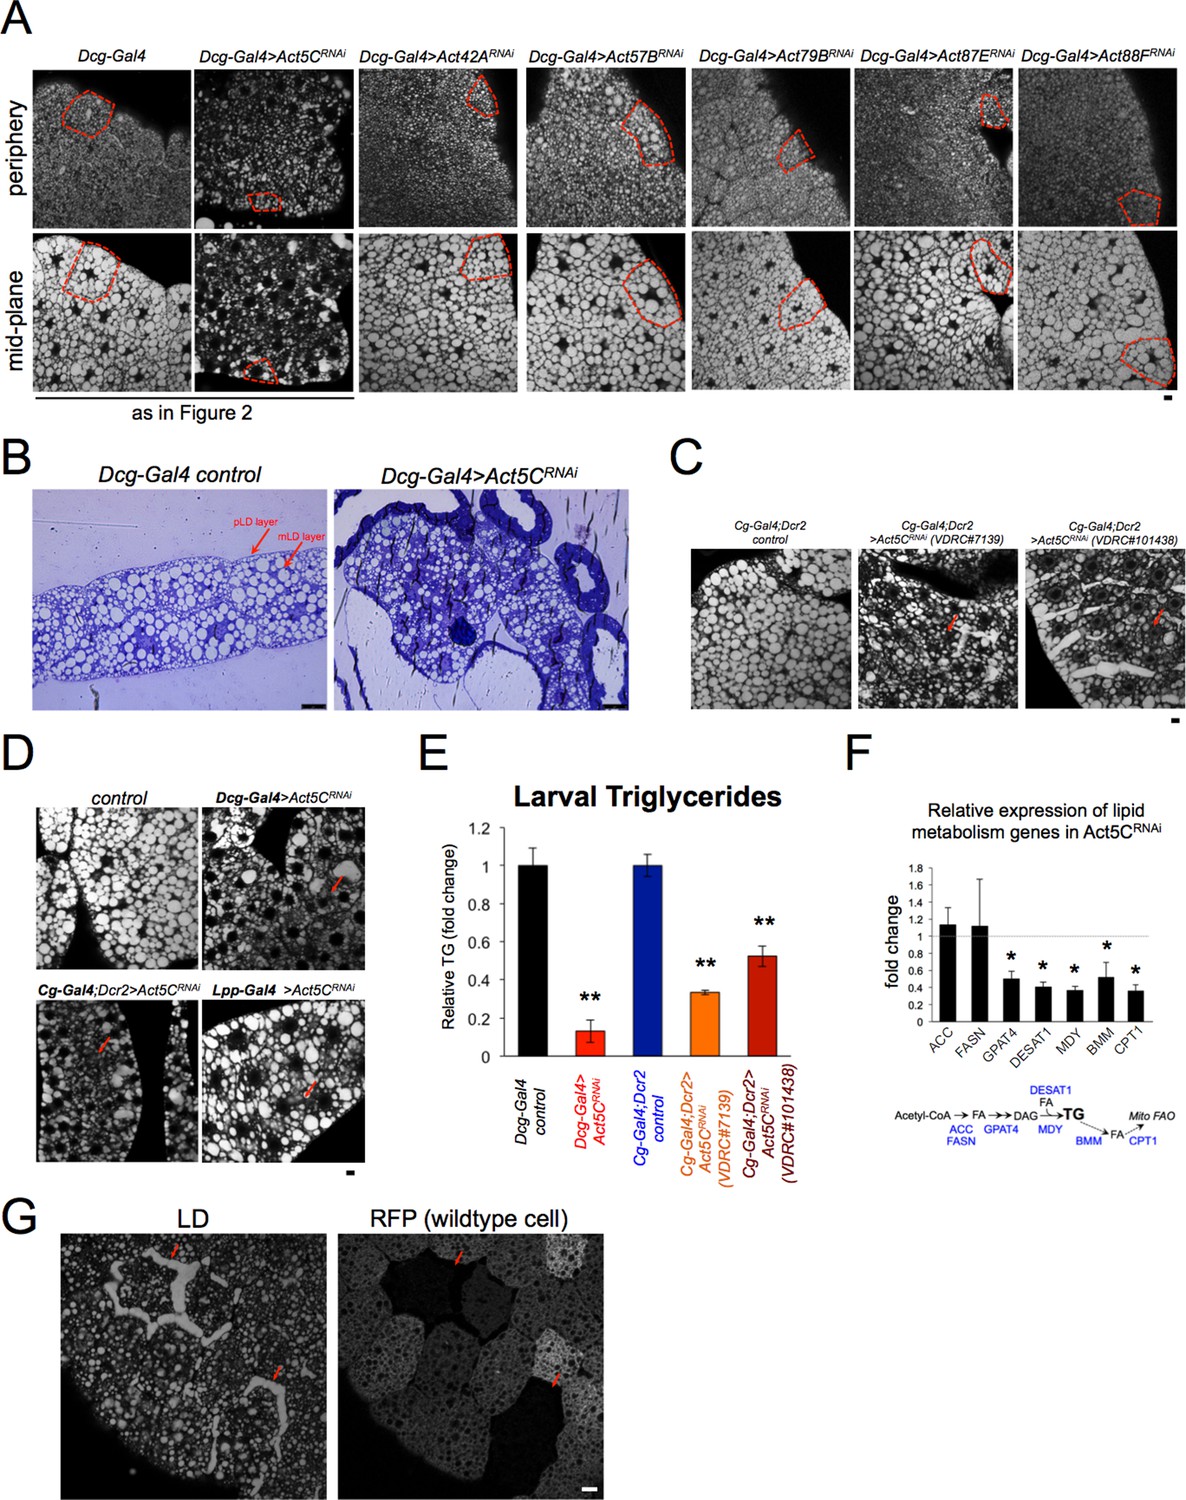
Loss of Act5C perturbs FB lipid storage.
(A) Confocal section images of tissue periphery (top) or mid-plane (bottom) of L3 larval fat bodies (FBs) stained with LD stain MDH. Red boxes outline single FB cells. The images for Dcg-Gal4 alone and Dcg-Gal4 >Act5CRNAi are also displayed in Figure 2. Scale bar 10 μm. (B) Brightfield micrographs of isolated FBs from Dcg-Gal4 control or Dcg-Gal4 >Act5CRNAi larvae. These are thick-section samples processed for thin-section TEM microscopy. The peripheral LDs (pLDs) and medial LDs (mLDs) are marked. Scale bar 25 μm. (C) Confocal section images of larval FBs stained for LDs from control (Cg-Gal4 line alone) and two different RNAi lines depleting Act5C using the Cg-Gal4 FB driver. Areas of reduced LD densities shown in red arrows. Scale bar 10 μm. (D) Confocal section images of larval FBs stained for LDs from control and Act5C RNAi lines using three different FB drivers: Dcg-Gal4, Cg-Gal4, and Lsp2-Gal4. Red arrows denote regions of decreased LD densities. Scale bar 10 μm. (E) Relative whole-larval triglyceride (TG) levels from controls (Dcg-Gal4 line or Cg-Gal4/Dcr2) and Act5C RNAi lines with FB-specific RNAi depletion. (F) Relative expression by QPCR of lipogenesis and lipolysis genes from isolated larval FBs. (G) Confocal section of larval FBs from FRT/FLP recombination, which enables loss of Act5C in subsets of FB cells. FB stained for LDs with MDH dye. Red fluorescent protein (RFP) marks wildtype cells that express endogenous Act5C. Non-fluorescent cells denote Act5C mutants that display LD defects (red arrows). Scale bar 10 μm.
Figure 3
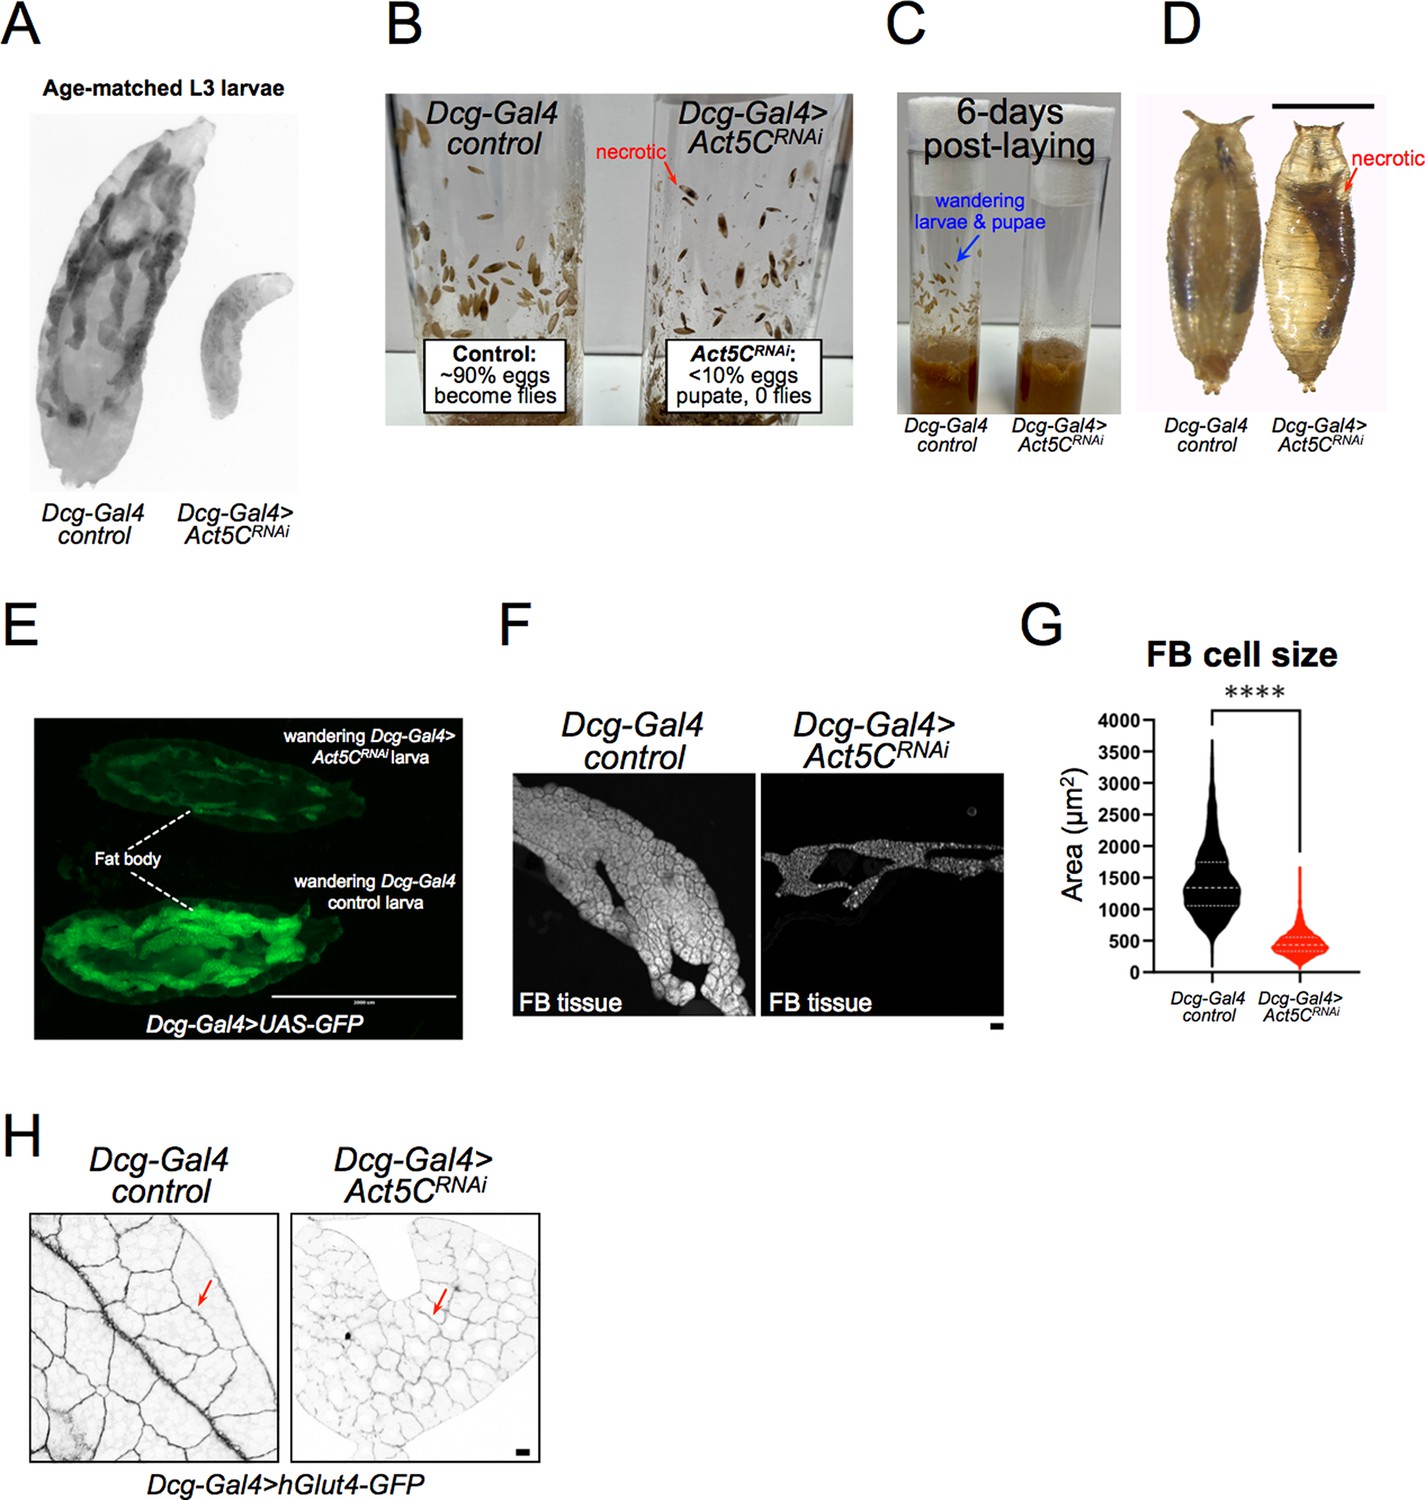
Larvae lacking Act5C in fat bodies display developmental and size defects.
(A) Inverted fluorescent image of age-matched L3 control and Act5CRNAi larvae expressing UAS-GFP in their FBs. (B) Vials with control or Act5CRNAi pupae. Red arrow denotes necrotic pupae. (C) Age-matched control and Act5CRNAi culture vials, showing L3 wandering larvae and pupae in controls at ~day 6 post-laying, but no wandering of Act5CRNAi larvae due to developmental delay. (D) Comparison of control and Act5CRNAi maturing pupae. Necrotic pupae marked. Scale bar 1 mm. (E) Fluorescence micrograph of L3 wandering larvae expressing soluble GFP in the FB (Dcg-Gal4 >UAS GFP). Larvae are either control (bottom) or FB-depleted Act5C (Dcg-Gal4 >Act5CRNAi, top), latter has a smaller FB and experienced developmental delay prior to wandering (green). Scale bar 2000 μm. (F) Fluorescence images of extracted FBs from control or Act5CRNAi larvae. Scale bar 10 μm. FBs stained with LD stain MDH. (G) Average cell size for FBs from control and Act5CRNAi larvae. (H) Representative fluorescent images of larval FBs expressing surface marker hGlut4-GFP to illustrate smaller cell size in Act5CRNAi. Scale bar 10 μm.
Figure 4

Act5C is required post-embryogenesis during larval development.
(A) Schematic of Gal80 temperature sensitive (Gal80ts) experiments (Dcg-Gal4;tub-Gal80ts >Act5CRNAi): 29°C to 18°C switch. Drosophila egg-laying occurs at 29 °C (maximal Act5C silencing, Act5COFF). Cultures are maintained at this non-permissive temperature for set time-periods, then transitioned to permissive 18 °C to allow endogenous Act5C expression for the rest of development (Act5CON). Their developmental fate (i.e. arrest/necrosis or successful fly eclosion) is indicated. Timeline indicated at bottom. E: embryogenesis, L1, L2, L3: larval instars, W: wandering, P: pupation. (B) Schematic of Gal80ts experiments: 18–29°C switch. Drosophila egg-laying occurs at 18 °C (endogenous Act5C expressed). Vials are maintained at this permissive temperature for set time-periods, then transitioned to non-permissive 29 °C to maximally RNAi-silence Act5C expression for the rest of development. Their developmental fate (i.e. arrest/necrosis or successful fly eclosion) is indicated. Timeline indicated at bottom. E: embryogenesis, L1, L2, L3: larval instars, W: wandering, P: pupation. (C) Phalloidin (Fire-LUT)-stained FBs from control, or Act5CRNAi larvae cultured at 25 °C (efficient RNAi-silencing) or 18 °C (inefficient RNAi silencing). Red arrows indicate a cortical actin network at cell-cell boundaries from Act5C expression. Scale bar 10 μm. (D) Inverted fluorescence image of age-matched L3 larvae expressing UAS-GFP in FBs. Control, Act5CRNAi at 25 °C, and Act5CRNAi at 18 °C are displayed. (E) Schematic of time-lapse experiments in Dcg-Gal4 >Act5CRNAi vials cultured at either 25 °C (efficient Act5C RNAi-silencing, Act5COFF) or 18 °C (some Act5C expressed due to inefficient RNAi-silencing, Act5Cfunctional). (F) FB cell sizes for L3 Dcg-Gal4 control and Dcg-Gal4 >Act5CRNAi larvae cultured at 25 °C or 18 °C. (G) Schematic of Dcg-Gal4 >Act5CRNAi (25°C to 18°C) temperature-shift experiments. Following egg laying, Drosophila cultures are maintained at 25 °C (efficient Act5C silencing) for set time-periods, then transitioned to 18 °C to permit low Act5C expression but above a functional threshold. Their developmental fate (as in A and B) is indicated. Timeline indicated at bottom. E: embryogenesis, L1, L2, L3: larval instars, W: wandering, P: pupation. (H) Schematic of Dcg-Gal4 >Act5CRNAi (18°C to 25°C) temperature-shift experiments. Following egg laying, Drosophila cultures are maintained at 18 °C (low Act5C expression) for set time-periods, then transitioned to 25 °C for efficient Act5C RNAi-silencing. Their developmental fate (as in A, B, and G) is indicated. Timeline indicated at bottom. E: embryogenesis, L1, L2, L3: larval instars. W: wandering, P: pupation.
Figure 5
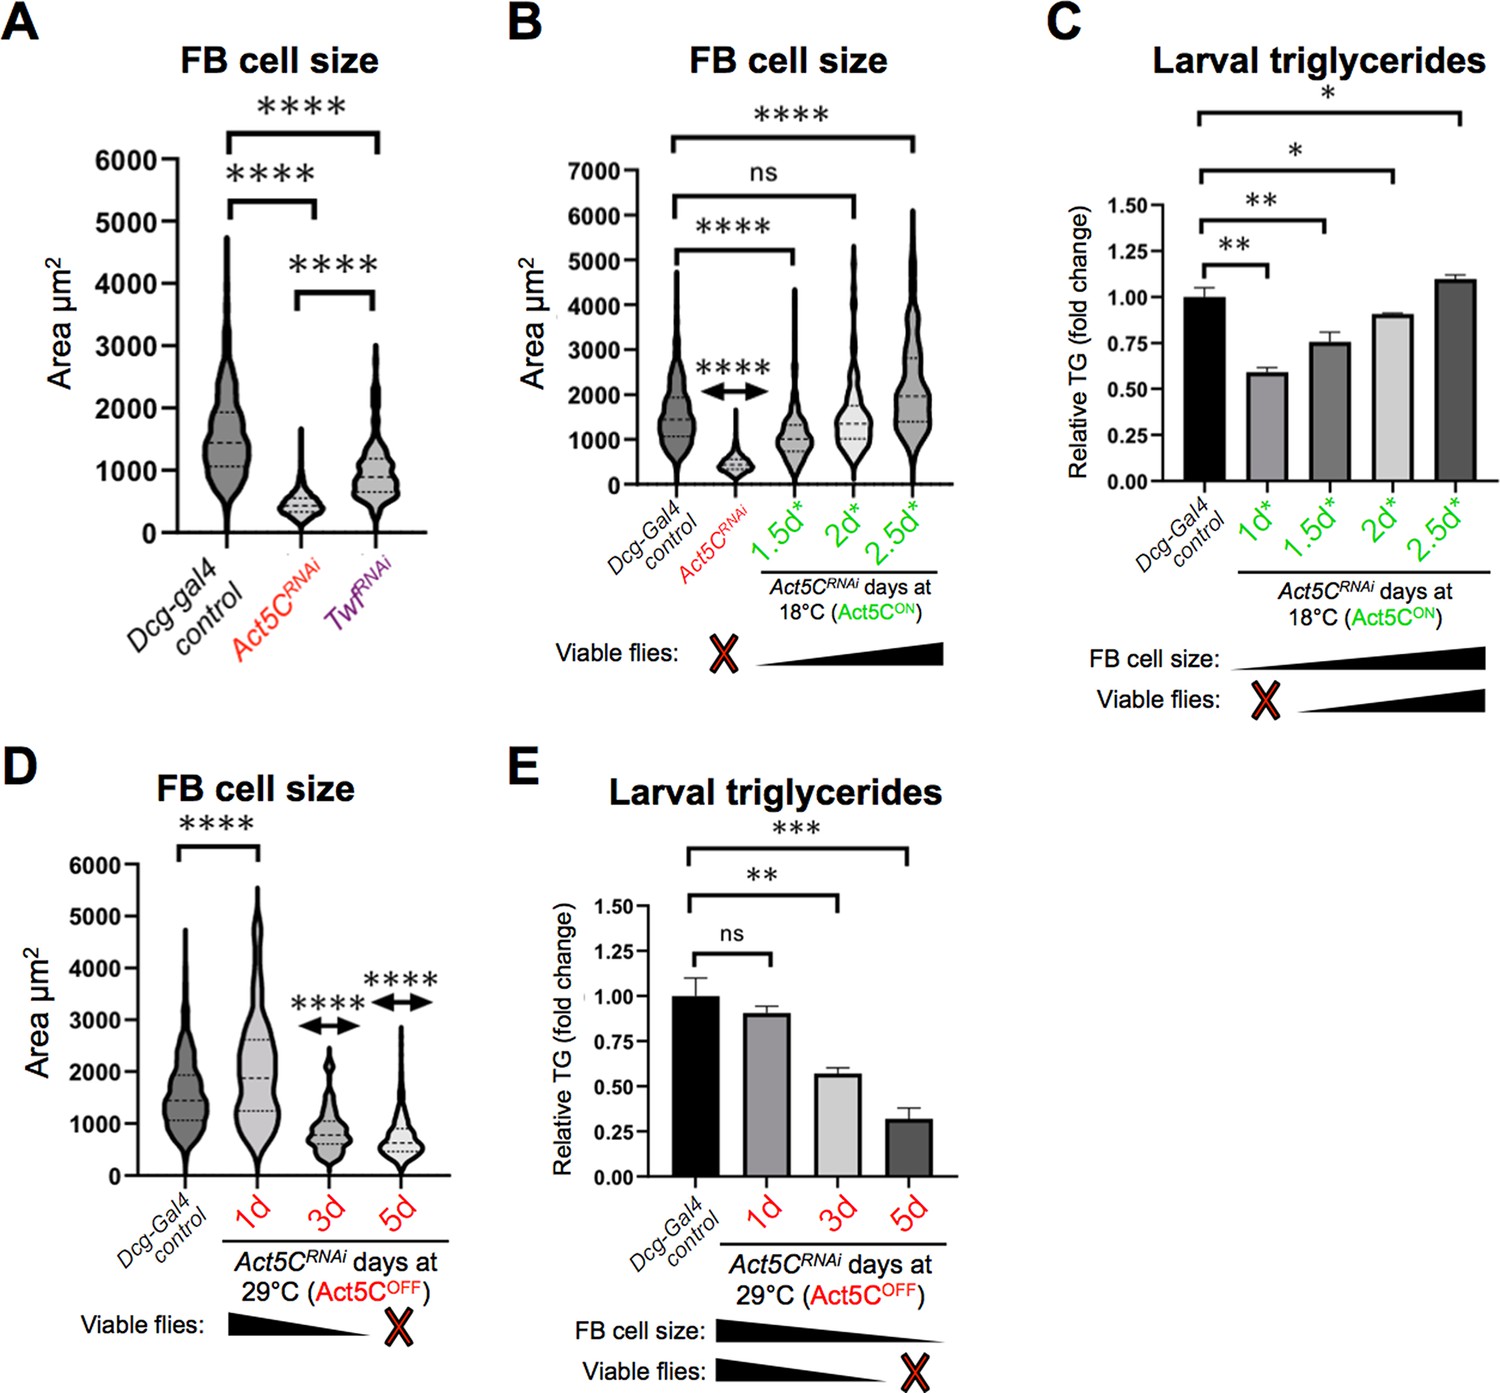
Post-embryonic larval Act5C expression is necessary for fat body cell size expansion.
(A) FB cell sizes for Dcg-Gal4 control and Dcg-Gal4 >Act5CRNAi or TwfRNAi L3 larvae. (B) FB cell sizes for Dcg-Gal4 control and Dcg-Gal4;tub-Gal80ts >Act5CRNAi larvae from 18°C-to-29°C temperature shift experiments, as in Figure 6. The number of days larvae are cultured at the permissive (Act5CON) 18 °C before switching to non-permissive 29 °C are denoted. (C) Relative changes in TG for control and Gal80ts 18°C-to-29°C temperature shifted larvae (experiments as in Figure 6). The number of days larvae are cultured at the permissive (Act5CON) 18 °C before switching to non-permissive 29 °C are denoted. How these values correlate to FB cell size and development into flies is also indicated. (D) FB cell sizes for Dcg-Gal4 control and Dcg-Gal4;tub-Gal80ts >Act5CRNAi larvae from 29°C to 18°C temperature shift experiments, as in Figure 6. The number of days larvae are kept at the non-permissive (Act5COFF) 29 °C before switching to permissive 18 °C are denoted. (E) Relative changes in TG for control and Gal80ts 29°C-to-18°C temperature shifted larvae (experiments as in Figure 6). The number of days larvae are kept at the non-permissive (Act5COFF) 29 °C before switching to permissive 18 °C are denoted. How these values correlate to FB cell size and development into flies is also indicated.
Figure 6
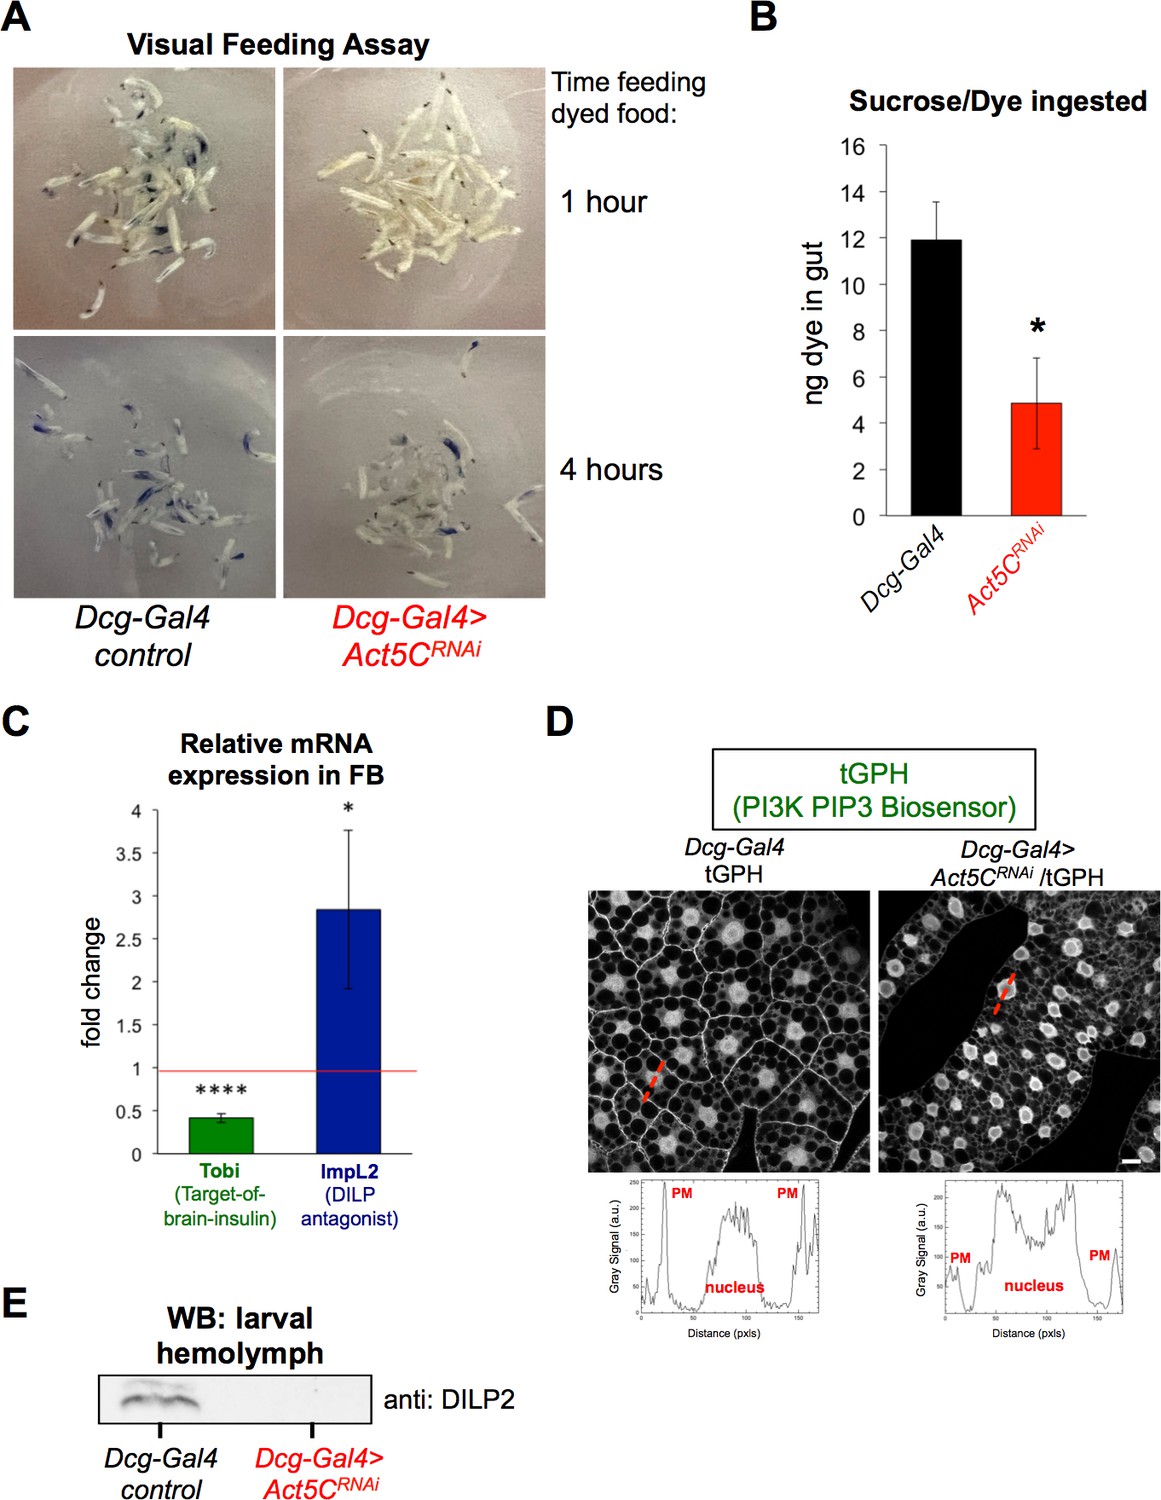
Act5C depletion in FB perturbs larval feeding and blunts insulin signaling.
(A) L3 larvae were allowed to feed on Coomassie blue-supplemented 20% sucrose. Larvae were imaged after 1 hr and 4 hr of feeding. (B) Colorimetric quantification of Coomassie blue isolated from larval guts following 4 hr of feeding. Dcg-Gal4 >Act5CRNAi larvae ingested significantly less Coomassie blue-stained sucrose. (C) Relative change in mRNAs for Tobi (Target-of-brain-insulin) and ImpL2 in Dcg-Gal4 >Act5CRNAi FBs compared to Dcg-Gal4 control. (D) Confocal sections of larval FBs expressing the PIP3-binding fluorescent biosensor tGPH. Linescans with quantified pixel intensities displayed in red with quantifications below. Act5C depletion results in reduced plasma membrane (PM) localization of tGPH. Scale bar 10 μm. (E) Western blot using anti:DILP2 antibody of larval hemolymph, loaded for equal volume of hemolymph.
Figure 7
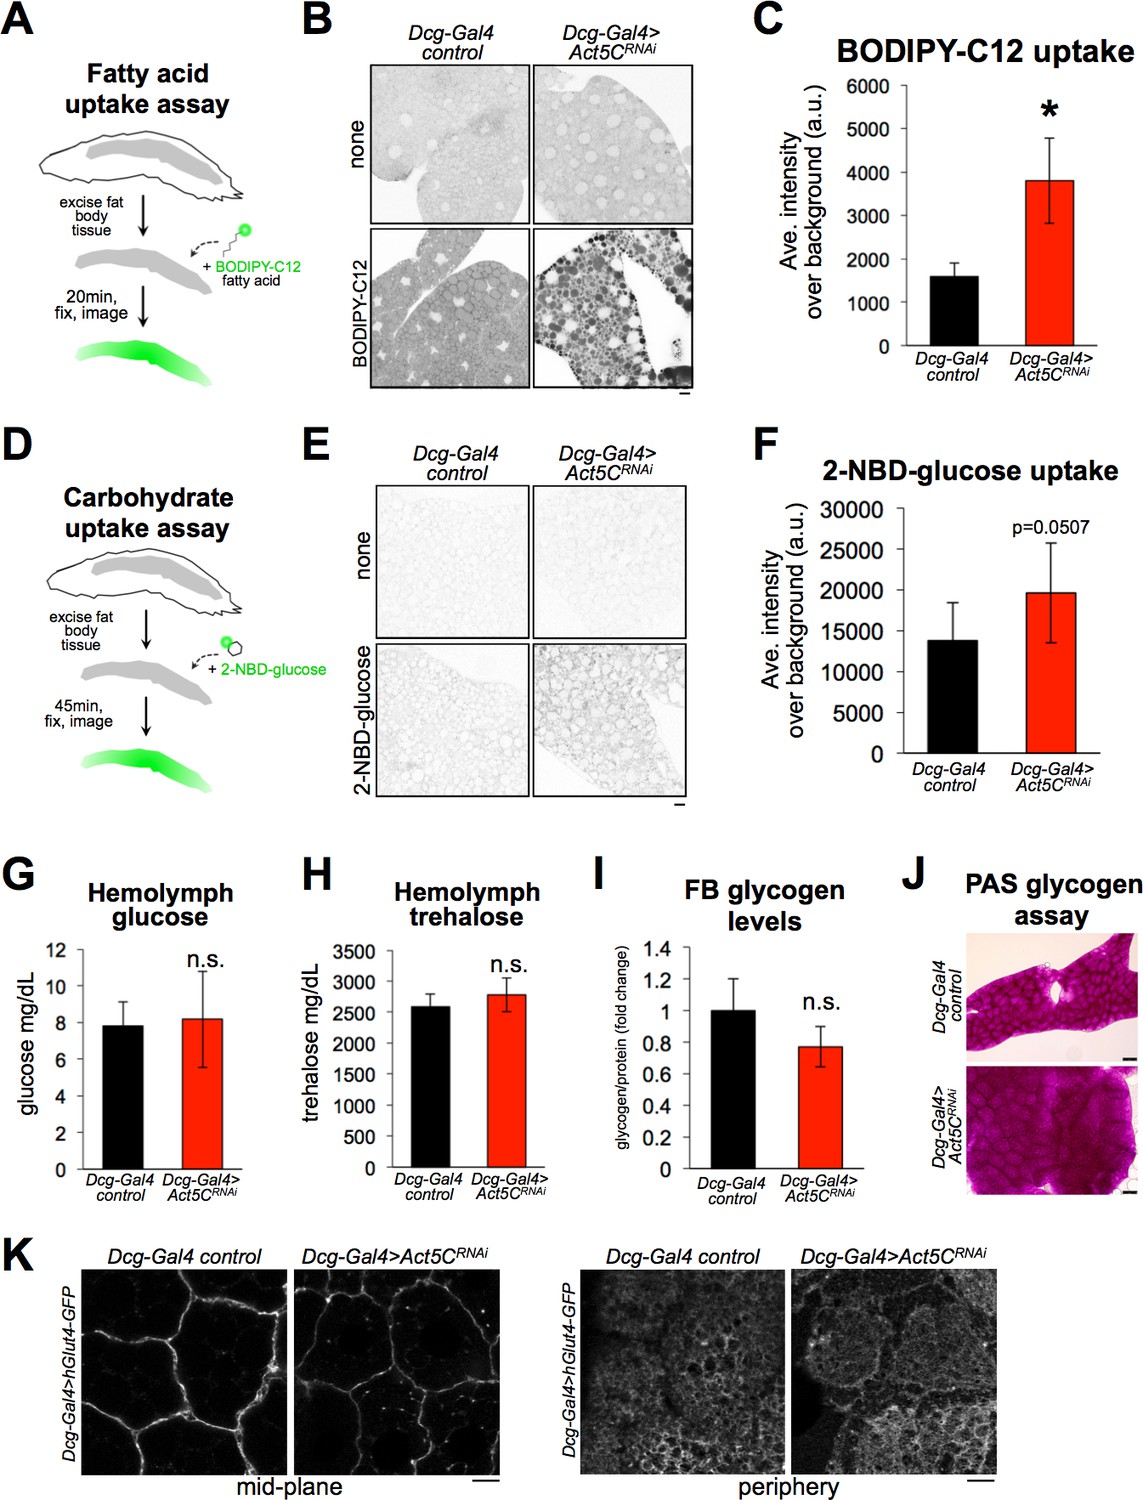
Loss of Act5C does not reduce the ability of fat bodies to absorb carbohydrates or lipids.
(A) Cartoon of BODIPY-C12 fatty acid uptake assays using extracted larval FBs. (B) Inverted-LUT fluorescence confocal image of BODIPY-C12-exposed larval Dcg-Gal4 control and Dcg-Gal4 >Act5CRNAi FBs. LD are also stained with MDH. Scale bar 10 μm. (C) Quantification of BODIPY-C12 average intensities in larval FBs as in B. (D) Cartoon of 2-NBD-glucose (2-NBDG) carbohydrate uptake assays using extracted larval FBs. (E) Inverted-LUT fluorescence confocal image of 2-NBDG exposed larval FBs. Scale bar 10 μm. (F) Quantification of 2-NBDG average intensities in larval FBs as in E. (G) Larval hemolymph glucose levels (mg/dL) from control or Act5CRNAi larvae. (H) Larval hemolymph trehalose levels (mg/dL) from control or Act5CRNAi larvae. (I) Isolated larval FB glycogen levels from control or Act5CRNAi larvae. (J) Periodic acid-Schiff (PAS) glycogen stain of larval FBs from control or Act5CRNAi larvae. (K) Confocal images of larval FBs expressing Dcg-Gal4 >UAS-hGlut4-GFP at cell edges. Scale bar 10 μm.
Figure 8 with 1 supplement
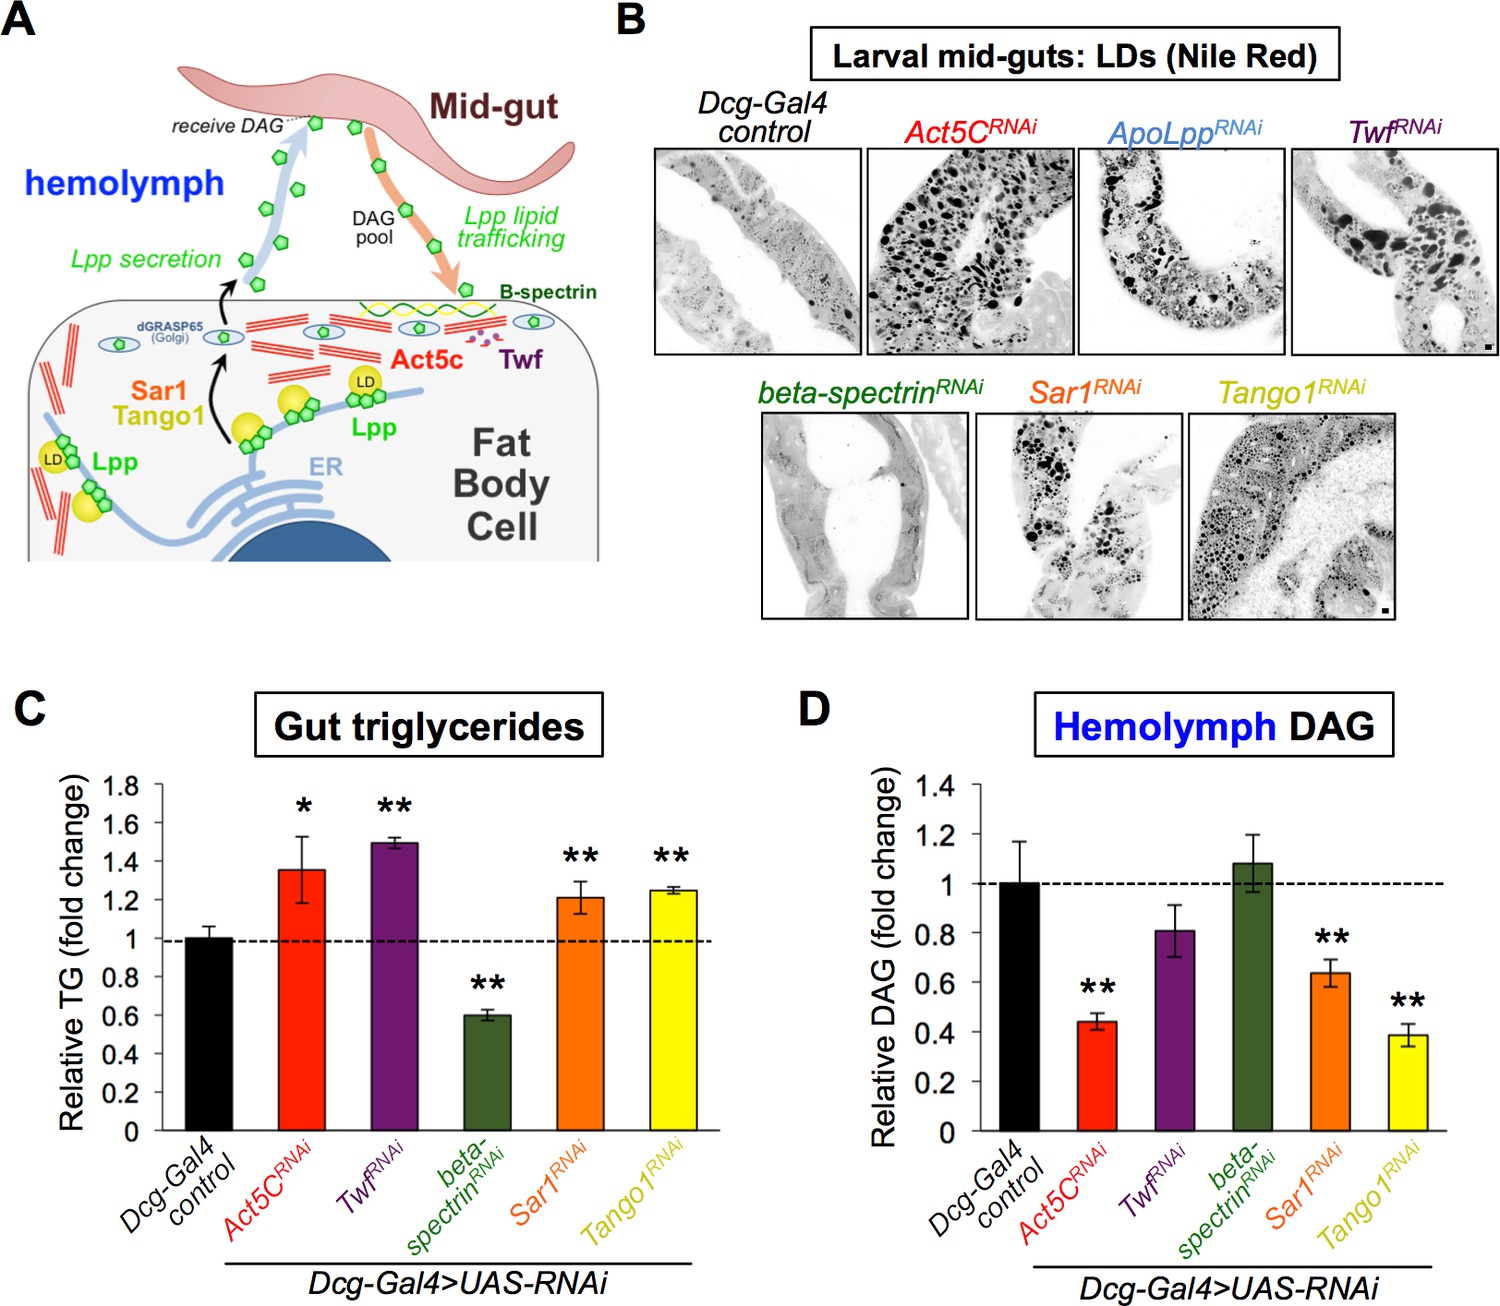
Act5C loss alters lipoprotein secretion from the fat body and gut:fat body inter-organ lipid transport.
(A) Cartoon of lipophorin (Lpp) secretion from FB cells via a Sar1/Tango1-dependent secretory pathway followed by Lpp-mediated mid-gut:FB inter-organ lipid transport,. (B) Larval mid-guts from Dcg-Gal4 control and Dcg-Gal4 >UAS RNAi (indicated genes) stained with Nile Red. Scale bar 10 μm. (C) Relative TG levels in isolated larval guts from control and UAS-RNAi larvae (as in B). (D) Relative hemolymph diacylglycerol (DAG) levels in control and UAS-RNAi larvae (as in B and C).
Figure 8—figure supplement 1
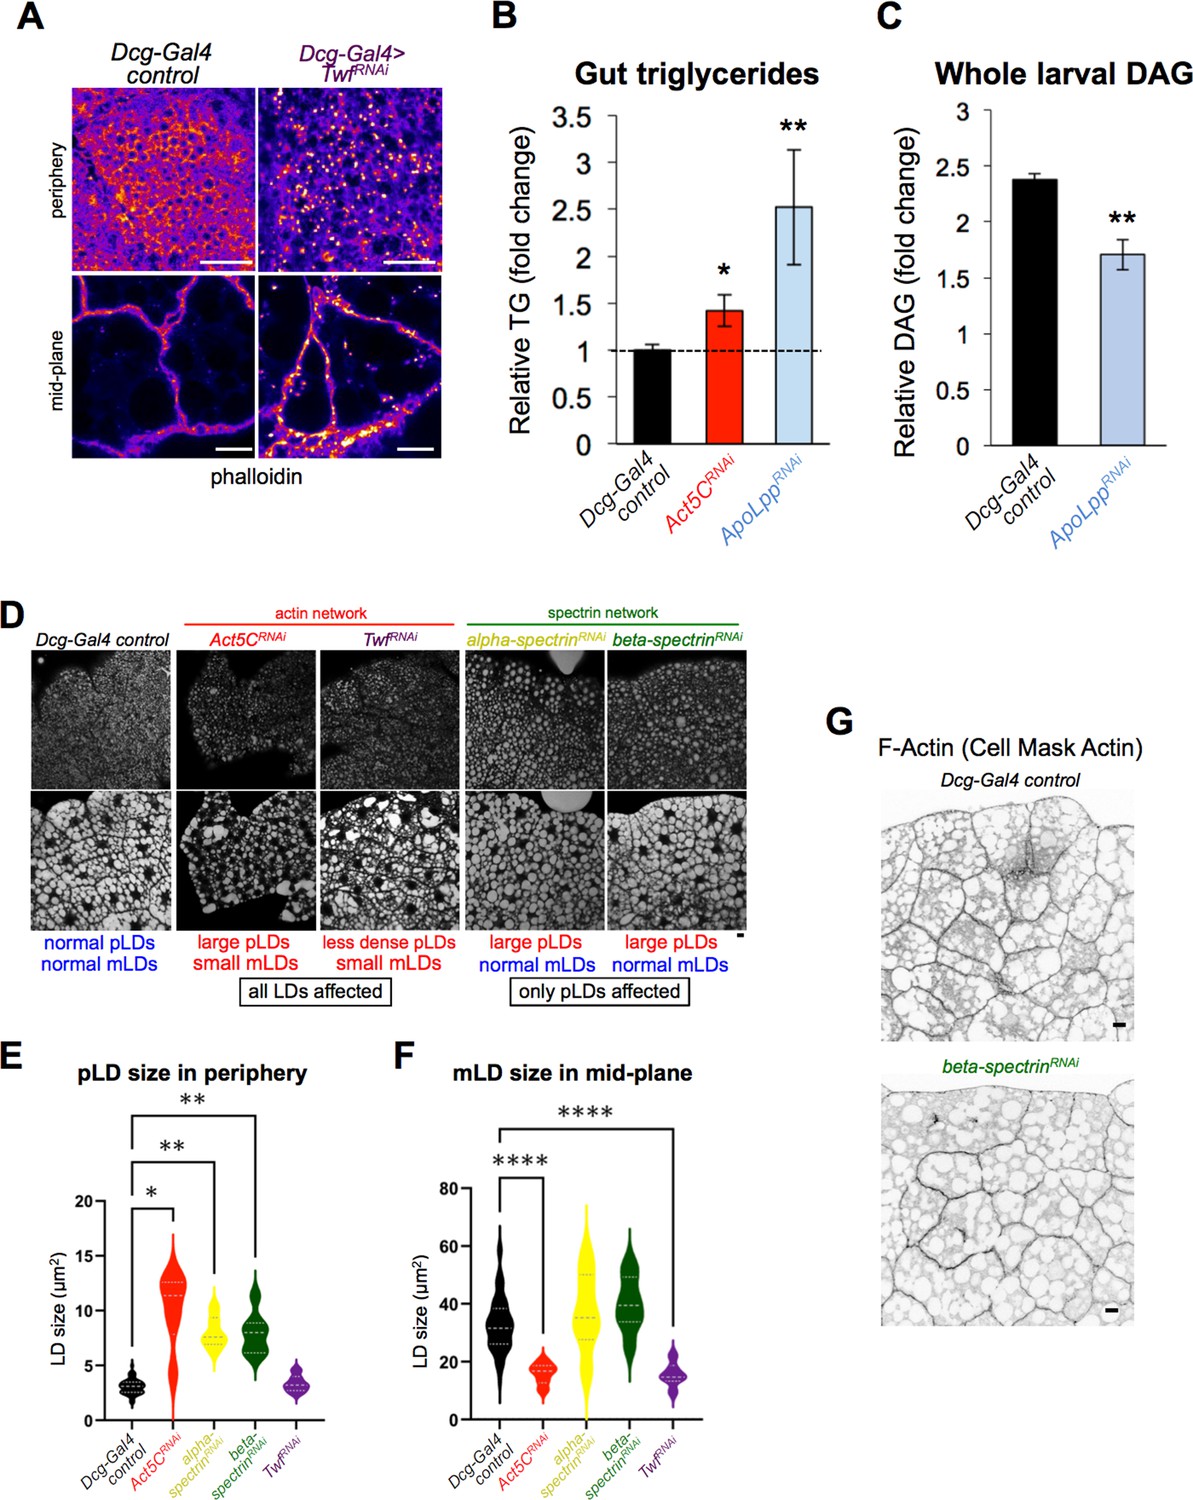
Loss of Act5C perturbs FB inter-organ lipid trafficking.
(A) Confocal sections of larval FBs stained for phalloidin (LUT-Fire) from Dcg-Gal4 control and Dcg-Gal4 >TwinfilinRNAi (Twf). Scale bar 50 μm (top) or 10 μm (bottom). (B) Relative triglyceride (TG) in isolated larval guts from Dcg-Gal4 control, Dcg-Gal4 >Act5CRNAi, and Dcg-Gal4 >ApoLppRNAi. (C) Total diacylglycerol (DAG) from Dcg-Gal4 control and Dcg-Gal4 >ApoLppRNAi whole larvae. (D) Fluorescent micrographs of L3 larval FBs stained for LDs (MDH). Peripheral (top) and mid-plane (bottom) views are shown for Dcg-Gal4 control tissue as well as indicated RNAi lines depleted in the FB via Dcg-Gal4. Scale bar 10 μm. (E) Size quantifications for peripheral LDs (pLDs) observed in confocal sections of the FB periphery as in Panel D. (F) Size quantifications for mid-plane LDs (mLDs) observed in confocal sections of the FB mid-plane as in Panel D. (G) Inverted LUT confocal mid-plane sections of larval FBs stained for F-actin (Cell Mask Actin). Dcg-Gal4 control and Dcg-Gal4 >beta-spectrinRNAi samples displayed. Scale bar 10 μm.
Figure 9 with 1 supplement
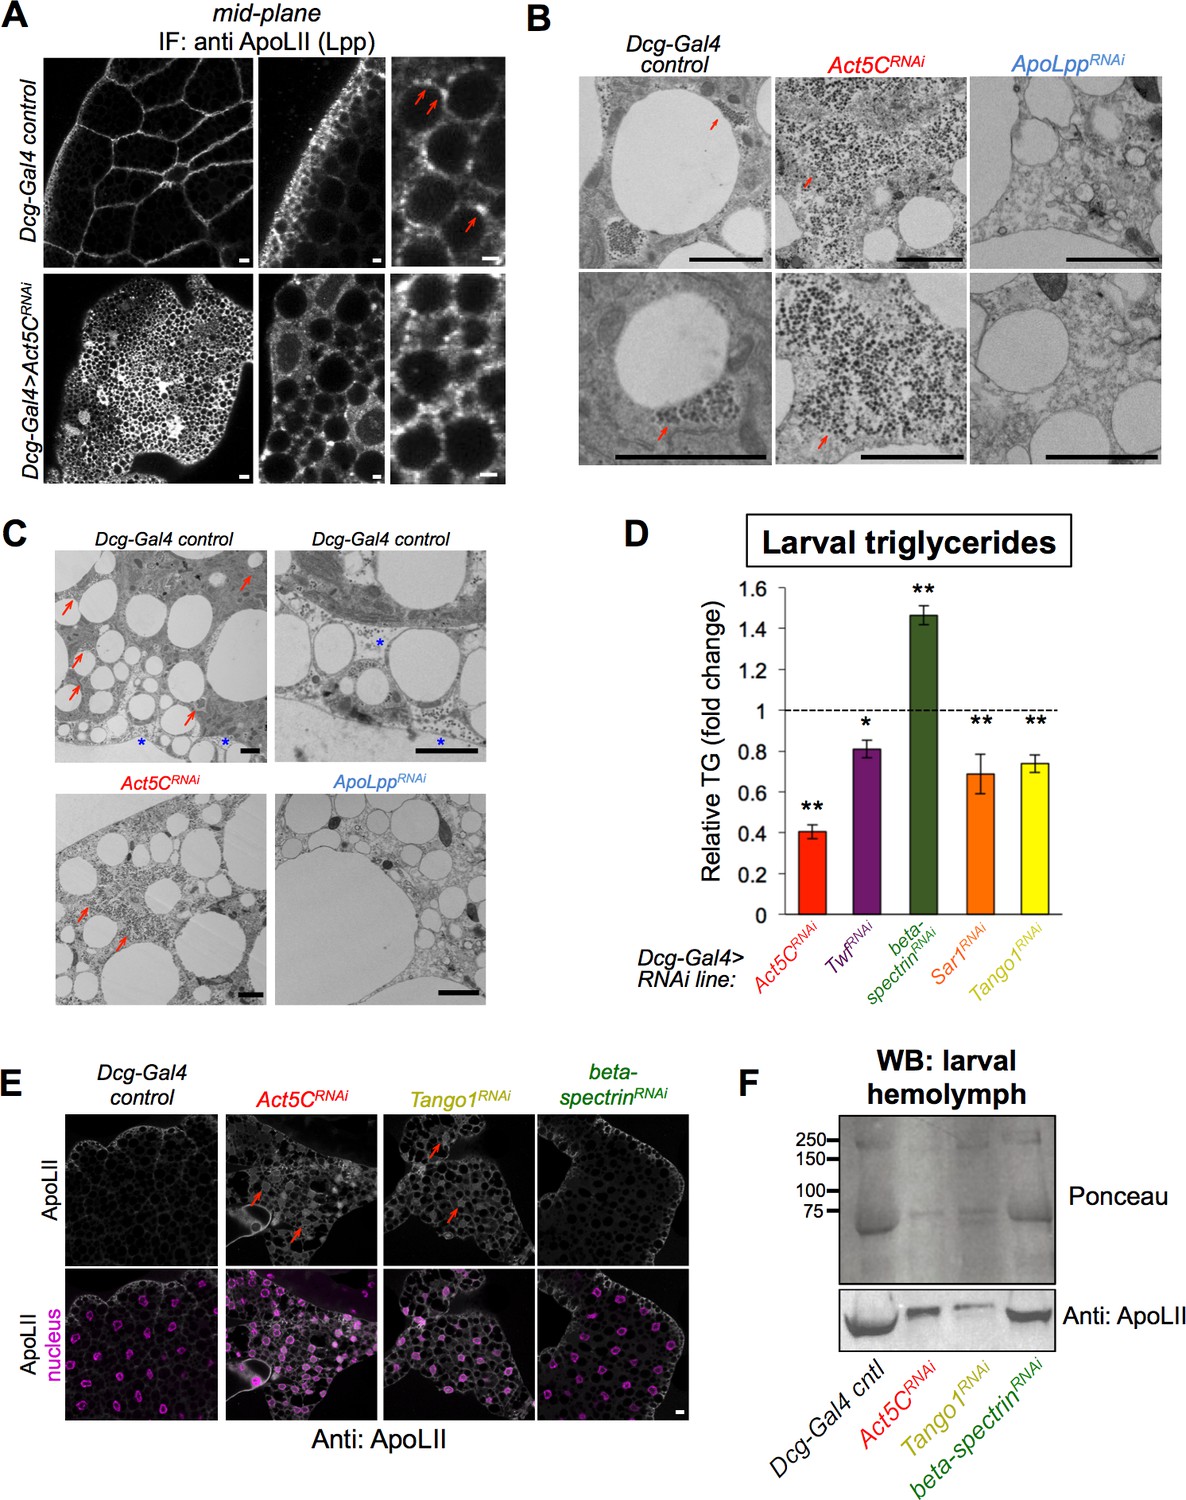
Act5C loss perturbs Lpp secretion similar to secretory pathway perturbation.
(A) Confocal immuno-fluorescence (IF) images of Dcg-Gal4 control and Act5CRNAi larval FBs stained for lipophorin (Lpp) lipoprotein component ApoLII (anti:ApoLII) and imaged through tissue mid-plane. Red arrows indicate Lpp punctae adjacent to pLDs (LDs denoted by negative space). Scale bars: (left) 10 μm, (center, right) 2 μm. (B) Transmission electron micrographs (TEM) of FBs from Dcg-Gal4 control, Dcg-Gal4 >Act5CRNAi, or Dcg-Gal4 >ApoLppRNAi larvae. Red arrows indicate Lpp-like particles of ~60 nm diameter, which are absent in ApoLppRNAi FB. Scale bars: 2 μm. (C) Negative stain, thin section transmission electron microscopy (TEM) of L3 larvae. FBs are from control, Act5CRNAi, or ApoLppRNAi larvae as above. Red arrows indicate Lpp-like particle clusters. Blue stars indicate Lpp-like particles in pockets of extracellular space at the micro-ridges of the FB tissue periphery. Scale bar is 2 μm. (D) Relative whole-larval triglyceride (TG) levels for indicated Dcg-Gal4 >UAS RNAi lines compared to Dcg-Gal4 controls. (E) Immunofluorescence (IF) micrographs of larval FBs stained for Lpp component ApoLII and DAPI (nuclei). FBs from Dcg-Gal4 control and indicated Dcg-Gal4 >UAS RNAi larvae are shown. Red arrows denote intracellular regions of ApoLII accumulations in RNAi lines, not present in control. Scale bar is 10 μm. (F) Ponceau protein stain and Western blot of hemolymph isolated from L3 larvae (equal volumes of hemolymph loaded). The western blot is against Lpp protein ApoLII.
Figure 9—figure supplement 1
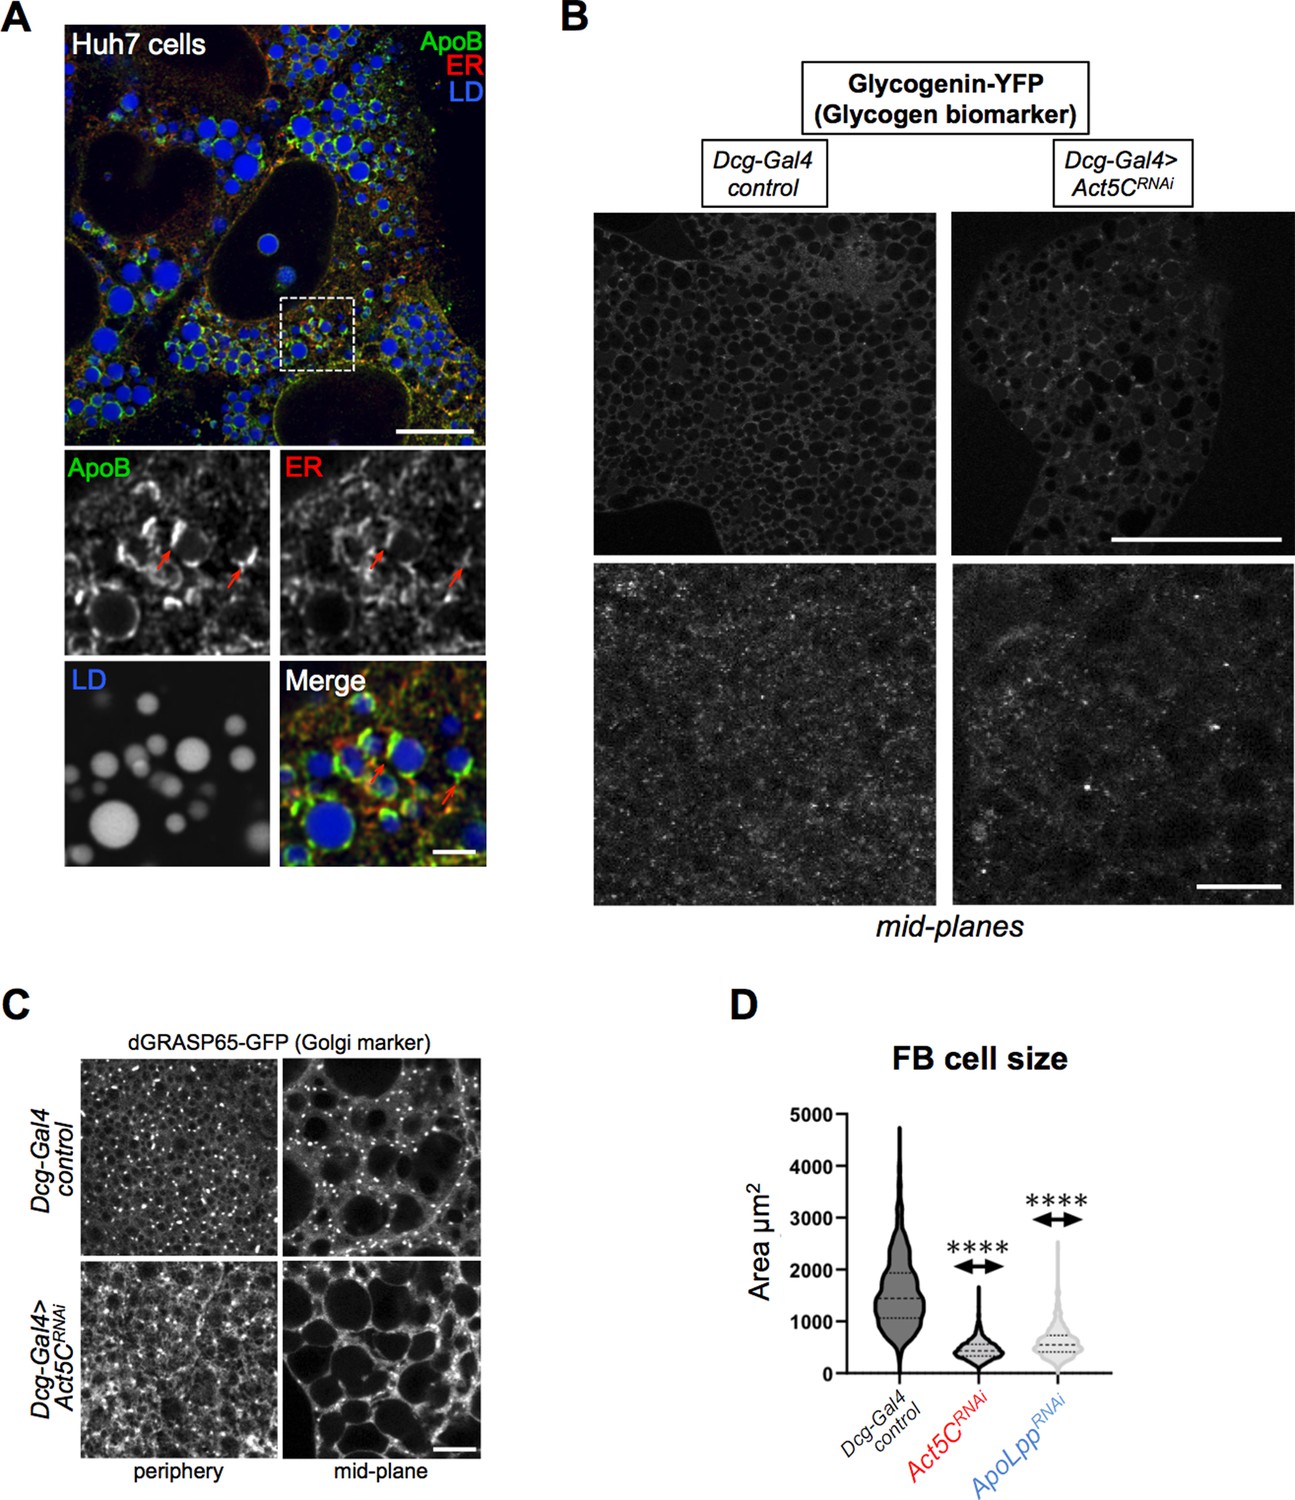
Act5C is necessary for Lpp secretion.
(A) Immuno-fluorescence (IF) confocal micrograph of human Huh7 hepatocytes immuno-stained for ApoB (green), the ER network (anti: calnexin, red), and co-stained for LDs (MDH, blue). Red arrows indicate ApoB. Scale bar is 4 μm. (B) Confocal mid-plane sections of larval FBs expressing glycogen binding protein glycogenin (Dcg-Gal4 >Glycogenin YFP). Glycogenin-YFP is distributed throughout FB cells. Scale bar 100 μm (top) and 10 μm (bottom). (C) Confocal images of L3 larvae from control or Act5CRNAi samples expressing Golgi-marker UAS-dGRASP65-GFP. Scale bar is 10 μm. (D) Violin plots of larval FB cell sizes for Dcg-Gal4 control, Dcg-Gal4 >Act5CRNAi, and Dcg-Gal4 >ApoLppRNAi.
Figure 10
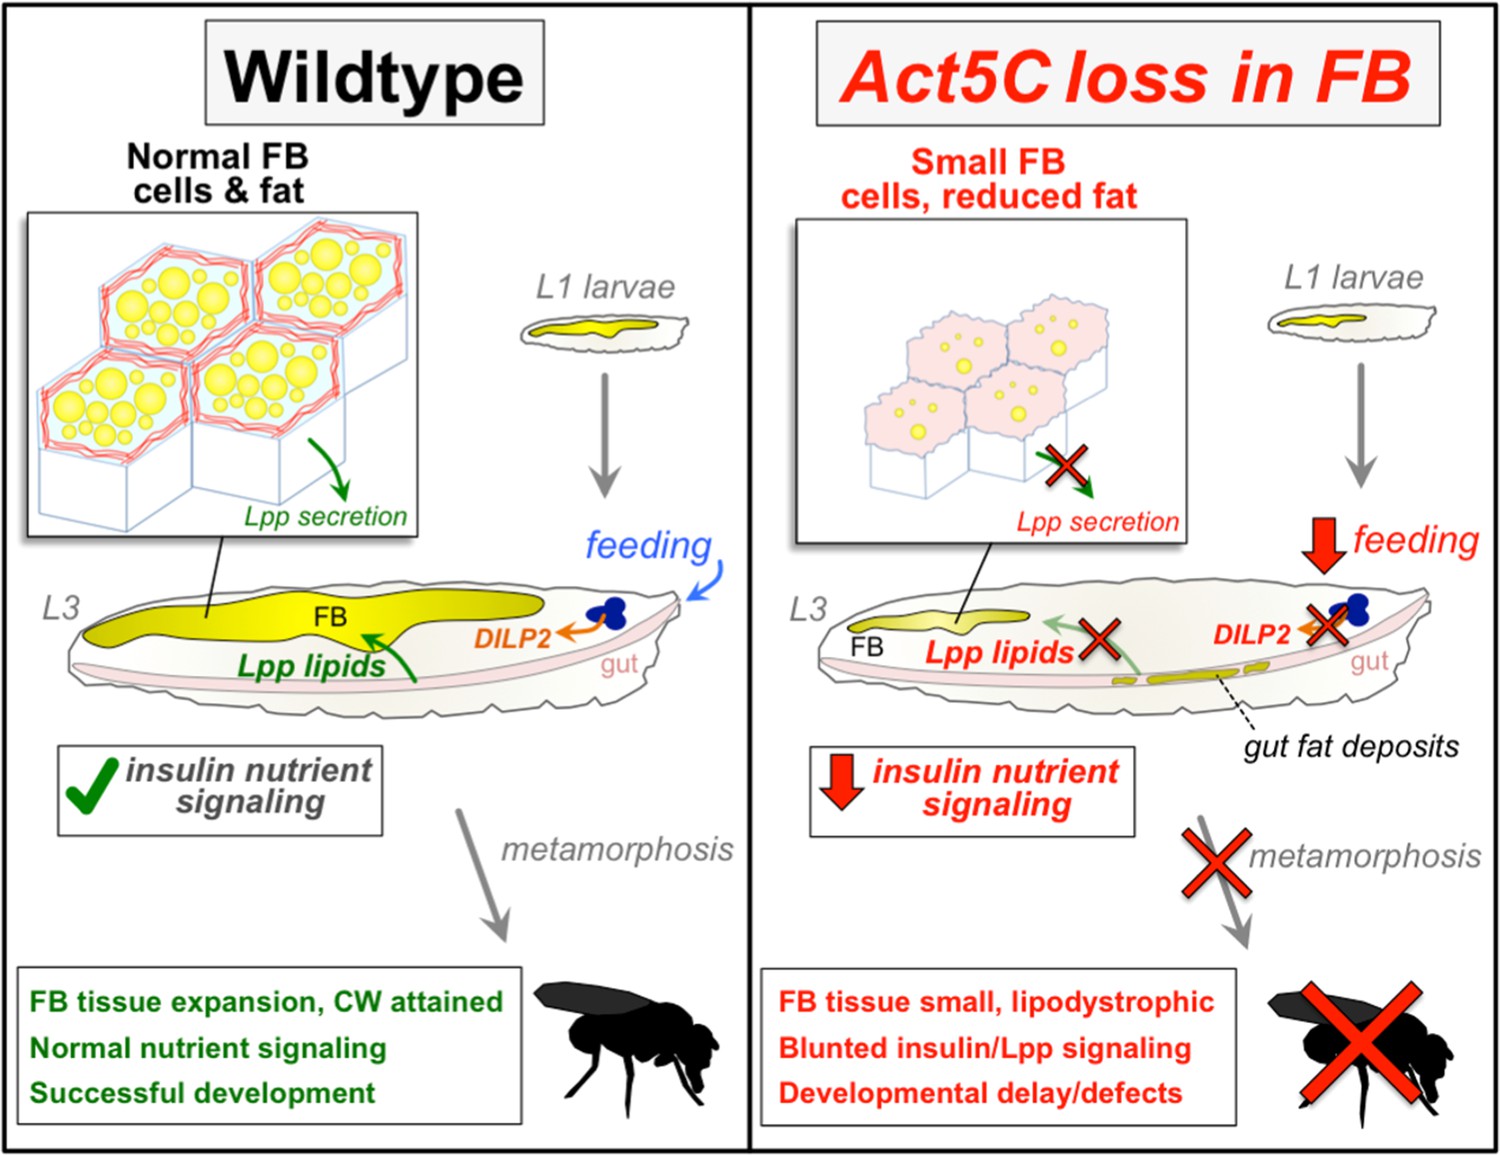
Working model for role of Act5C in FB cell and tissue expansion, Lpp-mediated inter-organ lipid transport, nutrient signaling, and fly development.
Additional files
-
Supplementary file 1
Drosophila lines and tools.
Table of Drosophila lines used in this study.
- https://cdn.elifesciences.org/articles/81170/elife-81170-supp1-v2.xlsx
-
Supplementary file 2
Table of developmental phenotypes.
Table of developmental phenotypes associated with different Drosophila lines used in this study.
- https://cdn.elifesciences.org/articles/81170/elife-81170-supp2-v2.xlsx
-
Supplementary file 3
Oligos table.
Table of oligos used in this study.
- https://cdn.elifesciences.org/articles/81170/elife-81170-supp3-v2.xlsx
-
MDAR checklist
- https://cdn.elifesciences.org/articles/81170/elife-81170-mdarchecklist1-v2.pdf
Download links
A two-part list of links to download the article, or parts of the article, in various formats.
Downloads (link to download the article as PDF)
Open citations (links to open the citations from this article in various online reference manager services)
Cite this article (links to download the citations from this article in formats compatible with various reference manager tools)
The fat body cortical actin network regulates Drosophila inter-organ nutrient trafficking, signaling, and adipose cell size
eLife 12:e81170.
https://doi.org/10.7554/eLife.81170


