Cyclic AMP is a critical mediator of intrinsic drug resistance and fatty acid metabolism in M. tuberculosis
- Laboratory of Host-Pathogen Biology, The Rockefeller University, United States
- Department of Microbiology and Immunology, Weill Cornell Medicine, United States
- Division of Infectious Diseases, Department of Medicine, Weill Cornell Medicine, United States
- Department of Microbiology and Immunology, College of Veterinary Medicine, Cornell University, United States
Figures
Figure 1 with 1 supplement
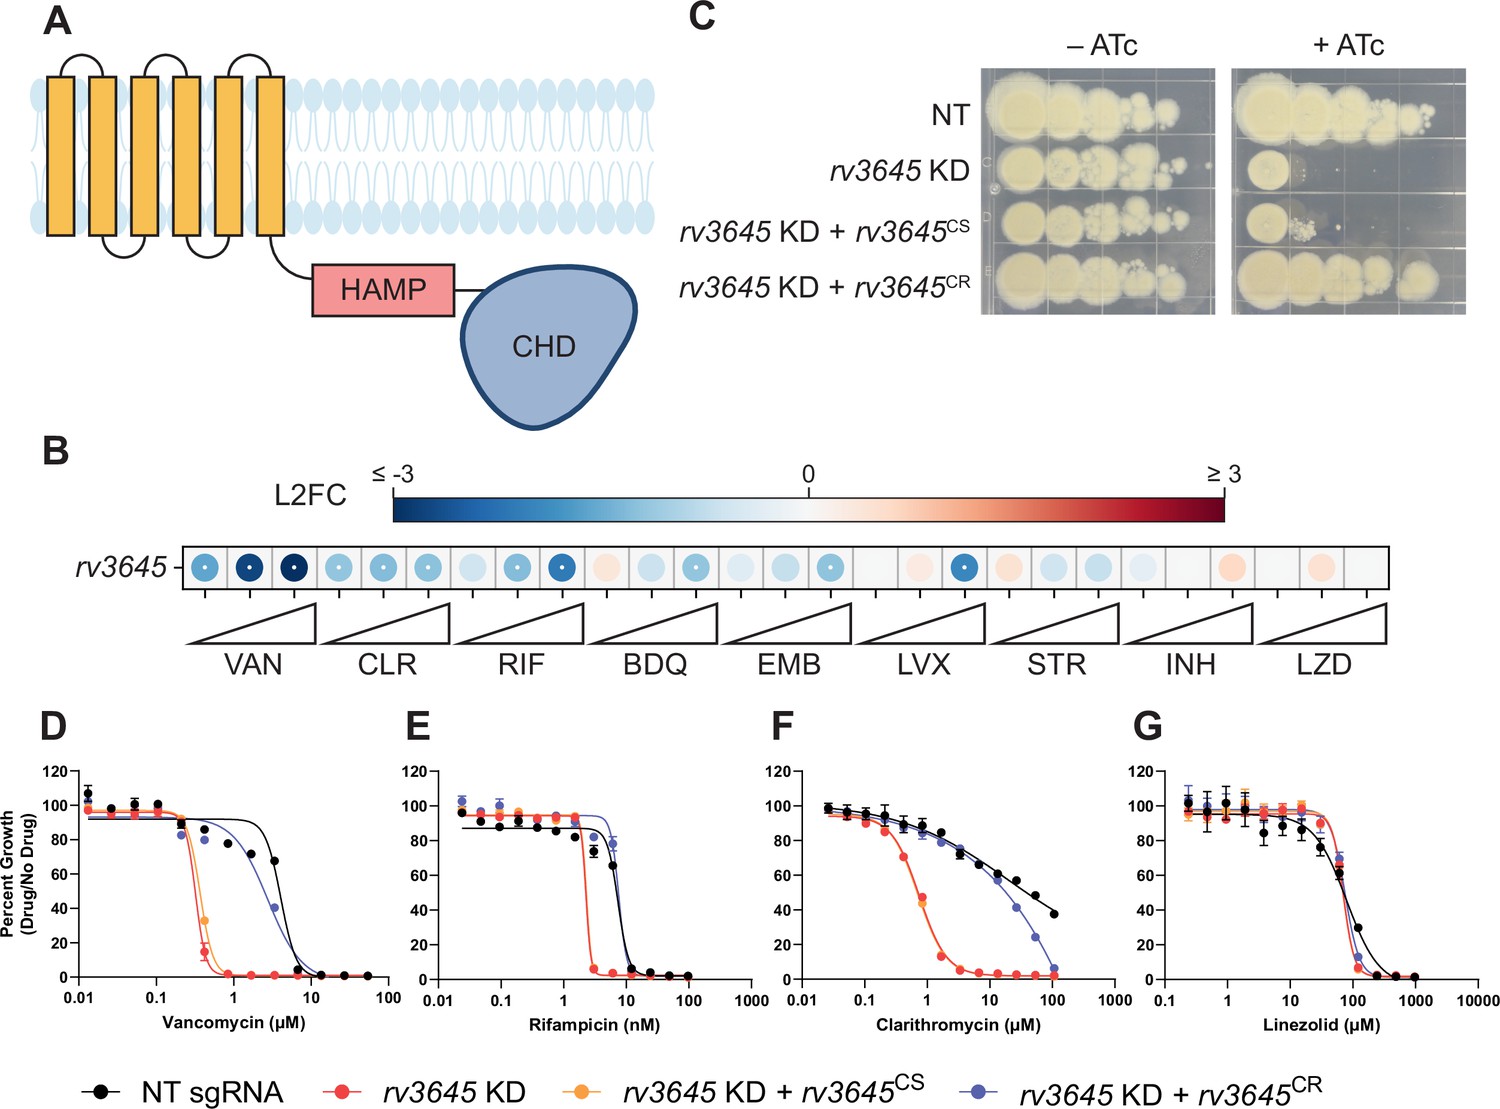
The adenylate cyclase rv3645 is critical for intrinsic multidrug resistance in Mycobacterium tuberculosis (Mtb).
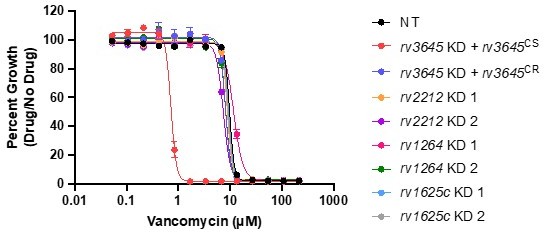
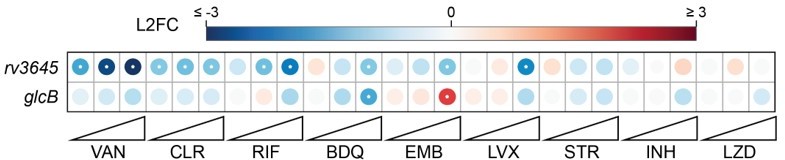
(A) Predicted domain organization of Rv3645. N-terminal transmembrane helices, HAMP domain, and C-terminal cytosolic adenylate cyclase domain (CHD) are shown. HAMP = Histidine kinases, Adenylate cyclases, Methyl-accepting proteins, and Phosphatases; CHD = Cyclase Homology Domain. (B) Feature-expression heatmap of rv3645 from a 5 day CRISPRi library pre-depletion screen. The color of each circle represents the gene-level log2 fold change (L2FC); a white dot represents a false discovery rate (FDR) <0.01 and a |L2FC|>1. VAN = vancomycin; CLR = clarithromycin; RIF = rifampicin; BDQ = bedaquiline; EMB = ethambutol; LVX = levofloxacin; STR = streptomycin; INH = isoniazid; LZD = linezolid. Each antibiotic was tested in triplicate at three sub-minimum inhibitory concentrations (sub-MIC90) listed in Figure 1—source data 1. (C) Growth of rv3645 CRISPRi strains on 7H10-OADC agar. Columns represent 10-fold serial dilutions in cell number. NT = non-targeting sgRNA; KD = knockdown; CS = CRISPRi-sensitive; CR = CRISPRi-resistant. (D–G) Dose-response curves for (D) vancomycin, (E) rifampicin, (F) clarithromycin, and (G) linezolid were measured against rv3645 CRISPRi strains. Data represent mean ± SEM for technical triplicates and are representative of at least two independent experiments.
-
Figure 1—source data 1
Antibiotic concentrations (nanomolar) used for CRISPRi chemical-genetic interaction screens.
Each antibiotic was tested at three sub-MIC90 concentrations in biological triplicate (Li et al., 2022).
- https://cdn.elifesciences.org/articles/81177/elife-81177-fig1-data1-v2.xlsx
Figure 1—figure supplement 1
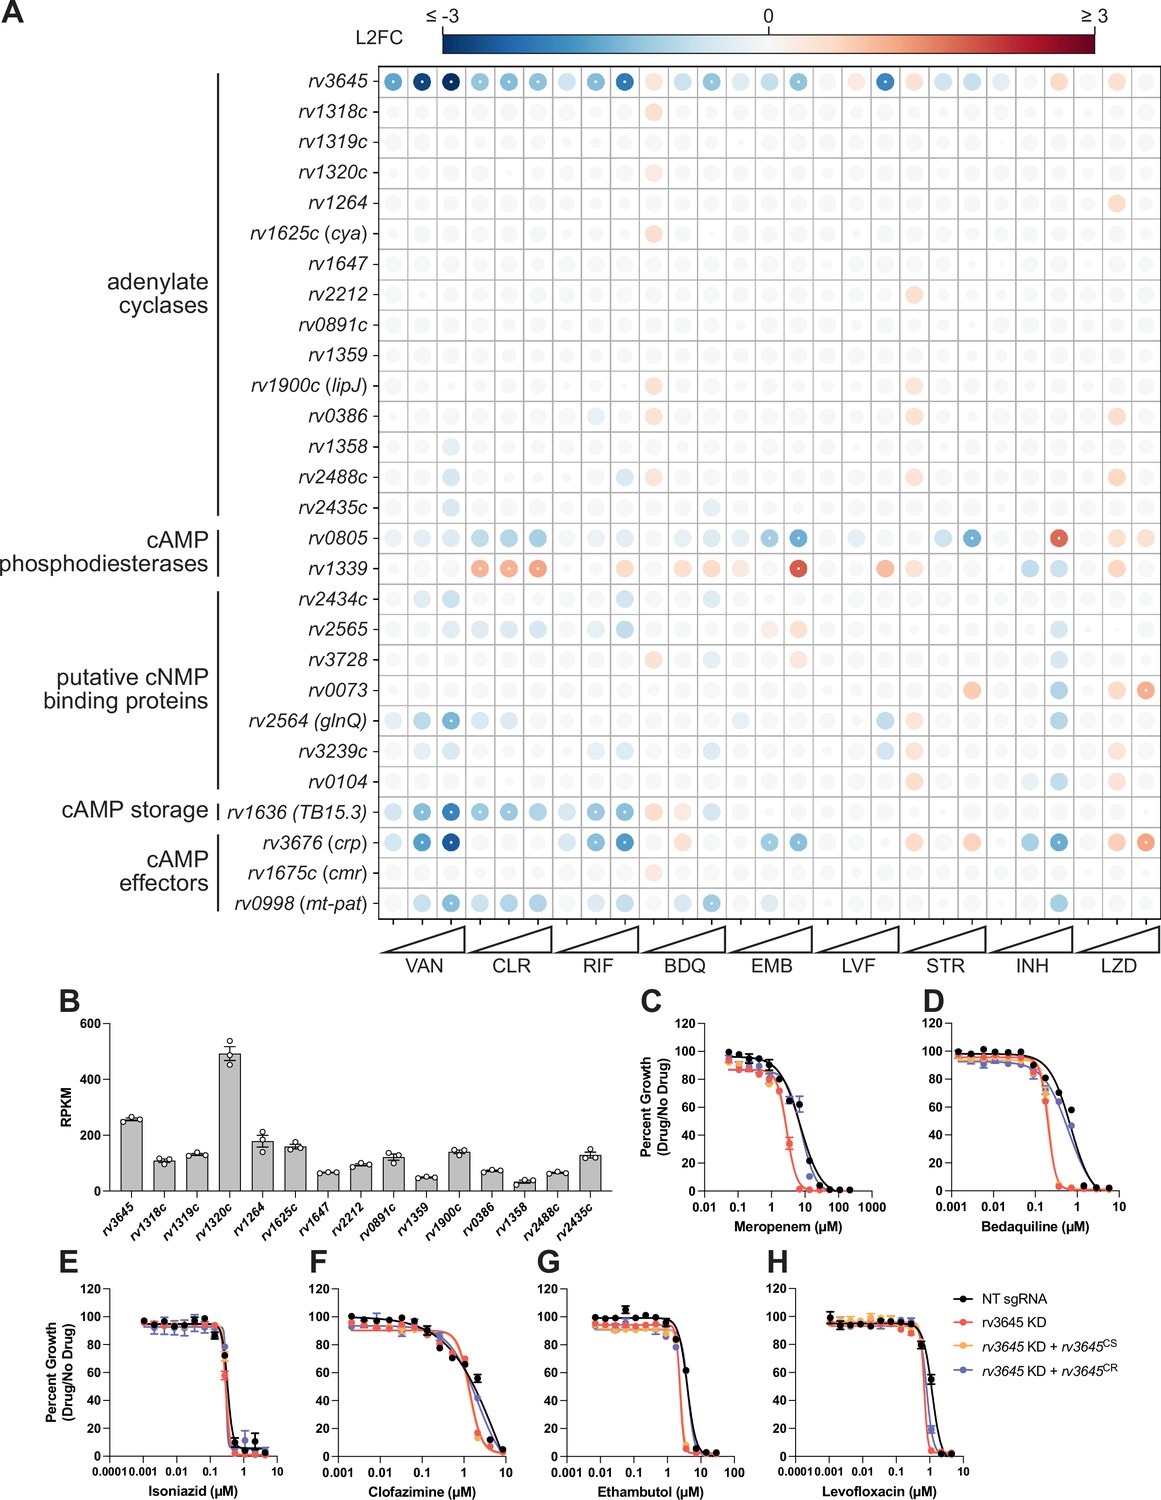
rv3645 contributes to multidrug intrinsic resistance in H37Rv Mycobacterium tuberculosis (Mtb).
(A) Feature-expression heatmap of annotated adenylate cyclase, cAMP phosphodiesterase, putative cNMP binding protein, cAMP storage, and cAMP effector genes from a 5 day CRISPRi library pre-depletion screen (Li et al., 2022). The color of each circle represents the gene-level L2FC; a white dot represents a false discovery rate (FDR) <0.01 and a |L2FC|>1. VAN = vancomycin; CLR = clarithromycin; RIF = rifampicin; BDQ = bedaquiline; EMB = ethambutol; LVX = levofloxacin; STR = streptomycin; INH = isoniazid; LZD = linezolid. (B) Expression of 15 adenylate cyclase genes in Mtb H37Rv. Transcript abundance for each gene in WT Mtb H37Rv, plotted as RPKM generated by RNA-seq transcriptional profiling. RPKM = reads per kilobase of transcript, per million reads mapped. Data represent mean ± SEM for biological triplicates. (C–H) Dose-response curves for meropenem (C), bedaquiline (D), isoniazid (E), clofazimine (F), ethambutol (G), and levofloxacin (H). NT = non-targeting; KD = knockdown; CS = CRISPRi-sensitive; CR = CRISPRi-resistant. Data represent mean ± SEM for technical triplicates and are representative of three independent experiments.
Figure 2 with 1 supplement
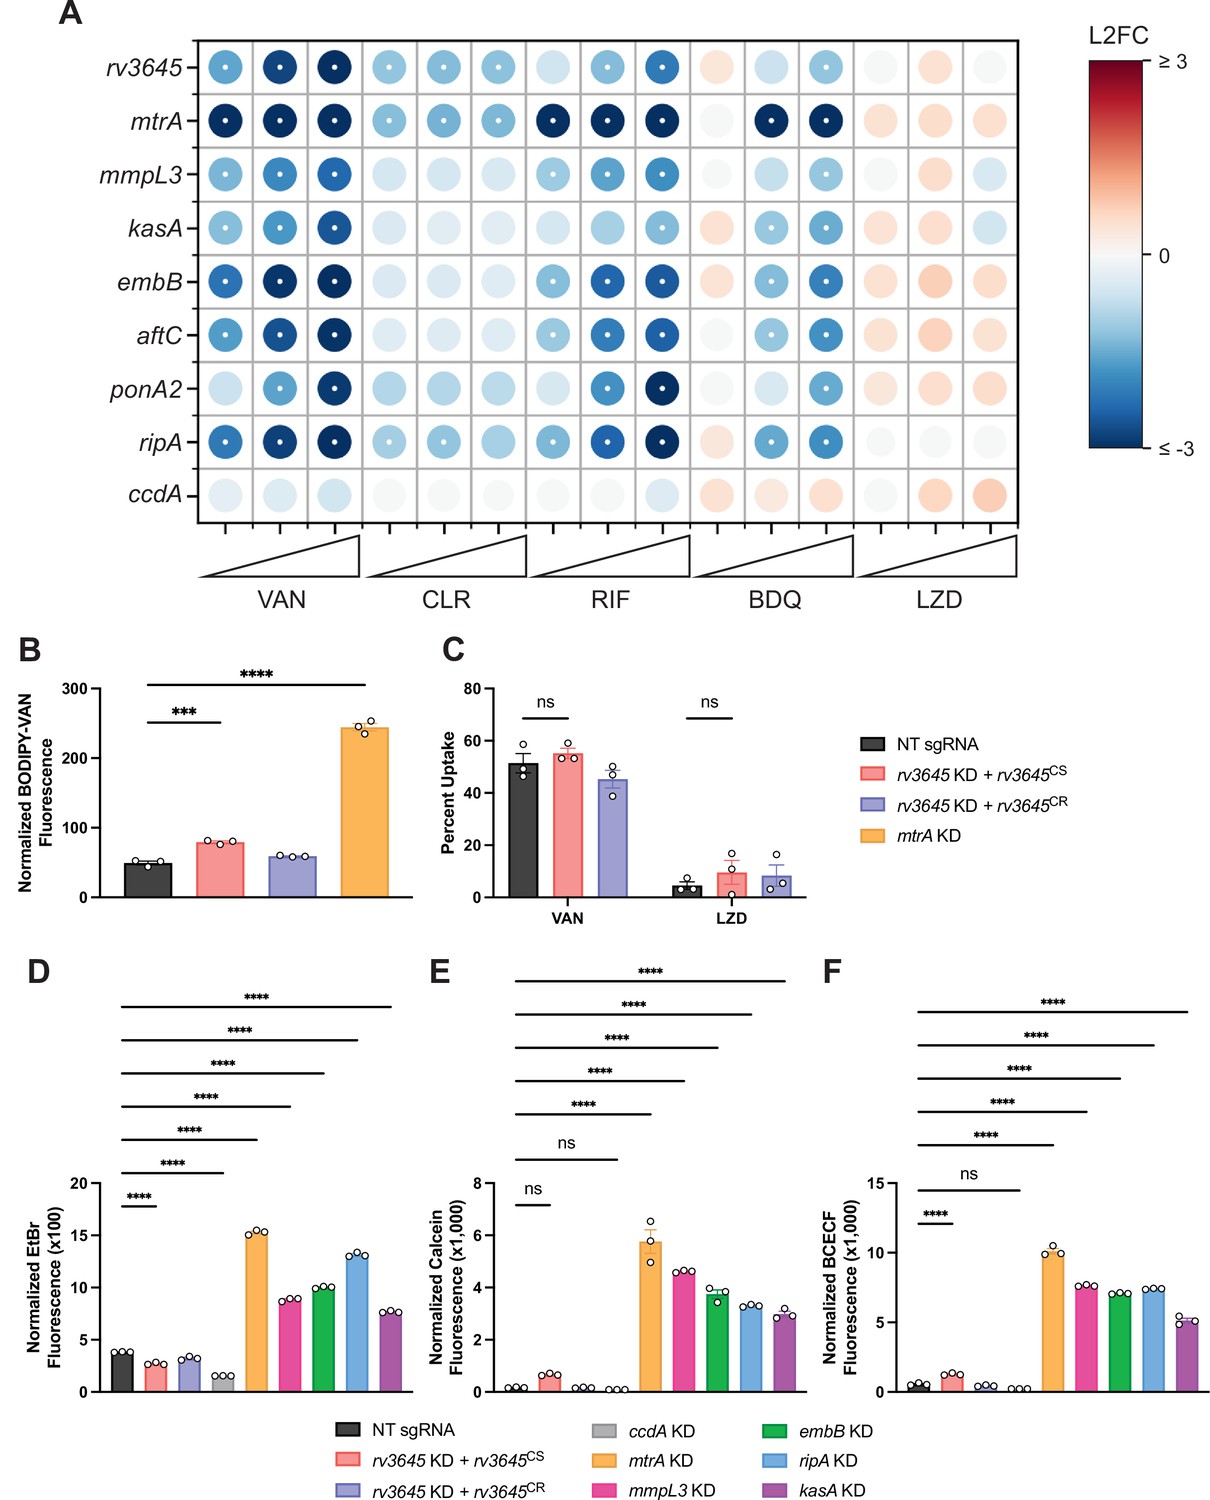
Increased drug sensitivity in rv3645 knockdown strains is not due to large increases in envelope permeability.
(A) Feature-expression heatmap of genes important for Mycobacterium tuberculosis (Mtb) cell envelope biosynthesis from the 5 day CRISPRi library pre-depletion screen for select drugs. ccdA is an in vitro essential non-hit control gene unrelated to envelope biosynthesis. The color of each circle represents the gene-level L2FC; a white dot represents a false discovery rate (FDR) of <0.01 and a |L2FC|>1. VAN = vancomycin; CLR = clarithromycin; RIF = rifampicin; BDQ = bedaquiline; LZD = linezolid. (B) BODIPY-Vancomycin uptake of the indicated strains. Data represent mean ± SEM for three replicates and are representative of two independent experiments. ***, p<0.001; ****, p<0.0001. Statistical significance was assessed by one-way ANOVA. (C) Quantification of vancomycin and linezolid uptake by mass spectrometry for the indicated strains. Data represent mean ± SEM for technical triplicates. ns = not significant. Statistical significance was assessed by two-way ANOVA (GraphPad Prism). Percent Uptake values are listed in Figure 2—source data 1. (D–F) Ethidium bromide (D), Calcein-AM (E), and BCECF-AM (F) uptake of the indicated strains. NT = non-targeting sgRNA; KD = knockdown; CS = CRISPRi-sensitive; CR = CRISPRi-resistant. Data represent mean ± SEM for three technical replicates and are representative of at least two independent experiments. ****, p<0.0001. Statistical significance was assessed by one-way ANOVA.
-
Figure 2—source data 1
Antibiotic uptake in rv3645 CRISPRi strains.
Percent uptake values of antibiotics quantified by mass spectrometry in Figure 2C for the indicated strains. Each condition was tested in technical triplicate. NT = non-targeting sgRNA; KD = knockdown; CS = CRISPRi-sensitive; CR = CRISPRi-resistant.
- https://cdn.elifesciences.org/articles/81177/elife-81177-fig2-data1-v2.xlsx
Figure 2—figure supplement 1
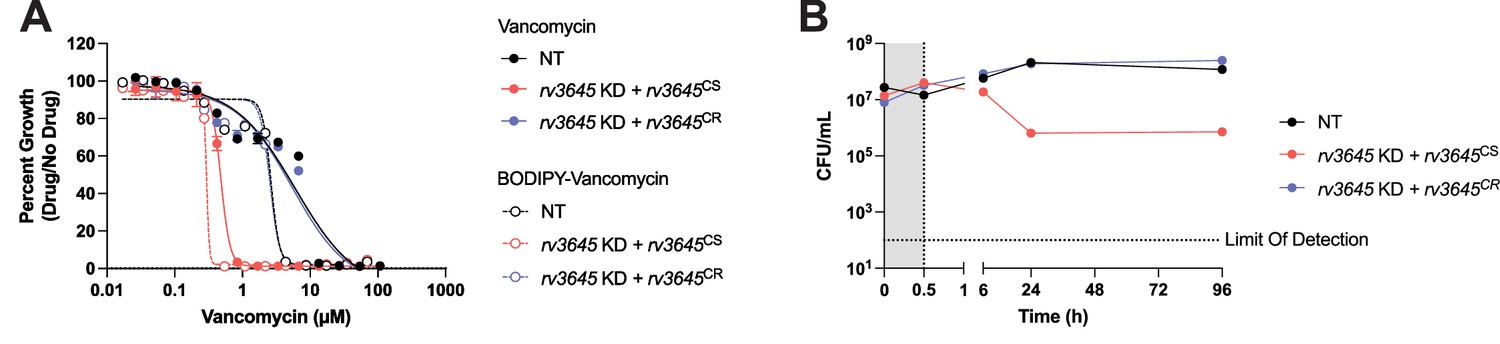
Validation of the BODIPY-conjugated vancomycin uptake assay.
(A) Dose-response curves for vancomycin and BODIPY-vancomycin were measured for the indicated Mycobacterium tuberculosis (Mtb) strains. NT = non-targeting sgRNA; KD = knockdown; CS = CRISPRi-sensitive; CR = CRISPRi-resistant. Data represent mean ± SEM for technical triplicates. (B) Time-kill curves for the indicated Mtb strains grown in 1.16 µM vancomycin, equivalent to the concentration of BODIPY-vancomycin used in the uptake assay in Figure 2B. Gray shading highlights 30 min of vancomycin exposure, corresponding to the time scale of the BODIPY-vancomycin uptake assay. Vancomycin was added at 0 hr and monitored for 96 hr. The limit of detection in this assay was 100 CFU/mL. CFU = colony forming units.
Figure 3 with 2 supplements
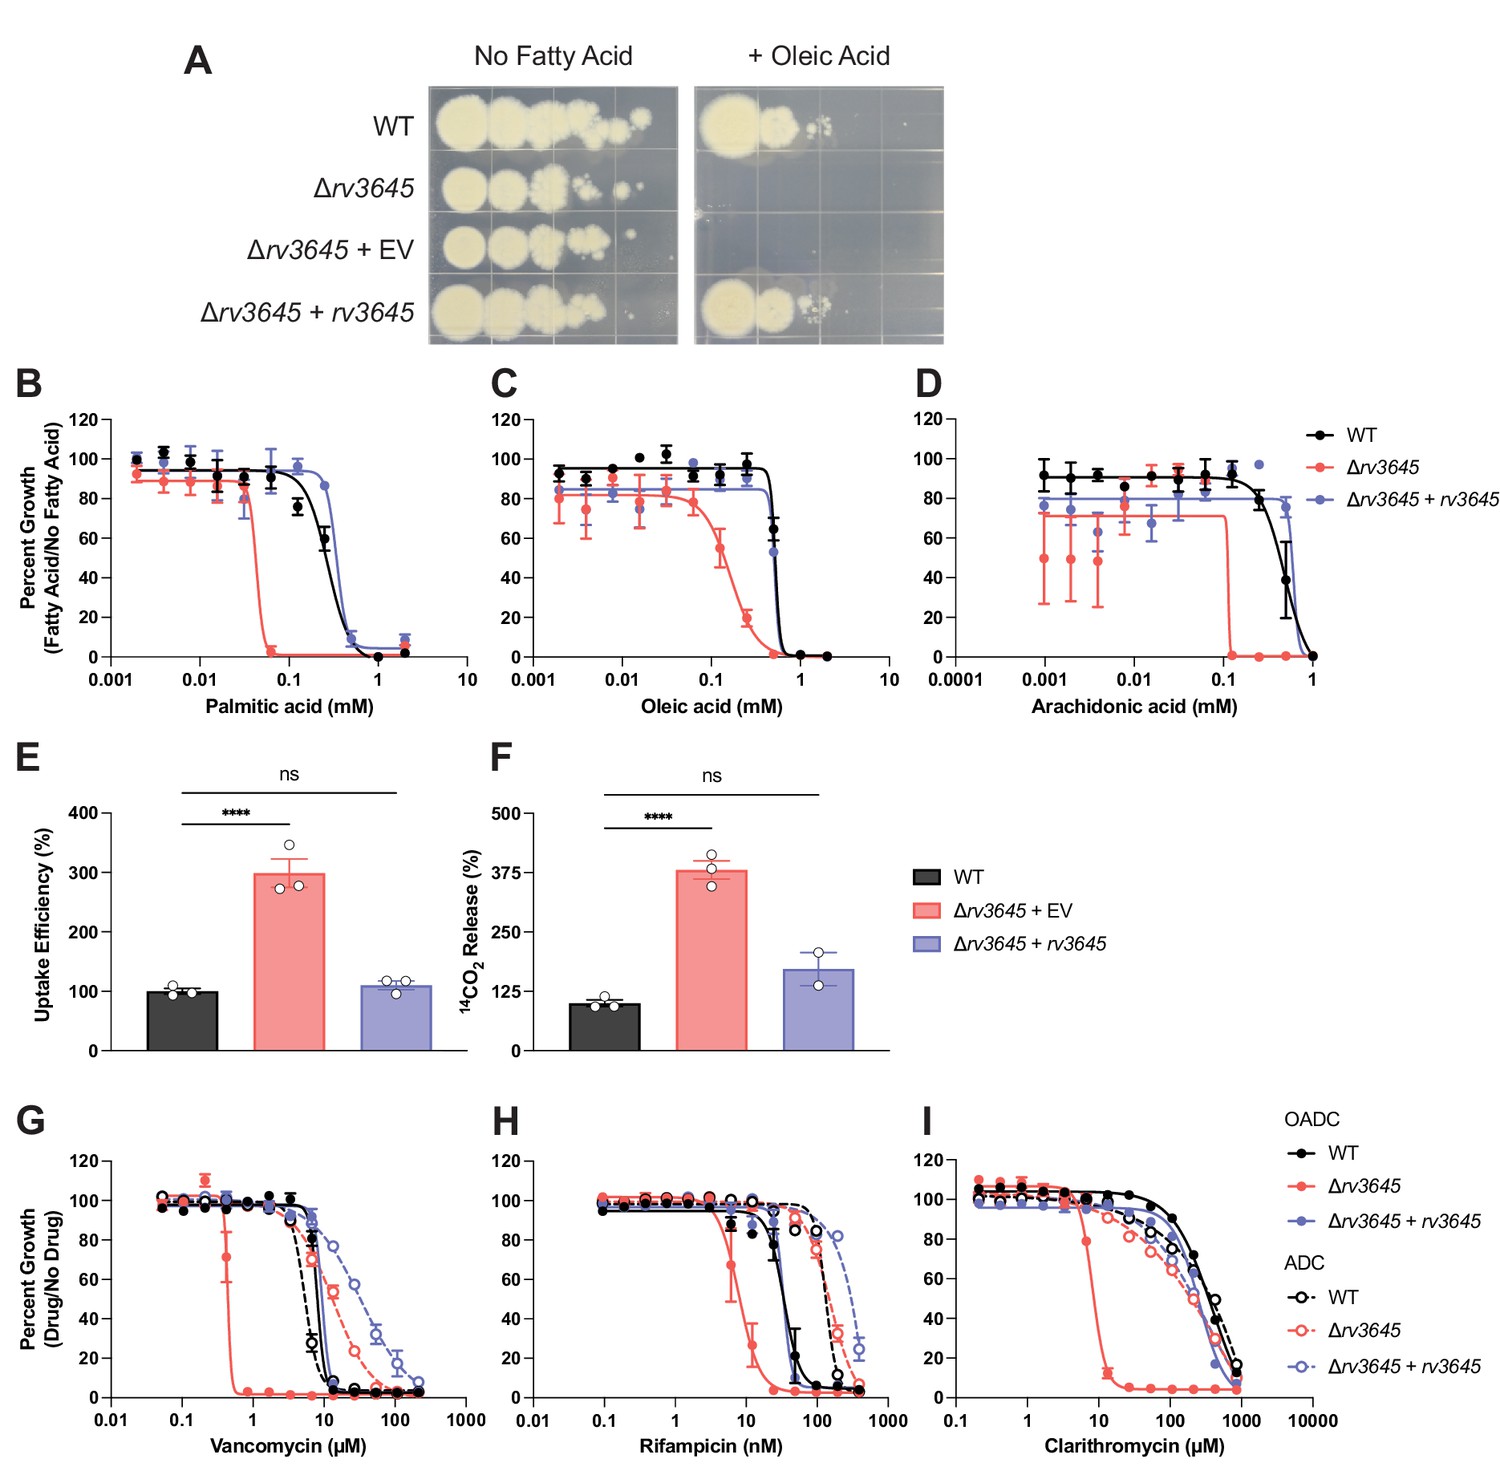
rv3645 essentiality and contribution to intrinsic drug resistance is conditional on the presence of long-chain fatty acids.
(A) Growth of Δrv3645 deletion strains on 7H10-ADC agar in the presence or absence of oleic acid. EV = empty vector. (B–D) Dose-response curves for fatty acids palmitic acid (B), oleic acid (C), and arachidonic acid (D). Data represent mean ± SEM for technical triplicates and are representative of at least three independent experiments. (E) Uptake of [1-14C]-oleic acid in indicated strains. Uptake rates were calculated from the incorporated radioactive counts (Figure 3—figure supplement 2). Statistical significance was determined by one-way ANOVA. Data are representative of two experiments. (F) Catabolic release of 14CO2 from [1-14C]-oleic acid in the indicated strains. Data are normalized to cell number as estimated by OD600, quantified relative to wild-type (WT), and represent means +/- SEM from technical triplicates, and are representative of two experiments. OE = over-expression, ns = not significant; ****, p<0.0001. Statistical significance was determined by one-way ANOVA. (G–I) Dose-response curves for vancomycin (G), rifampicin (H), and clarithromycin (I) of the indicated strains grown in 7H9 with (OADC) or without (ADC) oleic acid. Data represent mean ± SEM for technical triplicates and are representative of at least two independent experiments.
Figure 3—figure supplement 1
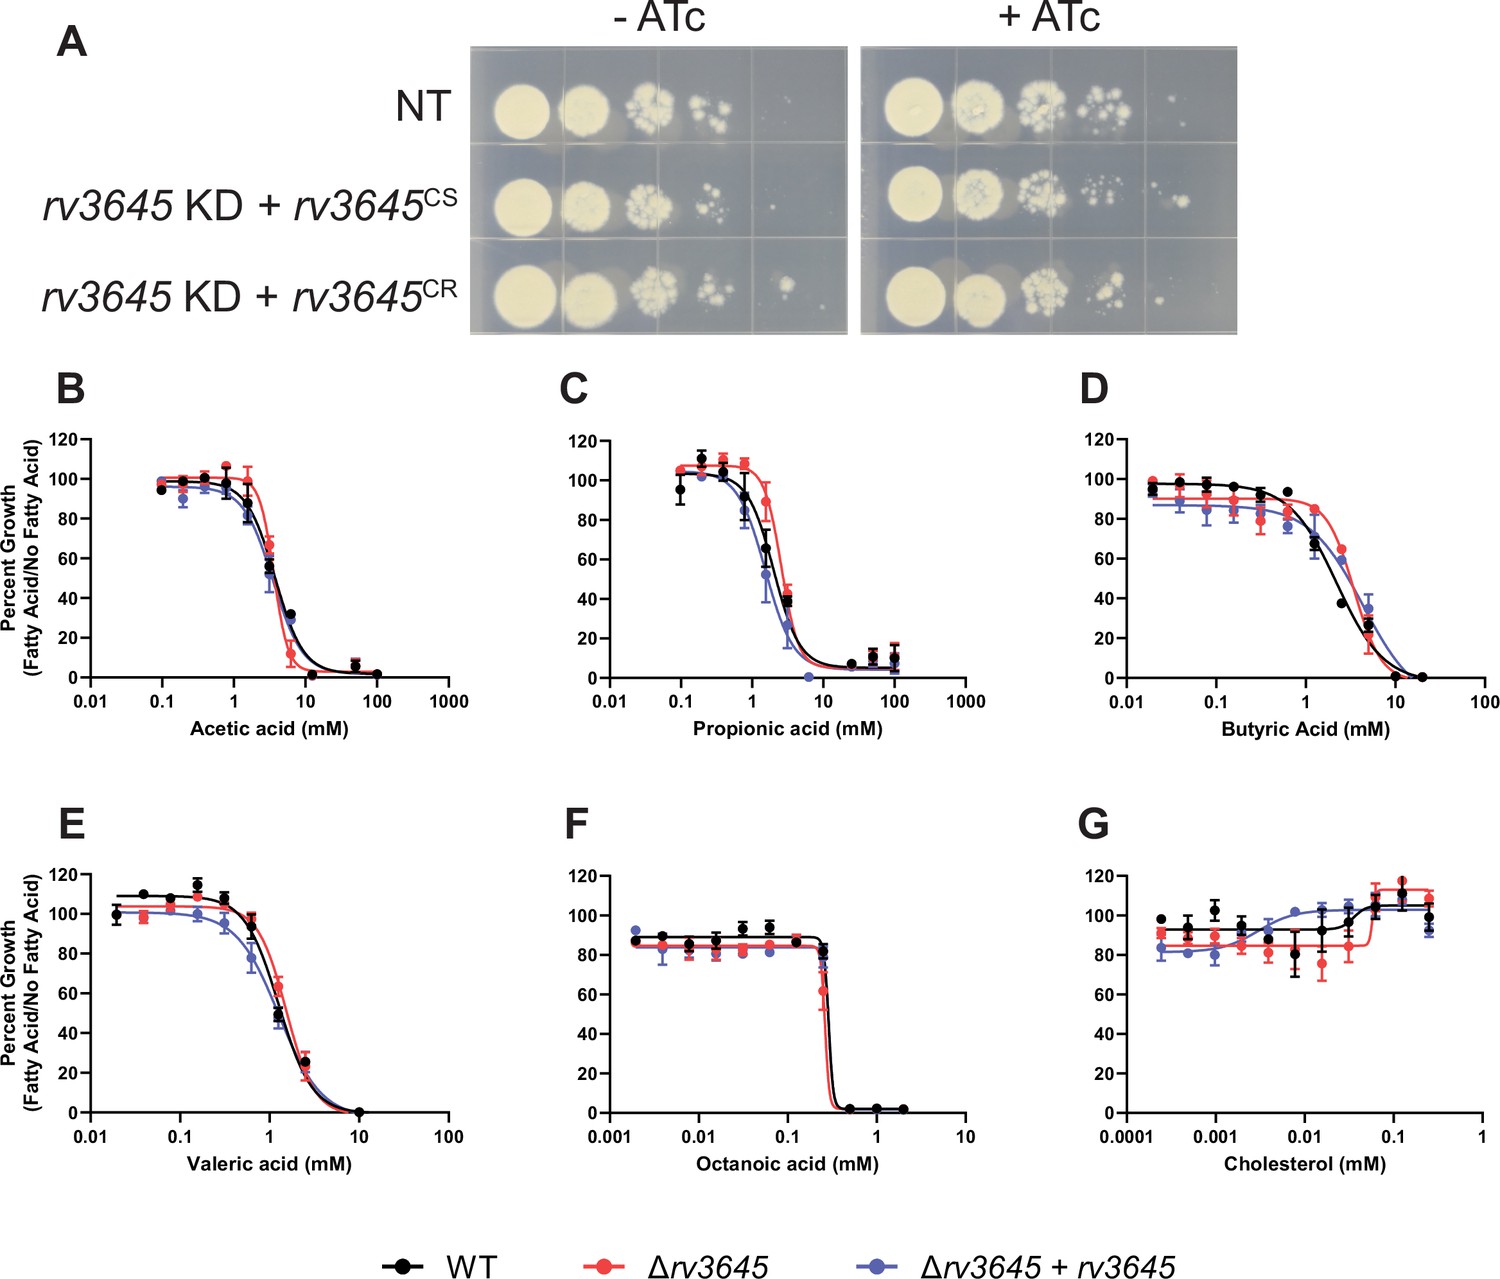
Δrv3645 does not sensitize Mycobacterium tuberculosis (Mtb) to short- or medium-chain fatty acids or cholesterol.
(A) Growth of rv3645 CRISPRi strains on fatty acid-free 7H10-ADC agar. NT = non-targeting sgRNA; KD = knockdown; CS = CRISPRi-sensitive; CR = CRISPRi-resistant. (B–G) Dose-response curves for short-chain fatty acids acetic acid (B), propionic acid (C), butyric acid (D), and valeric acid (E); medium-chain fatty acid octanoic acid (F), and cholesterol (G). Data represent mean ± SEM for technical triplicates and are representative of three independent experiments.
Figure 3—figure supplement 2
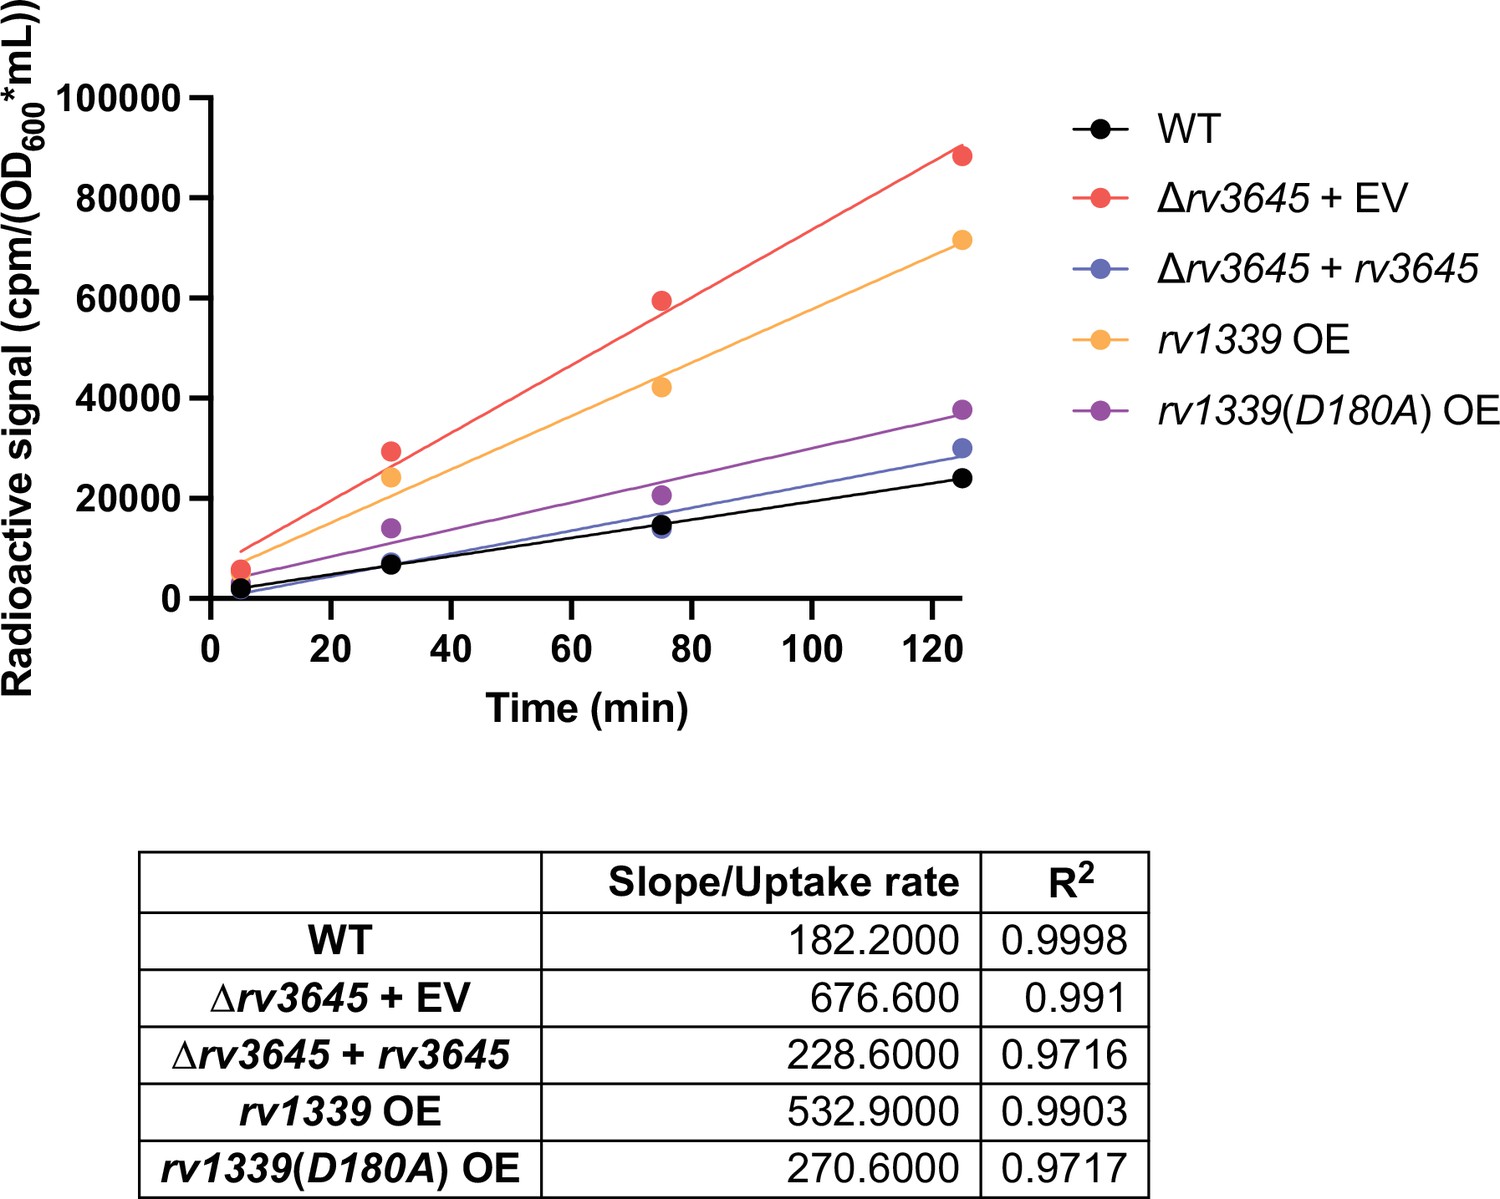
[1–14 C]-oleic acid uptake kinetic data.
-
Figure 3—figure supplement 2—source data 1
Spreadsheet of [1-14C]-oleic acid uptake rates in indicated strains.
- https://cdn.elifesciences.org/articles/81177/elife-81177-fig3-figsupp2-data1-v2.xlsx
Figure 4

Loss-of-function of the atypical cAMP phosphodiesterase Rv1339 rescues fatty acid and drug sensitivity phenotypes of Δrv3645 strains.
(A) Schematic of the Δrv3645 CRISPRi suppressor screen. First, an inducible genome-wide CRISPRi library was cloned into Δrv3645 Mtb. The CRISPRi library was then expanded before plating on 7H10-ADC agar supplemented with anhydrotetracycline (ATc) in the presence or absence of an inhibitory concentration of palmitic acid (200 μM). Genomic DNA from surviving bacteria was prepared for sgRNA deep sequencing to identify genes whose inhibition permitted the growth of an Δrv3645 strain in the presence of palmitic acid. (B) List of all enriched hit genes (log2 fold change (L2FC)>2 and false discovery rate (FDR)<0.01) from the suppressor screen described in panel (A). (C) Spontaneous suppressors of Δrv3645 oleic acid sensitivity were isolated and genomes were sequenced. Identified mutations in rv1339 are shown. (D) Growth of Δrv3645 CRISPRi suppressor strains. EV = empty vector; NT = non-targeting sgRNA; KD = knockdown. (E) Vancomycin dose-response curves of the indicated Δrv3645 strains. Data represent mean ± SEM for technical triplicates and are representative of at least two independent experiments.
-
Figure 4—source data 1
MAGeCK screen hits and results.
- https://cdn.elifesciences.org/articles/81177/elife-81177-fig4-data1-v2.xlsx
Figure 5 with 7 supplements

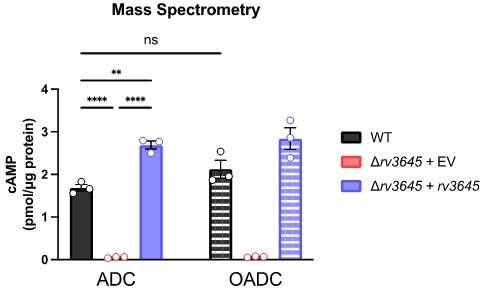
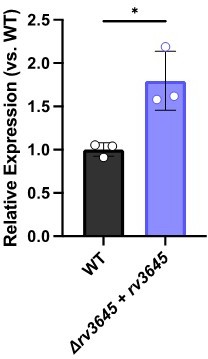
The second messenger cyclic AMP (cAMP) is a critical mediator of fatty acid metabolism and multidrug intrinsic resistance in Mycobacterium tuberculosis (Mtb).
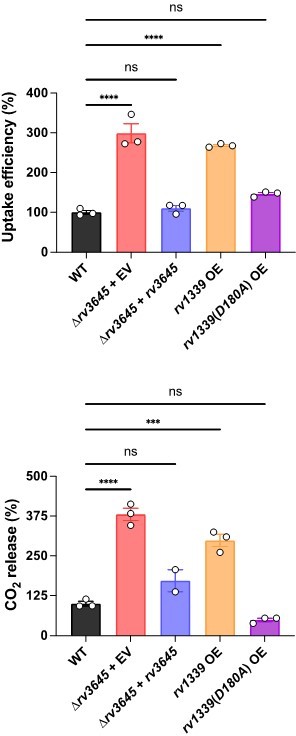
(A) Growth on 7H10-ADC +/- oleic acid of indicated Δrv3645 strains expressing an rv3645 adenylate cyclase catalytic mutant (D411A). (B) Vancomycin dose-response curves of indicated CRISPRi strains with adenylate cyclase rv3645(D411A) catalytic mutant defective in cAMP production. EV = empty vector. Data represent mean ± SEM for technical triplicates. (C–E) cAMP measurement of the indicated strains. D180A is a catalytically dead rv1339 allele. NT = non-targeting sgRNA; KD = knockdown; OE = over-expressed. Data represent mean ± SEM for technical triplicates. ns = not significant; *, p<0.05; ****, p<0.0001. Statistical significance was assessed by one-way ANOVA (GraphPad Prism). (F) Uptake of [1-14C]-oleic acid in indicated strains. Uptake rates were calculated from the incorporated radioactive counts (Figure 3—figure supplement 2). Statistical significance was determined by one-way ANOVA. (G) Catabolic release of 14CO2 from [1-14C]-oleic acid in the indicated strains. Data are normalized to cell number as estimated by OD600, quantified relative to WT, represent means ± SEM from technical triplicates, and are representative of two independent experiments. OE = over-expression, ns = not significant; ***, p<0.001; ****, p<0.0001. Statistical significance was determined by one-way ANOVA. (H) Vancomycin dose-response curves of rv3645 deletion mutants overexpressing rv1339. (I) Vancomycin dose-response curves of the indicated Δrv3645 strains grown in the presence (dotted lines) or absence (solid lines) of the adenylate cyclase Rv1625c agonist V-59. Data represent mean ± SEM for technical triplicates and are representative of at least two independent experiments. (J) Model for the involvement of cAMP in lipid metabolism and intrinsic drug resistance in Mtb. Under standard lab culture conditions (7H9/7H10 media), Rv3645/MacE is the dominant source of cAMP. cAMP regulates physiological processes through binding to transcription factors, post-translational modification enzymes, and other poorly understood effector proteins. Regulation through likely multiple of these effector proteins reduces long-chain fatty acid uptake and catabolism and promotes intrinsic multidrug resistance.
Figure 5—figure supplement 1
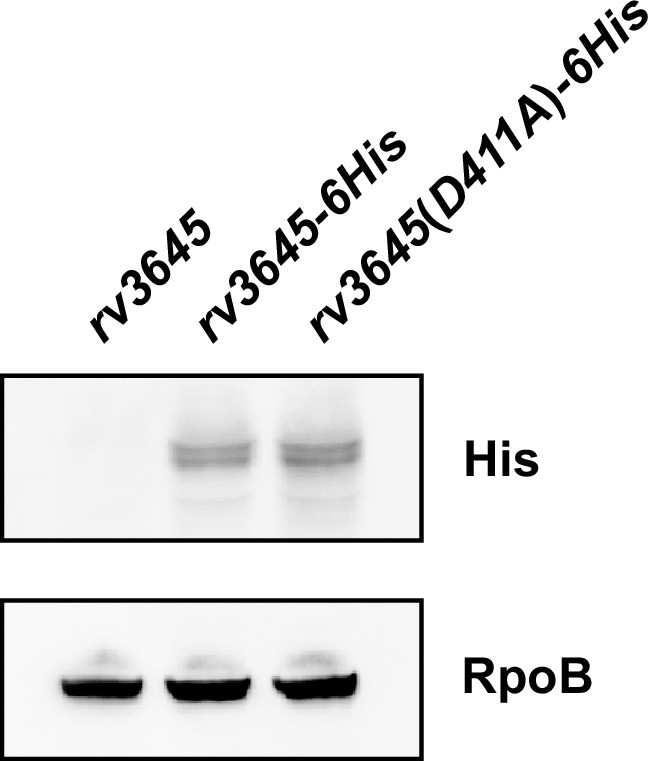
rv3645 catalytic mutant is expressed similar to the wild-type allele.
Western blot for C-terminally 6His-tagged rv3645 alleles expressed in M. smegmatis. Western blot for RpoB as a loading control. Note the double band present in the anti-His blot may reflect the processing of the predicted N-terminal signal peptide of Rv3645.
-
Figure 5—figure supplement 1—source data 1
Original Western blot image of rv3645 catalytic mutant.
- https://cdn.elifesciences.org/articles/81177/elife-81177-fig5-figsupp1-data1-v2.zip
Figure 5—figure supplement 2
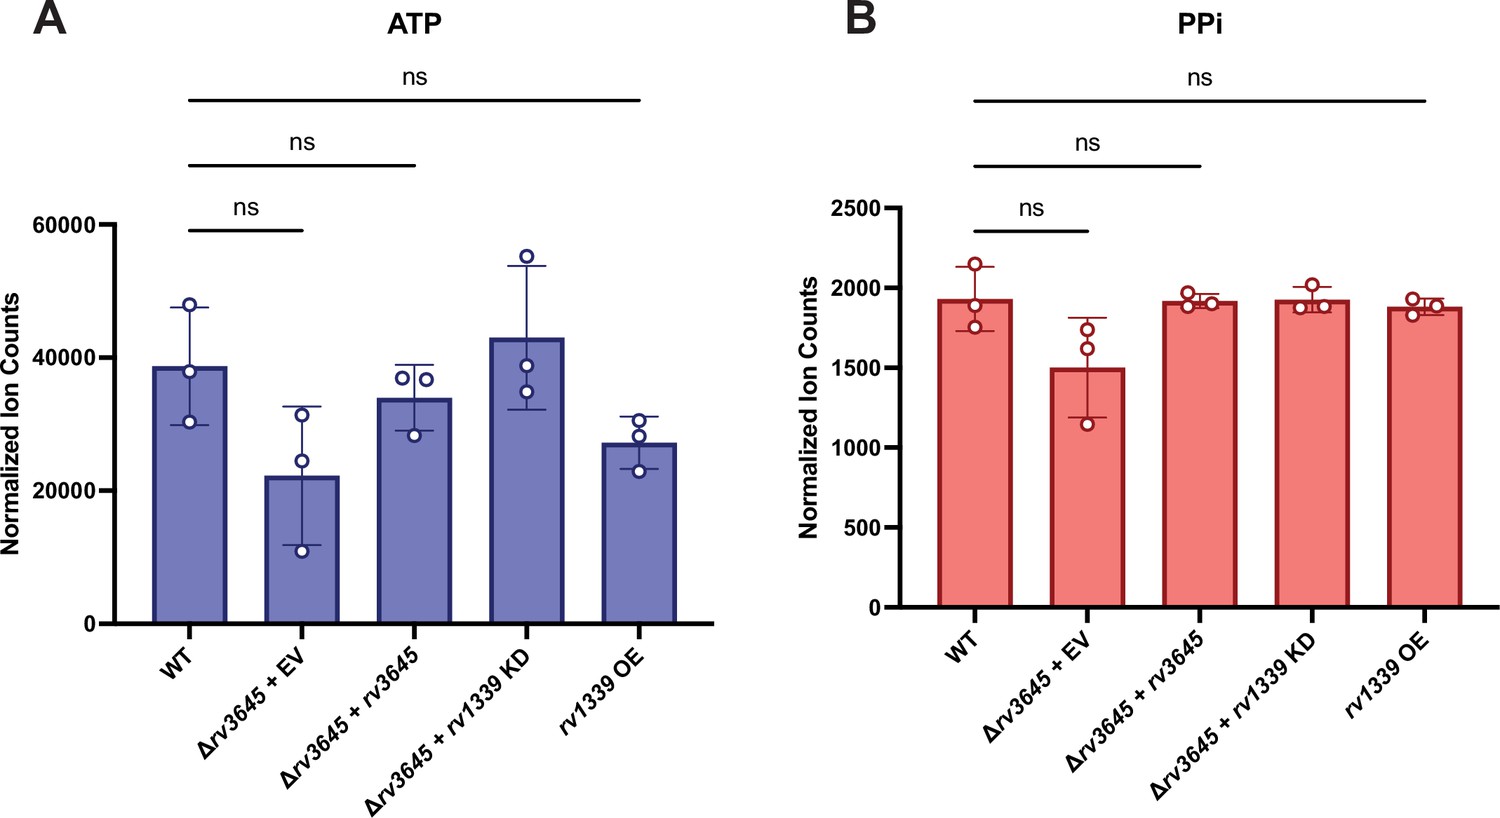
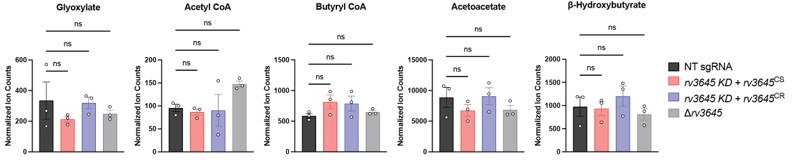
ATP and pyrophosphate levels does not change in Δrv3645 or rv1339 overexpression strains.
ATP (A) and pyrophosphate (B) levels were measured by mass spectrometry in the indicated strains. Ion counts were normalized to protein concentrations in each sample. PPi = pyrophosphate; EV = empty vector; KD = knockdown; OE = over-expression. Data represent mean +/- SEM for technical triplicates. ns = not significant. Statistical significance was assessed by one-way ANOVA (GraphPad Prism).
Figure 5—figure supplement 3
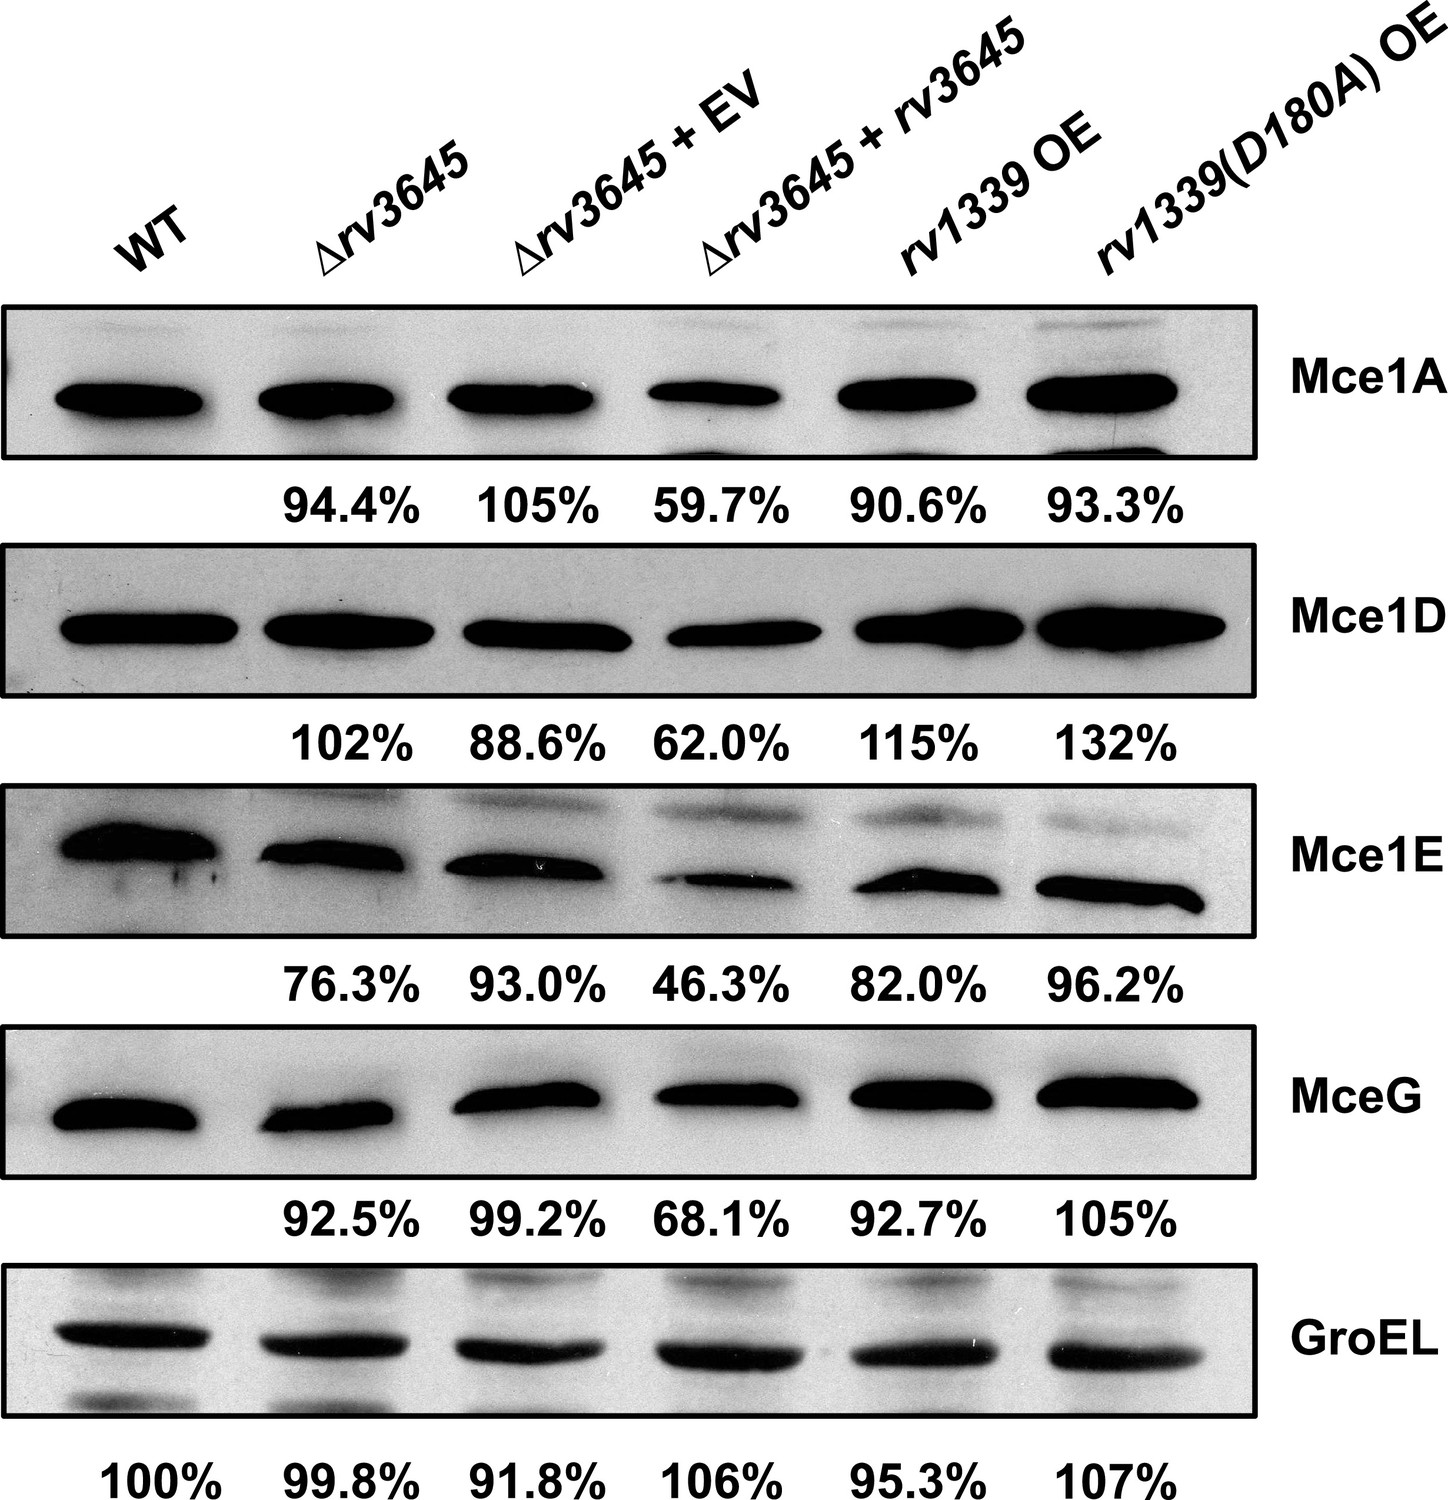
Expression of Mce1 complex proteins does not change in Δrv3645 or rv1339 overexpression strains.
Whole-cell lysates of indicated strains were probed by western blotting using antibodies specific for the indicated Mce1 proteins and GroEL. Inset values indicate protein levels quantified by densitometry, expressed as a ratio relative to the corresponding protein, normalized to the GroEL levels in the same strain. GroEL quantification expressed relative to wild-type (WT). EV = empty vector, OE = over-expression.
-
Figure 5—figure supplement 3—source data 1
Original Western blot images of Mce1 complex proteins and GroEL.
- https://cdn.elifesciences.org/articles/81177/elife-81177-fig5-figsupp3-data1-v2.zip
Figure 5—figure supplement 4
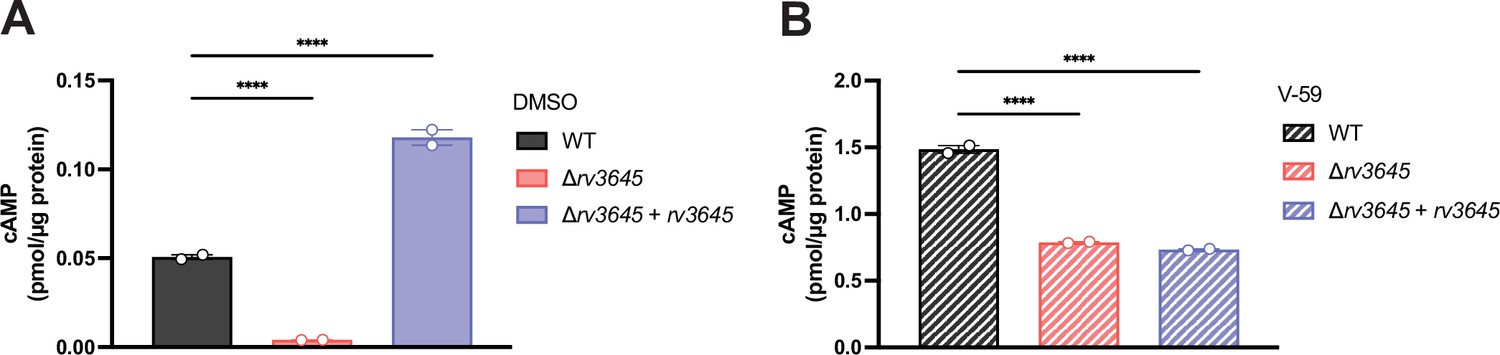
V-59 induces cyclic AMP (cAMP) production in Δrv3645.
cAMP was measured by ELISA for the indicated strains after 24 hr of treatment with DMSO (A) or 10 µM V-59 (B). Data represent mean +/- SEM for technical duplicates. ****, p<0.0001. Statistical significance was assessed by one-way ANOVA. We note that the magnitude of cAMP detected by ELISA is lower than quantified by mass spectrometry, likely reflecting differences in culture conditions and lysate preparation, but the relative changes in cAMP levels measured between strains remain similar across experiments.
Figure 5—figure supplement 5
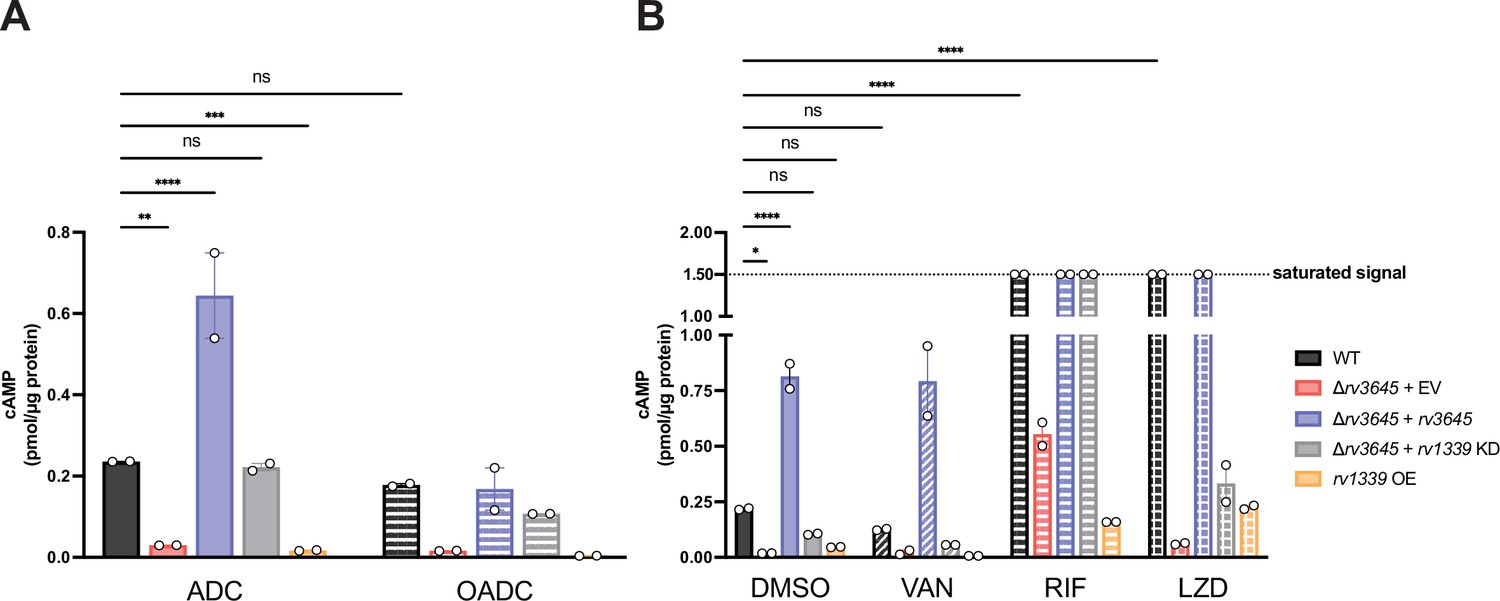
An inducible cyclic AMP (cAMP) response is not critical to modulate oleic acid sensitivity nor intrinsic drug resistance.
cAMP was measured by ELISA for the indicated strains after 24 hr of growth in 7H9 with (OADC) or without (ADC) oleic acid (A), or 24 hr of treatment with DMSO, vancomycin (VAN), rifampicin (RIF), or linezolid (LZD). All drugs were tested at 10 µM, above their MIC90. KD = knockdown; EV = empty vector; OE = over-expression. Data represent mean ± SEM for technical duplicates and are representative of four independent experiments. ns = not significant; *, p<0.05; **, p<0.01; ***, p<0.001; ****, p<0.0001. Statistical significance was assessed by one-way ANOVA. We note that the magnitude of cAMP detected by ELISA is lower than that quantified by mass spectrometry, likely reflecting differences in culture conditions and lysate preparation, but the relative changes in cAMP levels measured between strains remain similar across experiments.
Figure 5—figure supplement 6
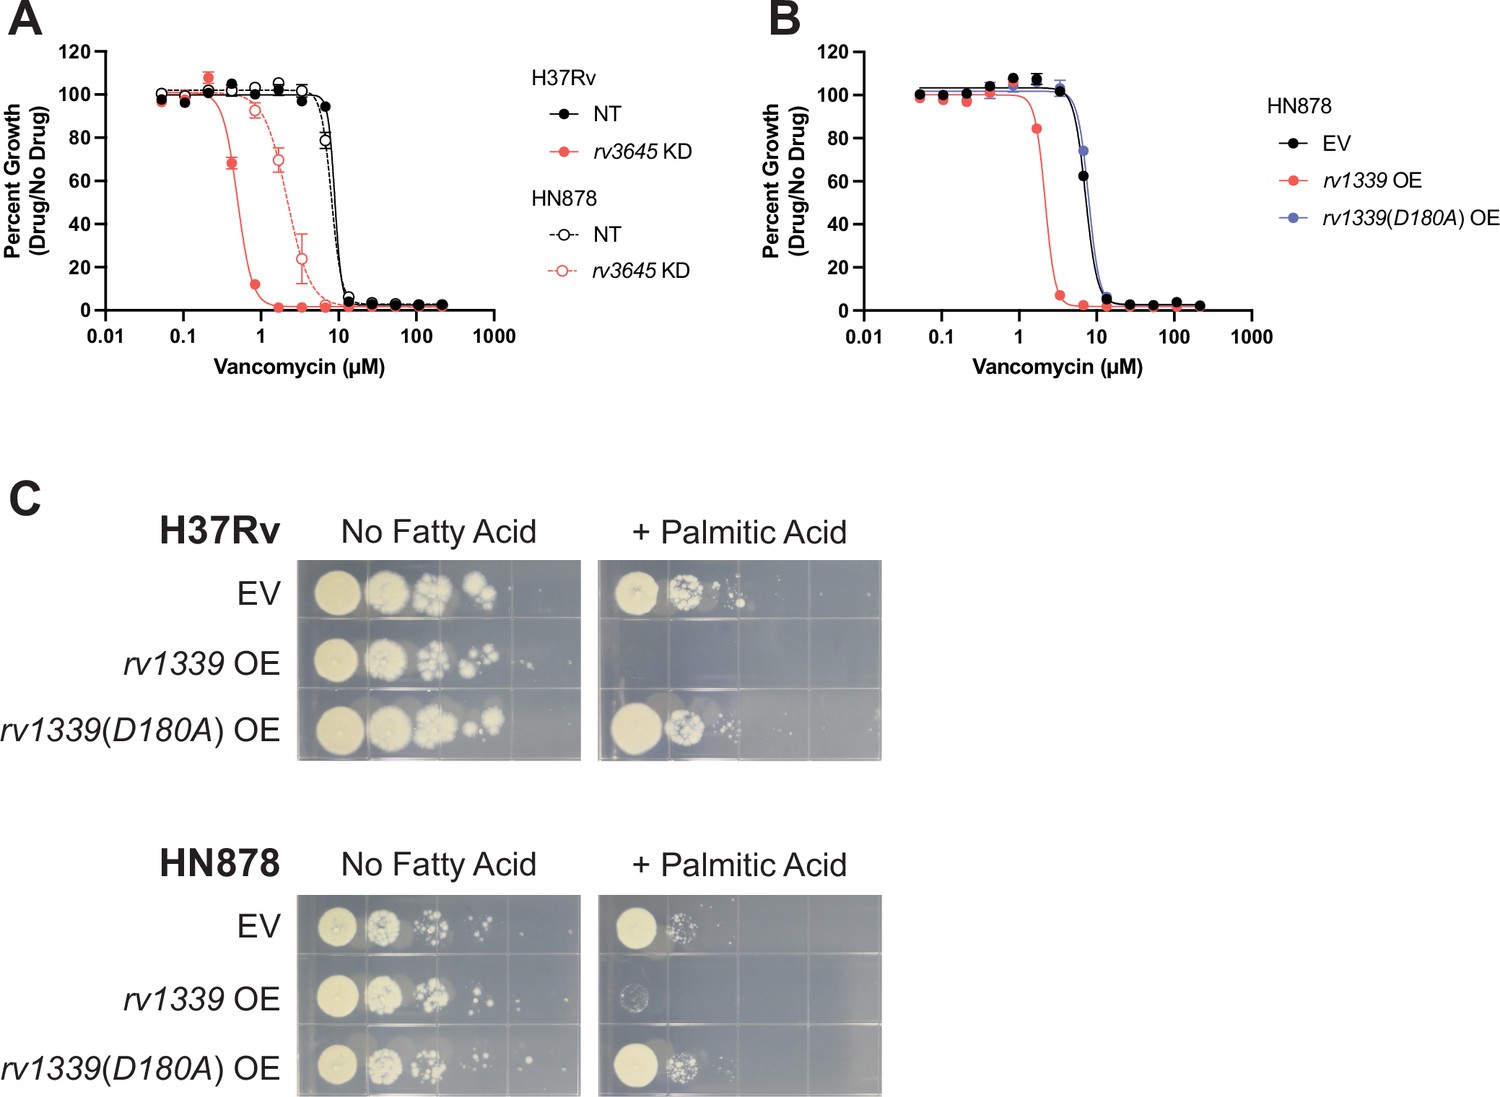
Depletion of cyclic AMP (cAMP) sensitizes Mtb HN878 to vancomycin and palmitic acid.
(A–B) Dose-response curves for rv3645 CRISPRi (A) and rv1339 over-expression (B) strains of lineage 2 Mtb HN878. NT = non-targeting sgRNA, KD = knockdown; EV = empty vector; OE = over-expression. Data represent mean ± SEM for technical triplicates and are representative of two independent experiments. (C) Growth on 7H10-ADC +/- palmitic acid of indicated strains.
Figure 5—figure supplement 7
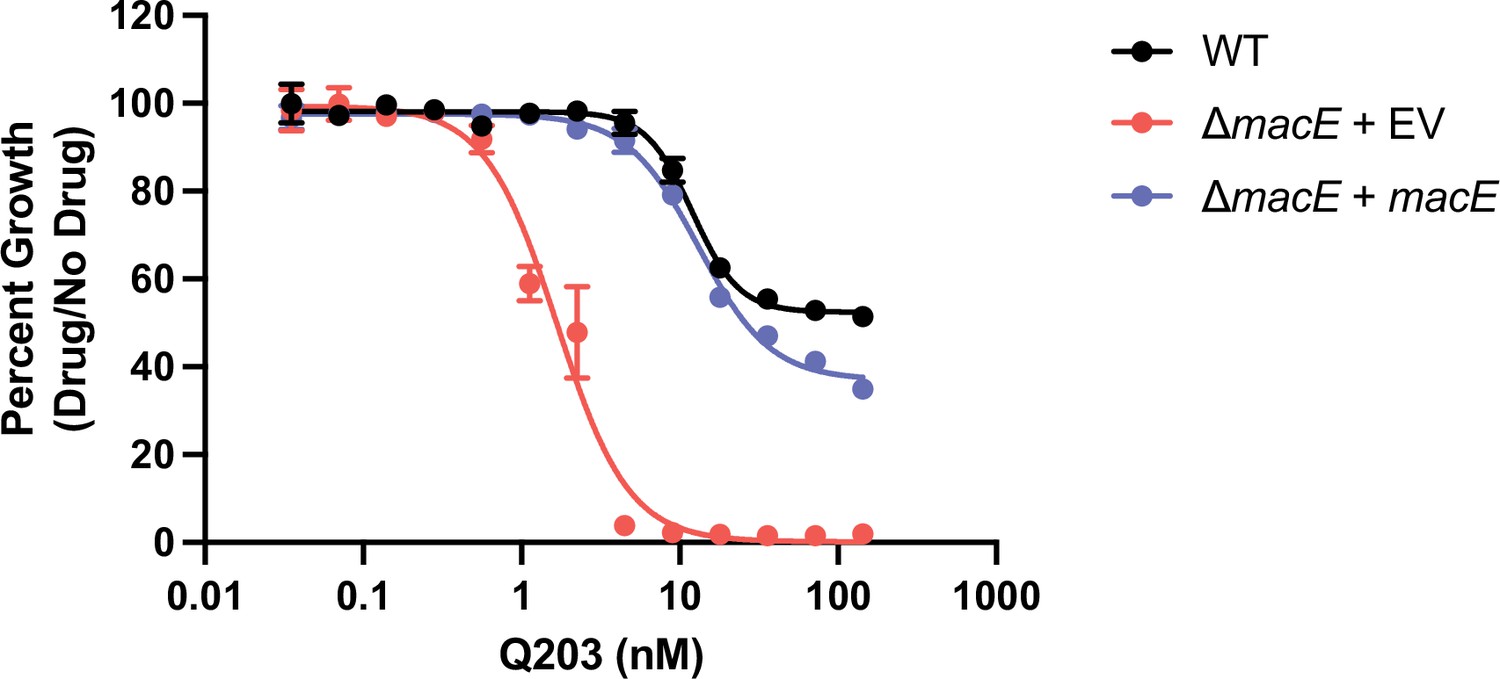
ΔmacE is hypersensitive to the cytochrome bc1 complex inhibitor Q203.
Dose-response curves for the indicated strains. EV = empty vector. Data represent mean ± SEM for technical triplicates for two independent experiments.
Author response image 1
Author response image 2
Author response image 3
Author response image 4
Author response image 5
Author response image 6
Additional files
-
Supplementary file 1
Spreadsheet of plasmids, sgRNAs, and primers used in this work.
- https://cdn.elifesciences.org/articles/81177/elife-81177-supp1-v2.xlsx
-
MDAR checklist
- https://cdn.elifesciences.org/articles/81177/elife-81177-mdarchecklist1-v2.docx
Download links
A two-part list of links to download the article, or parts of the article, in various formats.
Downloads (link to download the article as PDF)
Open citations (links to open the citations from this article in various online reference manager services)
Cite this article (links to download the citations from this article in formats compatible with various reference manager tools)
Cyclic AMP is a critical mediator of intrinsic drug resistance and fatty acid metabolism in M. tuberculosis
eLife 12:e81177.
https://doi.org/10.7554/eLife.81177


