Pan-cancer association of DNA repair deficiencies with whole-genome mutational patterns
- Department of Molecular Medicine (MOMA), Aarhus University Hospital, Denmark
- Department of Clinical Medicine, Aarhus University, Denmark
- DNRF Center for Chromosome Stability, Department of Cellular and Molecular Medicine, University of Copenhagen, Denmark
- Department of Biomedicine, Aarhus University, Denmark
- Bioinformatics Research Center (BiRC), Aarhus University, Denmark
Figures
Figure 1 with 1 supplement
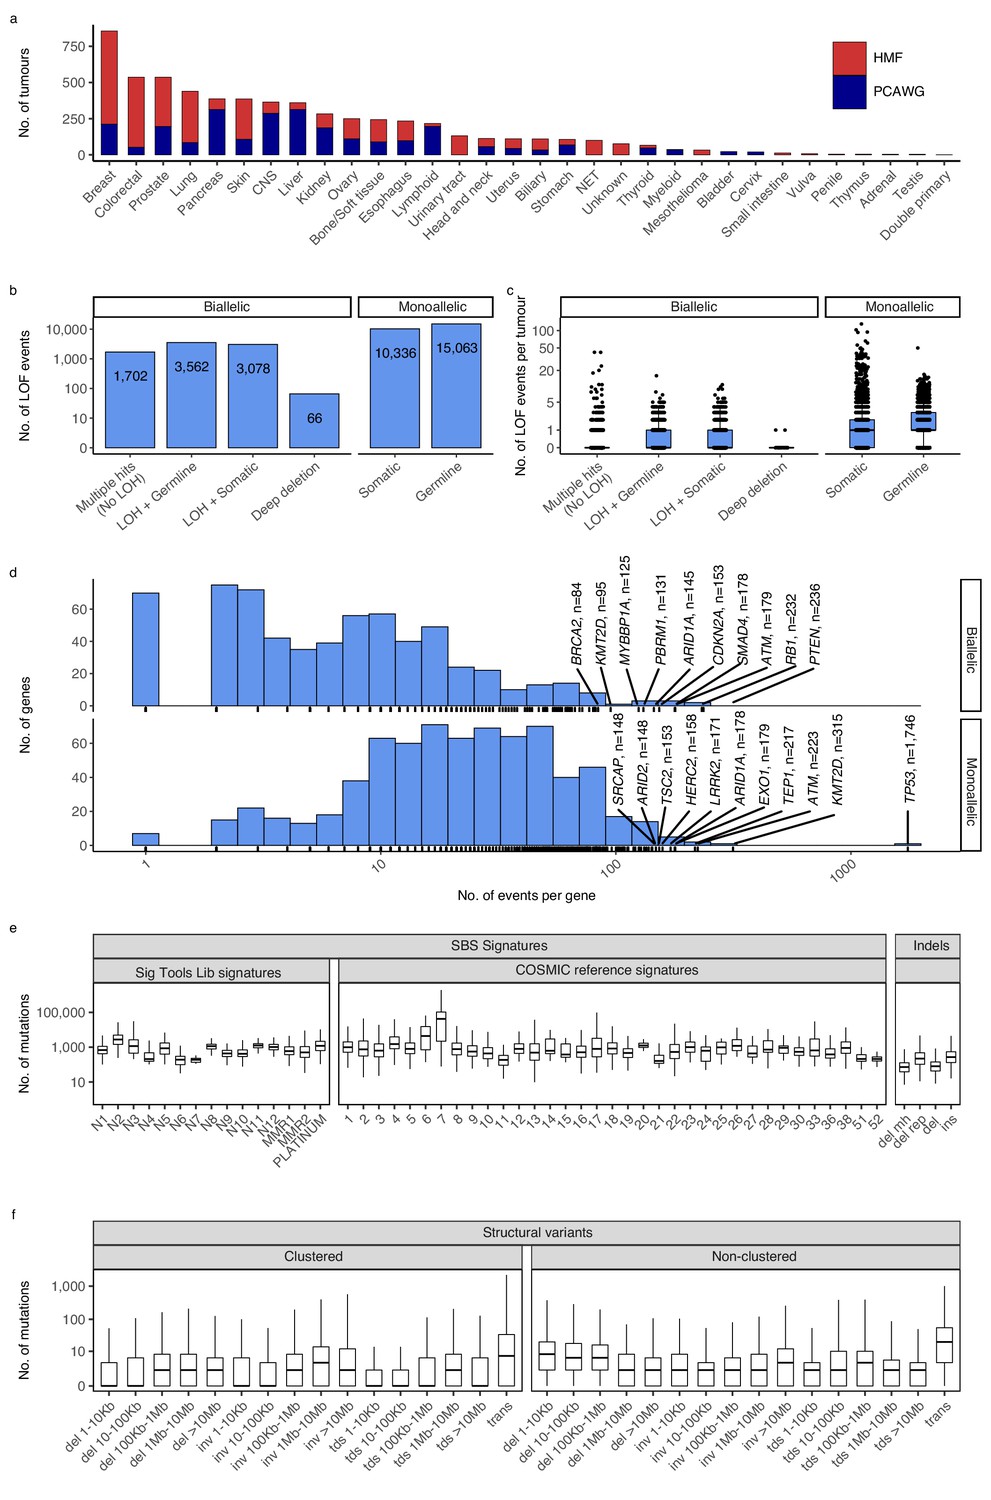
Cancer types, DNA damage response (DDR) gene deficiencies, and mutational patterns.
(a) Cohort sizes for the 32 cancer types comprising the 6065 whole cancer genomes collected from the Hartwig Medical Foundation (HMF; n = 3497) and the PanCancer Analysis of Whole Genomes (PCAWG; n = 2568). (b) Mono- and biallelic loss-of-function (LOF) events were annotated across 736 DDR genes based on both pathogenic variants and copy number losses (loss of heterozygosity; LOH), overall and (c) per patient (d) with varying no. of LOF events per DDR gene (x-axis; logarithmic). (e) Whole-genome mutational patterns were represented as summary statistics and used as input features for the predictive models of DDR gene deficiency. Concretely, each patient was annotated with the number of single-base substitutions (SBSs) that are accounted to each SBS signature (Alexandrov and Stratton, 2014; Degasperi et al., 2020), number of indels divided by context (mh = microhomology; rep = repetitive), and (f) number of structural variants divided by clusterness, size, and type (del = deletion; inv = inversion; tds = tandem duplication; trans = translocation).
Figure 1—figure supplement 1
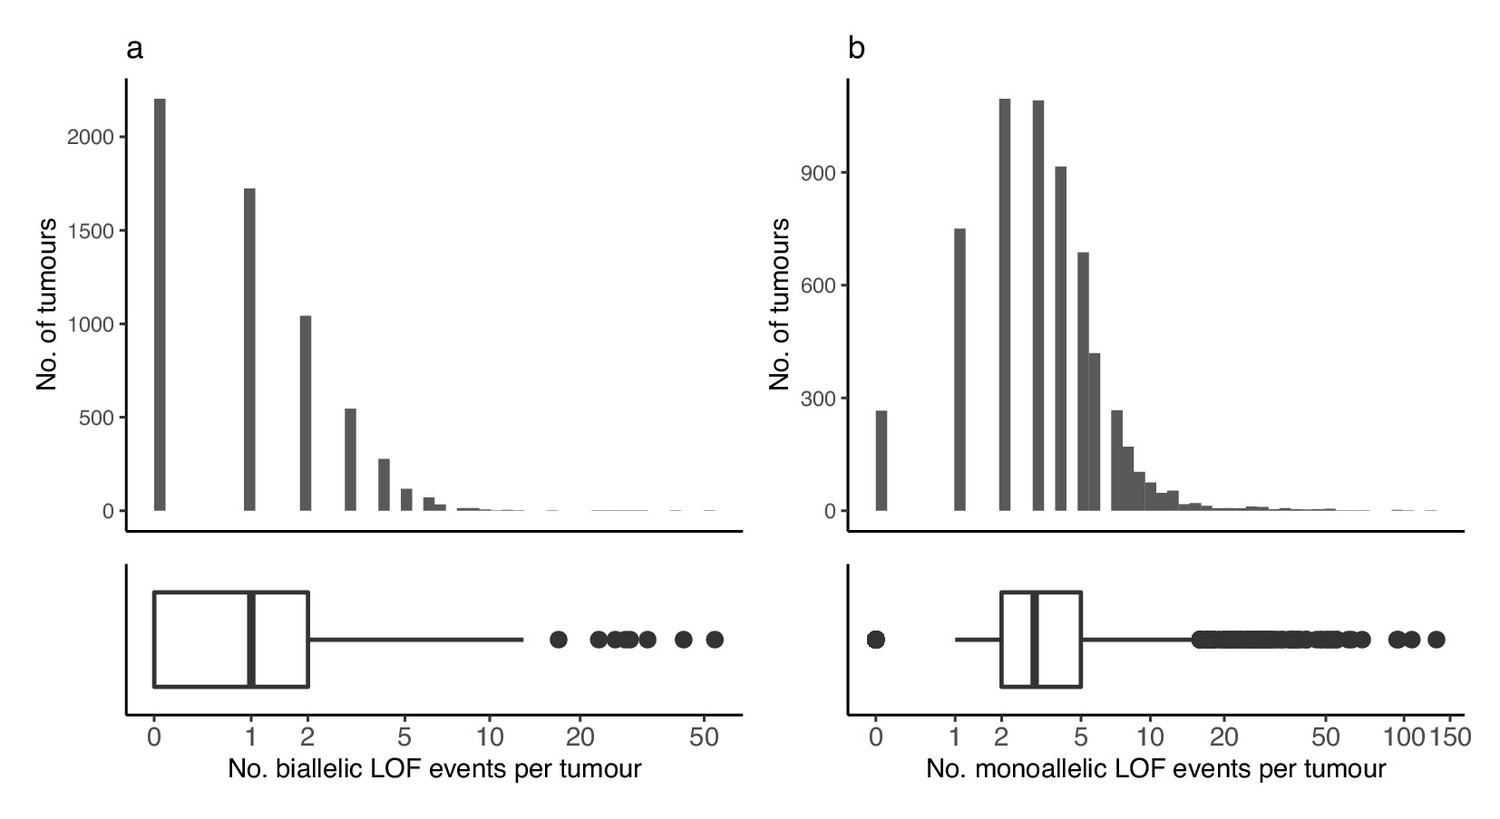
Loss-of-function events across tumours.
(a) Number of biallelic and (b) monoallelic loss-of-function events (x-axis) per tumour (y-axis).
Figure 2
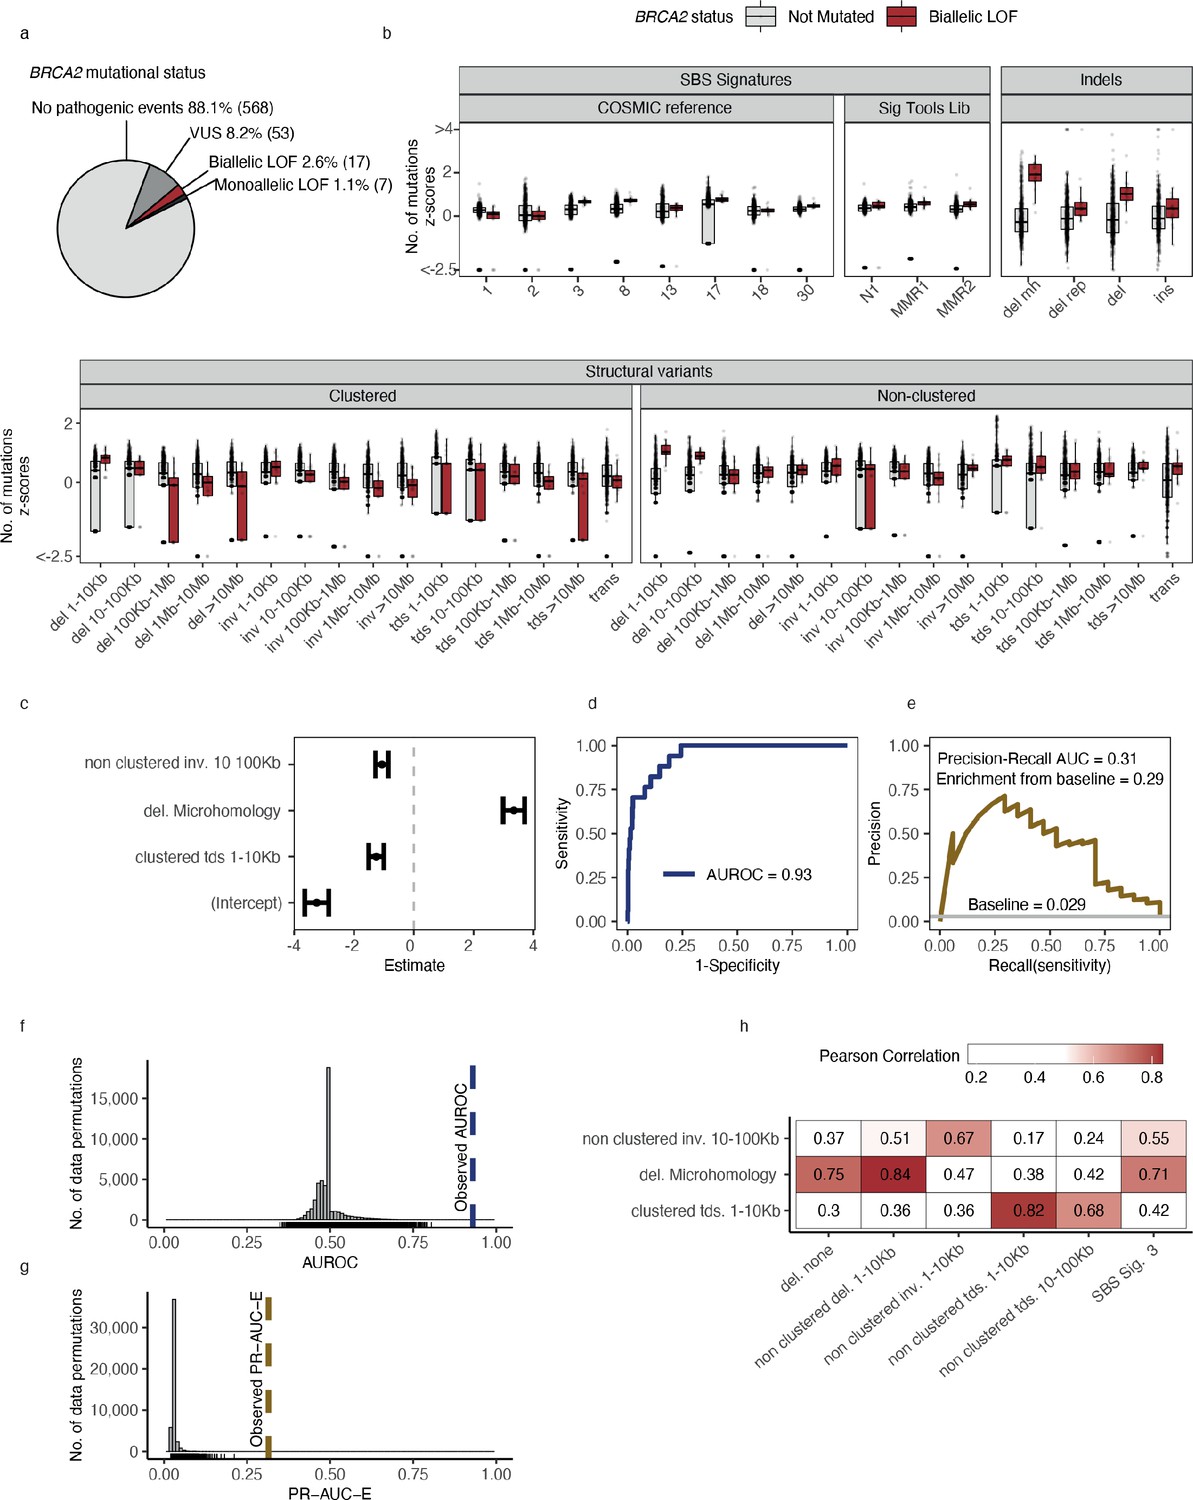
Predictive modelling of BRCA2 deficiencies in the Hartwig Medical Foundation (HMF) breast cancers.
(a) Mutational status of BRCA2 across 645 HMF breast cancer patients. (b) Mutational summary statistics for the HMF breast cancer patients divided by biallelic BRCA2 loss-of-function (LOF; red) and BRCA2 wild-type (WT; grey) (selected predictive features in bold). (c) Predictive features and their coefficients for model of biallelic BRCA2 loss with predictive performance measured in (d) area under the receiver operator characteristic (AUROC) and (e) precision-recall area-under-the-curve (PR-AUC) (PR-AUC-E = PR-AUC − baseline = 0.29; Methods). (f) Distributions of AUROC and (g) PR-AUC-E values obtained from 30,000 random data permutations compared to observed values (punctuated lines). (h) Correlation between selected predictive features (horizontal) and other highly correlated (Pearson corr. >0.65) mutational features (vertical).
Figure 3 with 3 supplements
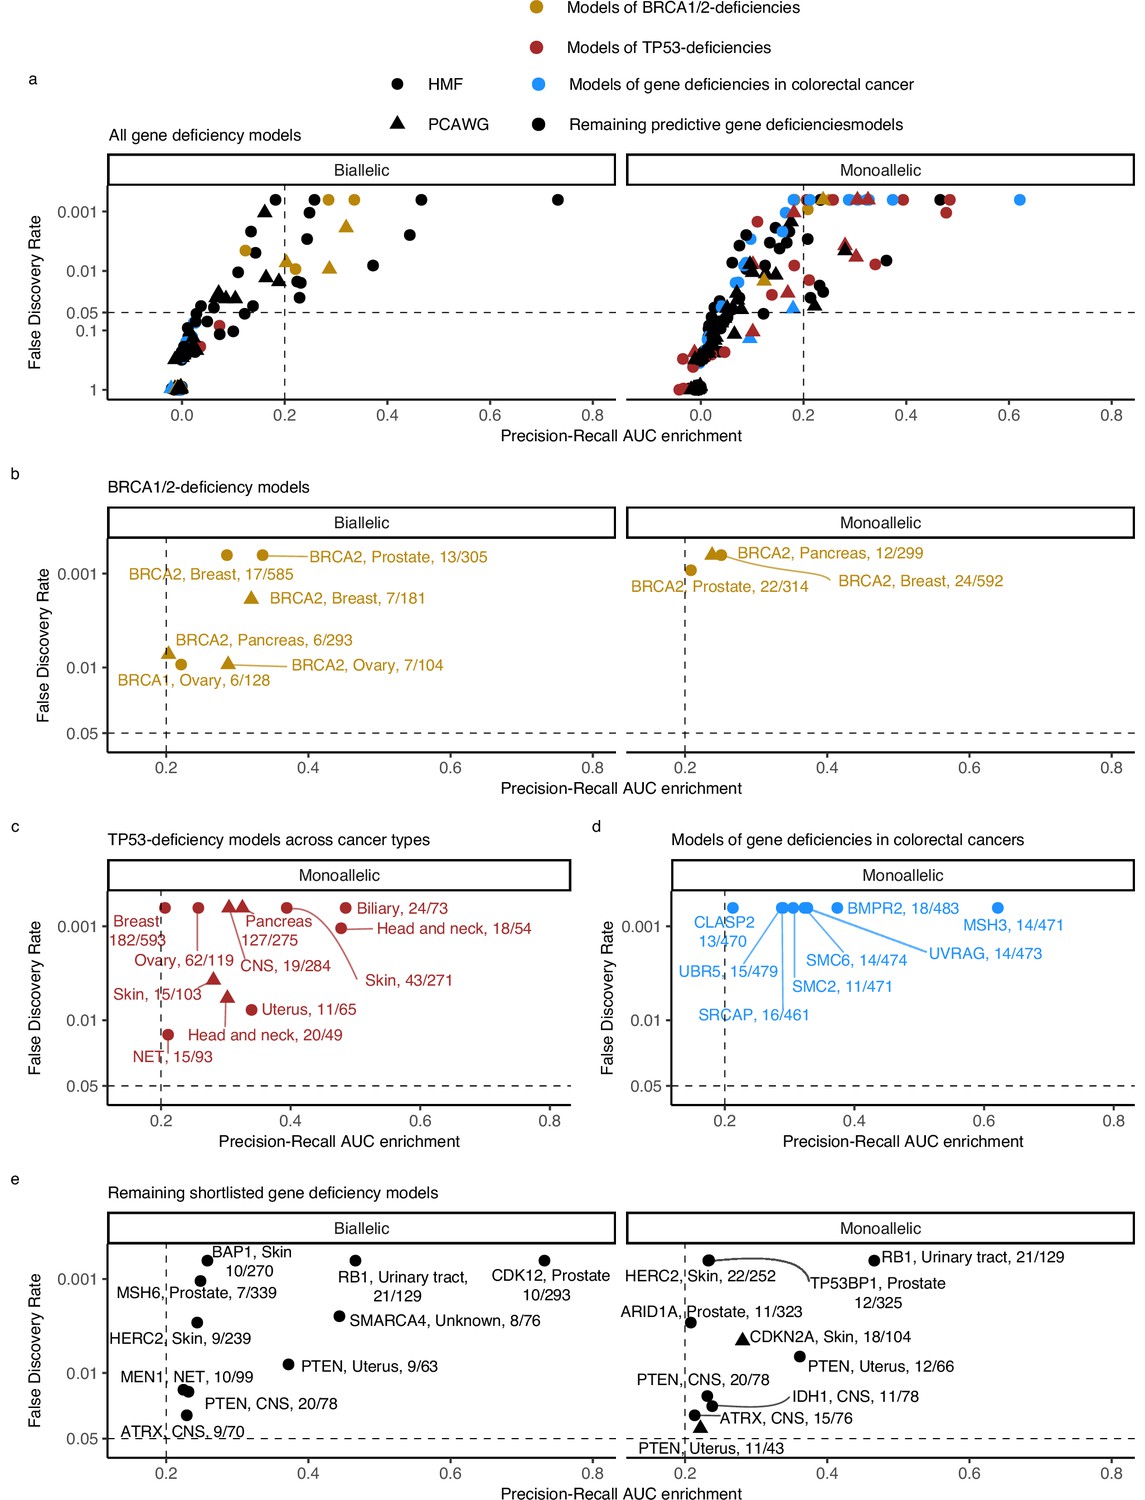
Predictive models of DNA damage response (DDR) gene deficiencies.
(a) The precision-recall AUC enrichment PR-AUC-E; x-axis and significance (false discovery rate [FDR]; logarithmic y-axis) of the 535 predictive models (one model per gene with more than 5 biallelic or more than 10 tumours either mono- or biallelic mutated in either Hartwig Medical Foundation (HMF) or The Pan-Cancer Analysis of Whole Genomes (PCAWG) in any one cancer type; Methods). Significance (q-value representing FDR) evaluated by counting equally or more-extreme PR-AUC-E values across >10,000 permuted data sets and applying Benjamini–Hochberg FDR control. Models with FDR below 0.05 and PR-AUC-E above 0.2 are shortlisted (Methods). (b) Shortlisted predictive models of deficiency of BRCA1 or BRCA2; (c) TP53 monoallelic predictive models; (d) monoallelic gene deficiency models across colorectal cancer patients; and (e) remaining gene deficiency models not contained in the other sub-groups. Numbers indicate the number of mutated out of the total number of tumours included in the development of each model.
Figure 3—figure supplement 1
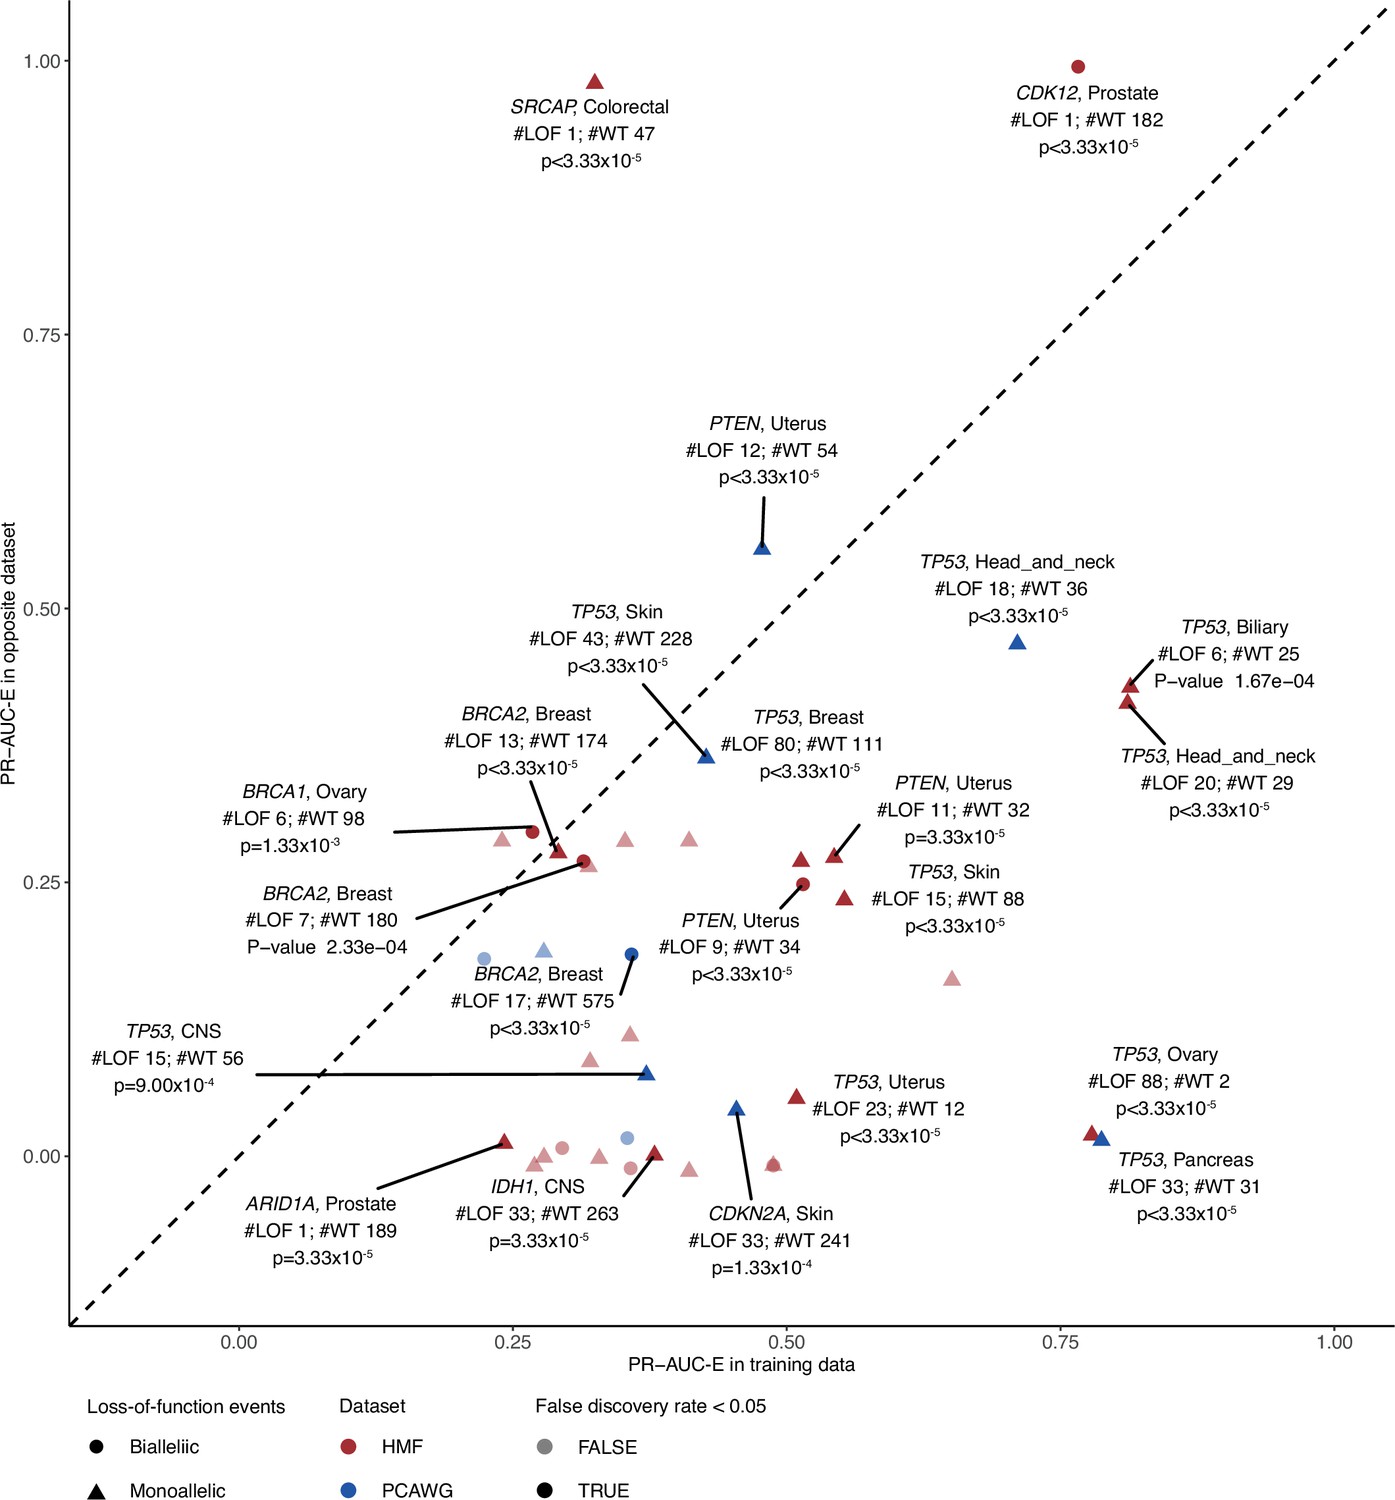
Evaluating model performance in the opposite data set.
Predictive potential in the opposite data set, evaluated for each of the shortlisted models. The PR-AUC-E in the training data (x-axis) and opposite data (y-axis) are shown with labels for models that attain significant predictive power in the opposite data (shaded; false discovery rate <0.05; 30.000 permutation tests). Shape indicates the allelic loss-of-function (LOF) event (circle biallelic and triangle monoallelic); colours indicate the data set in which the model was trained, either metastatic tumours (Hartwig Medical Foundation; HMF) or primary tumours (The Pan-Cancer Analysis of Whole Genomes; PCAWG). #LOF indicates the number of LOF mutated tumours in the opposite data set, #WT the number of non-LOF tumours.
Figure 3—figure supplement 2
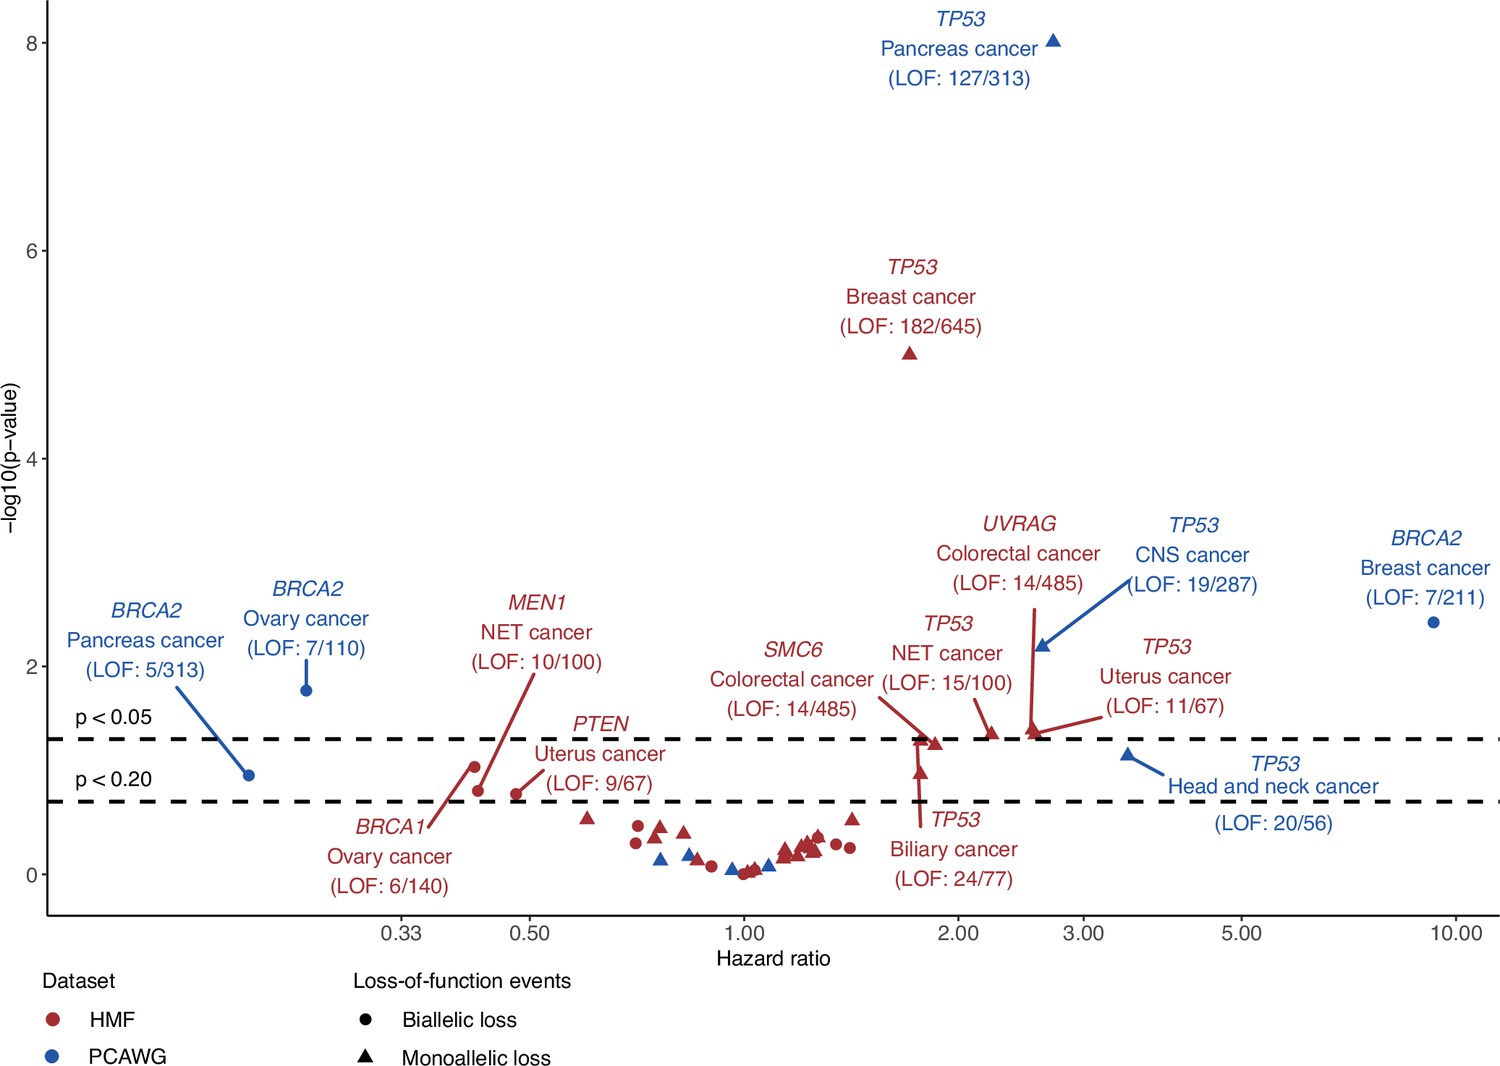
Survival analysis of patients with or without loss-of-function (LOF) events in shortlisted DNA damage response (DDR) genes.
The hazard ratio (x-axis) based on overall survival between patients with or without gene LOF and its associated p-value (y-axis; −log10) evaluated using the Cox proportional hazard model for DNA damage response genes and cancer-type cohorts of the shortlisted predictive models. Models were trained on either Hartwig Medical Foundation (HMF; red) or The Pan-Cancer Analysis of Whole Genomes (PCAWG; blue) data to identify either biallelic (circle) or monoallelic (triangle) LOF. Labels are added for models with p values <0.2, including the number of patients with a gene LOF event versus total number of given cancer-type cohort patients (LOF patients/total patients).
Figure 3—figure supplement 3
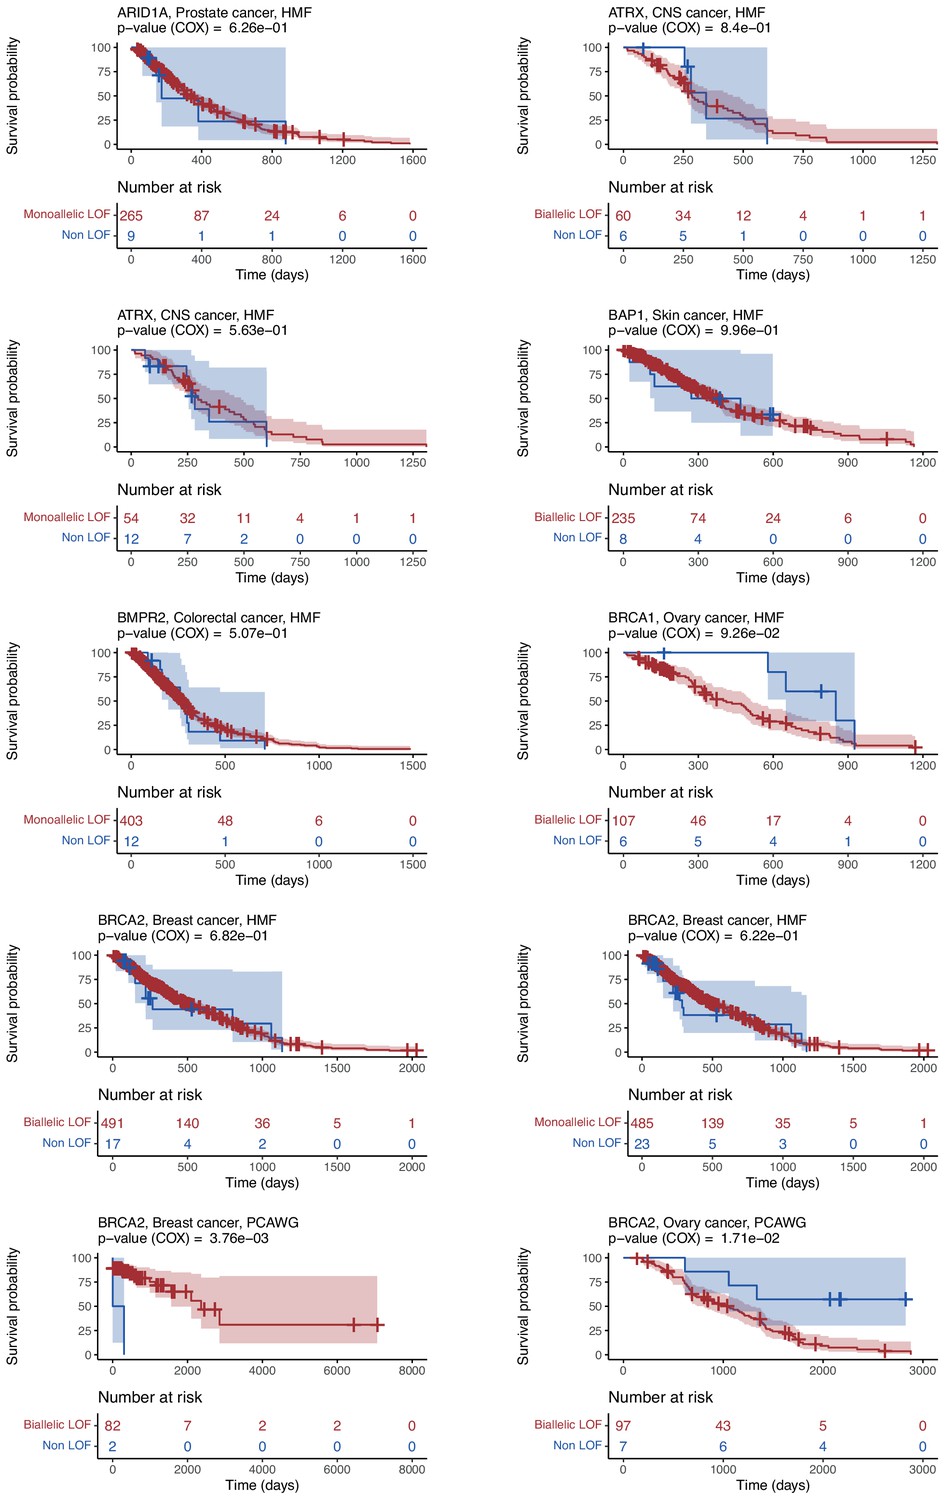
Kaplan–Meier survival plots for patients from cancer-type cohorts used to train the 48 shortlisted models.
Separate Kaplan–Meier plots showing the overall survival of patients with loss-of-function (LOF; red) or no-LOF (blue) in each gene for relevant cancer-type cohorts. The percentage still included in the study (y-axis) at a given timepoint (x-axis). Numbers indicate the number of patients included at a given time.
Figure 4
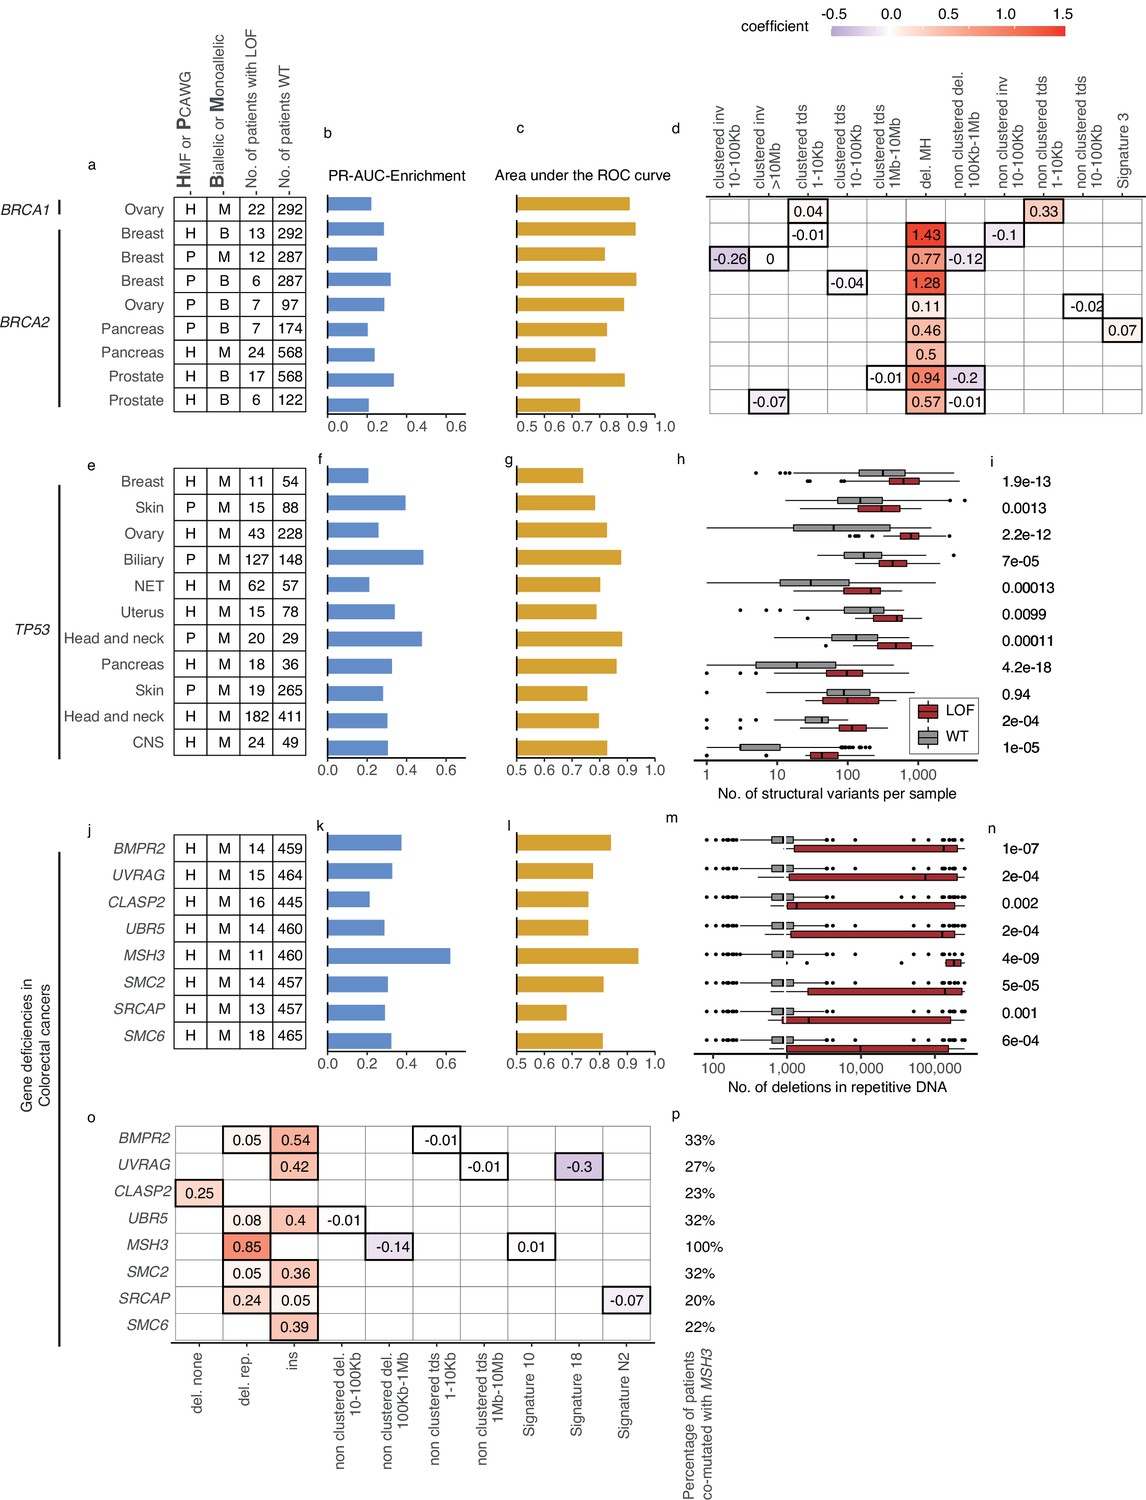
Predictive models with anticipated aetiology or origin.
(a) Overview of predictive models for BRCA1-d and BRCA2-d, showing data source, type of model, and loss-of-function (LOF)-set statistics. (b) PR-AUC-E, (c) area under the receiver operator characteristic (AUROC), and (d) the predictive features and their coefficient for individual models. (e–g) Overview of predictive models of TP53-d (as in a–c). (h) For each cohort, the number of structural variants (x-axis; logarithmic) for TP53 LOF tumours (red) versus TP53 wild-type tumours (grey) and (i) the significance of their difference (two-sided Wilcoxon rank-sum test). (j–l) Predictive models of gene deficiencies in colorectal cancers (as in a–c). (m) Number of deletions in repetitive DNA (as in h) and (n) its significance (as in i). (o) The predictive features of each model (as in d) and (p) the percentage of tumours that are co-mutated with MSH3.
Figure 5
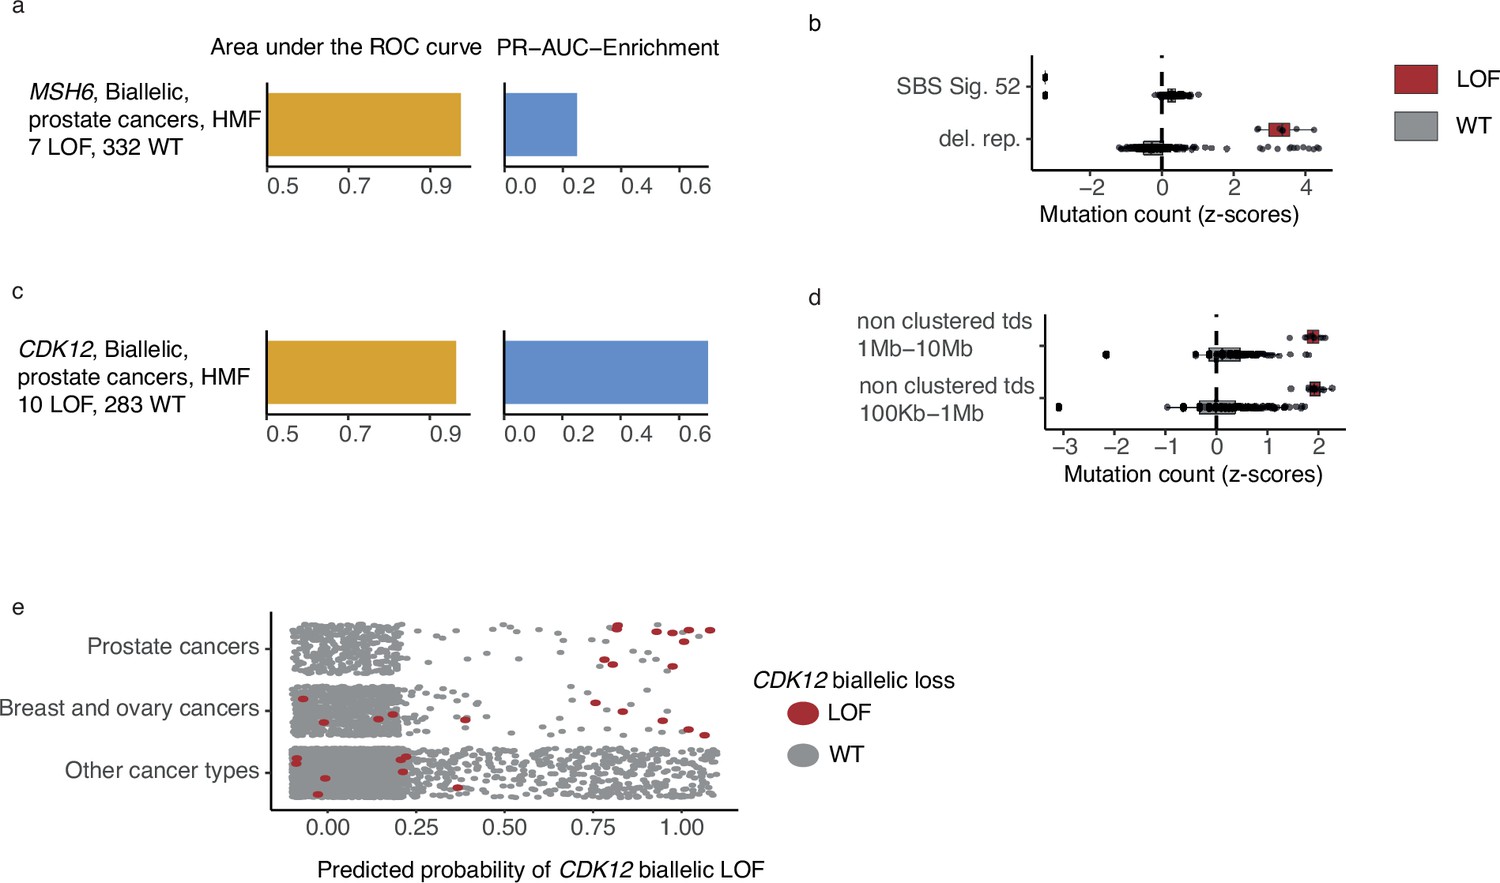
CDK12-mutated prostate tumours are predicted by tandem duplications.
(a) Biallelic predictive model MSH6-d in Hartwig Medical Foundation (HMF) prostate tumours and its PR-AUC-E and area under the receiver operator characteristic (AUROC). (b) Boxplots of mutation counts between tumours that are MSH6-d loss-of-function (LOF; red) and MSH6 wild-type (grey), (mutation counts are normalised and log-transformed; Methods). (c) Biallelic predictive model for CDK12-d with performance measures (as in a). (b) Boxplots of mutation counts for CDK12-d and wild-type tumours (as in b). (e) CDK12-d predictive performance for different cancer types. Predicted probability of CDK12-d (x-axis) for tumours with CDK12 LOF (red) and CDK12 wild-type (grey) are shown for prostate cancer, breast and ovary cancer, and all other cancer types (y-axis).
Figure 6 with 2 supplements
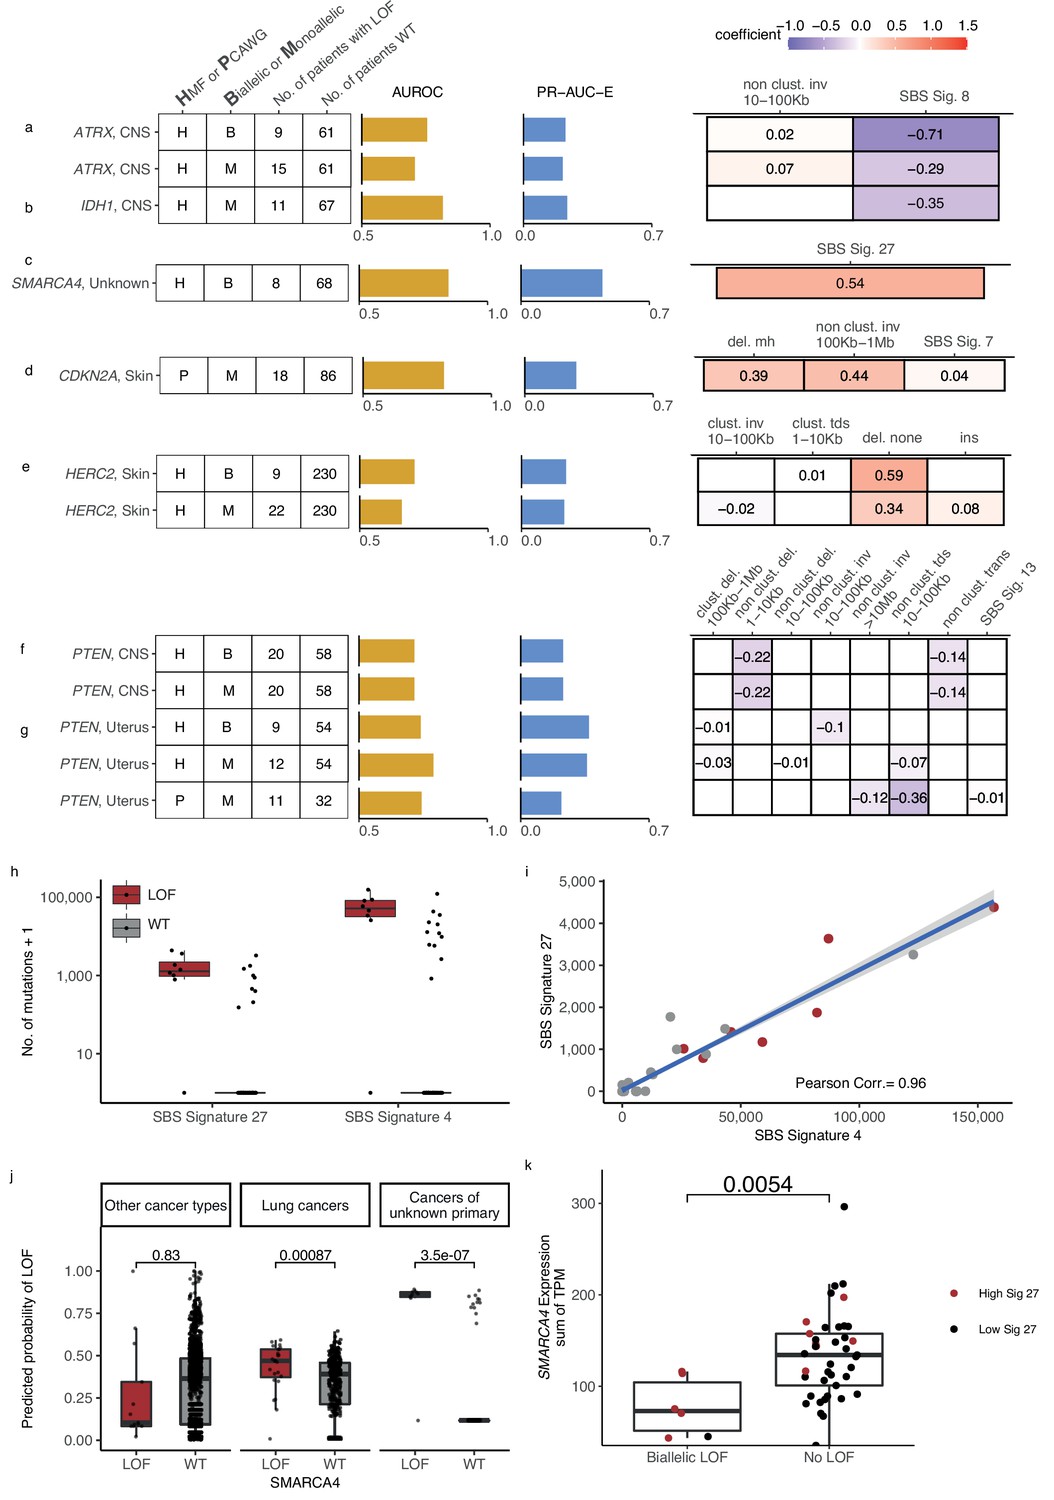
Novel predictive models of DNA damage response (DDR) gene deficiencies.
(a) Predictive model of ATRX-d and its PR-AUC-E, area under the receiver operator characteristic (AUROC), and selected features and their coefficients. Same information for predictive models of (b) IDH1-d, (c) SMARCA4-d, (d) CDKN2A-d, (e) HERC2-d, and (f) PTEN-d in central nervous system (CNS) cancers and (g) uterine cancers. (h) Number of single-base substitution (SBS) sig. 27 and SBS sig. 4 (y-axis; logarithmic) among tumours of unknown primary with SMARCA4 biallelic loss-of-function (LOF) (red) or wild-type (grey). (i) Pearson correlation between the per-tumour number (tumours of unknown primary; Hartwig Medical Foundation [HMF]) of SBS signature 27 (y-axis) and SBS signature 4 (x-axis; logarithmic) mutations, with an overlaid linear model (blue) and its 95% confidence interval (grey). (j) Using a model trained to predict SMARCA4 biallelic LOF in HMF cancers of unknown primary, we evaluate the predictive power across individual cohorts (one-tailed Wilcoxon rank-sum test), displaying significant cohorts separately (colours as in h). (k) Expression of SMARCA4, meassured as the sum of all annotated transcripts per milion (TPM; y-axis), for tumours with biallelic LOF and no LOF (x-axis). Colors indicate the rate of SBS sig. 27 in each tumour, (red >0; black = 0). The difference in expression was evaluated using a non-paired Wilcoxon rank-sum test.
Figure 6—figure supplement 1
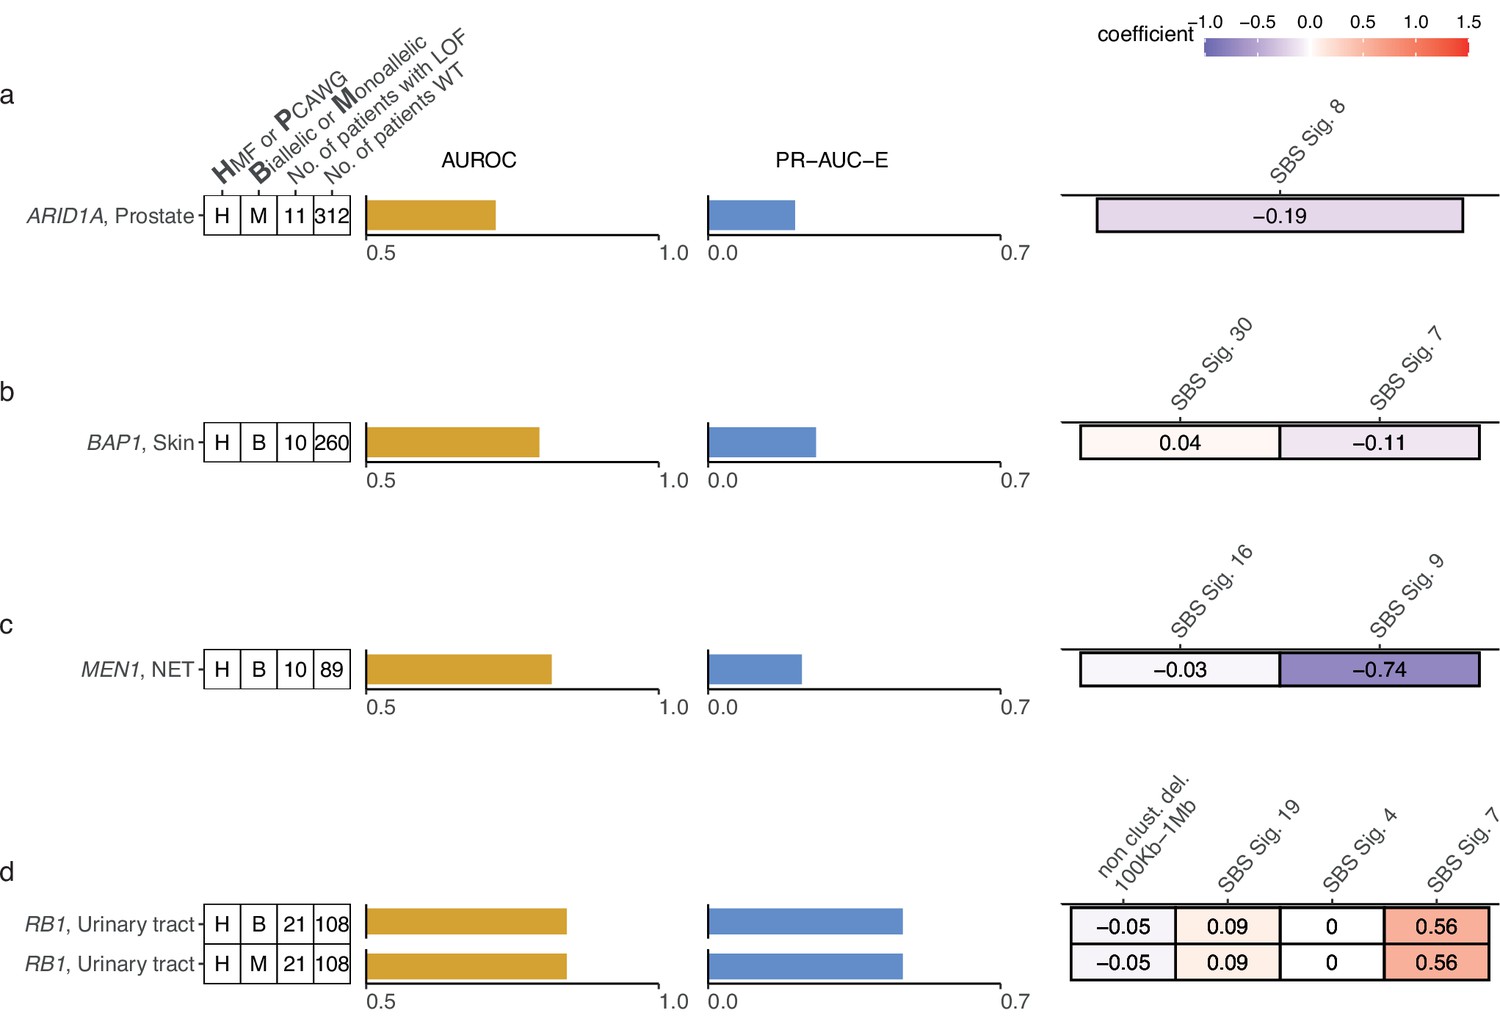
Additional shortlisted predictive models of DNA damage response (DDR) gene deficiencies.
(a) Predictive model of ARID1A-deficiency (-d) with precision-recall area-under-the-curve enrichment from the baseline (baseline – rate of loss-of-function [LOF] in the data set; PR-AUC-E) and area-under-the-ROC curve (AUROC), as well as feature coefficients. Same info for predictive models of (b) BAP1-d, (c) MEN1-d, and (d) RB1-d.
Figure 6—figure supplement 2
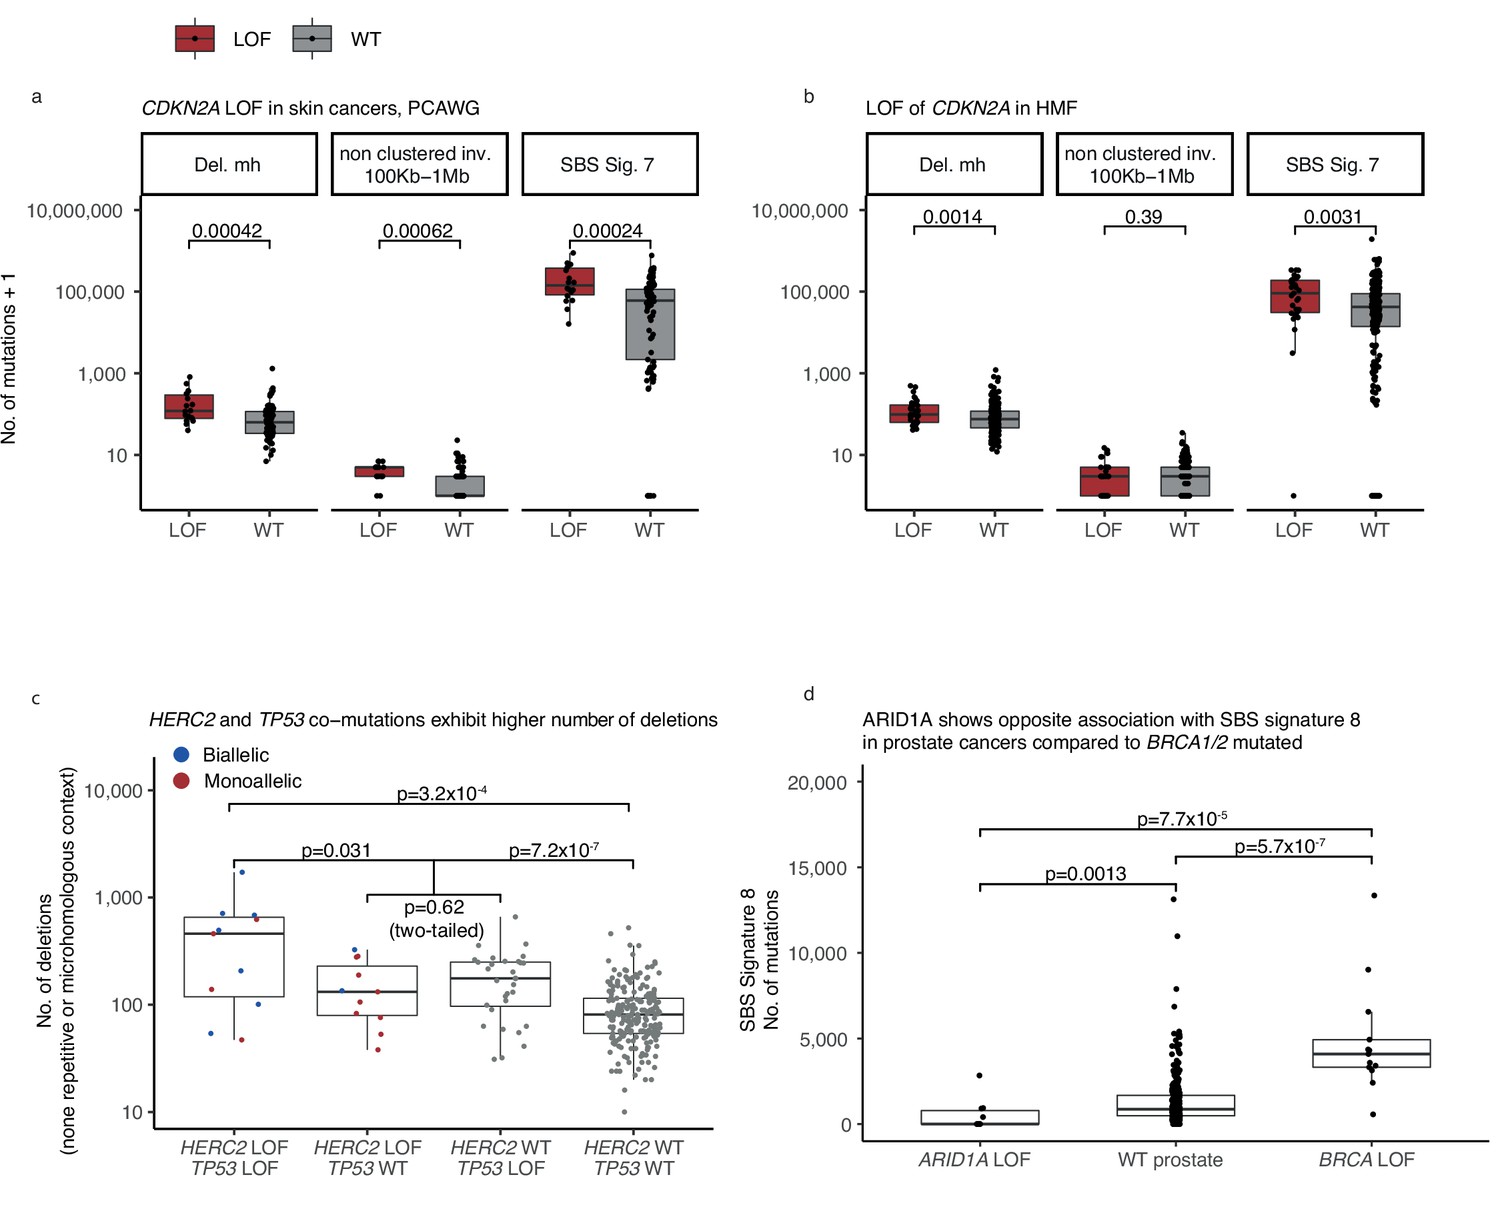
Monoallelic CDKN2A deficiency (-d) in The Pan-Cancer Analysis of Whole Genomes (PCAWG) and Hartwig Medical Foundation (HMF) skin cancers, mono- and biallelic HERC2 deficiency in HMF skin cancers.
(a) CDKN2A monoallelic loss-of-function (LOF) cancers (red) and wild-type (grey) compared by the number of mutations (y-axis; logarithmic) across patients from the PCAWG and (b) the HMF data set (Wilcoxon rank-sum test, one-tailed). (c) Number of deletions in HMF skin cancers, HERC2-d (biallelic LOF red; monoallelic blue) and monoallelic TP53-d compared to patients with LOF of either gene (Wilcoxon test, one-tailed), and to patients with LOF in neither gene (Wilcoxon test, one-tailed). Patients with monoallelic LOF of either TP53 or HERC2 are compared (Wilcox. test two-tailed). Comparison of patients with LOF of both genes and patients with exclusively TP53 LOF (not included; Wilcoxon test, one-tailed p = 0.049). (d) Number of single-base substitution (SBS) sig. 8 mutations in ARID1A-d prostate cancers, ARID1A wild-type cancers, and BRCA1/2-d prostate cancers (Wilcoxon test, one-tailed).
Additional files
-
Supplementary file 1
Supplementary tables.
(a) All included tumours and their primary tumour locations. (b) 736 DNA damage response (DDR) genes, hg19 coordinates, and the number of pathogenic events across 6065 cancer genomes. (c) All single-base substitution (SBS) signature contributions, indels counts, and structural variant (SV) counts, per sample. (d) All SBS signature contributions, indels counts, and SV counts, per sample, log-transformed and scaled to z-scores. (e) Proposed aetiologies of base substitution signatures. (f) All models (n = 535). (g) Pathogenic events in each of the 535 loss-of-function (LOF)-sets. (h) Shortlisted models (n = 48). (i) Correlation between features in shortlisted models. (j) Survival analysis for the shortlisted models.
- https://cdn.elifesciences.org/articles/81224/elife-81224-supp1-v2.xlsx
-
MDAR checklist
- https://cdn.elifesciences.org/articles/81224/elife-81224-mdarchecklist1-v2.docx
Download links
A two-part list of links to download the article, or parts of the article, in various formats.
Downloads (link to download the article as PDF)
Open citations (links to open the citations from this article in various online reference manager services)
Cite this article (links to download the citations from this article in formats compatible with various reference manager tools)
Pan-cancer association of DNA repair deficiencies with whole-genome mutational patterns
eLife 12:e81224.
https://doi.org/10.7554/eLife.81224


