Hypoxia-induced proteasomal degradation of DBC1 by SIAH2 in breast cancer progression
- State Key Laboratory of Medicinal Chemical Biology, Frontiers Science Center for Cell Responses, Tianjin Key Laboratory of Protein Science, College of Life Sciences, Haihe Laboratory of Cell Ecosystem, Nankai University, China
- School of Statistics and Data Science, LPMC and KLMDASR, Nankai University, China
Figures
Figure 1 with 1 supplement
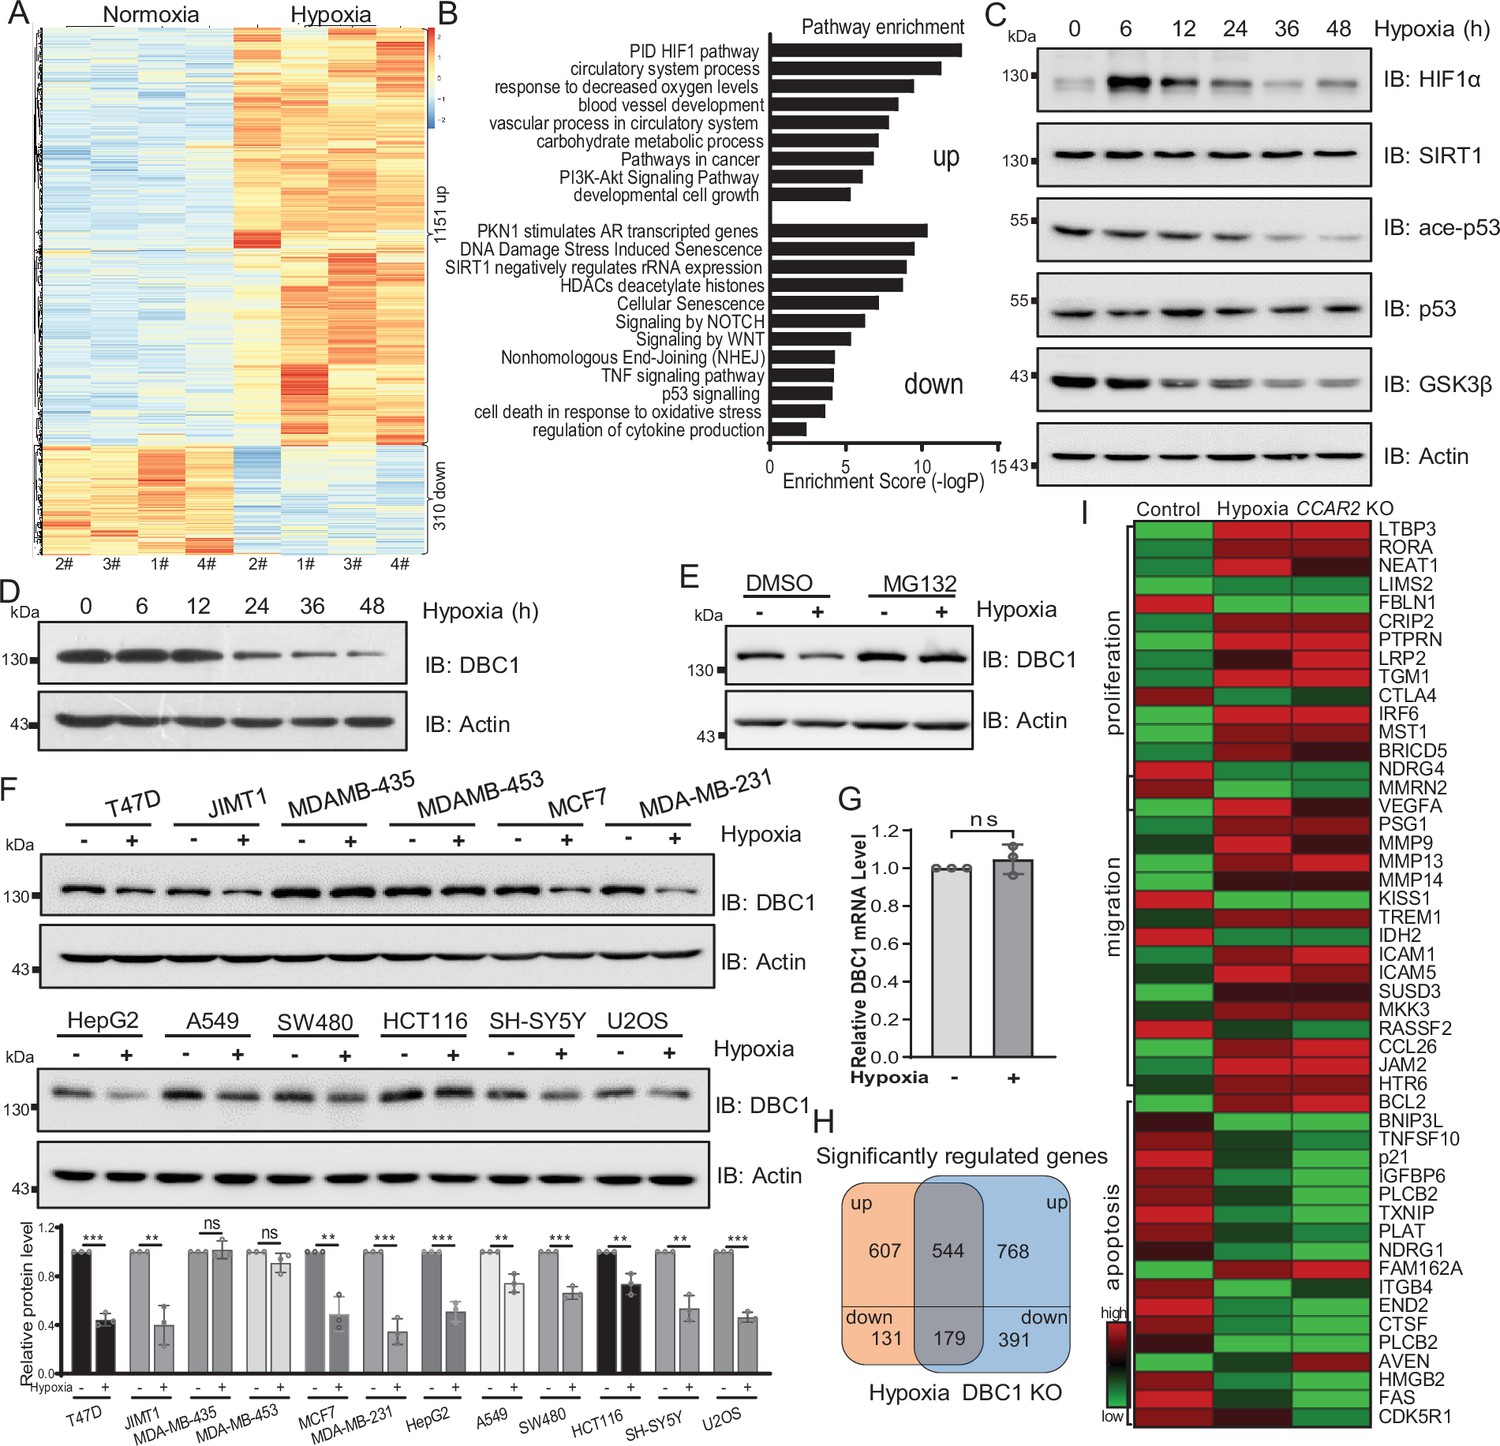
Hypoxia induces DBC1 degradation.
(A) MDA-MB-231 cells were cultured under normoxia or hypoxia for 24 hr and then the total RNA was extracted from cells using a total RNA extraction kit. RNA-sequence analysis of gene expression and heatmap shows the differential transcriptomic expression. (B) Highlights of the enriched pathways from transcriptomic expression by Metascape. (C) MDA-MB-231 cells were exposed to hypoxia for the indicated time and then Western blotting analysis of the protein levels using the indicated antibodies. (D) MDA-MB-231 cells were exposed to hypoxia for the indicated time and then protein levels of DBC1 were detected by Western blotting. (E) MDA-MB-231 cells were exposed to normoxia or hypoxia for 24 hr, with or without MG132 (10 μM), and then the protein levels of DBC1 were detected by Western blotting. (F) The indicated cell lines were cultured under normoxia or hypoxia for 24 hr and then the protein level of DBC1 was detected by Western blotting. Mean ± SEM from three independent experiments, Student’s t-test, ns, not significant, **p<0.01, ***p<0.001. (G) MDA-MB-231 cells were cultured under normoxia or hypoxia for 24 hr. Cells were collected and lysed with RNA lysis buffer. The mRNA level of DBC1 was quantified by quantitative real-time PCR assay (data are the mean ± SEM of three experiments, Student’s t-test, ns, not significant). (H) Venn diagram showing the numbers of DBC1-regulated genes common to hypoxia target genes. (I) Heatmap showing the representatives of differentially regulated transcripts associated with tumor initiation and progression.
-
Figure 1—source data 1
Hypoxia induces DBC1 degradation.
- https://cdn.elifesciences.org/articles/81247/elife-81247-fig1-data1-v2.zip
Figure 1—figure supplement 1
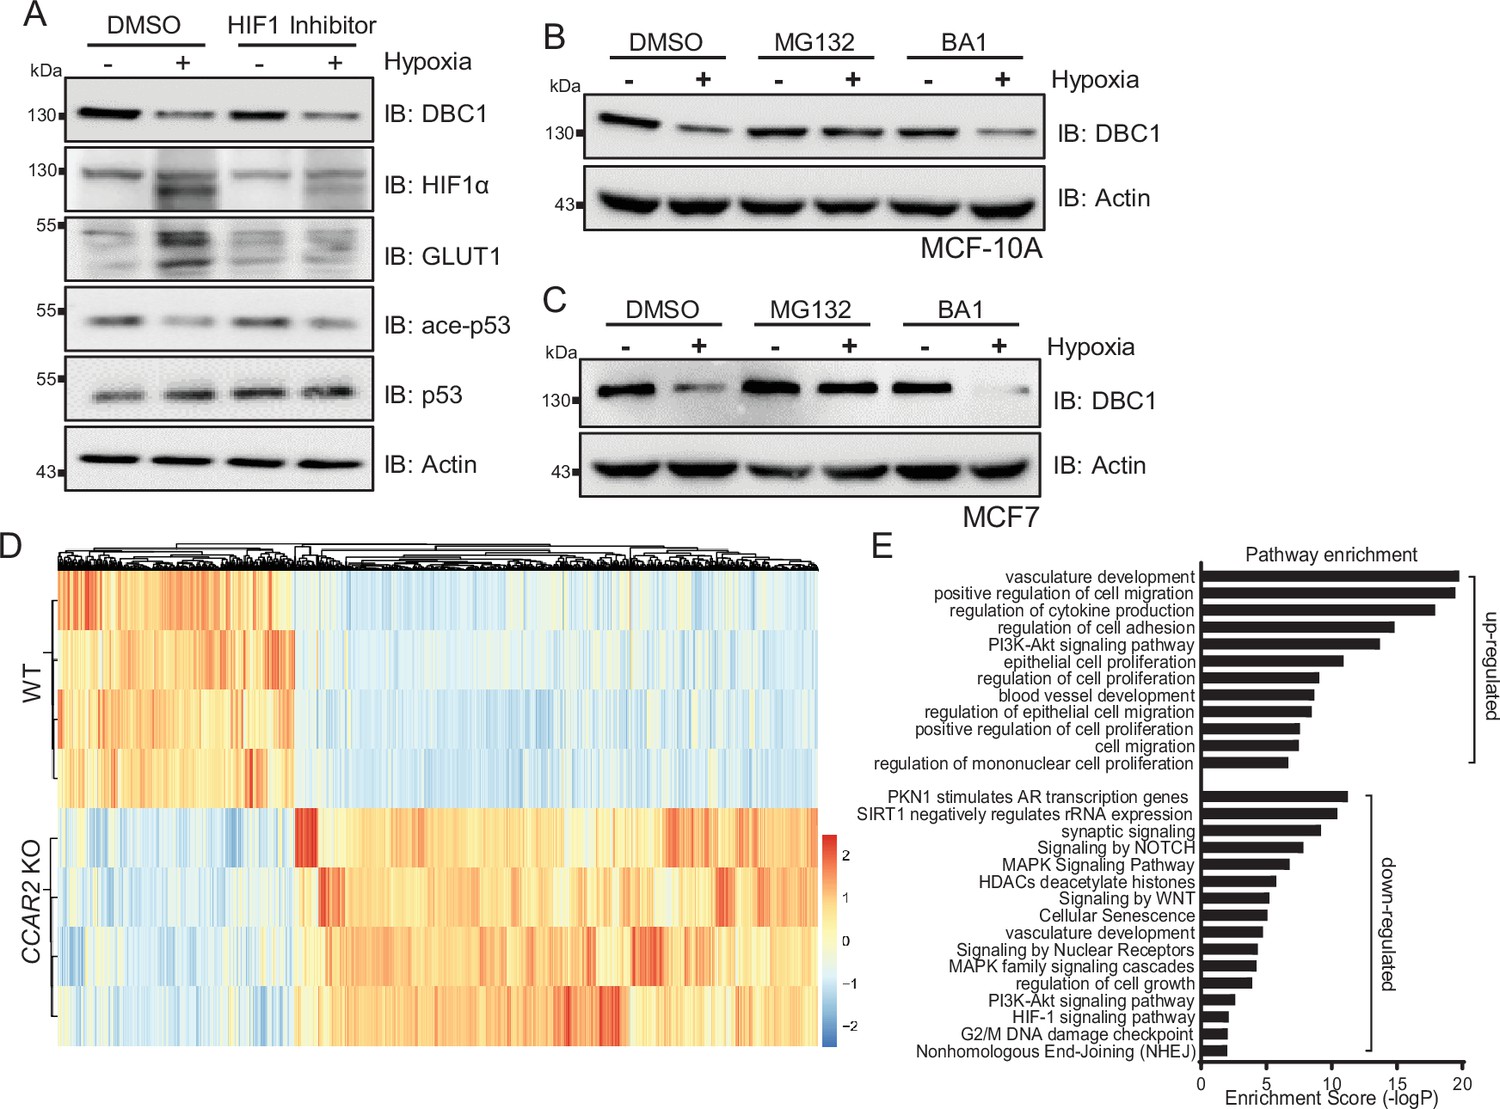
The stability of DBC1 was regulated under hypoxic conditions.
(A) MDA-MB-231 cells were exposed to normoxia or hypoxia for 24 hr, with or without HIF1 Inhibitor (10 μM) for 12 hr, and then DBC1 and indicated proteins were detected by Western blotting. (B, C) MCF10A and MCF7 cells were exposed to normoxia or hypoxia for 24 hr, with or without proteasomal inhibitor MG132 (10 μM) and lysosomal inhibitor BA1 (20 nM), and then protein level of DBC1 was detected by Western blotting. (D) Heatmap of the differentially expressed genes in wildtype and DBC1 knockout MDA-MB-231 cells. (E) Pathway enrichment in DBC1 knockout MDA-MB-231 cells by Metascape.
-
Figure 1—figure supplement 1—source data 1
Hypoxia induces DBC1 degradation.
- https://cdn.elifesciences.org/articles/81247/elife-81247-fig1-figsupp1-data1-v2.zip
Figure 2 with 1 supplement
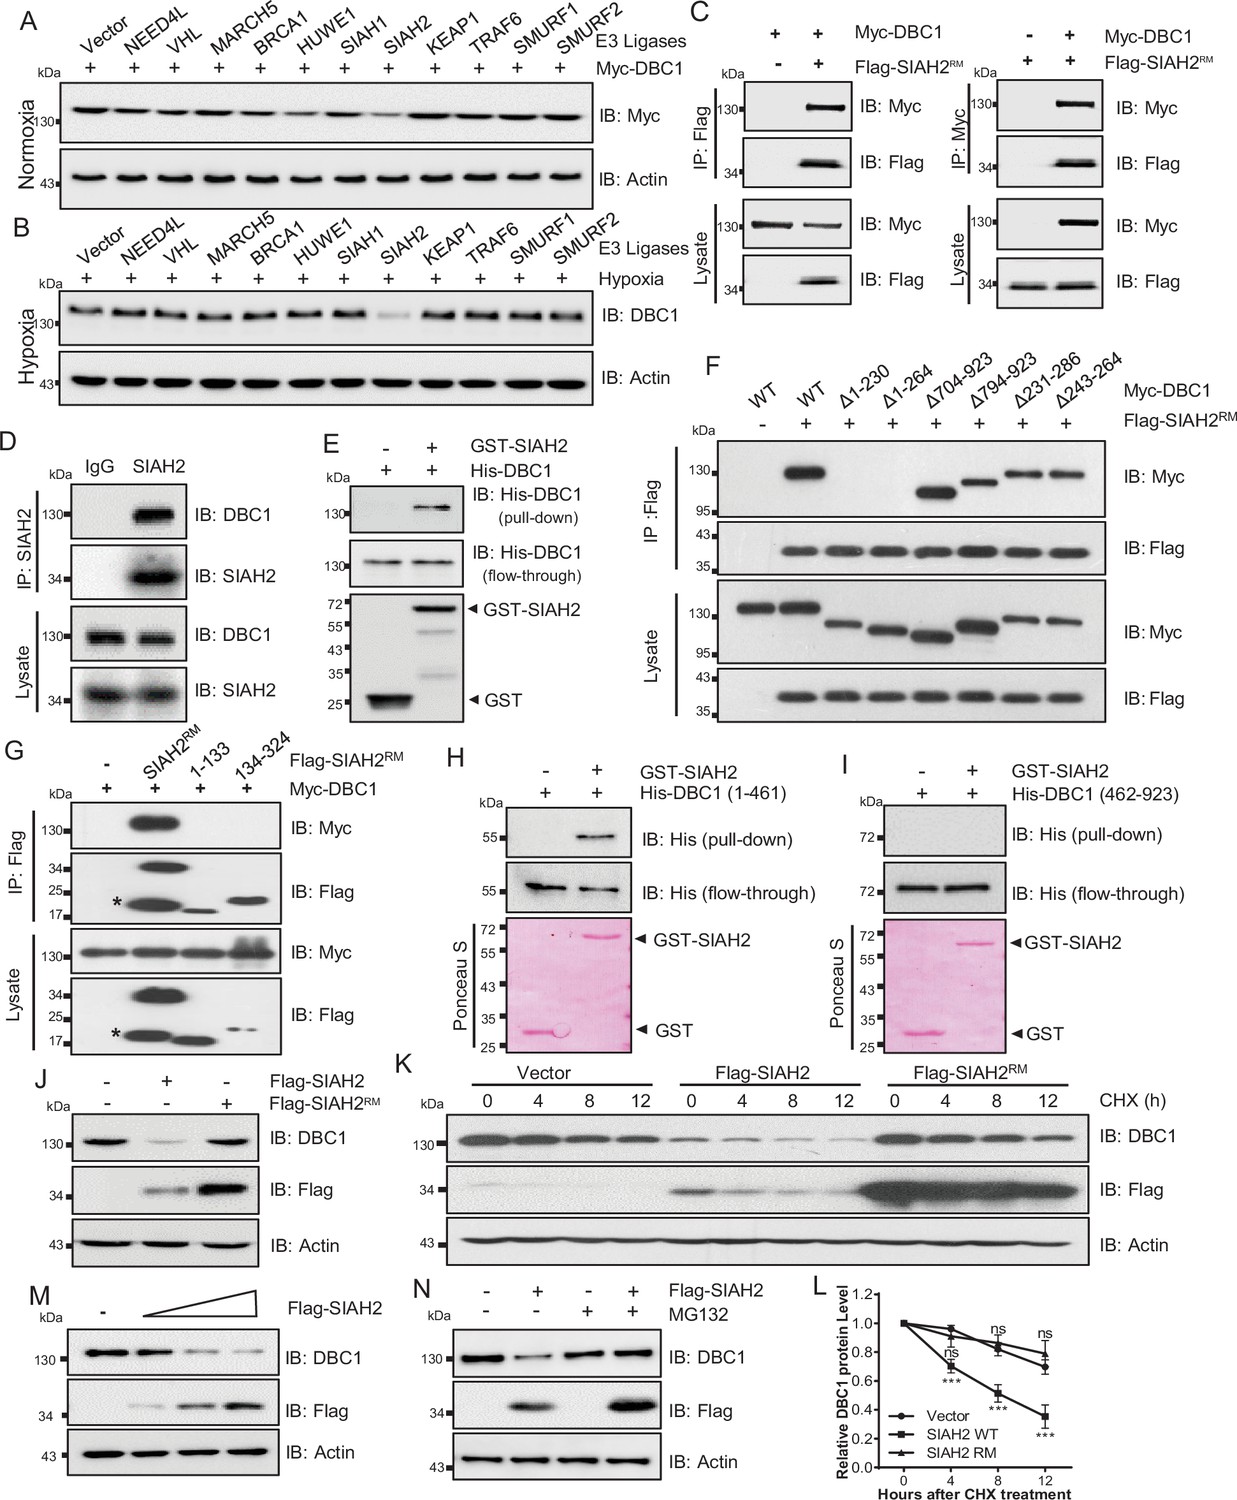
SIAH2 interacts with DBC1 and regulates its stability.
(A) HeLa cells were transfected with Myc-DBC1 and several hypoxia-relative E3 ligases and cultured under normoxic conditions for 24 hr. The protein level of DBC1 was detected by Western blotting. (B) HeLa cells were transfected with several hypoxia-relative E3 ligases and cultured under hypoxic conditions for 24 hr. The protein level of DBC1 was detected by Western blotting. (C) HEK293T cells were transfected with Myc-DBC1 and Flag-SIAH2RM for 24 hr. Cells were collected for immunoprecipitation with anti-Flag or anti-Myc antibody. (D) MDA-MB-231 cells were cultured under hypoxia for 18 hr, then treated with 10 μM MG132 and incubated under normoxia or hypoxia for another 6 hr. Endogenous interactions between DBC1 and SIAH2 were analyzed by co-immunoprecipitation (Co-IP). (E) Purified GST and GST-tagged SIAH2 proteins were used for GST affinity isolation of His-DBC1 in vitro and blotted with an anti-DBC1 antibody. (F) HEK293T cells were co-transfected with full-length or truncated forms of Myc-DBC1 and Flag-SIAH2RM, and immunoprecipitation was performed with an anti-Flag antibody. Co-immunoprecipitated DBC1 and SIAH2 were detected by Western blotting with anti-Myc and anti-Flag antibodies, respectively. (G) Myc-DBC1 was co-transfected with full-length or truncated forms of Flag-SIAH2RM, and immunoprecipitation was performed with an anti-Myc antibody. Co-immunoprecipitated SIAH2 and DBC1 were detected by Western blotting with anti-Flag and anti-Myc antibodies, respectively. (H, I) GST pull-down analysis showing the direct interaction between bacterially expressed GST-SIAH2 and the N- or C-terminal half of His-DBC1 in vitro. (J) HeLa cells were transfected with Flag-SIAH2, Flag-SIAH2RM, or the empty Flag-vector for 24 hr and the cell lysates were subjected to Western blotting analysis of DBC1. (K) HeLa cells were transfected with Flag-SIAH2, Flag-SIAH2RM, or the empty Flag-vector for 24 hr. CHX (10 μM) was added for the indicated time, and the cell lysates were subjected to Western blotting analysis of DBC1. (L) Quantification of DBC1 protein level in (K) (mean ± SEM from three independent experiments, two-way ANOVA, ns, not significant, ***p<0.001). (M) HeLa cells were transfected with Flag-SIAH2 by quantitative gradient and then protein level of DBC1 was detected by Western blotting. (N) HeLa cells were transfected with Flag-SIAH2 for 24 hr and then treated with or without MG132 (10 μM) for 6 hr. The cell lysates were subjected to Western blotting analysis of DBC1.
-
Figure 2—source data 1
SIAH2 interacts with DBC1.
- https://cdn.elifesciences.org/articles/81247/elife-81247-fig2-data1-v2.zip
Figure 2—figure supplement 1
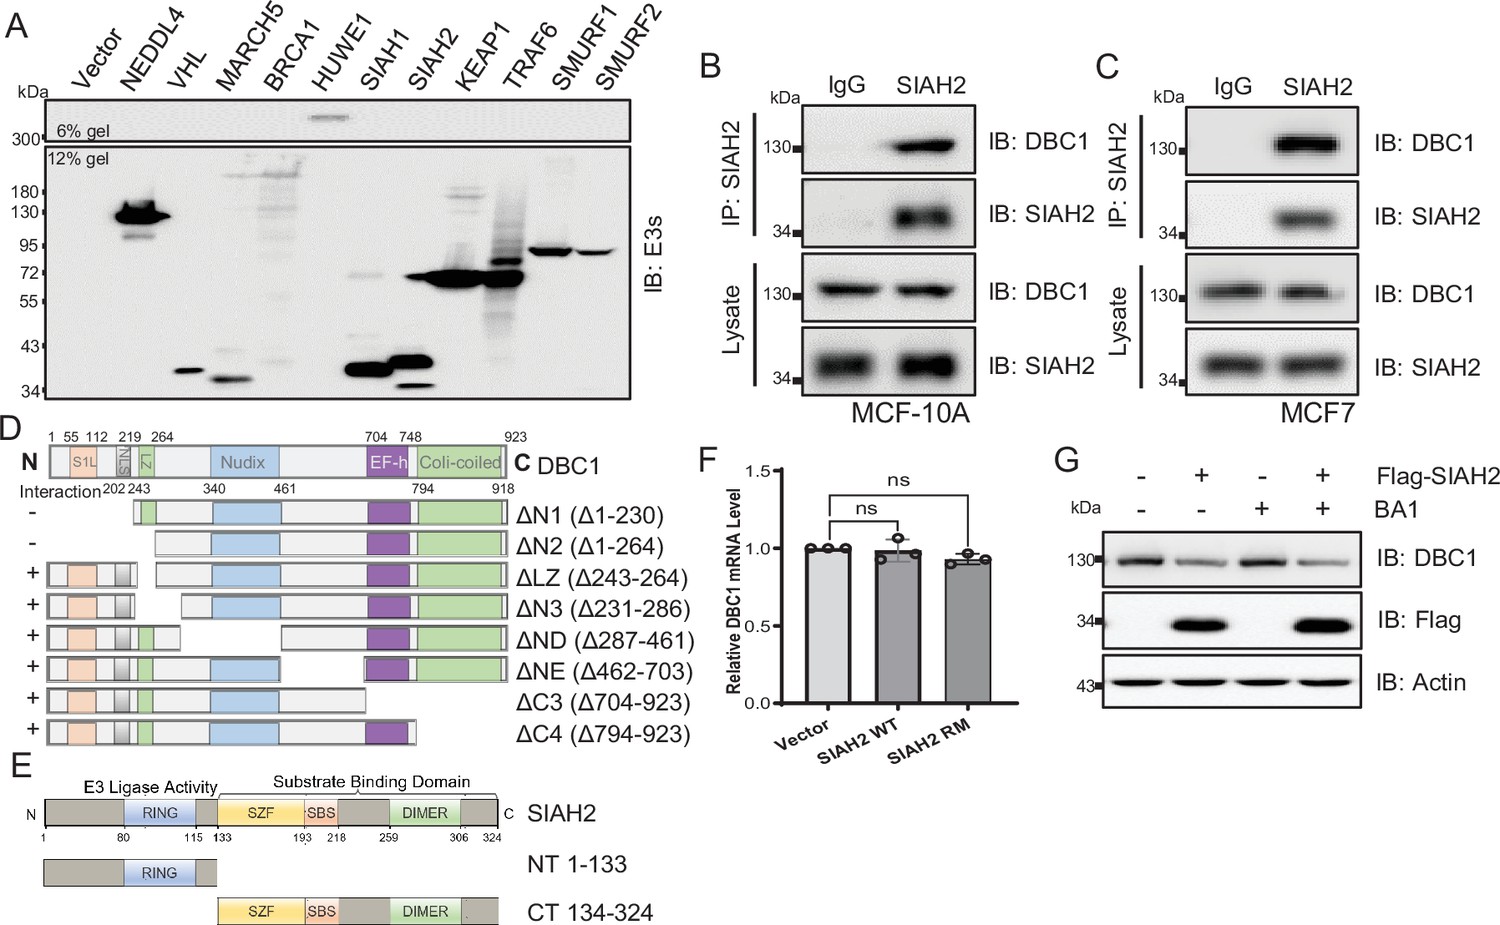
The stability of DBC1 was regulated by SIAH2.
(A) HeLa cells were transfected with several hypoxia-relative E3 ligases and cultured for 24 hr. The proteins levels of E3 ligases were detected by Western blotting. (B, C) MCF10A and MCF7 cells were cultured under normoxia or hypoxia for 18 hr, then treated with 10 μM MG132 and incubated under normoxia or hypoxia for another 6 hr. Endogenous interactions between DBC1 and SIAH2 were analyzed by co-immunoprecipitation (Co-IP). (D, E) Truncated forms of Myc-DBC1 and Flag-SIAH2RM were constructed based on their functional domains. (F) Quantitative real-time PCR analysis of the CCAR2 mRNA level in HeLa cells, data are the mean ± SEM of three experiments, Student’s t-test, ns, not significant. (G) Western blotting analysis of the DBC1 level in HeLa cells expressing Flag-SIAH2 and treated with or without the lysosomal inhibitor BA1 (20 nM).
-
Figure 2—figure supplement 1—source data 1
SIAH2 interacts with DBC1.
- https://cdn.elifesciences.org/articles/81247/elife-81247-fig2-figsupp1-data1-v2.zip
Figure 3 with 1 supplement
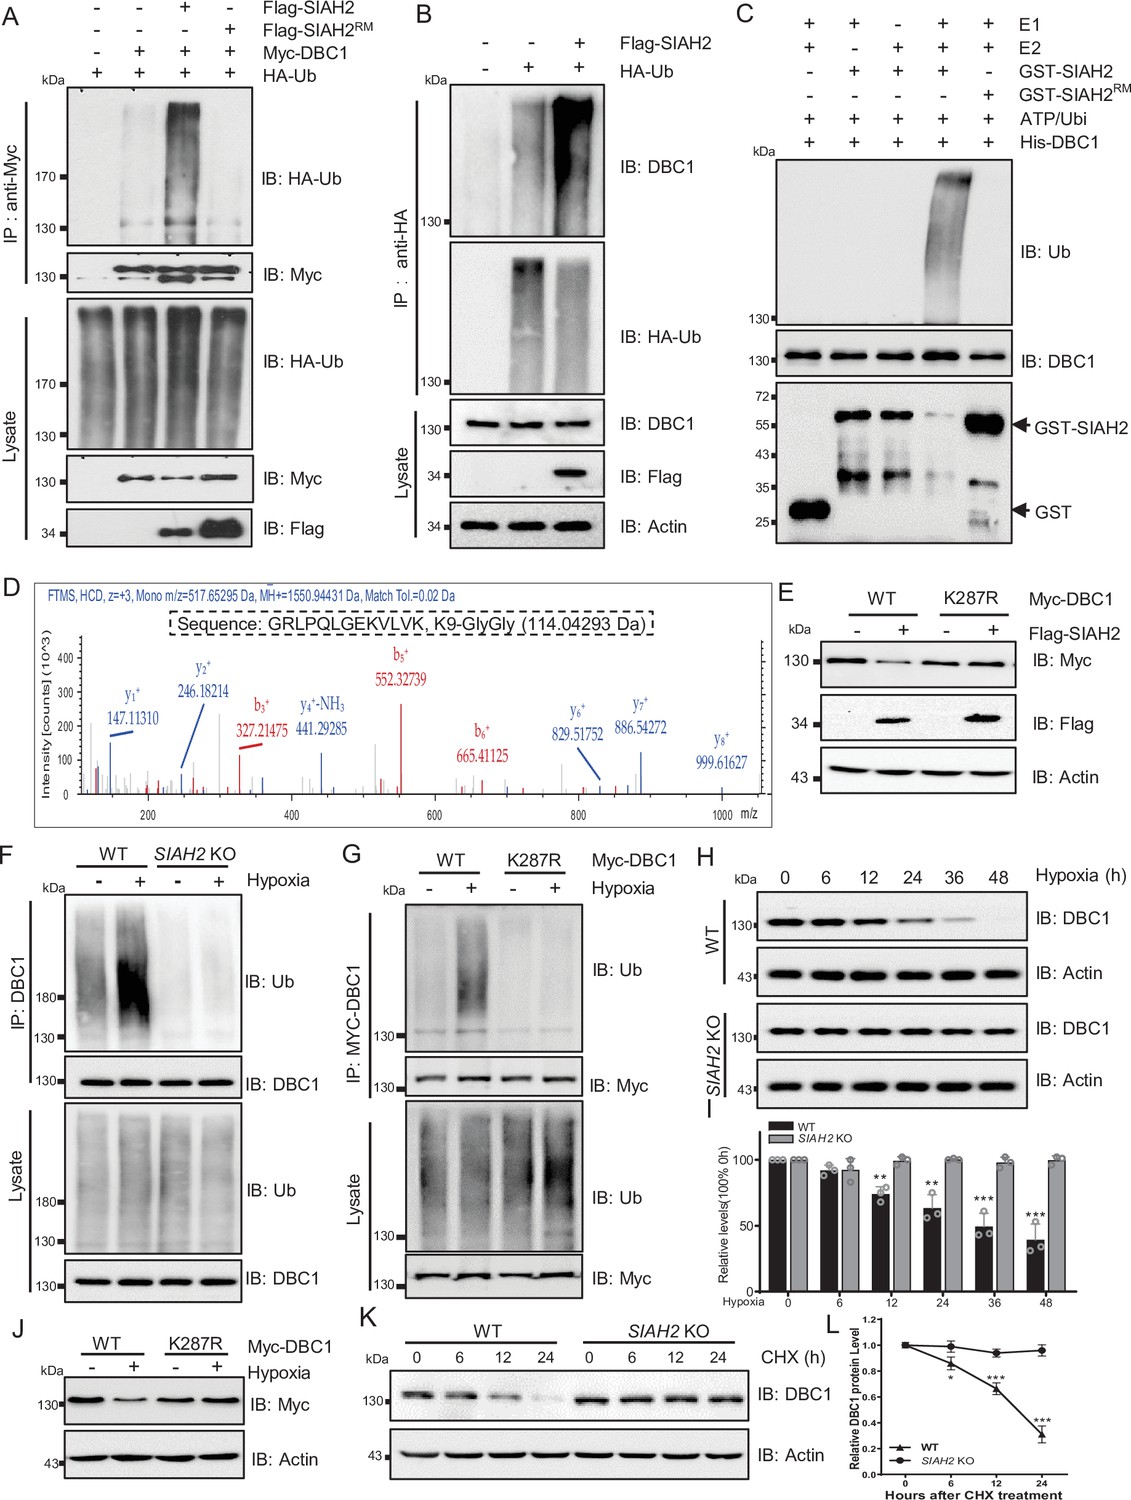
SIAH2 promotes DBC1 polyubiquitination and degradation under hypoxia.
(A) HEK293T cells were transfected with Myc-DBC1, HA-Ub, and Flag-SIAH2 or Flag-SIAH2RM for 24 hr and then treated with MG132 (10 μM) for 6 hr. Ubiquitylation assays were performed and the ubiquitylation level of DBC1 was detected using an anti-HA antibody. (B) The HEK293T cells with or without Flag-SIAH2 transfection were treated with MG132 (10 μM) for 6 hr; then the cell lysates were subjected to anti-HA immunoprecipitation, and the immunoprecipitated were analyzed by Western blot using anti-DBC1. (C) Ubiquitination of bacterially expressed His-DBC1 by purified SIAH2 but not by SIAH2RM in vitro. The reactions were performed either with purified ubiquitin, UBA1 (E1), UBCH7 (E2), and SIAH2 or its inactive mutant or in the absence of UBA1, UBCH7, or ubiquitin. (D) Mass spectrometry analysis identifies K287 of DBC1 as the site for SIAH2-induced ubiquitination. Ubiquitinated DBC1 was trypsin digested and analyzed by LC-MS/MS. The MS/MS mass spectrum of a ubiquitinated peptide is shown for peptide DBC1 279–291 containing ubiquitinated Lys-287. (E) HeLa cells were transfected with Myc-DBC1 or the Myc-DBC1 (K287R) mutant and Flag-SIAH2 or the empty Flag-vector for 24 hr. The protein level of DBC1 was detected using an anti-Myc antibody. (F) WT and SIAH2 knockout MDA-MB-231 cells were cultured under normoxia or hypoxia for 24 hr and then treated with MG132 (10 μM) for 6 hr. Cells were harvested, denatured, and lysed for immunoprecipitation with anti-DBC1 antibody. The ubiquitination level of DBC1 was assessed by immunoblotting with an anti-Ub antibody. (G) HeLa cells were transfected with Myc-DBC1 or the Myc-DBC1 (K287R) mutant and cultured under normoxia or hypoxia for 24 hr. Cells were harvested, denatured, and lysed for immunoprecipitation with anti-Myc antibody. The ubiquitination level of DBC1 was assessed by immunoblotting with an anti-Ub antibody. (H) WT and SIAH2 knockout MDA-MB-231 cells were exposed to hypoxia for the indicated time and then protein level of DBC1 was detected by Western blotting. (I) Quantification of DBC1 protein as indicated in (H) (mean ± SEM from three independent experiments, Student’s t-test, **p<0.01, ***p<0.001). (J) HeLa cells were transfected with Myc-DBC1 or the Myc-DBC1 (K287R) mutant and cultured under normoxia or hypoxia for 24 hr and then protein level of DBC1 was detected by Western blotting. (K) WT and SIAH2 knockout MDA-MB-231 cells was exposed to hypoxia for 24 hr, CHX (10 μM) was added for the indicated time, and the cell lysates were subjected to Western blotting analysis of DBC1. (L) Quantification of DBC1 protein levels in (K) (mean ± SEM from three independent experiments, Student’s t-test, *p<0.05, **p<0.01).
-
Figure 3—source data 1
SIAH2 promotes DBC1 polyubiquitination and degradation.
- https://cdn.elifesciences.org/articles/81247/elife-81247-fig3-data1-v2.zip
Figure 3—figure supplement 1
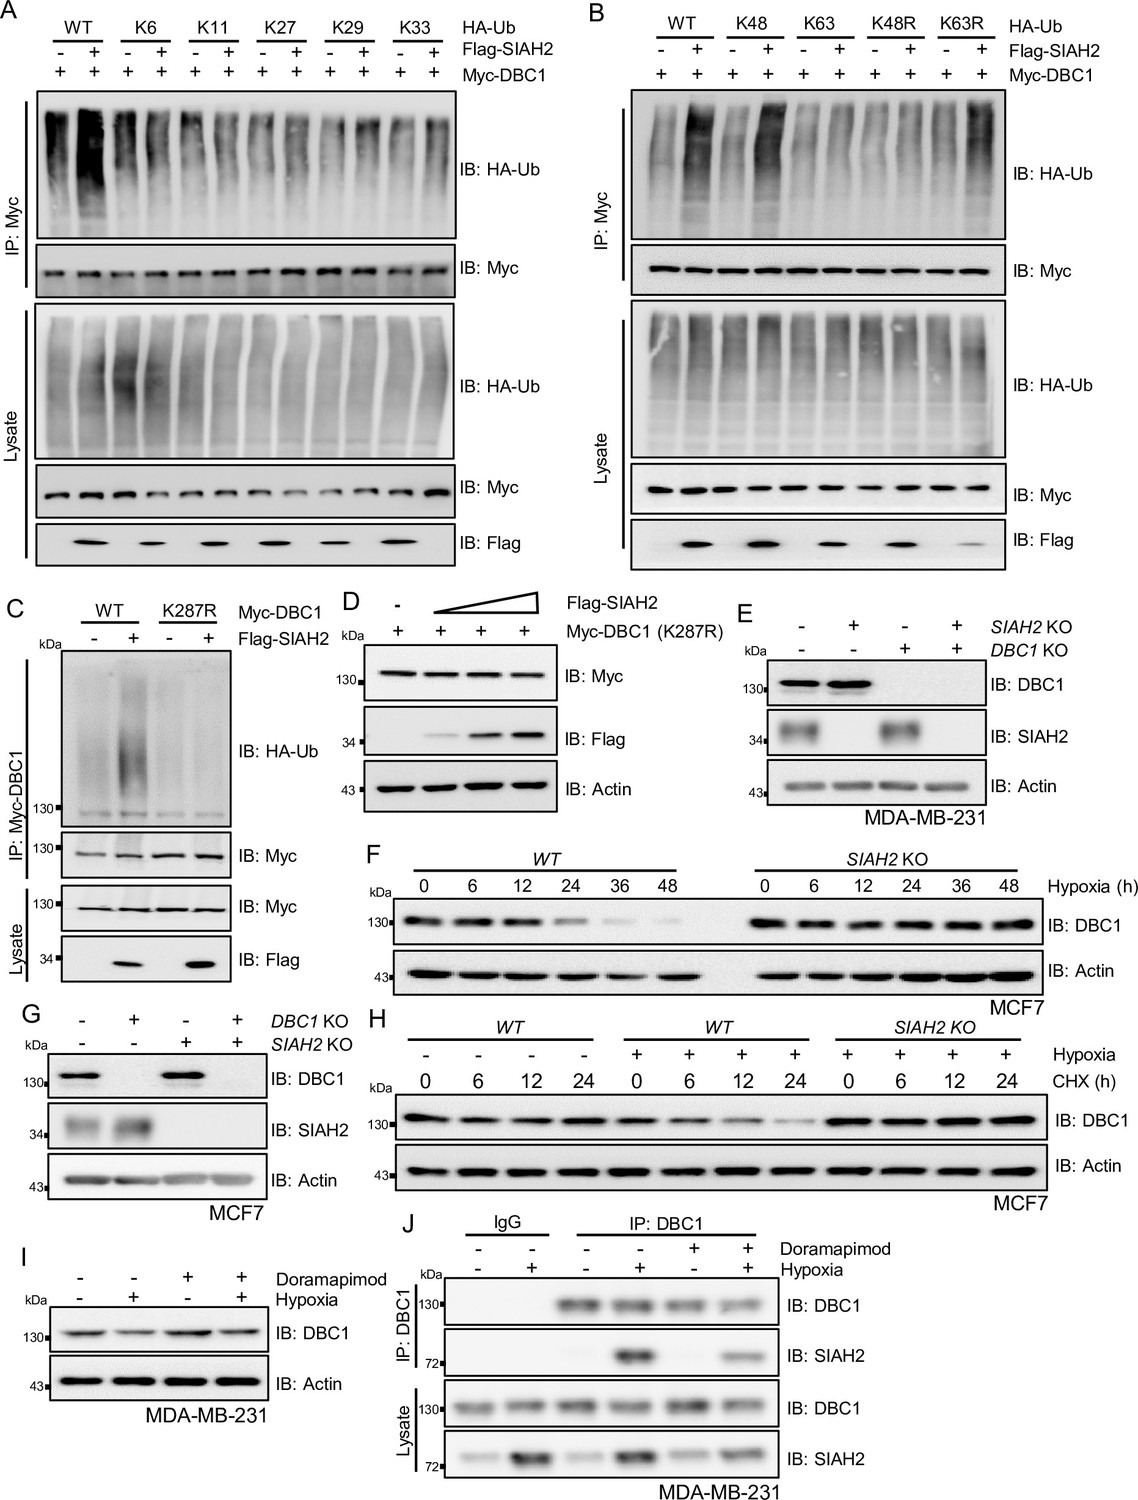
Hypoxia-induced DBC1 degradation is dependent on E3 Ligase SIAH2.
(A, B) HEK293T cells were transfected with HA-tagged wildtype ubiquitin or the different lysine-to-arginine mutants together with Myc-DBC1 and Flag-SIAH2 or the empty Flag-vector for 24 hr and then treated with MG132 (10 μM) for 6 hr. Ubiquitylation assays were performed and the ubiquitylated DBC1 was detected using an anti-HA antibody. (C) HEK293T cells were transfected with Myc-DBC1 or the Myc-DBC1 (K287R) mutant and Flag-SIAH2 or the empty Flag-vector for 24 hr and then treated with MG132 (10 μM) for 6 hr. Ubiquitylation assays were performed and the ubiquitylation level of DBC1 was detected using an anti-HA antibody. (D) HeLa cells were transfected with Myc-DBC1 (K287R) mutant and Flag-SIAH2 by quantitative gradient and then protein level of DBC1 was detected by Western blotting. (E) The SIAH2 knockout, DBC1 knockout, and SIAH2/DBC1 double-knockout MDA-MB-231 cells were detected by Western blotting. (F) The WT and SIAH2 knockout MCF7 cells were exposed to hypoxia for the indicated time and then protein level of DBC1 was detected by Western blotting. (G) The SIAH2 knockout, DBC1 knockout, and SIAH2 and DBC1 double-knockout MCF7 cells were detected by Western blotting. (H) The WT and SIAH2 knockout MCF7 cells were exposed to normoxia or hypoxia for 12 hr, CHX (10 μM) was added for the indicated time, and the cell lysates were subjected to Western blotting analysis of DBC1. (I) MDA-MB-231 cells were cultured under normoxic or hypoxic conditions for 24 hr and then treated with doramapimod (1 μM) for 6 hr, and the cell lysates were subjected to Western blotting analysis of DBC1. (J) MDA-MB-231 cells were cultured under normoxic or hypoxic conditions for 24 hr and then treated with doramapimod (1 μM) for 6 hr. Immunoprecipitation was performed with an anti-DBC1 antibody. Co-immunoprecipitated endogenous SIAH2 and OTUD5 were detected by Western blotting with an anti-SIAH2 and anti-OTUD5 antibodies.
-
Figure 3—figure supplement 1—source data 1
SIAH2 regulate DBC1 polyubiquitination and its degradation.
- https://cdn.elifesciences.org/articles/81247/elife-81247-fig3-figsupp1-data1-v2.zip
Figure 4 with 1 supplement
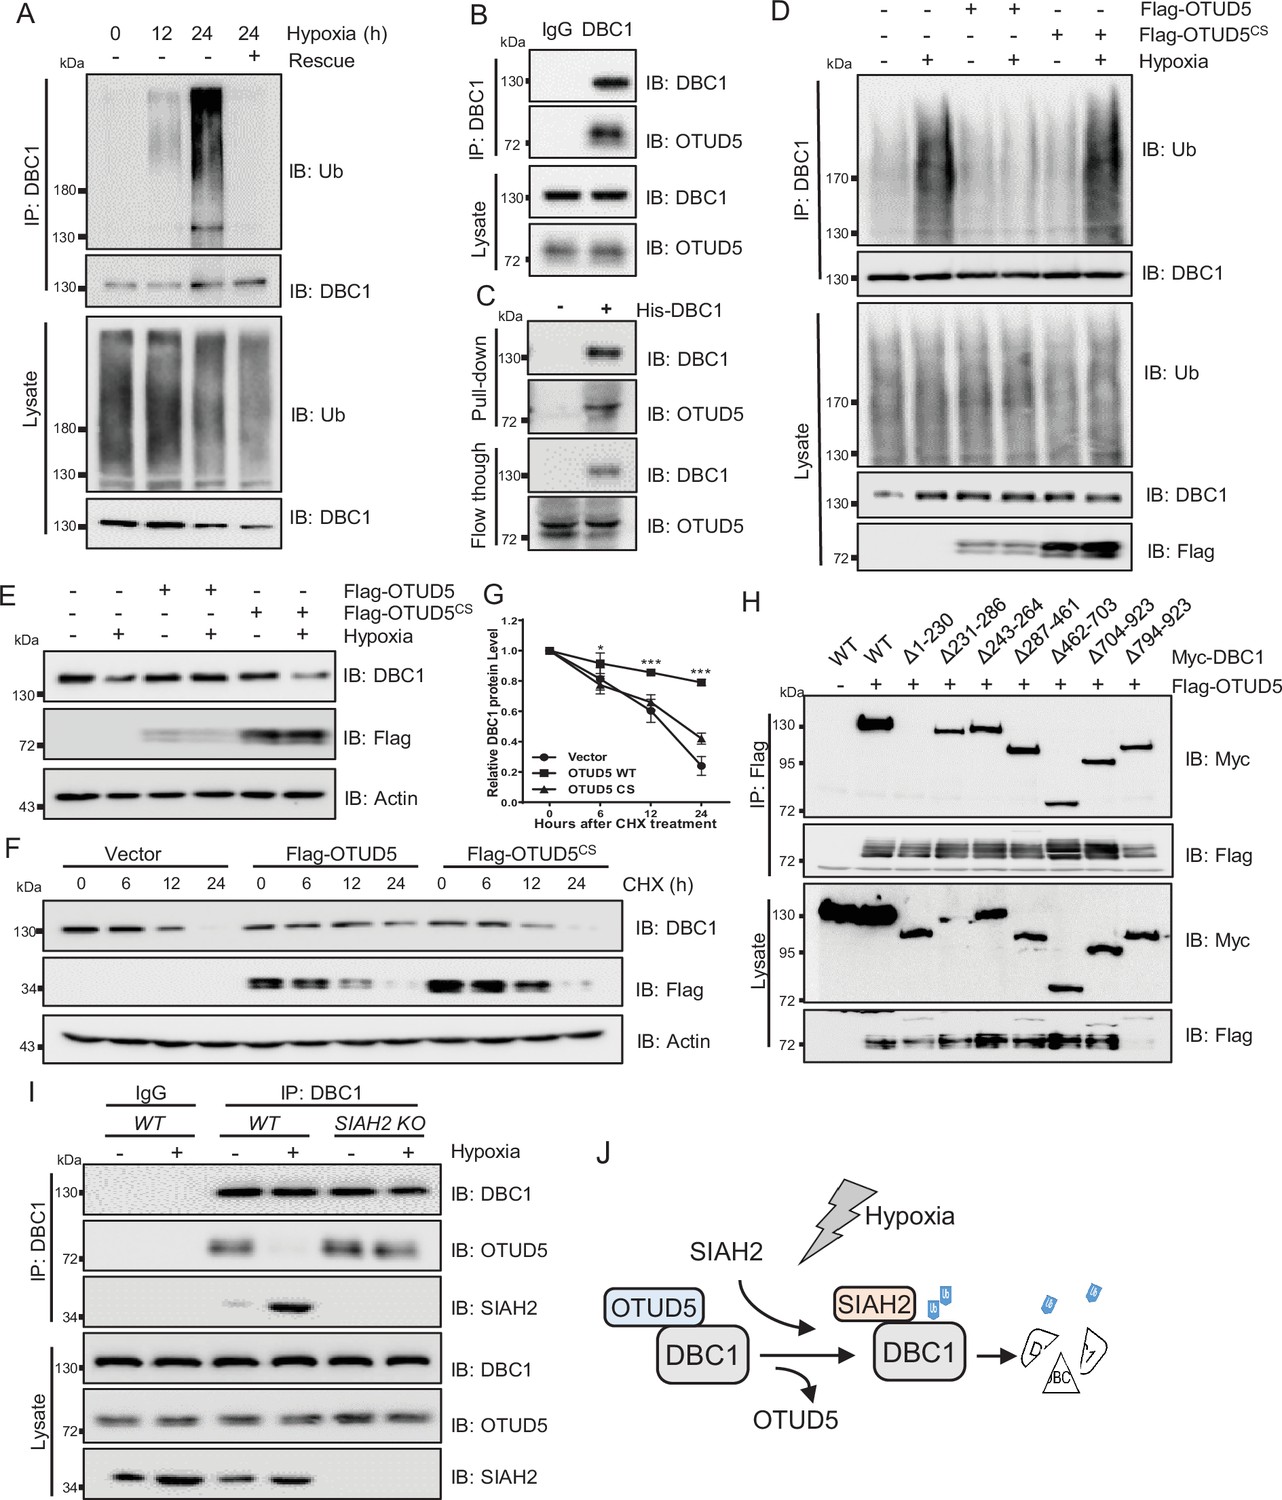
OTUD5 interacts with DBC1 and regulates its stability.
(A) MDA-MB-231 cells were cultured under normoxia or hypoxia for indicated time, then one group was recovered to normoxia for 6 hr, and then treated with MG132 (10 μM) for 6 hr. Cells were harvested, denatured, and lysed for immunoprecipitation with anti-DBC1 antibody. The ubiquitination level of DBC1 was assessed by immunoblotting with anti-Ub antibody. (B) MDA-MB-231 cells were collected for immunoprecipitation with anti-DBC1 antibody, and co-immunoprecipitated endogenous OTUD5 was detected by Western blotting with an anti-OTUD5 antibody. (C) Purified His-tagged DBC1 proteins were used for His affinity isolation of endogenous OTUD5 of MCF7 cells and blotted with an anti-OTUD5 antibody. (D) HeLa cells were transfected with Flag-OTUD5 or the Flag-OTUD5 (C224S) mutant and cultured under normoxia or hypoxia for 24 hr and then treated with MG132 (10 μM) for 6 hr. Cells were harvested, denatured, and lysed for immunoprecipitation with anti-DBC1 antibody. The ubiquitination level of DBC1 was assessed by immunoblotting with anti-Ub antibody. (E) HeLa cells were transfected with Flag-OTUD5 or the Flag-OTUD5 (C224S) mutant and cultured under normoxia or hypoxia for 24 hr and then protein level of DBC1 was detected by Western blotting. (F) HeLa cells were transfected with Flag-OTUD5 or the Flag-OTUD5 (C224S) mutant and exposed to hypoxia for 24 hr, CHX (10 μM) was added for the indicated time, and the cell lysates were subjected to Western blotting analysis of DBC1. (G) Quantification of DBC1 protein levels in (F) (mean ± SEM from three independent experiments, two-way ANOVA, *p<0.05, ***p<0.001). (H) HEK293T cells were co-transfected with full-length or truncated forms of Myc-DBC1 and Flag-OTUD5, and immunoprecipitation was performed with an anti-Flag antibody. Co-immunoprecipitated DBC1 and OTUD5 were detected by Western blotting with anti-Myc and anti-Flag antibodies, respectively. (I) The WT and SIAH2 knockout MDA-MB-231 cells were exposed to normoxia or hypoxia for 24 hr and then treated with MG132 (10 μM) for 6 hr. Immunoprecipitation was performed with an anti-DBC1 antibody. Co-immunoprecipitated endogenous SIAH2 and OTUD5 were detected by Western blotting with anti-SIAH2 and anti-OTUD5 antibodies, respectively. (J) Schematic model presenting the substitution interaction of SIAH2 and OTUD5 with DBC1 under hypoxia.
-
Figure 4—source data 1
OTUD5 interacts with DBC1.
- https://cdn.elifesciences.org/articles/81247/elife-81247-fig4-data1-v2.zip
Figure 4—figure supplement 1
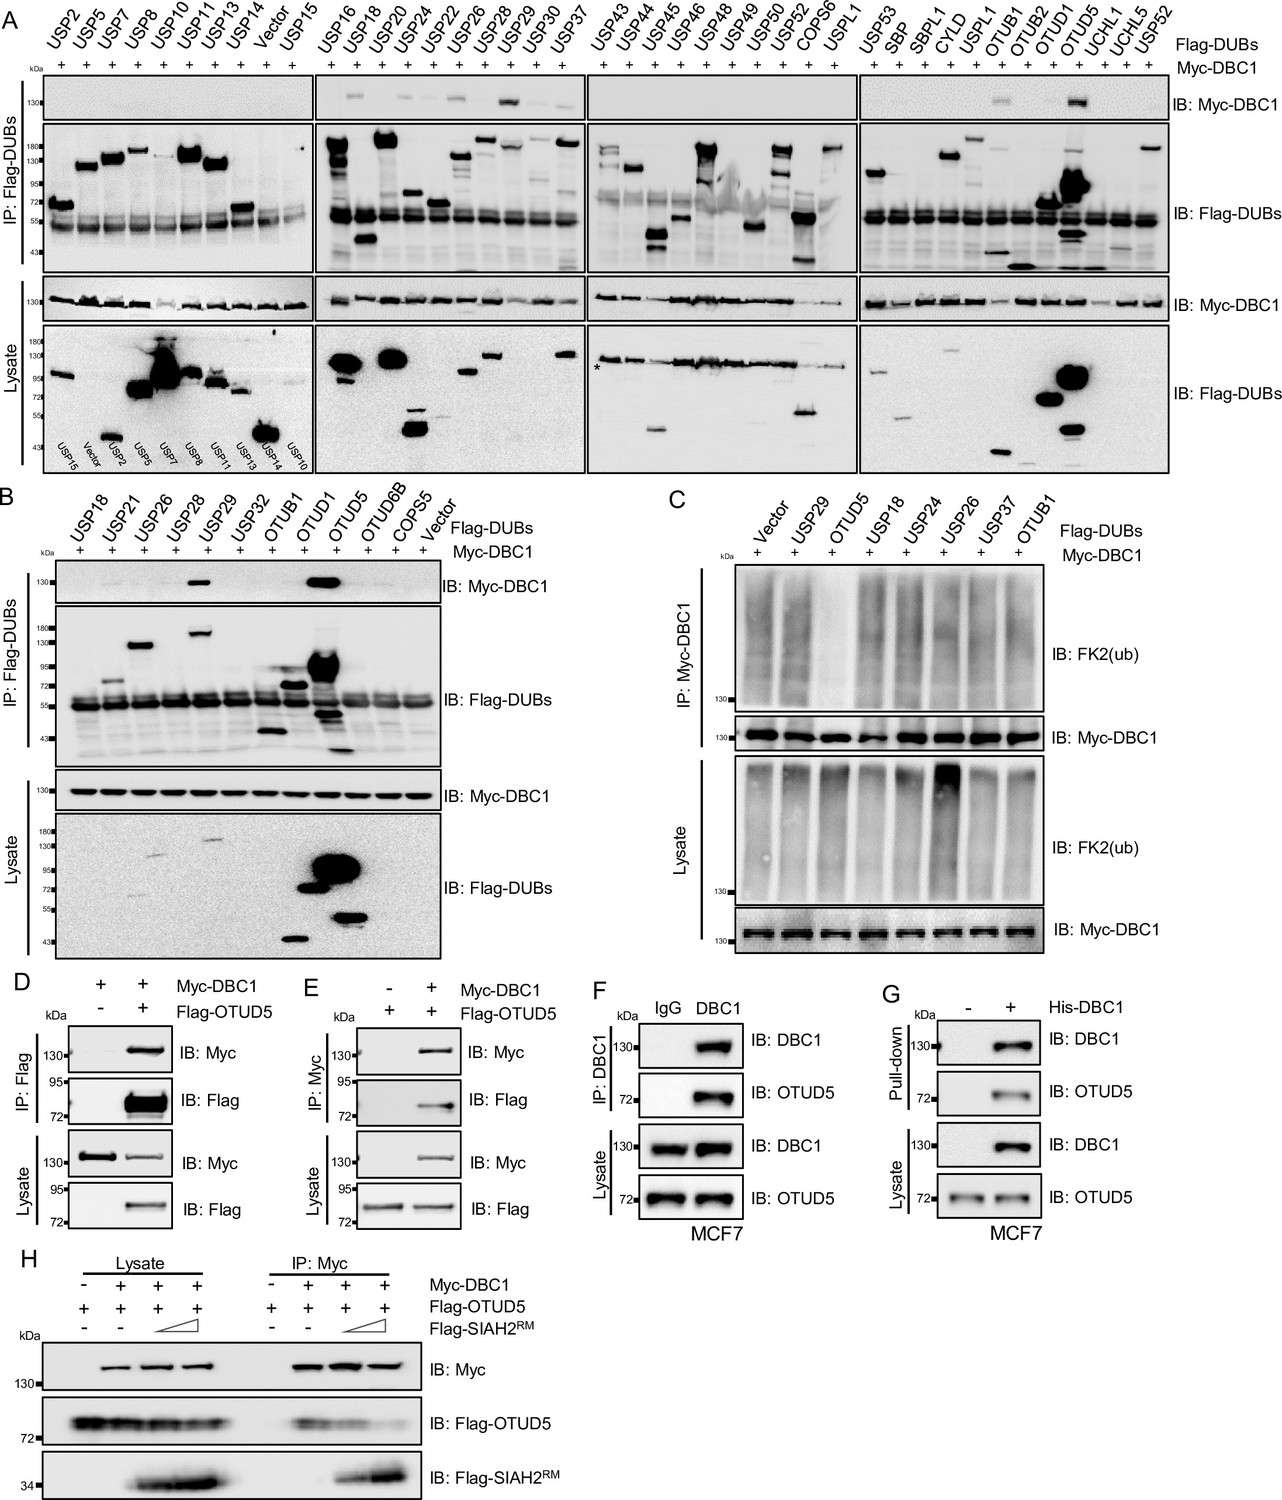
The stability of DBC1 was regulated by OTUD5.
(A) HEK293T cells were co-transfected with Myc-DBC1 and a series of Flag-Dubs, and immunoprecipitation was performed with an anti-Flag bead. Co-immunoprecipitated DBC1 was detected by Western blotting with an anti-Myc antibody. (B) HEK293T cells were co-transfected with Myc-DBC1 and several Flag-Dubs, and immunoprecipitation was performed with an anti-Flag antibody. Co-immunoprecipitated DBC1 was detected by Western blotting with anti-Myc antibody. (C) HEK293T cells were transfected with Myc-DBC1 and several Flag-Dubs, and cultured under hypoxia for 24 hr and then treated with MG132 (10 μM) for 6 hr. Cells were harvested, denatured, and lysed for immunoprecipitation with anti-Myc antibody. The ubiquitination level of DBC1 was assessed by immunoblotting with anti-Ub antibody (FK2). (D) HEK293T cells were transfected with Myc-DBC1 and Flag-OTUD5 for 24 hr. Cells were collected for immunoprecipitation with anti-Flag antibody. (E) HEK293T cells were transfected with Myc-DBC1 and Flag-OTUD5 for 24 hr. Cells were collected for immunoprecipitation with anti-Myc antibody. (F) MCF7 Cells were collected for immunoprecipitation with anti-DBC1 antibody, and co-immunoprecipitated endogenous OTUD5 was detected by Western blotting with an anti-OTUD5 antibody. (G) Purified His-tagged DBC1 proteins were used for His affinity isolation of endogenous OTUD5 of MCF7 cells and blotted with an anti-OTUD5 antibody. (H) HEK293T cells were co-transfected with Myc-DBC1, Flag-OTUD5, and Flag-SIAH2RM at the indicated dosages for 24 hr. Cells were collected for immunoprecipitation with anti-Myc antibody, and co-immunoprecipitated SIAH2 and OTUD5 were detected by Western blotting with an anti-Flag antibody.
-
Figure 4—figure supplement 1—source data 1
OTUD5 regualte the deubiquitination of DBC1.
- https://cdn.elifesciences.org/articles/81247/elife-81247-fig4-figsupp1-data1-v2.zip
Figure 5 with 1 supplement
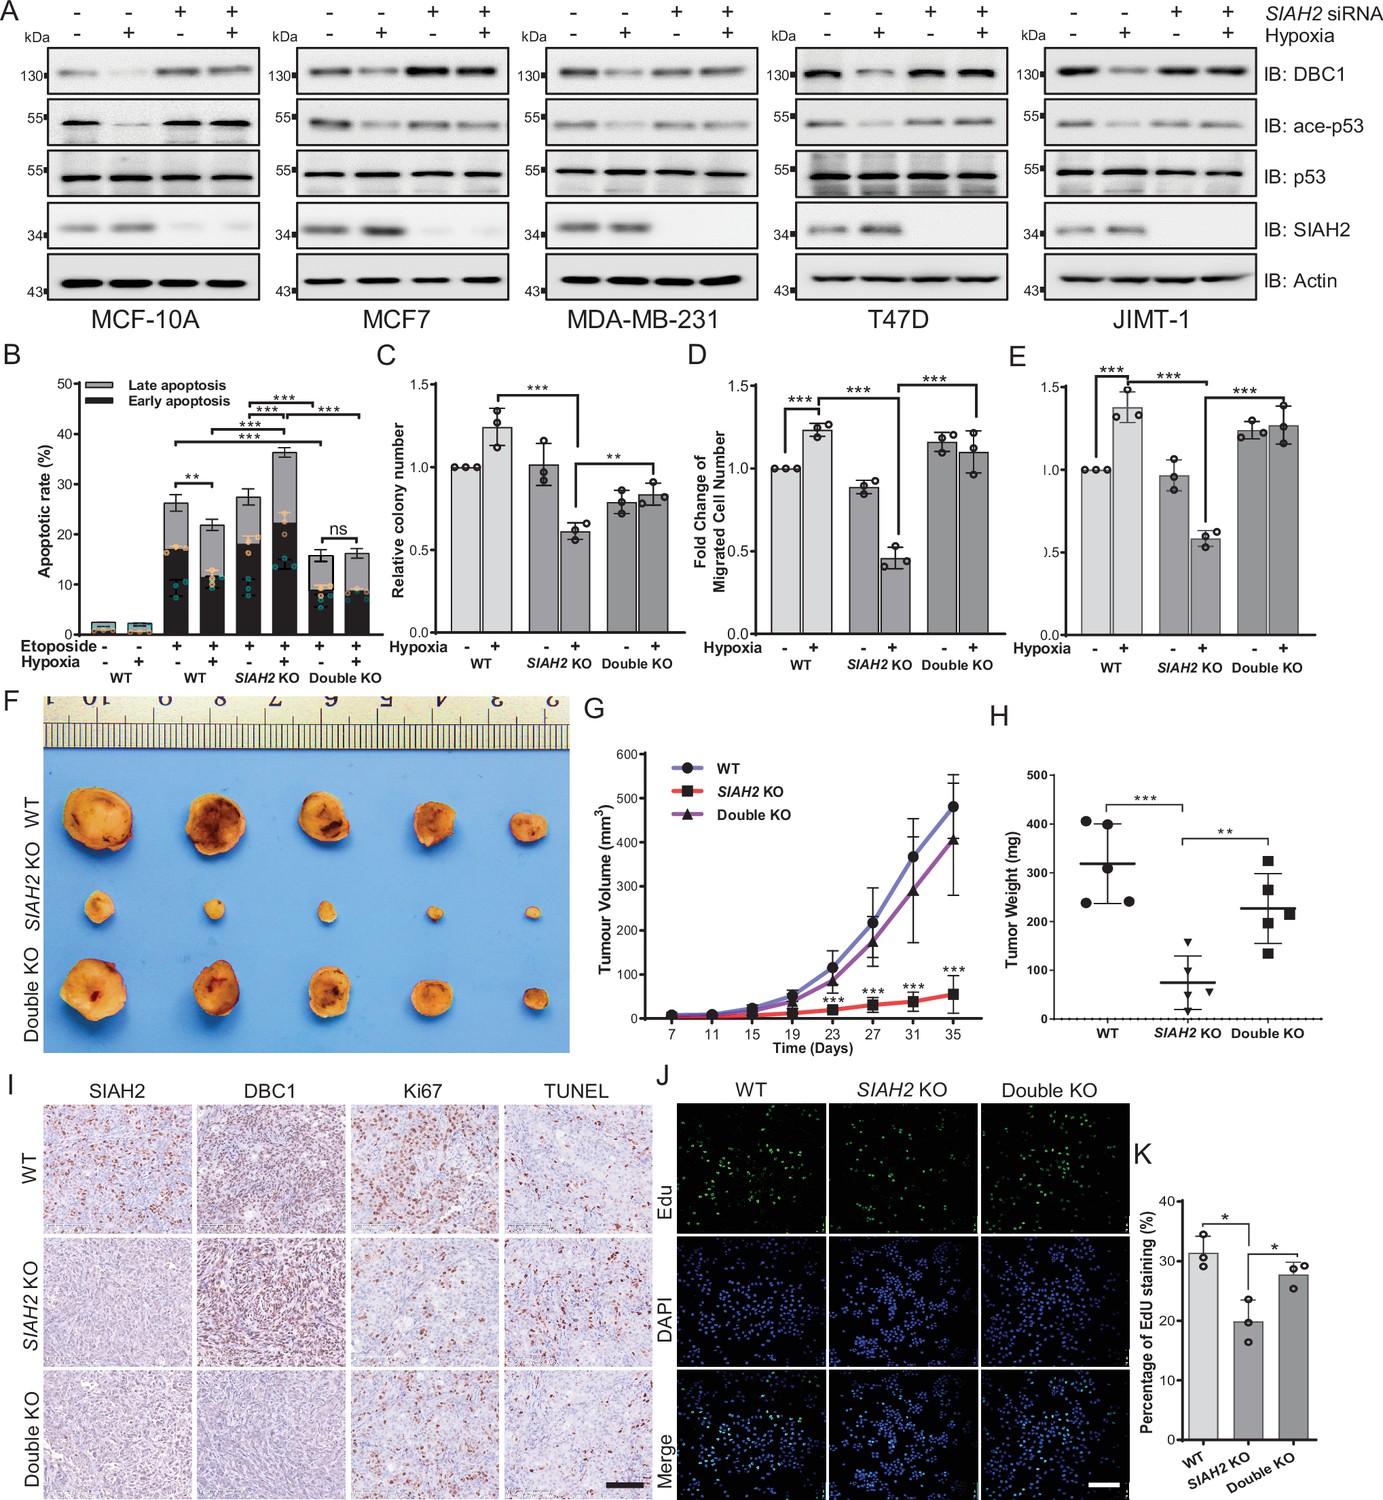
Hypoxia regulates tumor progression via the SIAH2-DBC1 axis.
(A) SIAH2 siRNA was transfected into indicated cell lines. The cells were cultured under normoxia or hypoxia for 24 hr and then cell lysates were analyzed by immunoblotting using the indicated antibodies. (B) Apoptosis assay analysis of wildtype, SIAH2 knockout, and SIAH2/CCAR2 double-knockout MDA-MB-231 cells under normoxia or hypoxia. (C) Colony formation analysis of wildtype, SIAH2 knockout, and SIAH2/CCAR2 double-knockout MDA-MB-231 cells under normoxia or hypoxia. Colony numbers were quantified. (D) Transwell analysis of wildtype, SIAH2 knockout, and SIAH2/CCAR2 double-knockout MDA-MB-231 cells under normoxia or hypoxia. (E) Scratching analysis of wildtype, SIAH2 knockout, and SIAH2/CCAR2 double-knockout MDA-MB-231 cells under normoxia or hypoxia. (F–H) Tumor images (F), tumor growth curves (G), and tumor weight (H) from mice subcutaneously injected with SIAH2 knockout or SIAH2/CCAR2 double-knockout MDA-MB-231 cells. (I) Immunohistochemical analysis of SIAH2 knockout and SIAH2/CCAR2 double-knockout xenograft tumor tissues with the indicated antibodies. Scale bars, 100 μm. (J) EdU proliferation analysis of different tumor cells isolated from SIAH2 knockout or SIAH2/CCAR2 double-knockout xenografts. Scale bars, 200 μm. (K) The percentage of EdU-positive cells from (J) was quantified. Data shown are representative of at least three independent experiments. Similar results were found in each experiment. All data are mean ± SEM; *p<0.05, **p<0.01, ***p<0.001. Statistical significance was analyzed by using the two-tailed unpaired Student’s t-test.
-
Figure 5—source data 1
Source data of Hypoxia regulates tumor progression via the SIAH2-DBC1 axis.
- https://cdn.elifesciences.org/articles/81247/elife-81247-fig5-data1-v2.zip
Figure 5—figure supplement 1
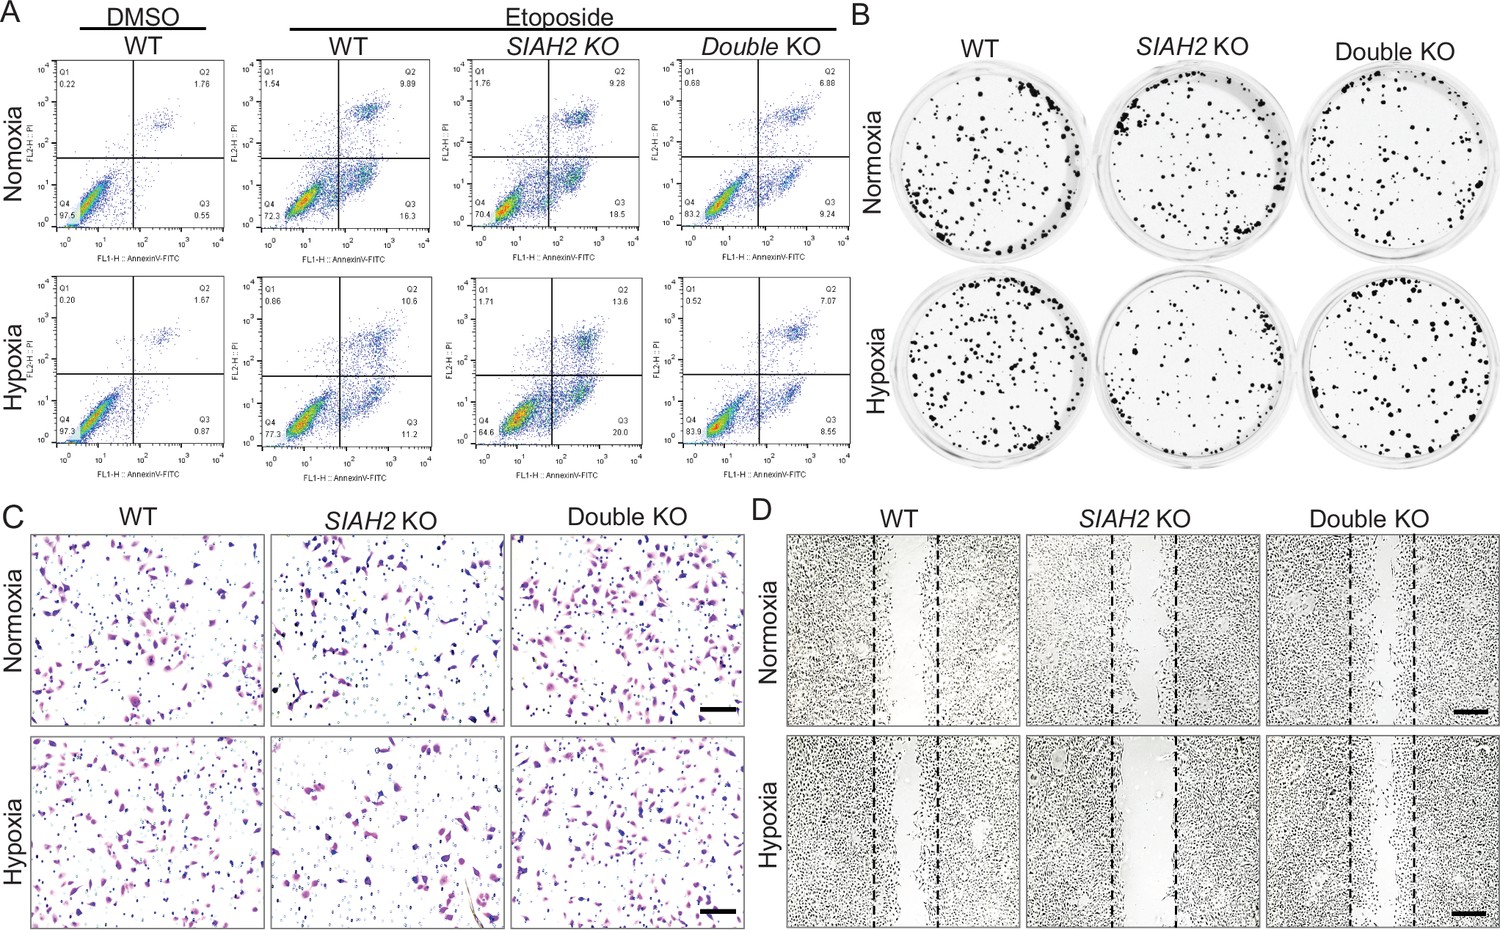
Hypoxia regulates DBC1 stability to affect tumor progression.
(A) Apoptosis assay analysis of wildtype, SIAH2 knockout, and SIAH2/CCAR2 double-knockout MDA-MB-231 cells under normoxia or hypoxia. (B) Colony formation analysis of wildtype, SIAH2 knockout, and SIAH2/CCAR2 double-knockout MDA-MB-231 cells under normoxia or hypoxia. (C) Transwell analysis of wildtype, SIAH2 knockout, and SIAH2/CCAR2 double-knockout MDA-MB-231 cells under normoxia or hypoxia. (D) Scratching analysis of wildtype, SIAH2 knockout, and SIAH2/CCAR2 double-knockout MDA-MB-231 cells under normoxia or hypoxia.
Figure 6 with 1 supplement
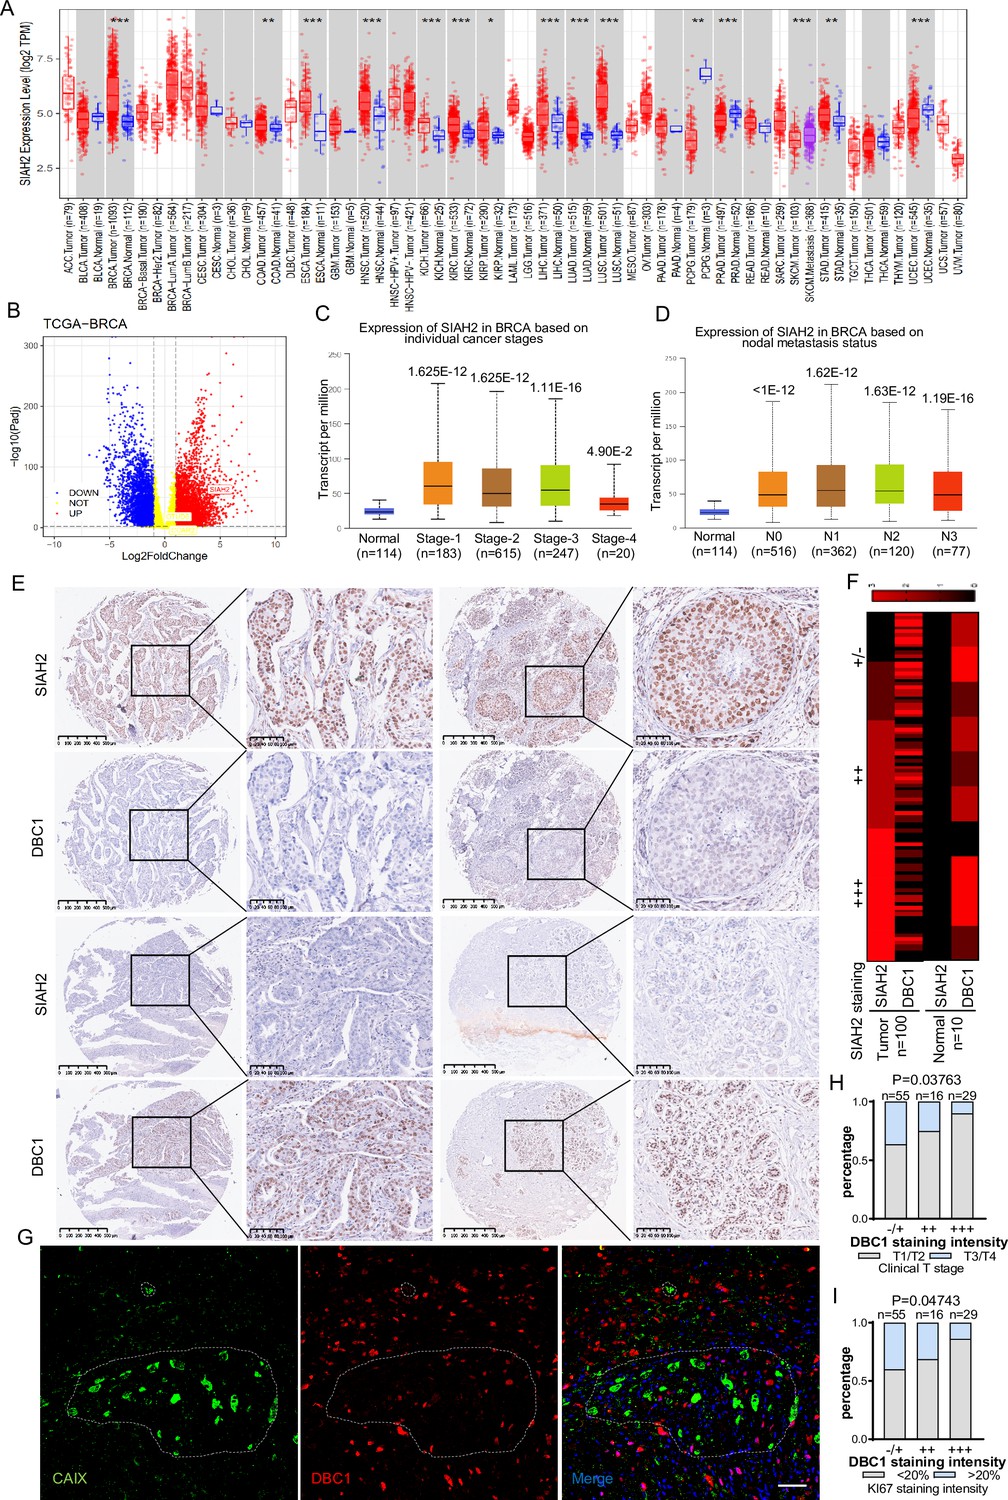
Correlation of SIAH2 and DBC1 expression with tumor progression in BRCA.
(A) SIAH2 expression level in different human cancers from TCGA data in TIMER. *p<0.05, **p<0.01, ***p<0.001. (B) Volcano plot analysis of SIAH2 DBC1 and OTUD5 expression levels in breast cancer. (C) Relative expression level of SIAH2 in tumor stage (stages 1, 2, 3, 4, or 5) from BRCA patients. (D) Relative expression level of SIAH2 in nodal metastasis status (normal, N0, or N1) from BRCA patients. (E) Immunohistochemistry staining analysis of the expression levels of SIAH2 and DBC1 in a series of breast cancer patient tissue microarrays. Scale bars, (left) 200 μm; (right) 100 μm. (F) Heatmap of the expression levels of SIAH2 and DBC1 in human normal breast tissues and breast tumor tissues. (G) Human breast cancer tissues were stained with DAPI (blue) together with anti-CAIX (green) and anti-DBC1 (red) antibodies. Scale bars, 50 μm. (H) Statistical analysis of correlations between DBC1 expression level and clinical T stage. (I) Statistical analysis of correlations between DBC1 expression level and Ki67-positive stage.
Figure 6—figure supplement 1
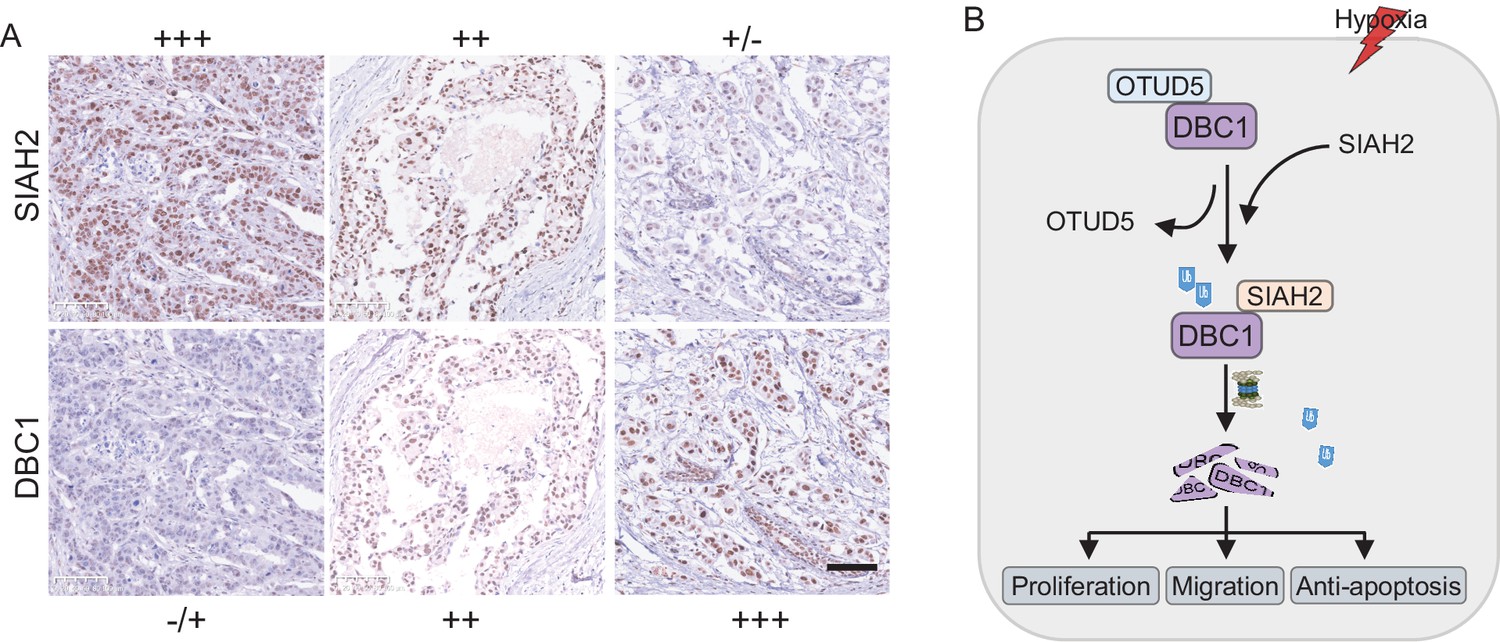
The expression levels of SIAH2 and DBC1 were negative correlation in BRCA.
(A) Expression levels of SIAH2 in breast cancer tissues were classified into three grades (negative, +, ++, or +++) according to the percentage of immunopositive cells and immunostaining intensity. scale bars, 100 μm. (B) The proposed mechanism by which hypoxia regulates tumor progression through the SIAH2-DBC1 pathway. Under normoxic conditions, the deubiquitinase OTUD5 contacts DBC1 to form a complex. In response to hypoxia, the E3 ubiquitin ligase SIAH2 competitively binds and ubiquitinates DBC1, while OTUD5 is separated from DBC1, resulting in the degradation of DBC1 through the ubiquitin–proteasome system. In the hypoxic microenvironment of the tumor, SIAH2-mediated DBC1 degradation promotes cell migration and proliferation.
Author response image 1
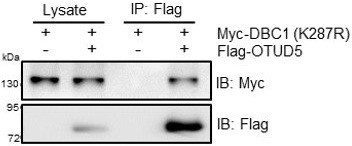
HEK293T cells were transfected with Myc-DBC1 (K287R) mutant and Flag-OTUD5 for 24 h.Cells were collected for immunoprecipitation with anti-Flag antibody.
Additional files
-
MDAR checklist
- https://cdn.elifesciences.org/articles/81247/elife-81247-mdarchecklist1-v2.docx
-
Supplementary file 1
Identification of DBC1 as a SIAH2-associated protein.
List of representative proteins identified by SIAH2 Co-IP/MS and the number of peptides for each protein-identified peptide are indicated.
- https://cdn.elifesciences.org/articles/81247/elife-81247-supp1-v2.docx
-
Supplementary file 2
Patient characteristics based on DBC1 expression.
The relationship between the clinicopathological characteristics of breast cancer patients and the expression level of DBC1.
- https://cdn.elifesciences.org/articles/81247/elife-81247-supp2-v2.docx
Download links
A two-part list of links to download the article, or parts of the article, in various formats.
Downloads (link to download the article as PDF)
Open citations (links to open the citations from this article in various online reference manager services)
Cite this article (links to download the citations from this article in formats compatible with various reference manager tools)
Hypoxia-induced proteasomal degradation of DBC1 by SIAH2 in breast cancer progression
eLife 11:e81247.
https://doi.org/10.7554/eLife.81247


