Rapid reconstruction of neural circuits using tissue expansion and light sheet microscopy
- Janelia Research Campus, Howard Hughes Medical Institute, United States
- MIT McGovern Institute for Brain Research, United States
- Departments of Chemistry and Biological Sciences, University of Illinois Chicago, United States
- ETH Zurich, Switzerland
- Howard Hughes Medical Institute, United States
- Queensland Brain Institute, The University of Queensland, Australia
Figures
Figure 1
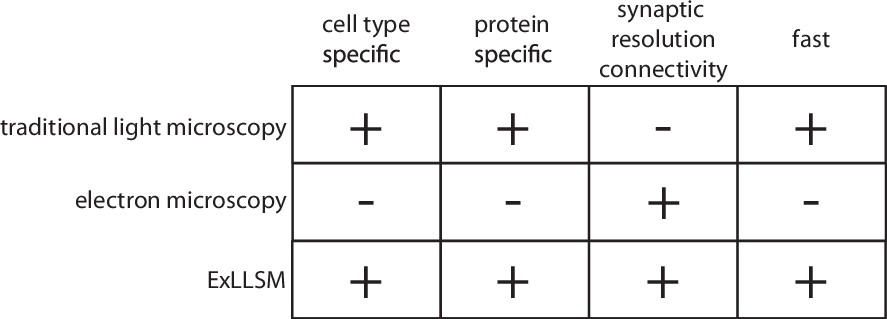
Features of traditional light microscopy, electron microscopy, and expansion microscopy and lattice light sheet imaging (ExLLSM).
ExLLSM combines the synaptic resolution connectivity of electron microscopy with the cell-type specificity, protein specificity, and speed of light microscopy to allow the structural connectivity between targeted neurons to be quantified across many individual animals.
Figure 2 with 3 supplements
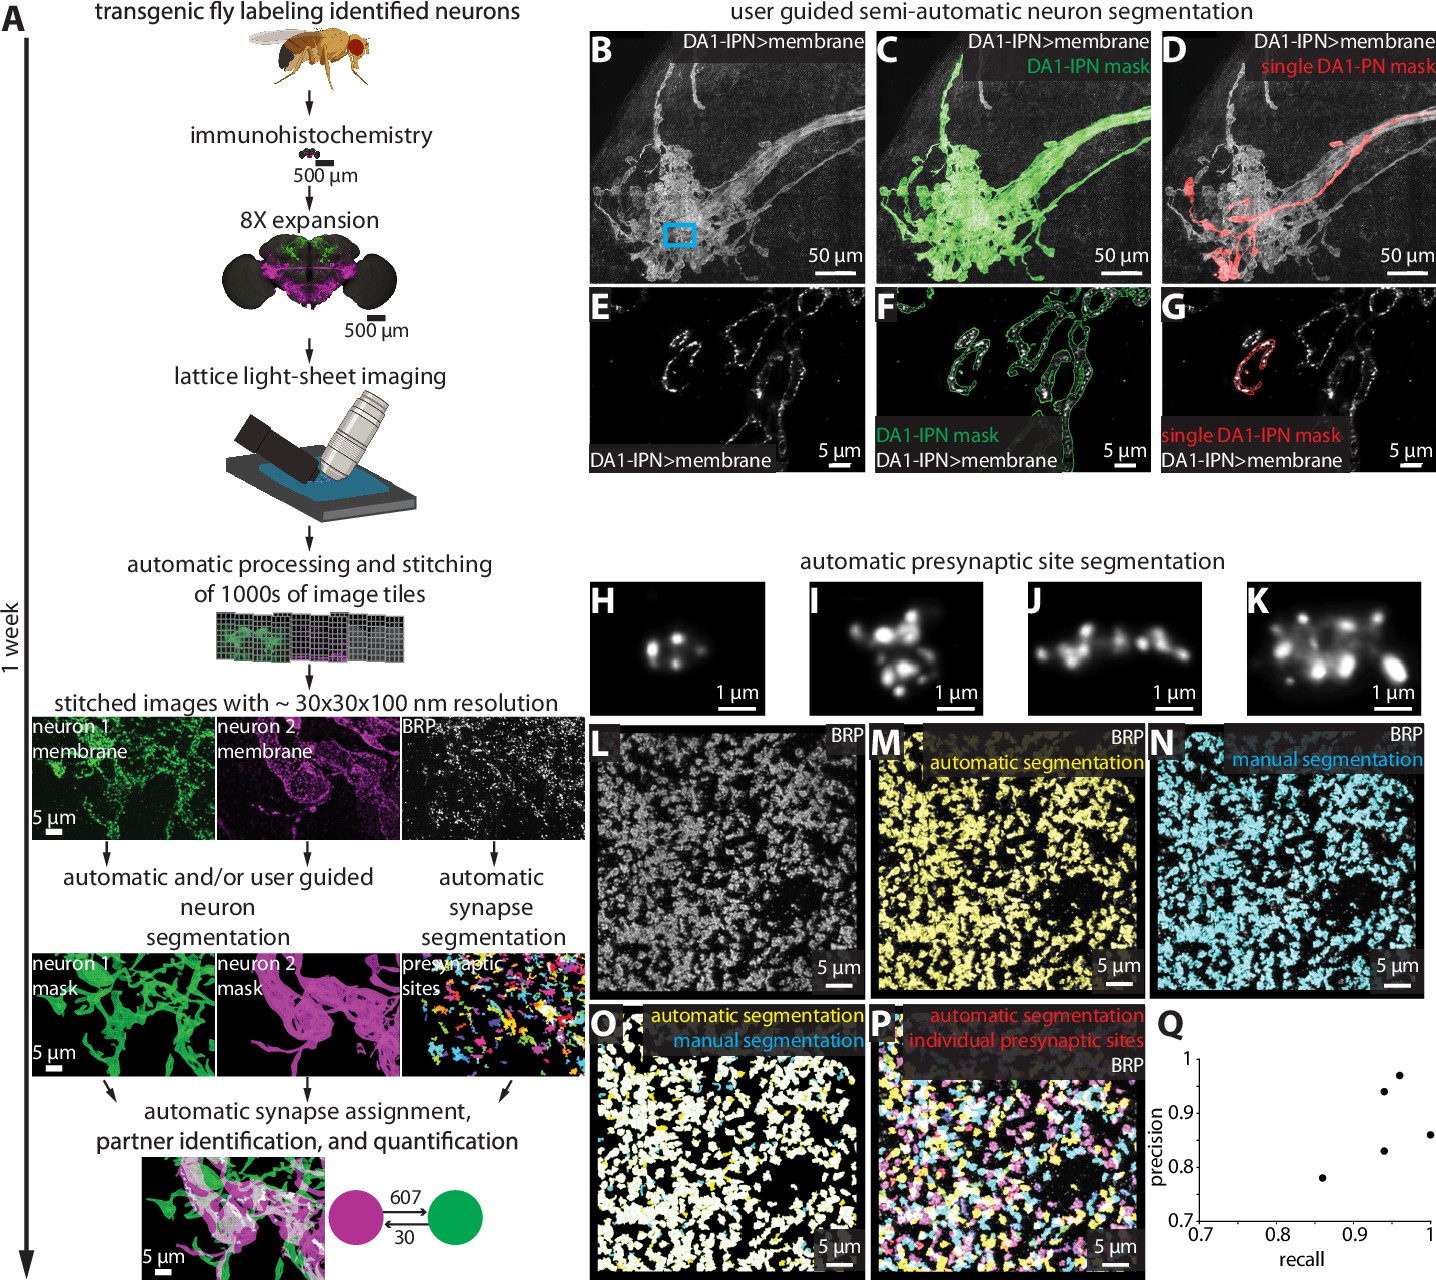
Largely automated ExLLSM image processing and analysis pipeline.
(A) Overview. (B–G) Semiautomatic neuron segmentation. DA1-IPN neuron cluster (B, white) in the lateral horn with neuron masks generated by semiautomatic segmentation of the entire cluster (green, C) and manual segmentation of a single neuron (red, D). (E–G) Single z-slice of boxed region in (B) showing a cross section of presynaptic boutons. (H–Q) Automatic presynaptic site segmentation. (H–K) Examples of individual presynaptic site morphologies at 8× as visualized by labeling BRP. Crop from the optic lobe showing the BRP label (white, L) with automatically (yellow, M) and manually (ground truth, cyan, N) segmented presynaptic sites. (O) Overlay of automatic presynaptic site segmentation results (yellow) and ground truth data (cyan). (P) Overlay of BRP (white) and automatically segmented individual presynaptic sites (multicolor). (Q) Precision-recall plot of automatic presynaptic site segmentation. Results from four different brain regions of five independent samples.
Figure 2—figure supplement 1
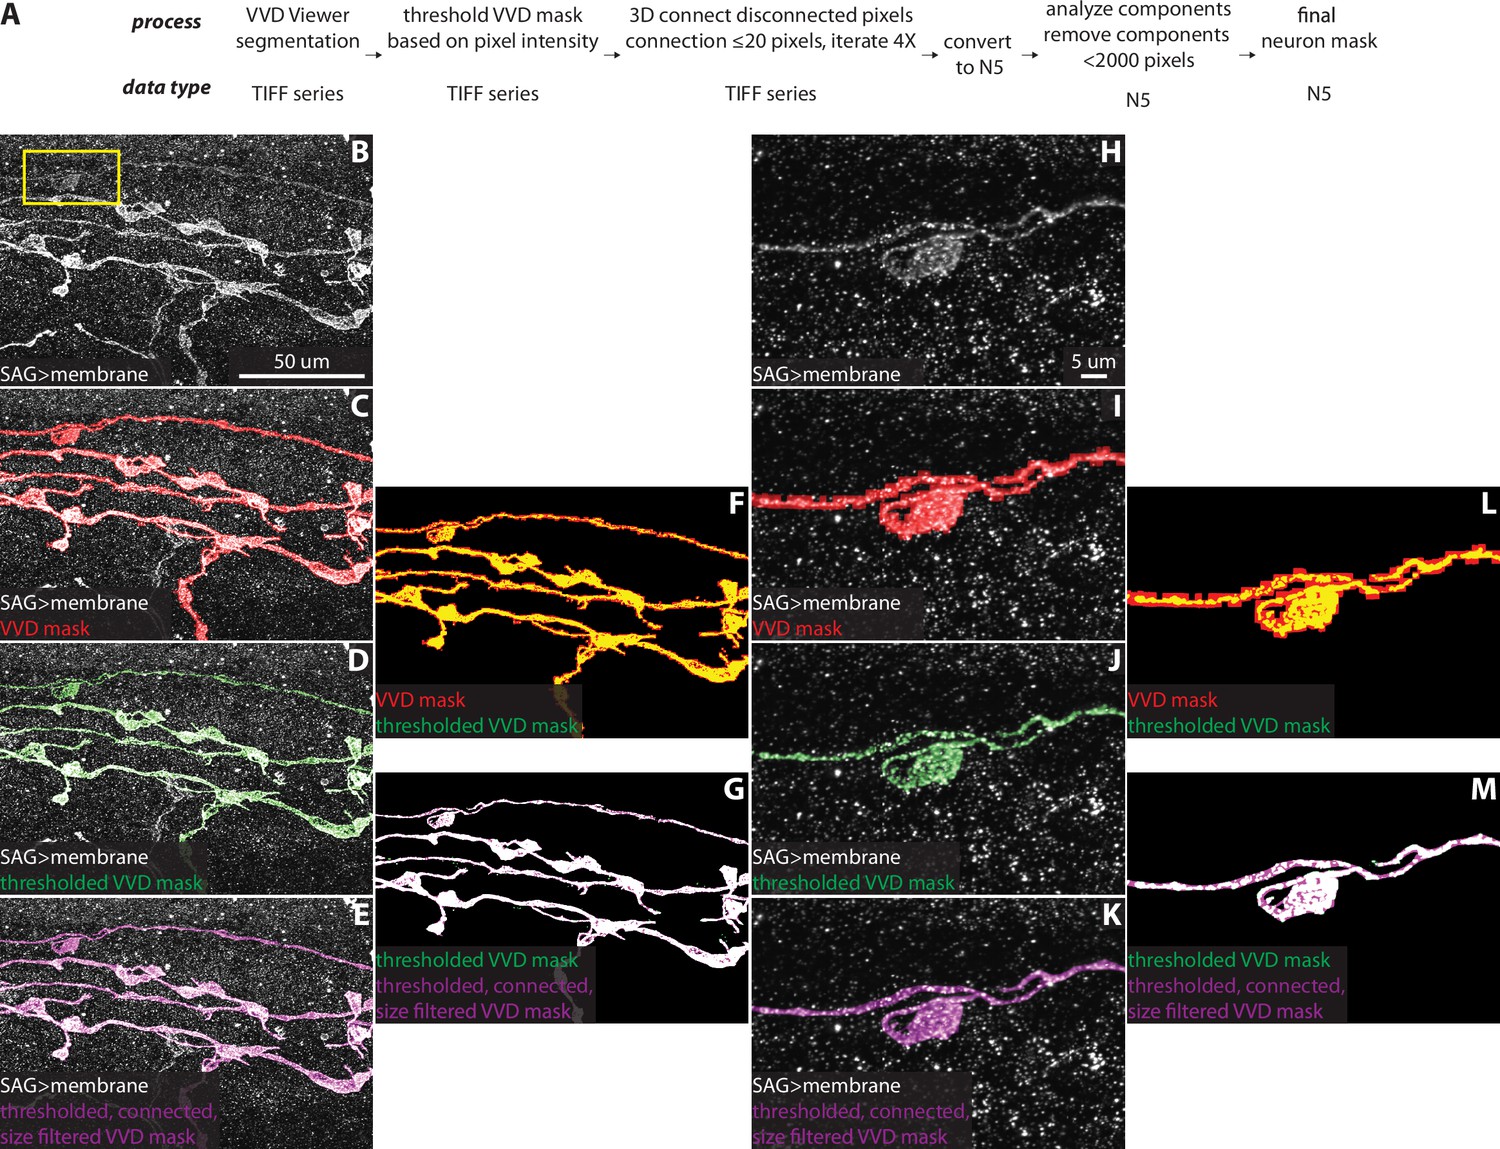
VVD Viewer semiautomatic neuron segmentation and post-VVD mask processing.
(A) Overview of VVD Viewer segmentation and automated mask processing pipeline. (B) A portion of an SAG neuron and off-target neuron in the region. (C) SAG neuron with VVD mask overlaid. (D) SAG neuron with the VVD mask after thresholding overlaid. (E) SAG neuron with the thresholded VVD mask after 3D gap filling and filtering to remove all objects smaller than 2000 pixels overlaid. (F) Overlay of VVD mask and VVD mask after thresholding. (G) Overlay of thresholded VVD mask and thresholded VVD mask after 3D gap filling and size filtering. (H–M) Zoom of region in the yellow rectanglein (B) corresponding to panels (B–G), respectively.
Figure 2—figure supplement 2
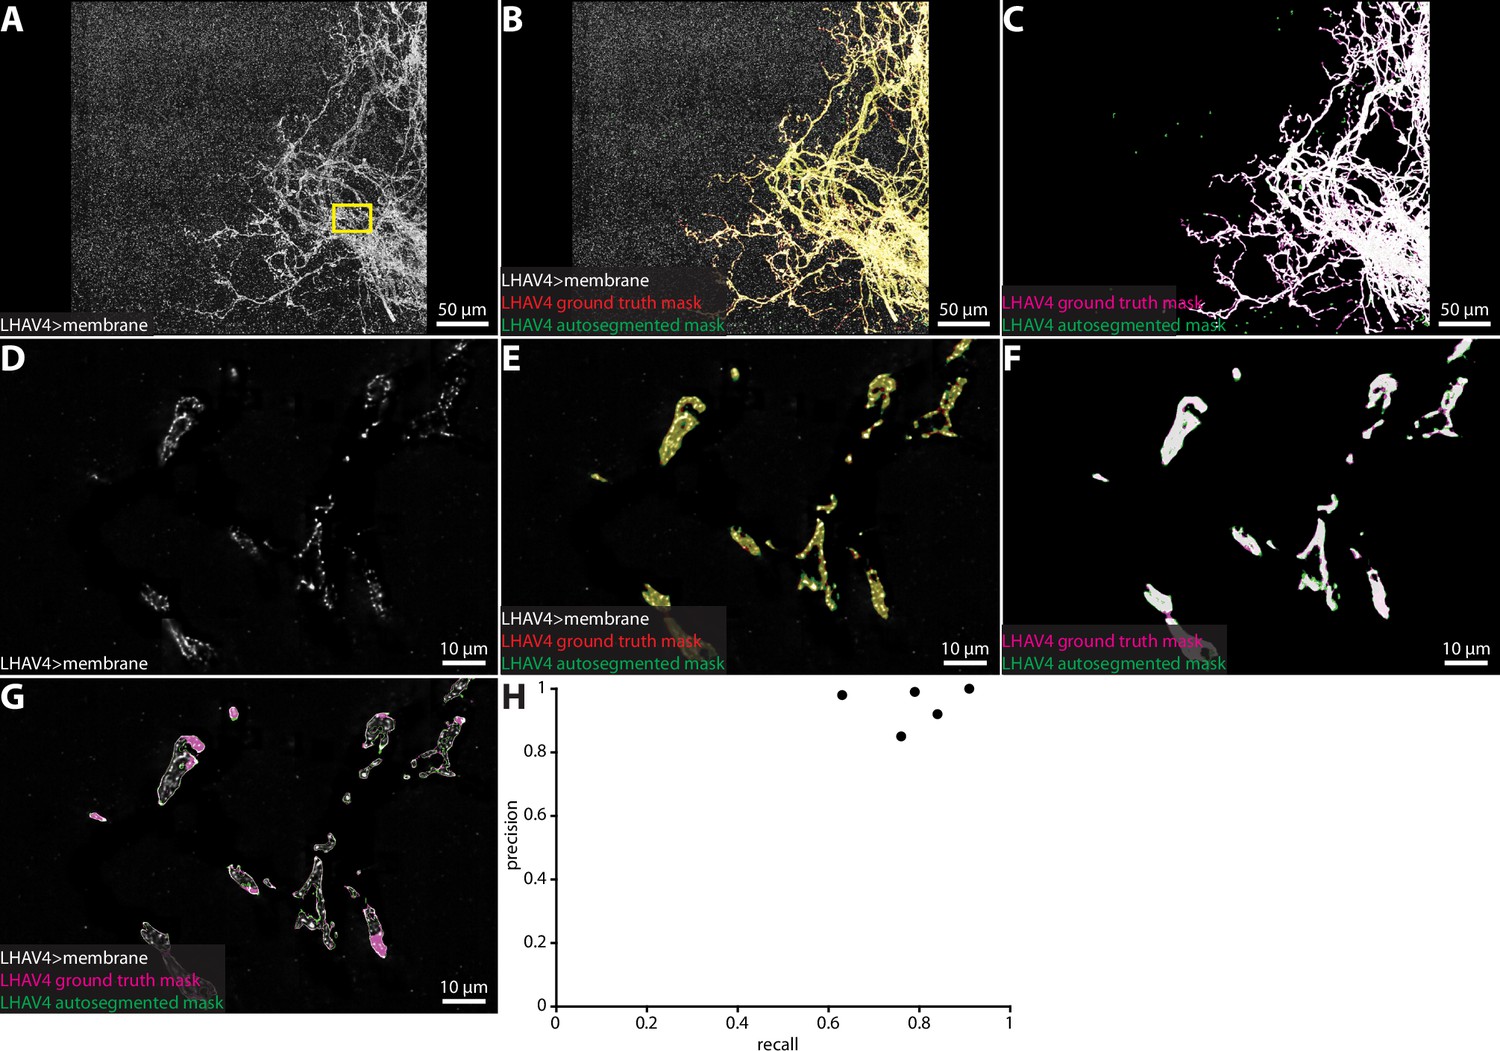
Automatic neuron segmentation.
Representative example of a group of neurons automatically segmented via a trained U-Net model. A subvolume of a group of lateral horn neurons (A, LHAV4) were segmented via the semiautomatic VVD Viewer segmentation workflow (LHAV4 ground truth mask) and via the U-Net automatic segmentation workflow (LHAV4 autosegmented mask) (B, C). (D–G) A single z-slice from the region in the yellow rectangle in (A) corresponding to panels (A-C), respectively. (G) Overlay of LHAV4 neurons and neuron mask outlines. (H) Precision and recall plot of automatic neuron segmentation in five independent samples.
Figure 2—figure supplement 3
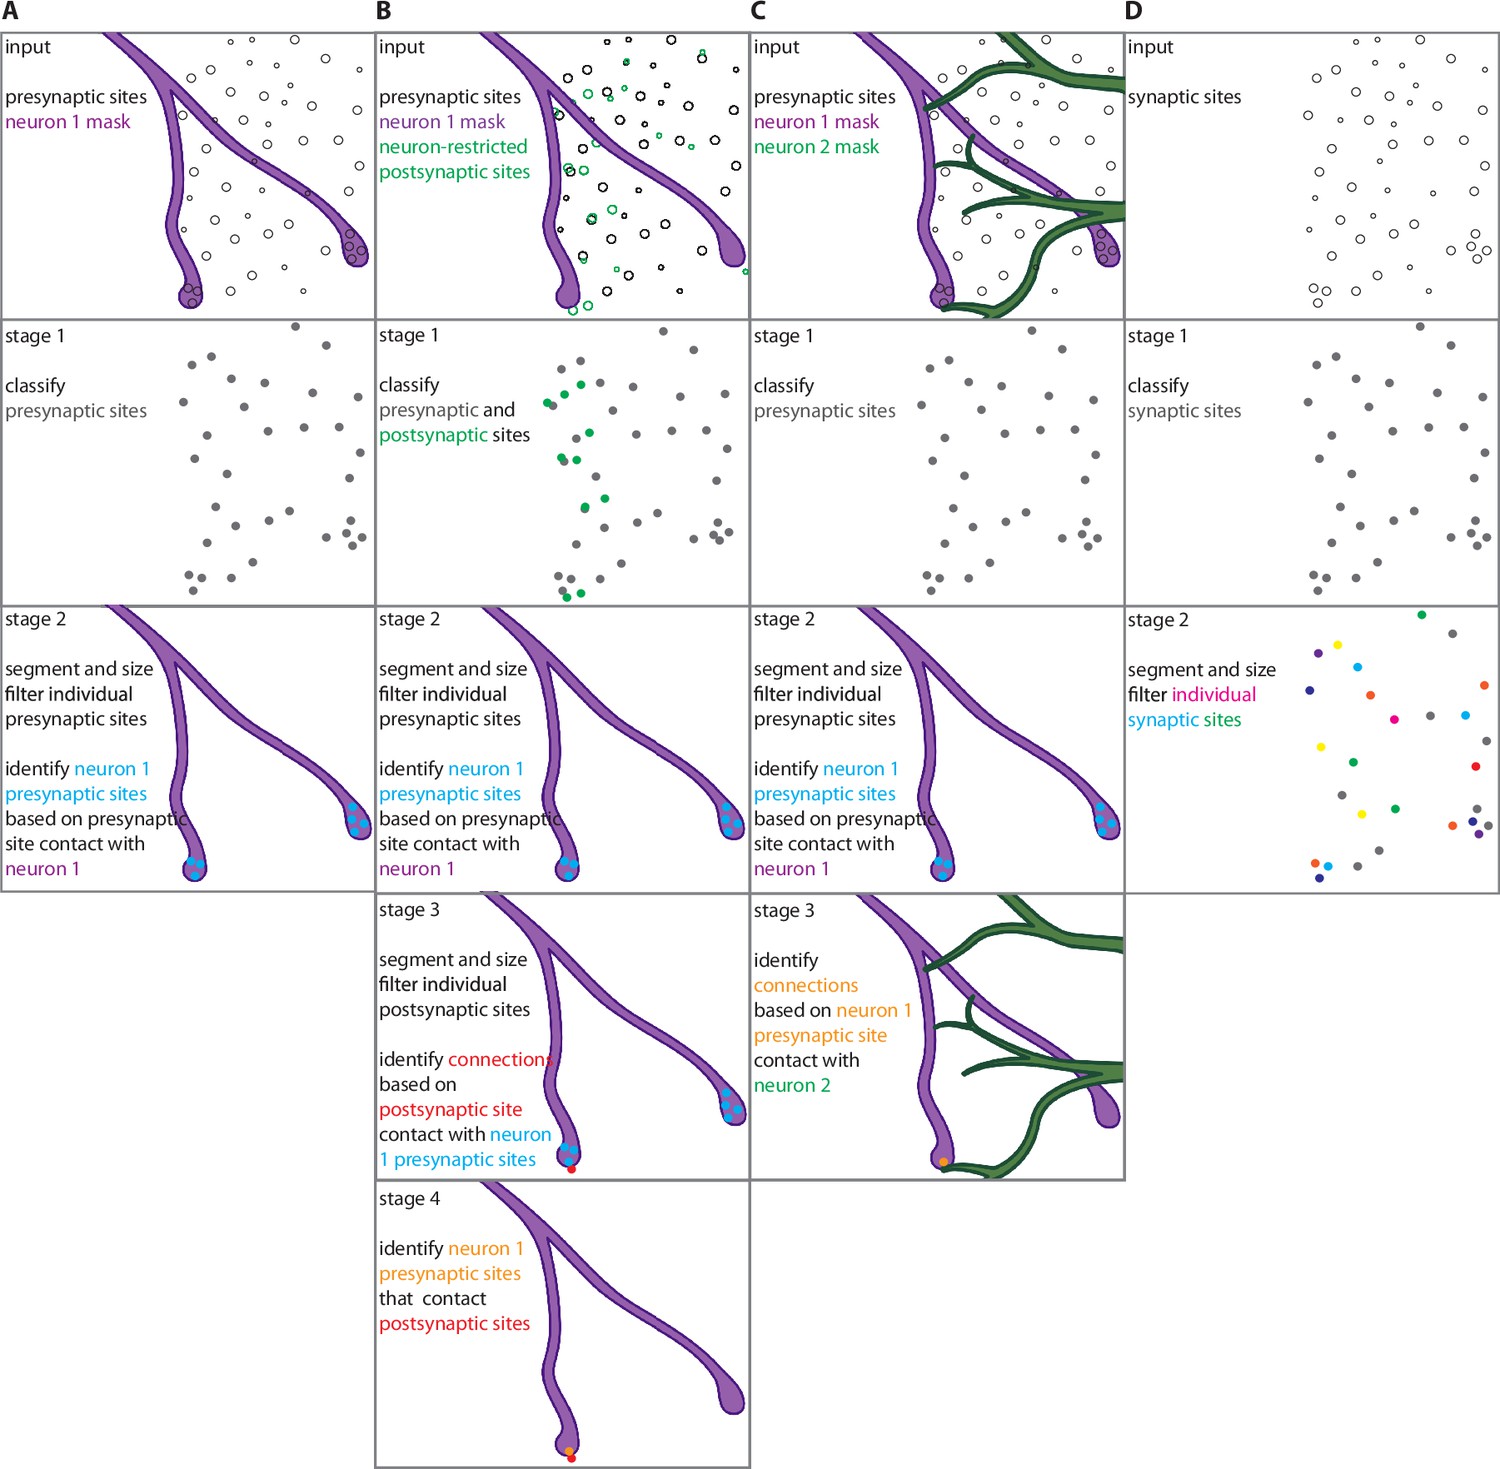
Workflows for automatic synaptic site detection, assignment, and partner identification.
(A) Quantifying presynaptic sites in neuron 1 (e.g., Figure 3). (B) Quantifying presynaptic sites in neuron 1 and connections from neuron 1 to neuron 2 if presynaptic sites are labeled ubiquitously and postsynaptic sites are labeled specifically in neuron 2 (e.g., Figure 4B–F). (C) Quantifying presynaptic sites in neuron 1 and connections from neuron 1 to neuron 2 based on presynaptic site colocalization with the postsynaptic neuron (e.g., Figure 4I–O, Figure 6). (D) Quantifying all pre- or postsynaptic sites in a given volume. (A–D) Stage 1 runs the trained U-Net model on synaptic sites (pre and/or post). (A–C) Stage 2 identifies individual presynaptic sites by running Watershed segmentation on the presynaptic site results from stage 1 and applying a size filter to remove objects below a defined threshold, and assigns the presynaptic sites to neuron 1 based on a defined colocalization threshold with the neuron 1 mask. (D) Stage 2 identifies individual synaptic sites by running Watershed segmentation on the synaptic site results from stage 1 and applying a size filter to remove objects below a defined threshold. (B) Stage 3 identifies individual postsynaptic sites by running a Watershed segmentation on the postsynaptic site results from stage 1 and applying a size filter to remove objects below a defined threshold. Synaptic connections are identified based on a defined colocalization threshold between the postsynaptic sites and the neuron 1 presynaptic sites identified in stage 2. (C) Stage 3 identifies synaptic connections based on neuron 1 presynaptic sites identified in stage 2 that colocalize with the neuron 2 mask. (B) Stage 4 identifies the neuron 1 presynaptic sites that contact the postsynaptic sites that make connections identified in stage 3.
Figure 3
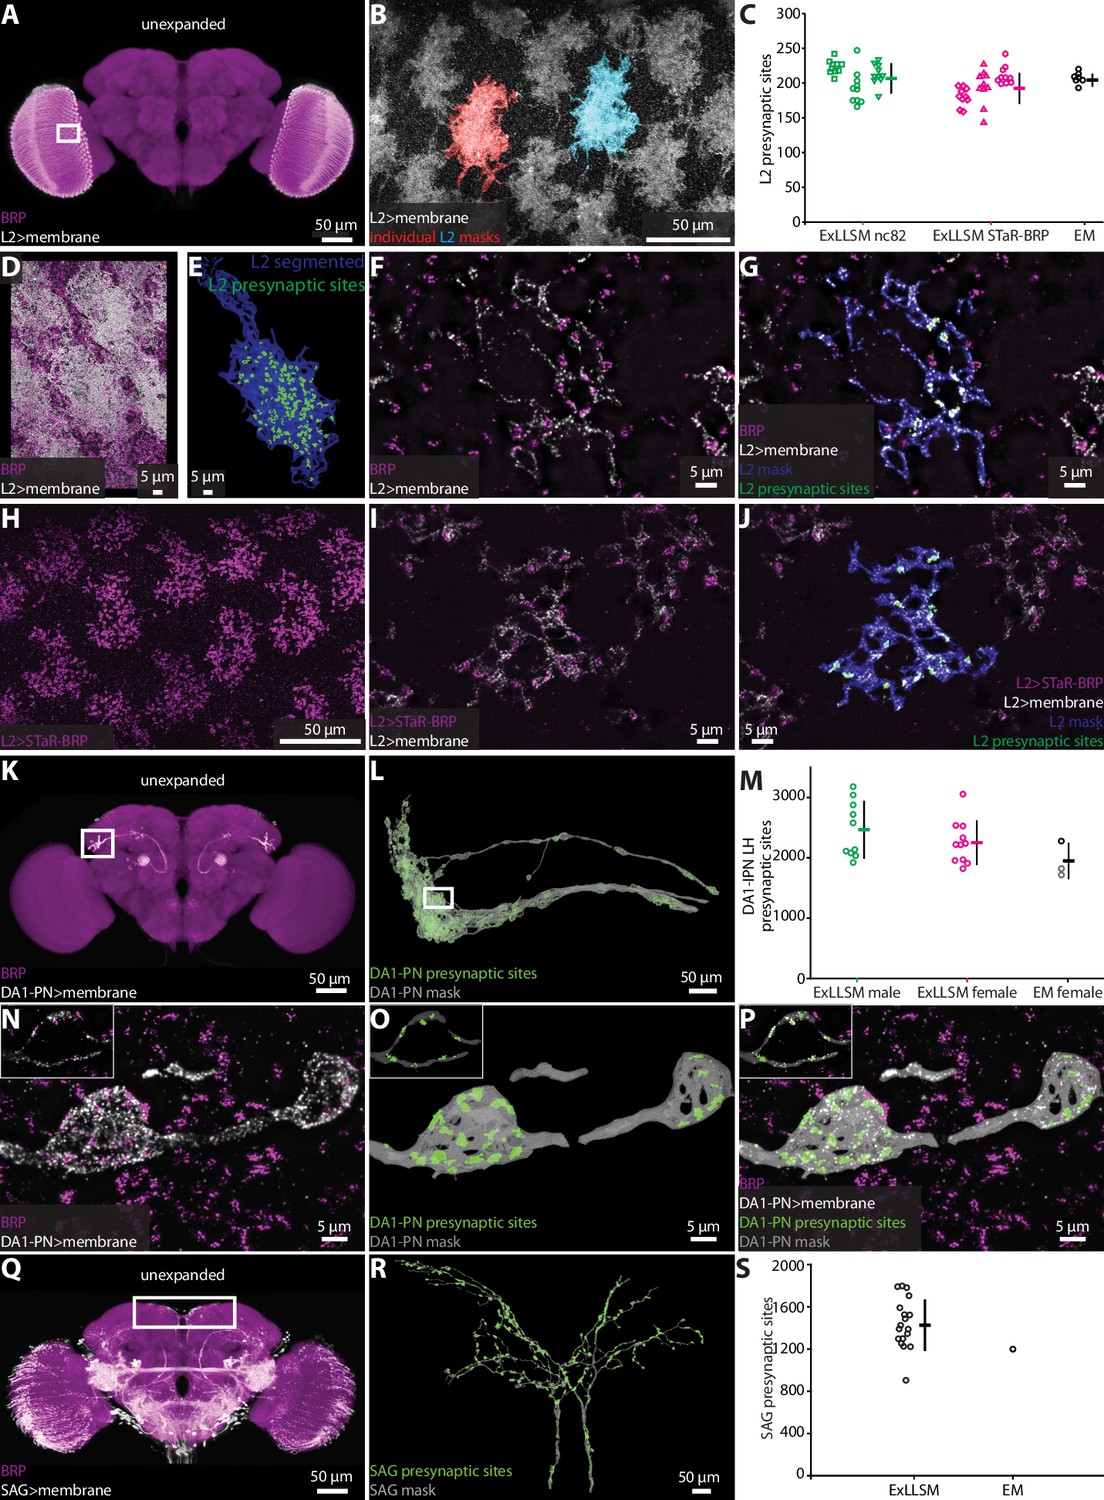
Automatic presynaptic site classification and neuron assignment.
(A, B, D–G) Representative examples of quantifying presynaptic sites in L2 neurons via ubiquitous BRP labeling. (A) Unexpanded female brain with BRP (magenta) and the membrane of L2 neurons (white) labeled. (B) Representative 8× view of L2 neurons from rectangle region in (A), with two individual L2 neurons segmented. (C) Quantification of L2 presynaptic sites detected by ExLLSM using either ubiquitous (nc82) or restricted (STaR-BRP) labeling (n = 10 neurons, in each of the three samples for both) and by the presence of T-bars in EM (n = 7 neurons in adjacent columns). (D) Group of L2 neurons and BRP. (E) Mask of single segmented L2 neuron from (D) with automatically identified L2 presynaptic sites. (F) Zoom in on five z-slices from (D) with analyses overlaid (G). (H–J) Representative example of quantifying presynaptic sites in L2 via STaR-BRP labeling. (G) STaR-BRP expression in a group of L2 neurons. BRP is only labeled in L2 neurons. (I) Zoom in on five z-slices from (H) with individual L2 mask and automatically identified L2 presynaptic sites overlaid (J). (K, L, N–P) Representative example of quantifying presynaptic sites in DA1-IPN neurons via ubiquitous BRP labeling by the nc82 antibody. (K) Unexpanded female brain with BRP and the membrane of DA1-IPN neurons labeled. (L) 8× view of segmented DA1-IPN neurons in the lateral horn, approximately from rectangle region in (K) with automatically detected DA1-IPN presynaptic sites labeled. (M) Quantification of DA1-IPN lateral horn presynaptic sites. Neuron cluster grouped across 11 female and 10 male ExLLSM samples, and 2 electron microscopy (EM) samples (FIB-SEM in black, left and right TEM in gray). (N) Zoom in on raw signal of two DA1-IPN presynaptic boutons from rectangle region in (L). Inset shows a single z-slice. (O) Analyzed data from (N). (P) Overlay of raw data from (N) and analyzed data from (O). (Q, R) Representative example of quantifying presynaptic sites in SAG neurons via ubiquitous BRP labeling by the nc82 antibody. (Q) Unexpanded female brain with BRP and the membrane of SAG (and off-target) neurons labeled. (R) 8× view of segmented SAG neurons from rectangle region in (Q) with automatically detected SAG presynaptic sites labeled. (S) Quantification of SAG presynaptic sites in 18 ExLLSM samples and 1 FIB-SEM sample. (C, M, S) Individual samples and mean ± SD are plotted.
Figure 4
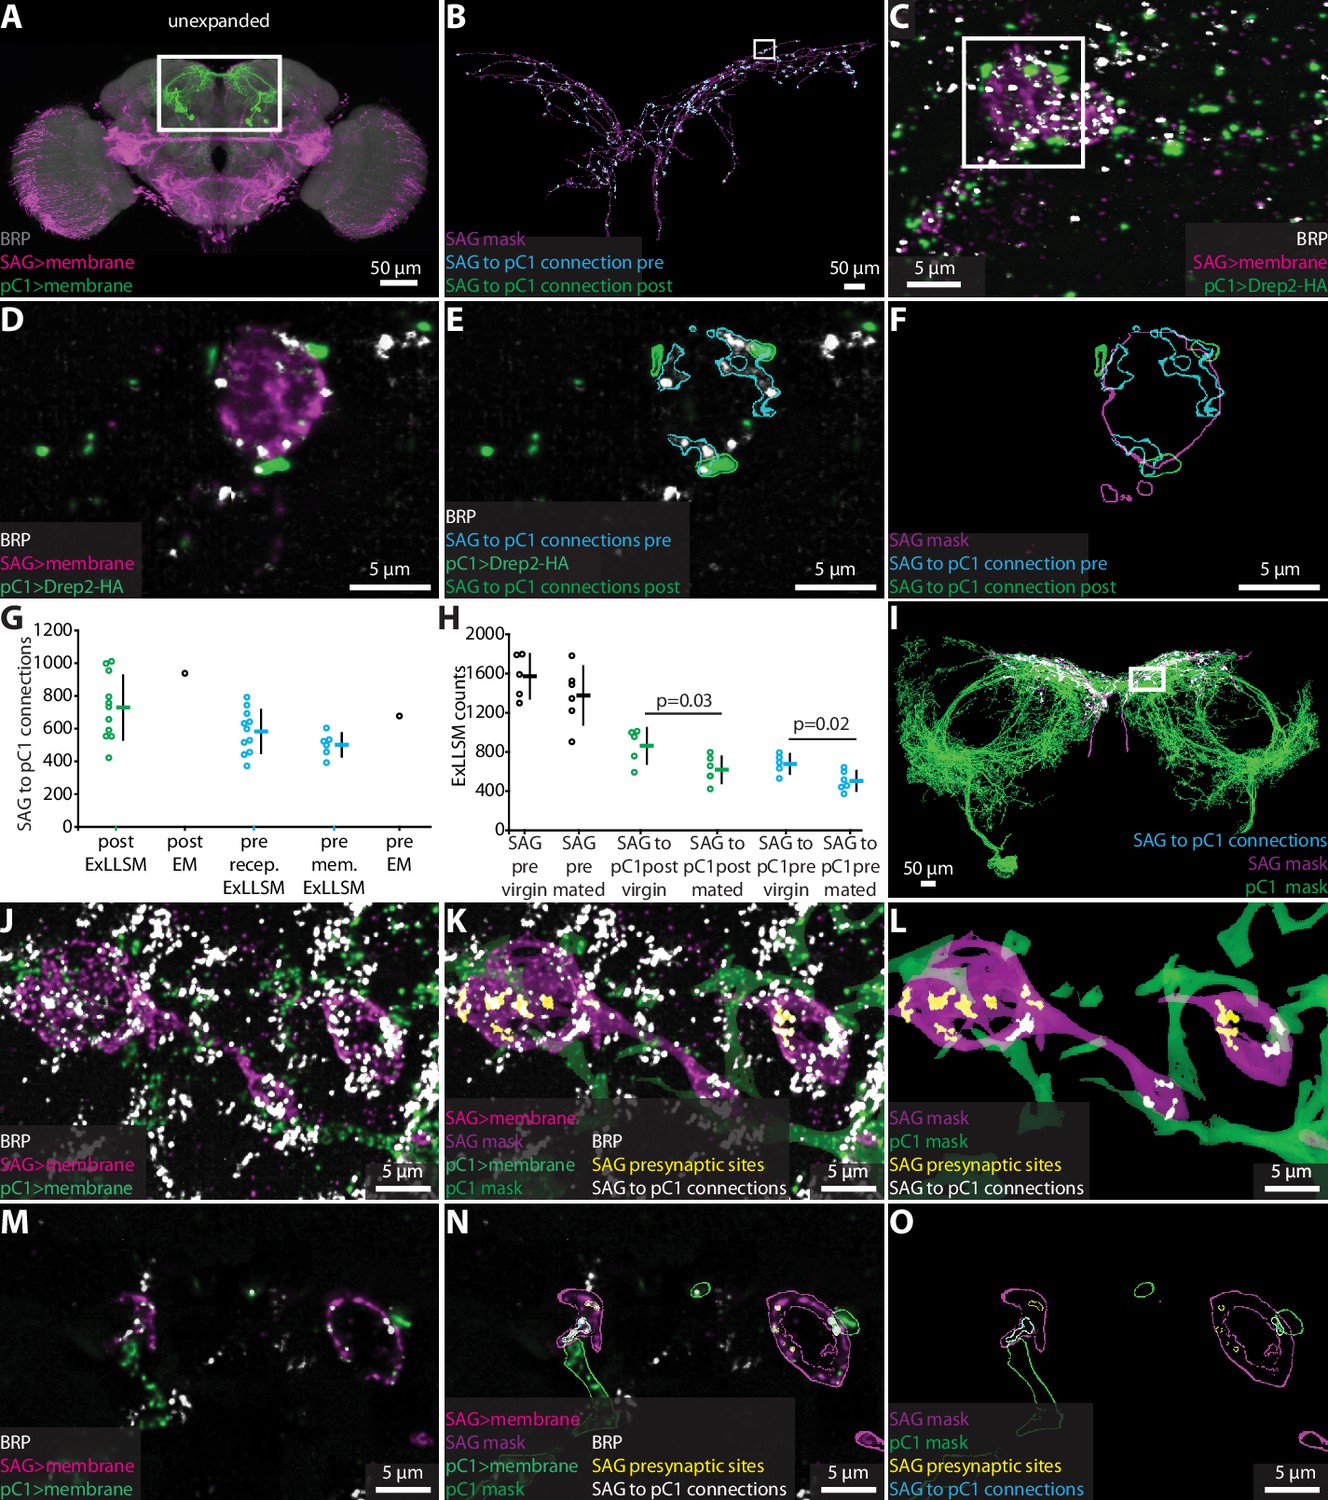
Quantifying connectivity using ExLLSM.
(A) Unexpanded female brain with SAG (and off-target) neurons (magenta), pC1 (green) neurons, and BRP presynaptic sites (nc82, gray) labeled. (B–F) Representative examples of quantifying connectivity via pC1 postsynaptic site contact with SAG presynaptic sites. (B) Segmented SAG mask and the automatically detected pre- (cyan) and postsynaptic sites (green) of SAG to pC1 connections. (C) Max intensity projection of 200 z-slices from region approximately in the rectangle in (B). (D–F) Single z-slice of region in the rectangle from (C). (G) Quantification of SAG to pC1 connections. SAG to pC1 connections as quantified by the number of pC1 postsynaptic sites that contact SAG presynaptic sites in 11 ExLLSM samples (post ExLLSM) and the number of pC1 postsynaptic sites that connect to SAG presynaptic sites in one electron microscopy (EM) sample (connections, post EM). SAG presynaptic sites that make connections to pC1 as quantified by the number of SAG presynaptic sites that contact pC1 postsynaptic sites in 11 ExLLSM samples (pre recep. ExLLSM), number of SAG presynaptic sites that contact the pC1 membrane in six ExLLSM samples (pre mem. ExLLSM), and number of SAG presynaptic sites that make connections to pC1 postsynaptic sites in one EM sample (pre EM). (H) Quantification of SAG presynaptic sites and SAG to pC1 connections in virgin and mated female ExLLSM samples. Number of SAG presynaptic sites in five virgin samples (SAG pre virgin) and six mated samples (SAG pre mated). SAG to pC1 connections as quantified by the number of pC1 postsynaptic sites that contact SAG presynaptic sites in five virgin samples (SAG to pC1 post virgin) and in six mated samples (SAG to pC1 post mated). SAG presynaptic sites that make connections to pC1 as quantified by the number of SAG presynaptic sites that contact pC1 postsynaptic sites in five virgin samples (SAG to pC1 pre virgin) and six mated samples (SAG to pC1 pre mated). Virgin pre- and postsynaptic ExLLSM counts are significantly different from mated pre- and postsynaptic ExLLSM counts (t-tests). Individuals and mean ± SD plotted in (G, H). (I–O) Quantifying connectivity via pC1 membrane contact with SAG presynaptic sites. (I) Segmented masks of SAG and pC1 and SAG to pC1 connections approximately in rectangle in (A). (J–L) 100 z-slices of region approximately in the rectangle in (I). (M–O) Single z-slice of data from (J–L). Mask outlines shown.
Figure 5
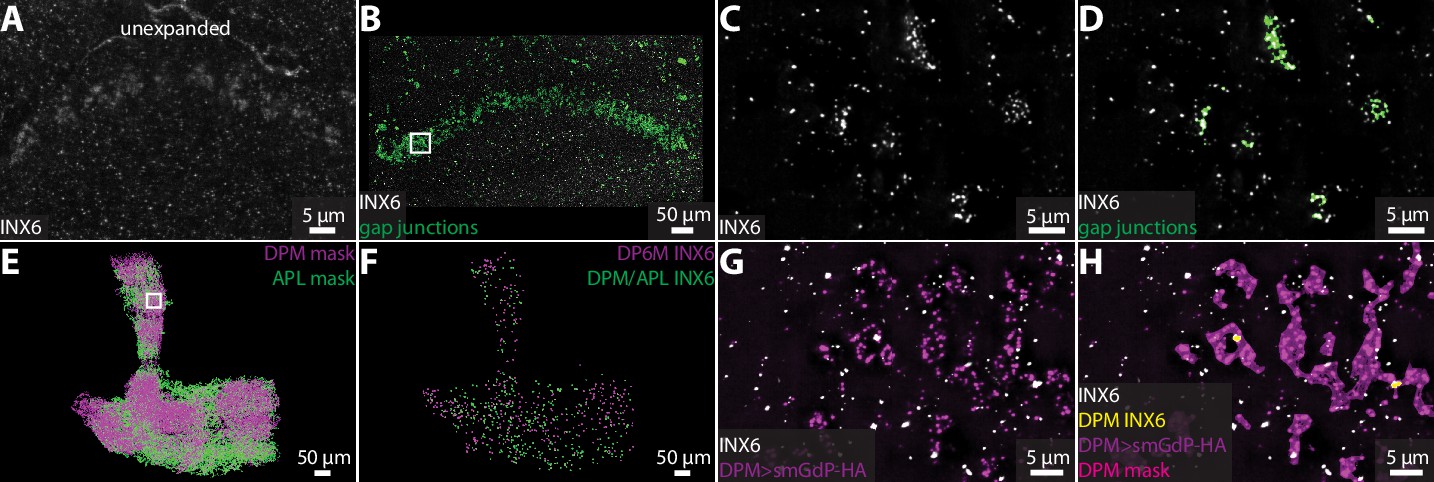
Visualizing gap junction proteins with ExLLSM.
INX6 immunoreactivity in the fan-shaped body in the unexpanded (A) and expanded (B) brain. (B) INX6 and automatically detected putative gap junctions (green). (C–, D) Zoom in on region in rectangle in (B). (E) Segmented DPM and APL neuron masks. (F) Automatically detected possible DPM and APL gap junction sites. (G, H) Zoom in on region in rectangle from (E) with INX6 (white), the DPM membrane (purple), DPM mask (magenta), and possible DPM gap junction sites (yellow).
Figure 6 with 1 supplement
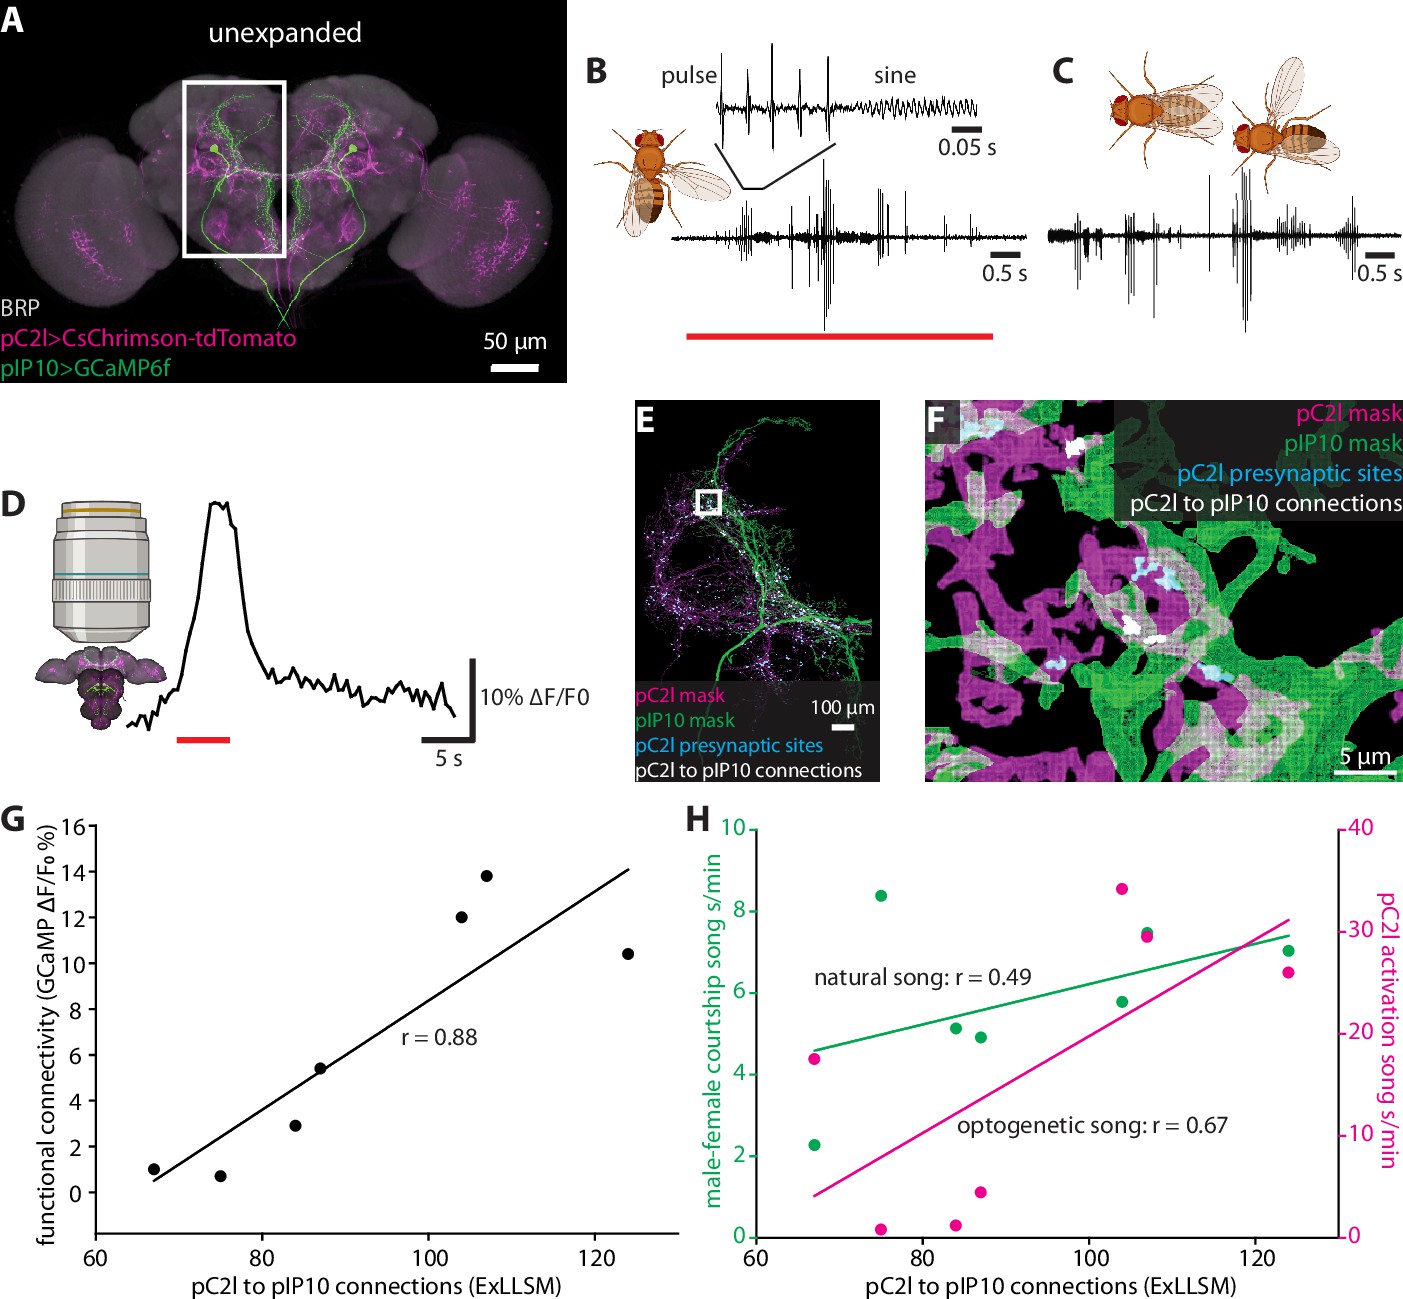
Correlating individual variability in structural connectivity, functional connectivity, and behavior.
(A) Unexpanded brain of a male fly with presynaptic sites (BRP, gray), GCaMP6f (green) in pIP10, and CsChrimson (magenta) in pC2l(and off-target neurons) labeled (B) Representative example of optogenetic activation of pC2l (red bar), resulting in the acute production of pulse and sine song. (C) Representative example of song produced by the male during a courtship bout with a female. (D) Representative example of a GCaMP6f response (black trace) in pIP10 induced by optogenetic activation of pC2l (red bar). (E) Representative 8× view of a segmented pC2l, segmented pIP10, pC2l presynaptic sites, and the pC2l to pIP10 connections as measured by pIP10 contact with pC2l presynaptic sites. (F) Zoom in on region in the rectangle from (E). (G, H) ExLLSM connections plotted against (G) the strength of the functional connection between pC2l and pIP10 (as in D), and (H) song seconds/minute elicited by optogenetic pC2l activation (magenta, as in B) and by a female fly (green, as in C). Linear regression and associated Pearson’s correlation coefficient (r) plotted for each relationship.
Figure 6—figure supplement 1
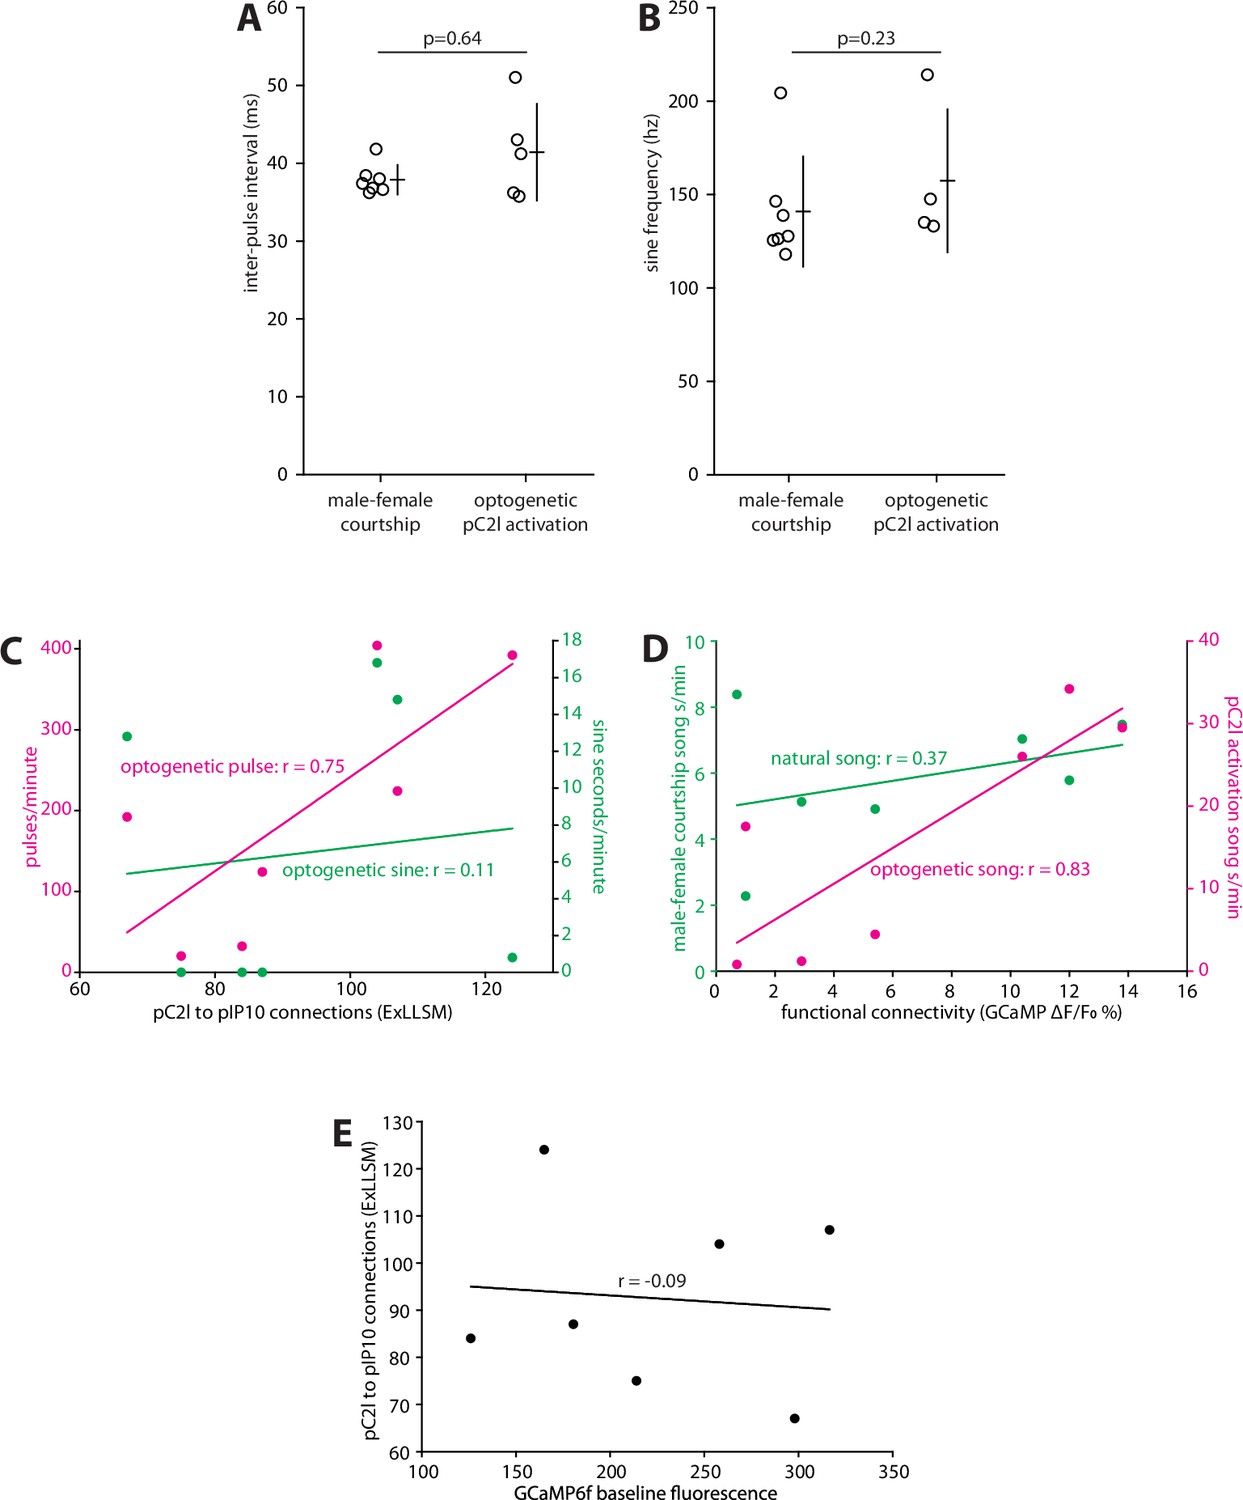
Quantification of courtship song features, correlating individual variability in optogenetically induced pulse and sine song with structural connectivity, correlating individual variability in song with functional connectivity, and correlating individual variability in GCaMP fluorescence with structural connectivity.
(A) Inter-pulse interval of pulse trains produced during male–female courtship and during optogenetic pC2l activation (t-test, two-tailed p=0.64). For optogenetic pC2l activation, two flies produced isolated pulses without forming pulse trains. (B) Sine song frequency produced during male–female courtship and during optogenetic pC2l activation (t-test, two-tailed p=0.23). For optogenetic pC2l activation, three flies produced no sine song. (A, B) Individual animals and mean ± SD shown. (C) ExLLSM connections plotted against pulses/minute (magenta; extrapolated from 5 s of pC2l activation) and the sine seconds/minute (green; extrapolated from 5 s of pC2l activation) as in Figure 5B and H. (D) Functional pC2l>pIP10 connectivity plotted against song seconds/minute produced during optogenetic pC2l activation (magenta; extrapolated from 5 s of pC2l activation) as in Figure 5B and H and the song seconds/minute produced during a 10 min pairing with a female fly (green) as in Figure 6C and H. (E) Baseline GCaMP6f fluorescence (measured using identical parameters in each fly) plotted against the number of ExLLSM connections. (C–E) Linear regression and associated Pearson’s correlation coefficient (r) values plotted for each relationship.
Videos
Video 1
Example of presynaptic site morphologies and distribution in the optic lobe medulla at 8× as visualized by labeling BRP and automatically segmenting individual presynaptic sites (multicolor).
Video 2
Representative example of automatic presynaptic site identification in a single L2 neuron.
L2 neurons were labeled by a membrane reporter. A single L2 was semiautomatically segmented and an L2 mask was generated. Presynaptic sites labeled by BRP were automatically classified and assigned to L2.
Video 3
Representative example of identifying SAG to pC1 connections via pC1 postsynaptic site contact with SAG presynaptic sites.
SAG was labeled by a membrane reporter. SAG was semiautomatically segmented, and an SAG mask was generated. Presynaptic sites labeled by BRP were automatically classified and assigned to SAG. pC1 postsynaptic sites labeled by Drep2-HA specifically in pC1 were automatically classified. Connections between pC1 postsynaptic sites and SAG presynaptic sites were automatically identified.
Video 4
Representative example of identifying SAG to pC1 connections via the SAG presynaptic site contact with the pC1 membrane.
SAG and pC1 were labeled by membrane reporters. SAG and pC1 were semiautomatically segmented, and neuron masks were generated. Presynaptic sites labeled by BRP were automatically classified and assigned to SAG. Connections between SAG presynaptic sites and the pC1 neuron mask were automatically identified.
Additional files
-
Supplementary file 1
Genotype, neurons, reporters, age, sex, antibodies, antibody concentrations, and transgenic fly source for all data and figure panels.
- https://cdn.elifesciences.org/articles/81248/elife-81248-supp1-v2.xlsx
-
MDAR checklist
- https://cdn.elifesciences.org/articles/81248/elife-81248-mdarchecklist1-v2.docx
Download links
A two-part list of links to download the article, or parts of the article, in various formats.
Downloads (link to download the article as PDF)
Open citations (links to open the citations from this article in various online reference manager services)
Cite this article (links to download the citations from this article in formats compatible with various reference manager tools)
Rapid reconstruction of neural circuits using tissue expansion and light sheet microscopy
eLife 11:e81248.
https://doi.org/10.7554/eLife.81248


