FOXP2 confers oncogenic effects in prostate cancer
- The Key Laboratory of Geriatrics, Beijing Hospital, National Center of Gerontology, National Health Commission, Institute of Geriatric Medicine, Chinese Academy of Medical Sciences, China
- Department of Thoracic Surgery, Peking University Shenzhen Hospital, Shenzhen Peking University, China
- The Hong Kong University of Science and Technology Medical Center, China
- Department of Urology, Beijing Hospital, National Health Commission, Institute of Geriatric Medicine, Chinese Academy of Medical Sciences, China
- Tianjin Institute of Urology, Second Hospital of Tianjin Medical University, China
- Department of Urology, Second Hospital of Tianjing Medical University, China
- Genetic Testing Center, Qingdao Women and Children's Hospital, China
- Department of Computer Science, City University of Hong Kong, China
- Department of Urology, Beijing Jishuitan Hospital, China
- Department of Urology, Beijing Tian Tan Hospital, Capital Medical University, China
- School of Nursing, Harbin Medical University, China
- Department of Pathology, Beijing Hospital, National Health Commission, Institute of Geriatric Medicine, Chinese Academy of Medical Sciences, China
- Department of Urology, Peking University First Hospital, Institute of Urology, China
- Clinical Institute of China-Japan Friendship Hospital, China
- Department of Surgery, Beijing Hospital, National Health Commission, Institute of Geriatric Medicine, Chinese Academy of Medical Science, China
- The Department of Ultrasonography, Beijing Hospital, National Health Commission, Institute of Geriatric Medicine, Chinese Academy of Medical Sciences, China
Figures
Figure 1 with 4 supplements
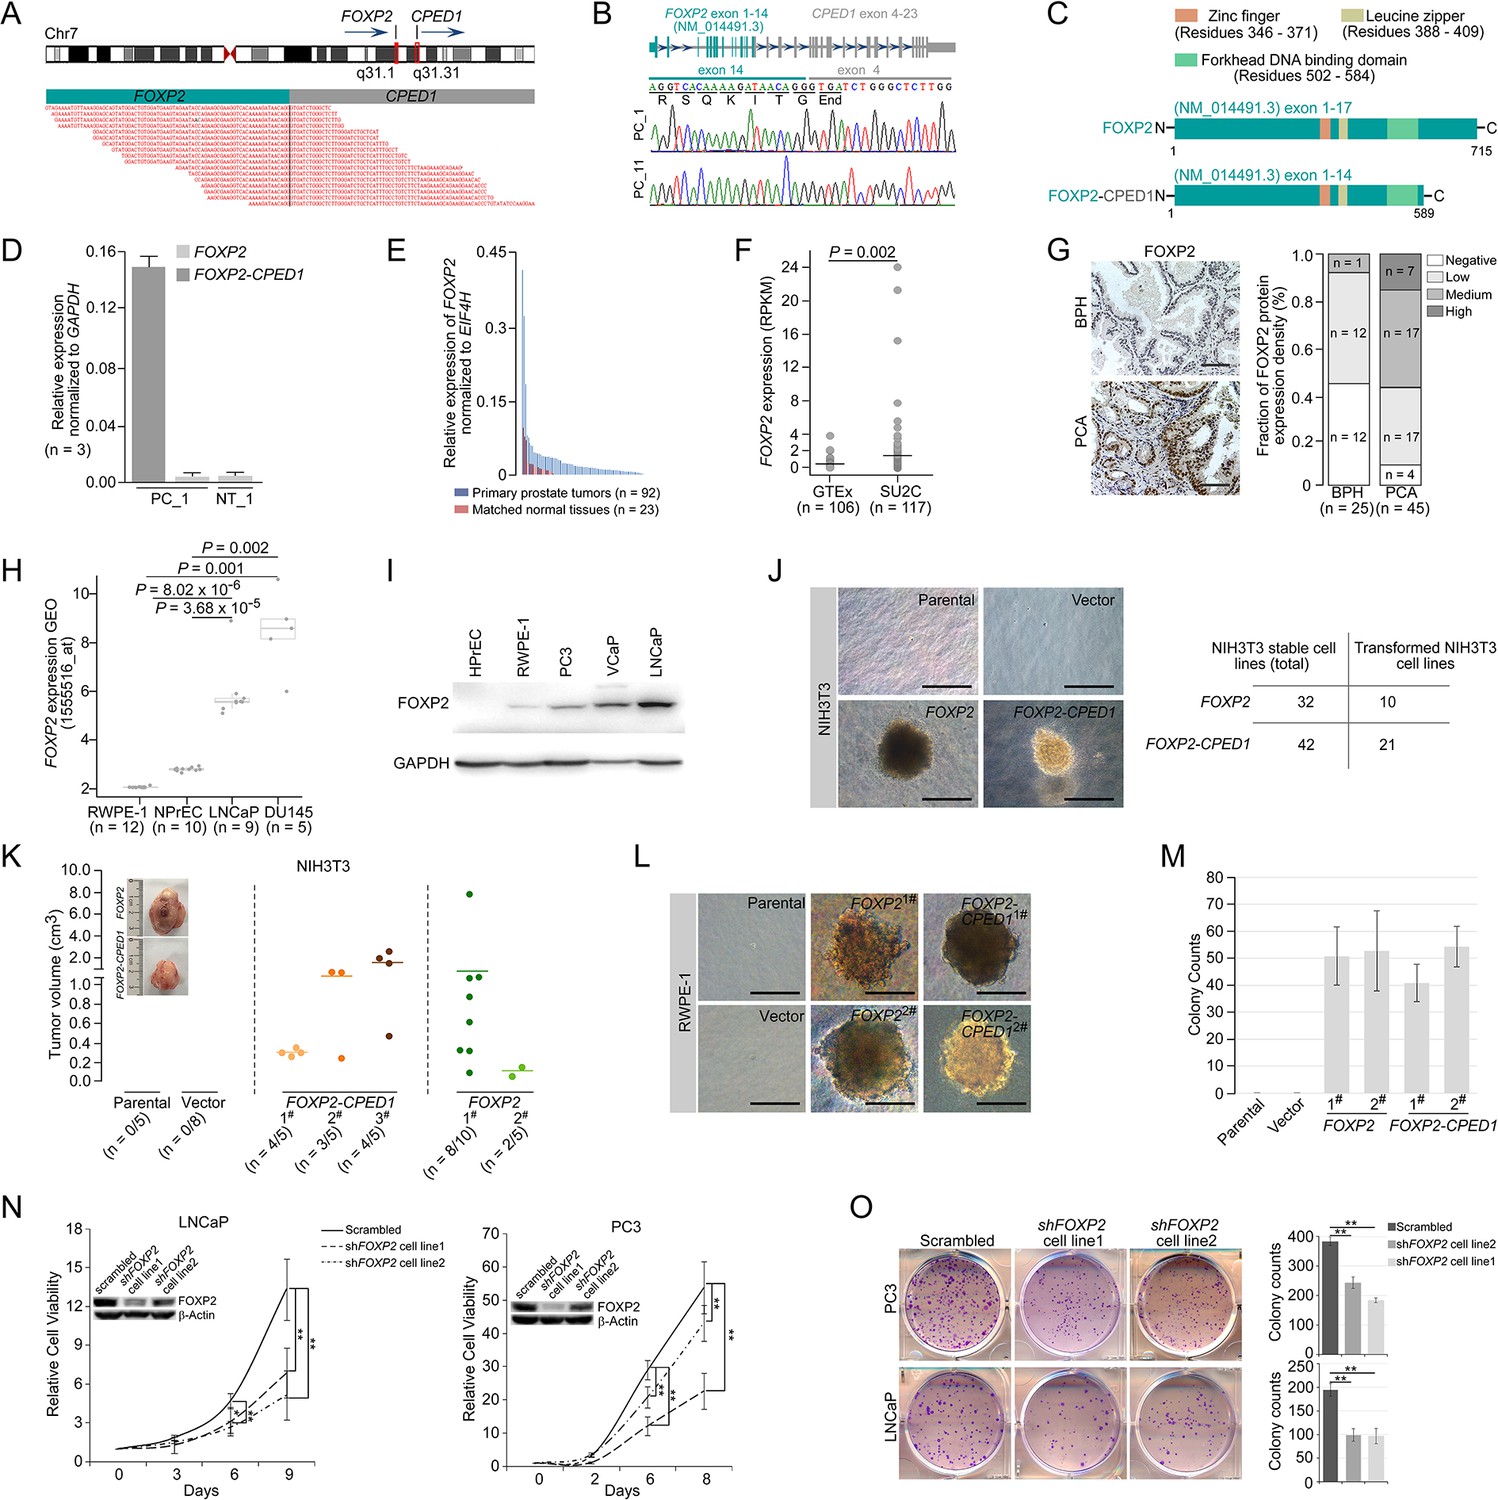
Oncogenic roles of FOXP2 in prostate cancer.
(A) FOXP2-CPED1 fusion gene identified in the prostate tumor of patient (PC_1) by RNA-seq. Top: schematic of chromosome 7 with the position and strand orientation indicated for the FOXP2 and CPED1 gene. Bottom: schematic representation of the paired-end reads covering the junction between FOXP2 and CPED1. (B) FOXP2-CPED1-specific PCR from cDNA derived from the prostate tumors (PC_1 and PC_11). Sanger sequencing chromatogram of the PCR products showing the reading frame encompassing the breakpoint in the two fusion-positive tumors (PC_1 and PC_11). The fusion transcript sequence was identical in the two cases at the fusion junction (exon 14 of FOXP2 fused to exon 4 of CPED1), resulting in a stop-gain mutation right after the fusion breakpoint. (C) Schematic of protein structures of wild-type FOXP2 and truncated FOXP2 encoded by the FOXP2-CPED1 fusion transcript. FOXP2-CPED1 fusion protein has an aberrant C-terminus but it retains the complete FOXP2 functional domains. (D) Expression of natural FOXP2 and FOXP2-CPED1 fusion in the tumor (PC_1) and its matched normal tissue (NT_1) by qPCR. Mean ± SD. (E) Expression of FOXP2 mRNA in 92 primary prostatic adenocarcinoma tissues and 23 matched normal tissues analyzed by qPCR. (F) Expression of FOXP2 mRNA in normal prostate samples from the GTEx dataset (n = 106) and metastatic prostate tumors from the SU2C dataset (n = 117). The horizontal bar indicates the mean in each group. p-Values were calculated by two-tailed Mann–Whitney U-test. (G) Left: representative images of FOXP2 protein expression in benign prostatic hyperplasia (BPH) (n = 25) or primary prostatic adenocarcinoma (PCA) (n = 45) by immunohistochemistry. Scale bars, 100 μm. Right: the bar chart indicates the number of PCA and BPH with negative, low, medium, and high FOXP2 expression, respectively. (H) Expression of FOXP2 mRNA in two types of human benign prostate epithelial cells, RWPE-1 and NPrEC, and in two prostate cancer cell lines LNCaP and DU145 from the GEO database (1555516_at). p-Values were calculated by two-tailed Student’s t-test. (I) Western blot measuring FOXP2 protein in one normal human prostate epithelial cell HPrEC and one benign prostate epithelial cell RWPE-1, and in three human prostate cancer cell lines, PC3, VCaP, and LNCaP. The experiment was repeated twice with similar results. (J) Cell transformation and anchorage-independent growth were measured by a soft agar assay in parental NIH3T3 cells and NIH3T3 cells stably expressing the empty vector, FOXP2 and FOXP2-CPED1. Repeated 4-week assays were performed. Scale bars, 100 μm. See Figure 1—figure supplement 3D for details. Table indicating the number of total NIH3T3 cell lines overexpressing FOXP2 (n = 32) or FOXP2-CPED1 (n = 42) tested by soft agar colony formation assay (left column) and the number of transformed NIH3T3 cell lines induced by FOXP2 (n = 10) or FOXP2-CPED1 (n = 21) (right column). See Figure 1—figure supplement 3D for details. (K) Quantification of the tumor volume in NOD-SCID mice injected with NIH3T3 cells stably expressing vector, FOXP2 (two cell lines) or FOXP2-CPED1 (three cell lines) for 8 wk. Inset: representative images of xenografted tumors derived from the corresponding cells. See Figure 1—figure supplement 3E and F for details. (L, M). (L) Soft agar assay showing that RWPE-1 cells stably expressing FOXP2 (two cell lines) or FOXP2-CPED1 (two cell lines) were able to form colonies. Scale bars, 100 μm; (M) Quantitative analysis of the colony formation ability of the corresponding RWPE-1 cells. Mean ± SD; n = 4. (N) Cell growth of prostate cancer cell lines (LNCaP and PC3) stably expressing control vector or FOXP2 shRNA (two clones, #1 and #2). *p<0.05, **p<0.005 by two-tailed Student’s t-test, mean ± SD; n = 4. Inset: immunoblot showing knockdown of FOXP2 protein in LNCaP or PC3 cells. (O) Left: focus formation assay performed with PC3 or LNCaP cells stably expressing control vector or FOXP2 shRNA (two clones, #1 and #2). Right: bar graph showing the number of colonies formed by PC3 or LNCaP cells after FOXP2 silencing. **p<0.005 by two-tailed Student’s t-test; mean ± SD; n = 4.
-
Figure 1—source data 1
Uncropped blot for Figure 1I.
- https://cdn.elifesciences.org/articles/81258/elife-81258-fig1-data1-v2.zip
-
Figure 1—source data 2
Uncropped blot for Figure 1N.
- https://cdn.elifesciences.org/articles/81258/elife-81258-fig1-data2-v2.zip
Figure 1—figure supplement 1
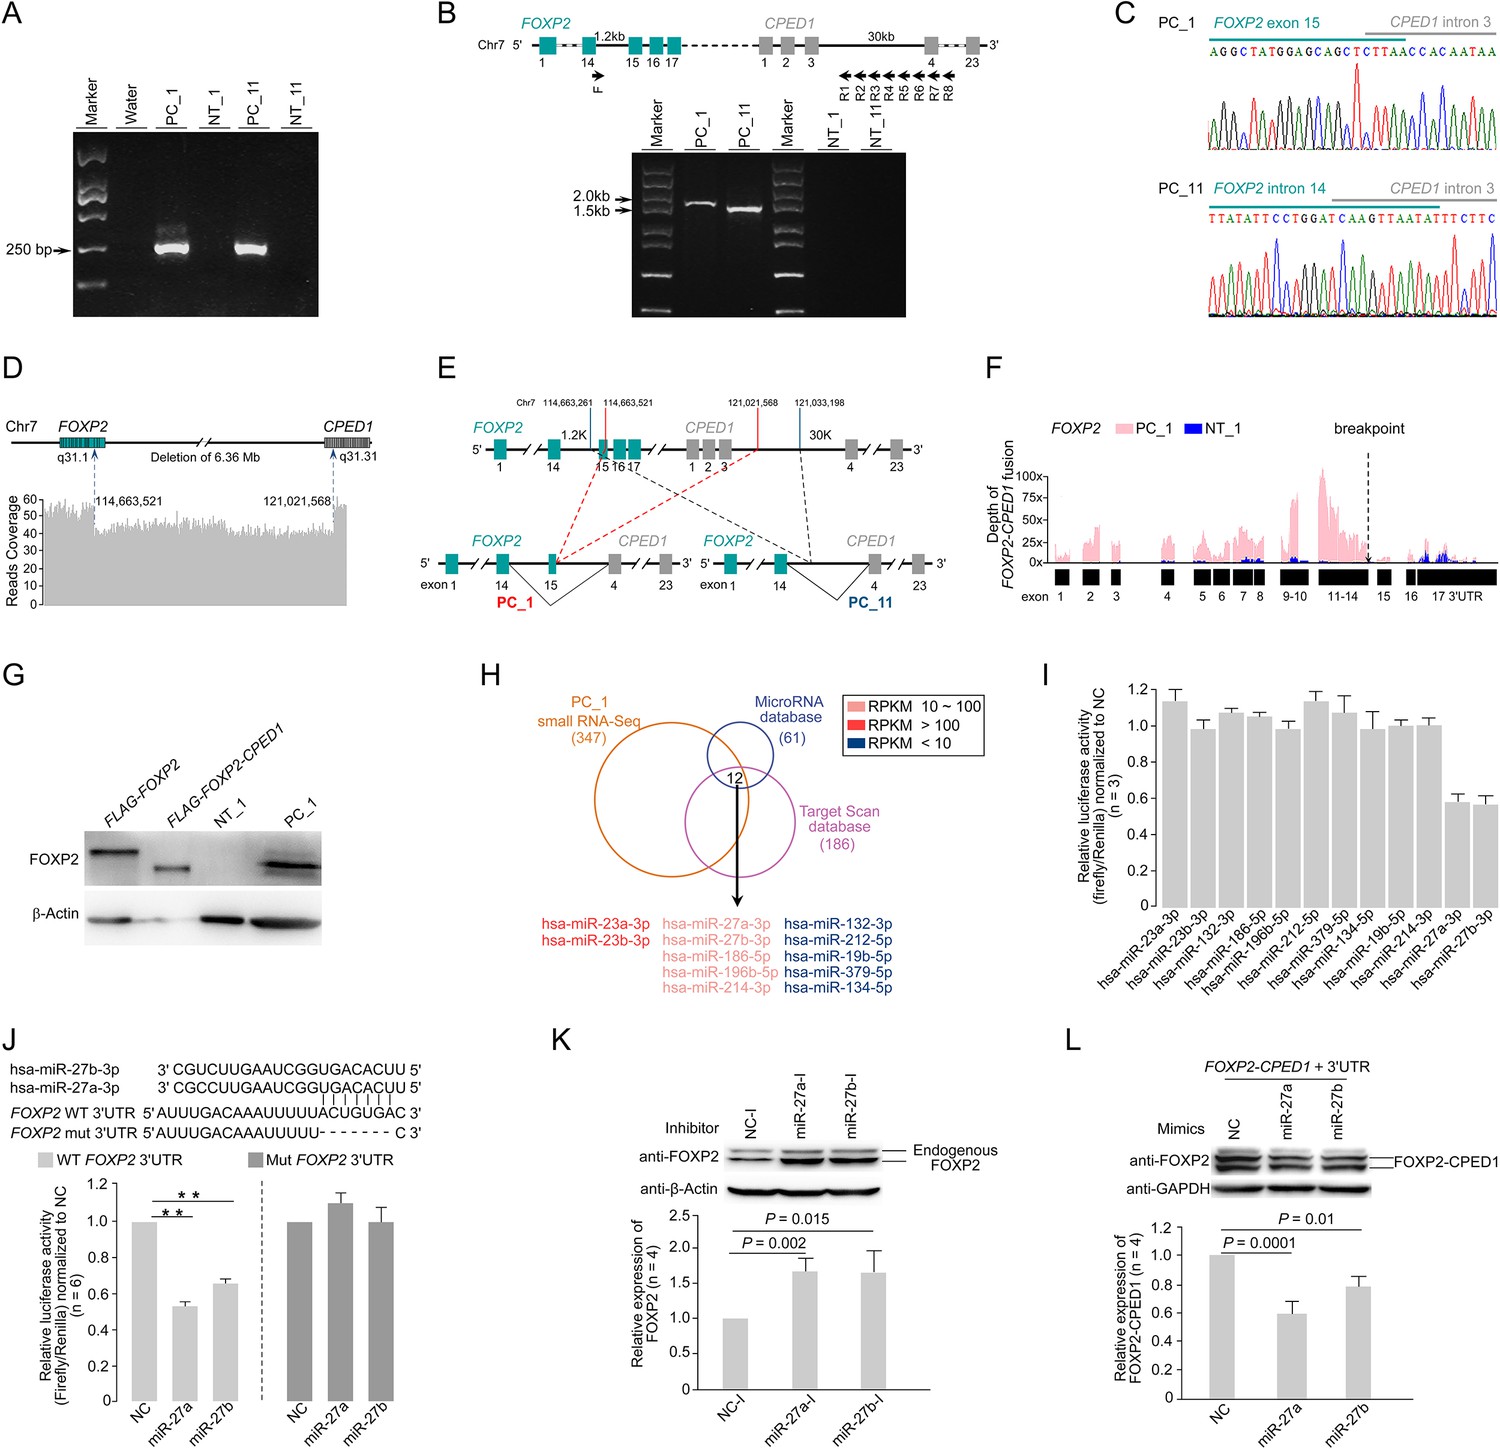
Identification of FOXP2-CPED1 fusion gene in human prostate tumors.
(A) FOXP2-CPED1-specific PCR from cDNA derived from the prostate tumors (PC_1, PC_11) and their matched normal tissues (NT_1, NT_11), respectively. Marker, DNA marker. (B) Upper panel: a schematic of eight primer sets (F-R1 to F-R8) for long-range PCR amplification for detection of the genomic breakpoint of FOXP2-CPED1 fusion. Lower panel: the breakpoints of FOXP2-CPED1 fusion at the genomic level by long-range PCR amplification of genomic DNA derived from the prostate tumors (PC_1, PC_11) and their matched normal tissues (NT_1, NT_11), respectively. Marker, DNA marker. (C) Sanger sequencing chromatograms of long-range PCR amplification as shown in (B) shows the fusion breakpoints in genomic DNA from PC_1 or PC_11 that are positive for the FOXP2-CPED1 fusion. (D) Whole-genome sequencing of DNA from fusion-positive sample (PC_1) revealed an ~6.36 Mb fragment deletion between FOXP2 and CPED1. Dotted arrows indicate the breakpoints in the FOXP2 and CPED1 genes. (E) A schematic of the genomic rearrangement pattern of the FOXP2-CPED1 fusion in PC_1 and PC_11. Red dashed line: genomic fusion pattern of FOXP2 exon 15 with intron 3 of CPED1 in PC_1. Green dashed line: genomic fusion pattern of FOXP2 intron 14 with intron 3 of CPED1 in PC_11. (F) Mapping of RNA-seq reads to the FOXP2 locus of a human reference genome (hg19) for the tumor sample (PC_1) and its matched normal tissue (NT_1). The dotted arrow indicates the fusion breakpoint in the FOXP2 gene. The exons of FOXP2 before the fusion breakpoint (from 1st exon to 14th exon) were abundantly expressed in the fusion-positive sample (PC_1), suggesting that most of the FOXP2 expression took place from the fusion transcript rather than from natural FOXP2. (G) Expression of natural FOXP2 and FOXP2-CPED1 fusion in the tumor (PC_1) and its matched normal tissue (NT_1) by western blot analysis. Overexpression of FLAG-FOXP2-CPED1 or FLAG-FOXP2 in NIH3T3 cells as positive controls. (H) The overlap of microRNAs identified in the FOXP2-CPED1 fusion-positive sample (PC_1) by small RNA-Seq and predicted microRNAs targeting FOXP2 from the TargetScan and MicroRNA databases. A total of 12 microRNA candidates are listed. (I) Luciferase assay of the FOXP2 3’UTR after individual overexpression of 12 microRNA candidates in HEK 293T cells. Mean ± SD; n = 3. Luciferase reporter assays suggested that two of them, miR-27a and miR-27b, targeted FOXP2 3’UTR. (J) Top: schematic indicating the location of the miR-27a and miR-27b binding sites in the wild-type FOXP2 3’UTR construct and the mutant with the binding site deleted. Bottom: luciferase assay of the wild-type FOXP2 3’UTR versus mutant after transfection with miR-27a/b mimics or microRNA negative control (NC) in HEK 293T cells. **p<0.0005 by two-tailed Student’s t-test, mean ± SD; n = 6. (K) Detection of FOXP2 protein after transfection with the microRNA inhibitor negative control (NC-I), miR-27a inhibitor (miR-27a-I) or miR-27b inhibitor (miR-27b-I) in HEK 293T cells by western blotting. Histograms of quantitative analysis illustrating endogenous FOXP2 protein expression levels. p-Values calculated by two-tailed Student’s t-test, mean ± SD; n = 4. Increased endogenous FOXP2 protein levels after transfection of miR-27a/b inhibitors in HEK 293T cells were observed. (L) Detection of fusion protein after transfection of the FOXP2-CPED1 plus FOXP2 3’UTR with NC, miR-27a, or miR-27b in HEK 293T cells by western blotting. Histograms of quantitative analysis illustrating exogenous FOXP2-CPED1 truncated protein expression levels. p-Values calculated by two-tailed Student’s t-test, mean ± SD; n = 4. The result showed that addition of the FOXP2 3’UTR back into the FOXP2-CPED1 construct led to decreased fusion protein expression upon transfection with miR-27a/b.
-
Figure 1—figure supplement 1—source data 1
Uncropped gel for Figure 1—figure supplement 1A.
- https://cdn.elifesciences.org/articles/81258/elife-81258-fig1-figsupp1-data1-v2.zip
-
Figure 1—figure supplement 1—source data 2
Uncropped gel for Figure 1—figure supplement 1B.
- https://cdn.elifesciences.org/articles/81258/elife-81258-fig1-figsupp1-data2-v2.zip
-
Figure 1—figure supplement 1—source data 3
Uncropped blot for Figure 1—figure supplement 1G.
- https://cdn.elifesciences.org/articles/81258/elife-81258-fig1-figsupp1-data3-v2.zip
-
Figure 1—figure supplement 1—source data 4
Uncropped blot for Figure 1—figure supplement 1K.
- https://cdn.elifesciences.org/articles/81258/elife-81258-fig1-figsupp1-data4-v2.zip
-
Figure 1—figure supplement 1—source data 5
Uncropped blot for Figure 1—figure supplement 1L.
- https://cdn.elifesciences.org/articles/81258/elife-81258-fig1-figsupp1-data5-v2.zip
Figure 1—figure supplement 2
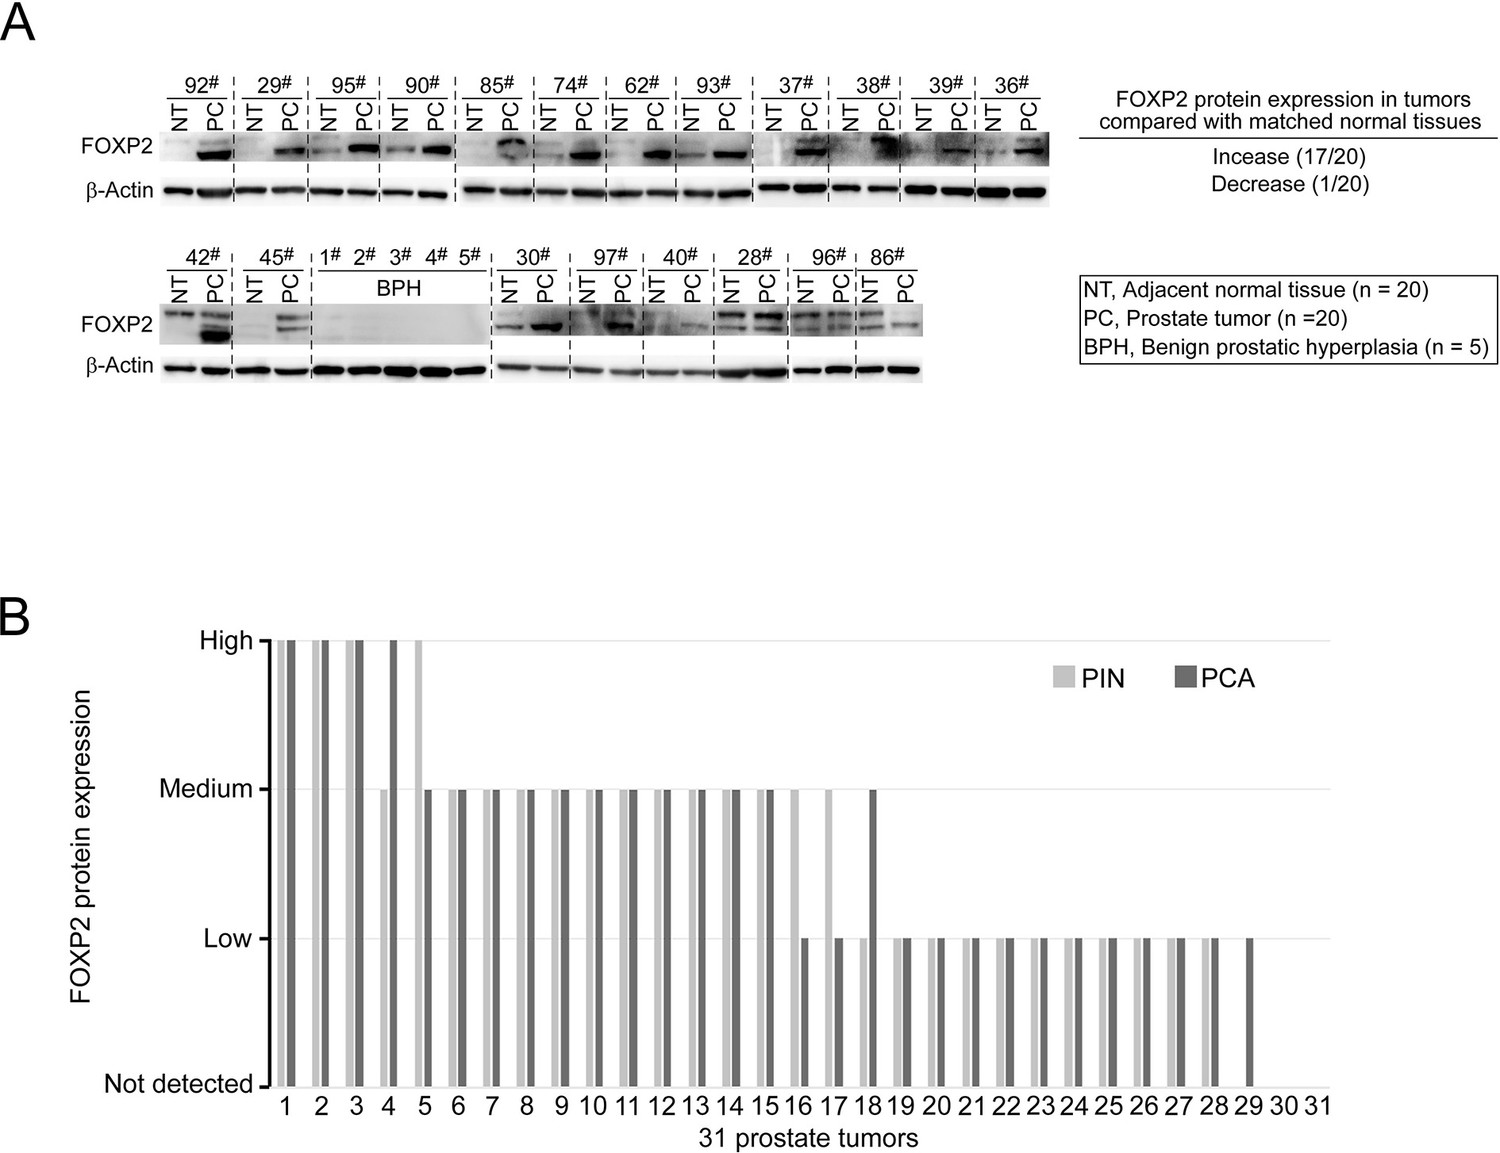
Oncogenic roles of FOXP2 in prostate cancer.
(A) Detection of FOXP2 protein expression levels in our primary prostatic adenocarcinoma (PCA) and the matched normal tissues (n = 20) and samples of benign prostatic hyperplasia (BPH) (n = 5) by western blotting. (B) Evaluation of FOXP2 protein abundance in 31 prostate cancer specimens with the presence of prostatic intraepithelial neoplasia (PIN) (Taylor et al.) adjacent to carcinoma by IHC. The 28 FOXP2-staining-positive cancers showed FOXP2 expression in the adjacent PIN as well. Two cases did not show FOXP2-staining in both cancers and the adjacent PIN.
-
Figure 1—figure supplement 2—source data 1
Uncropped blot for Figure 1—figure supplement 2A.
- https://cdn.elifesciences.org/articles/81258/elife-81258-fig1-figsupp2-data1-v2.zip
Figure 1—figure supplement 3
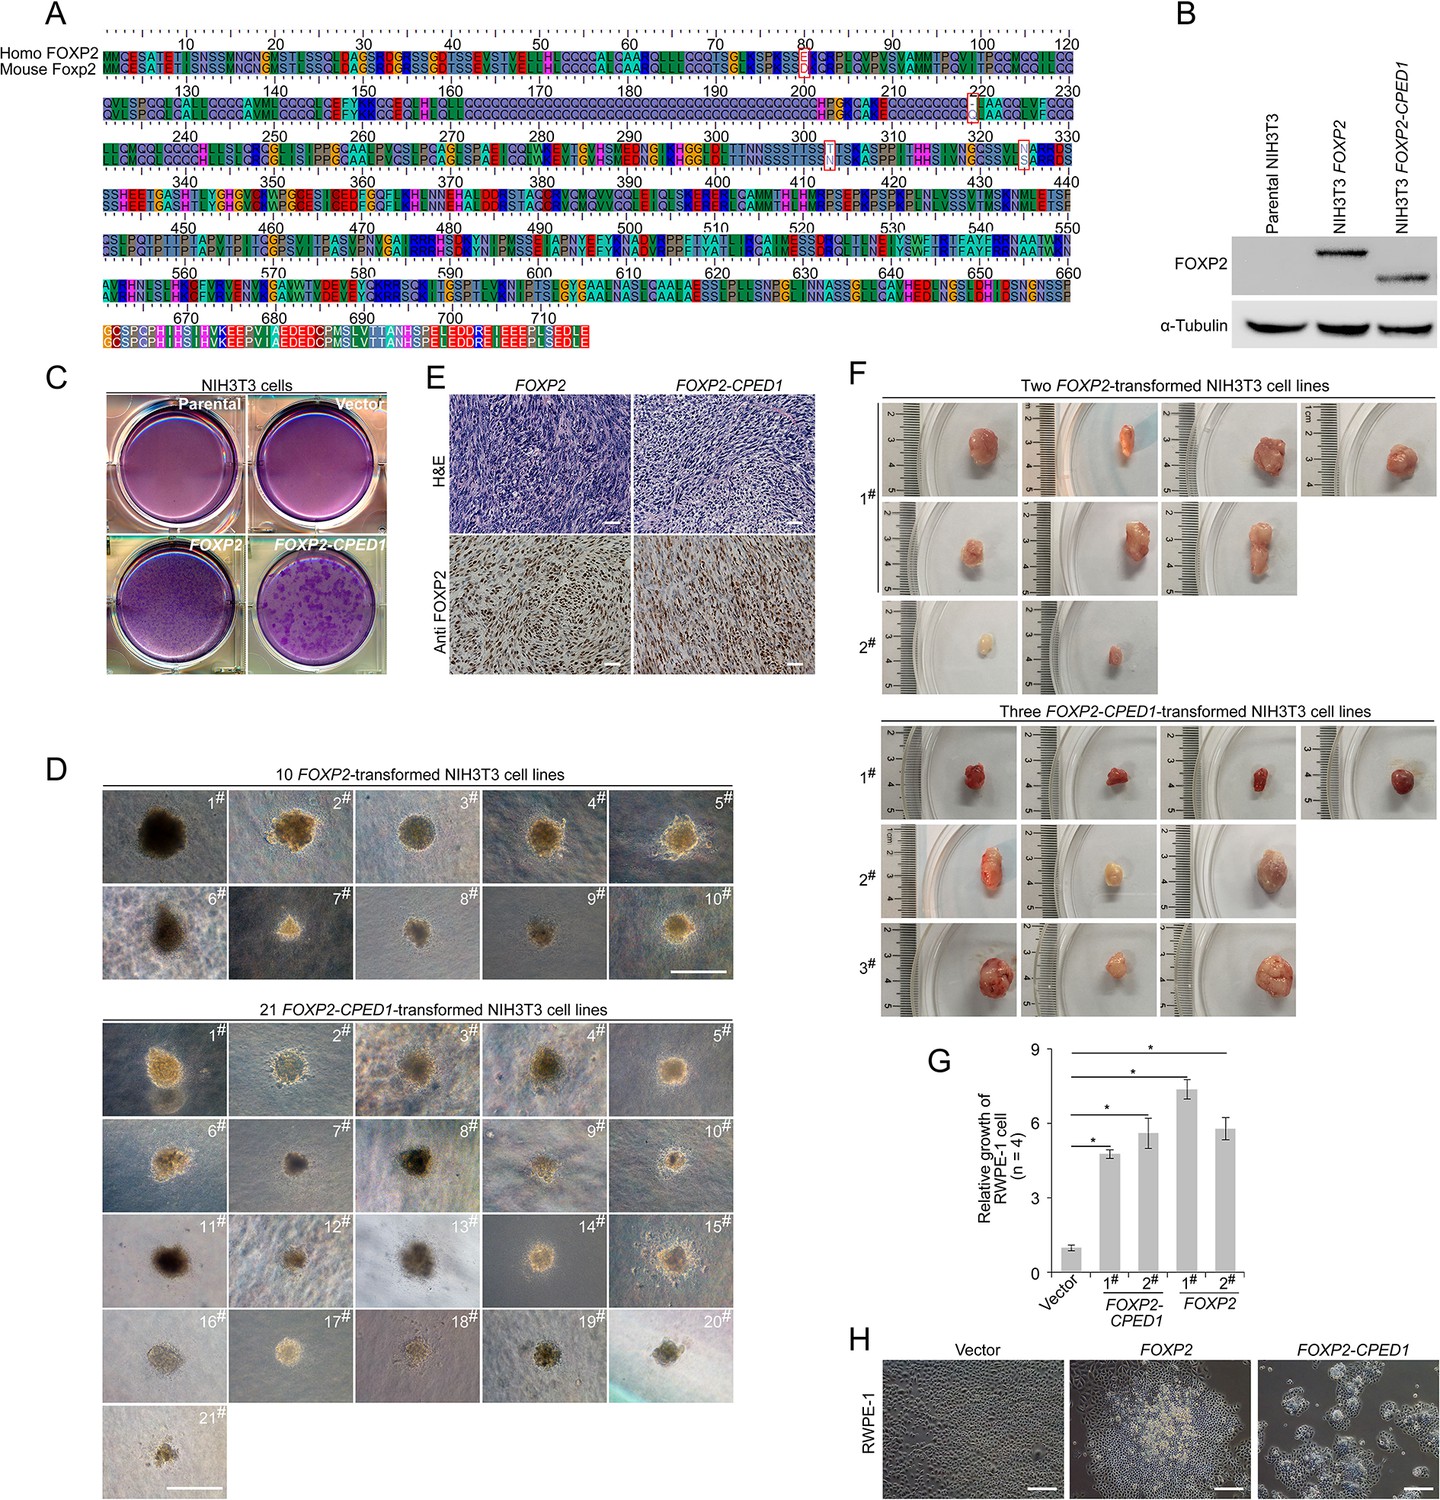
Oncogenic roles of FOXP2 in prostate cancer.
(A) Alignment of homologs of human FOXP2 and mouse Foxp2 showing high conservation between the two species. (B) Protein blot showing ectopic expression of FOXP2 and FOXP2-CPED1 fusion protein in NIH3T3 cells, respectively, and endogenic Foxp2 protein is undetectable in the parental NIH3T3 cells. (C) Focus formation assay performed with parental NIH3T3 cells and NIH3T3 cells with stably expressing the empty vector, FOXP2-CPED1 and FOXP2, respectively. (D) All representative images of the soft agar colony formation assay showing transformed NIH3T3 cell lines induced by FOXP2-CPED1 or FOXP2 shown in Figure 1J. Scale bars, 100 μm. (E) Hematoxylin and eosin stain and immunohistochemical analysis using anti-FOXP2 antibody in tumors from NOD-SCID mice. Scale bars, 100 μm. (F) Images showing tumors from mice injected with FOXP2-CPED1 cell lines (1#, 2#, and 3#) and FOXP2 cell lines (1# and 2#) shown in Figure 1K. (G) Relative viability of cells with stably expressing FOXP2 and FOXP2-CPED1 (normalized to cells with stably expressing lentiviral empty vector) was determined using a Celltiter-Glo assay. RWPE-1 cells with stably expressing lentiviral empty vector, FOXP2 and FOXP2-CPED1, respectively, were cultured for 6 d. *p<0.005 by two-tailed Mann–Whitney U-test, mean ± SD; n = 4. (H) Focus formation assay performed with RWPE-1 cells with stably expressing lentiviral empty vector, FOXP2 and FOXP2-CPED1, respectively. Scale bars, 100 μm.
-
Figure 1—figure supplement 3—source data 1
Uncropped blot for Figure 1—figure supplement 3B.
- https://cdn.elifesciences.org/articles/81258/elife-81258-fig1-figsupp3-data1-v2.zip
Figure 1—figure supplement 4
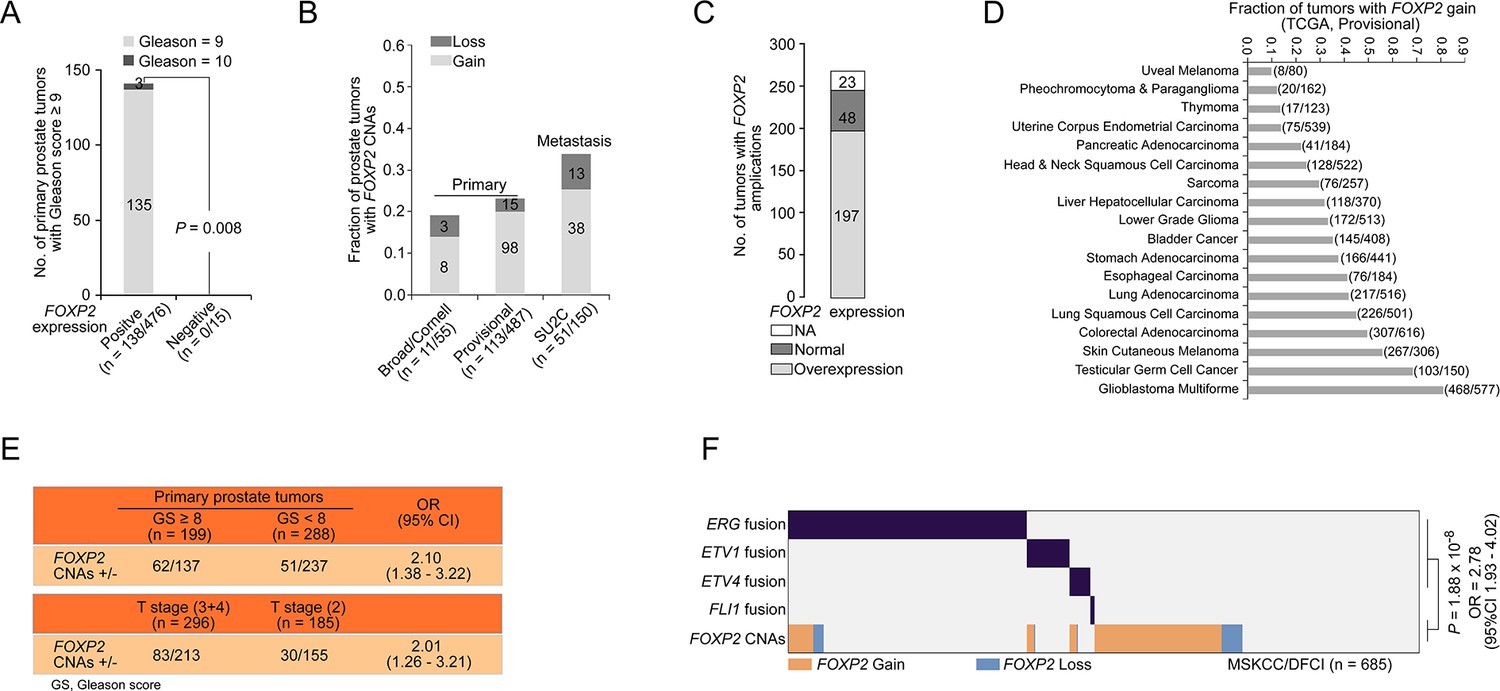
Clinical significance of FOXP2 expression and its copy number alterations (CNAs) in prostate cancer.
(A) The relationship of FOXP2 expression with Gleason score (≥9) in 491 primary prostate cancer samples from the TCGA dataset (Prostate Adenocarcinoma, Provisional) (FOXP2-positive expression, n = 476 and FOXP2 negative expression, n = 15). p-Value calculated by two-tailed Fisher’s exact test. (B) The fraction of tumors with FOXP2 CNAs in two primary prostate cancer cohorts from the Broad/Cornell 2013 dataset (n = 55) and TCGA dataset (Prostate Adenocarcinoma, Provisional, n = 487) and in one metastatic tumors cohort from the SU2C dataset (n = 150). (C) Correlation between the amplification and mRNA expression of the FOXP2 gene in tumors from COSMIC datasets (n = 268). (D) The fractions of FOXP2 gains in 18 types of human solid tumors from the TCGA provisional datasets. The number of tumors with FOXP2 gains versus total number of tumors is indicated in parentheses. (E) The association of FOXP2 CNAs with Gleason scores or T stages in primary prostate tumors from TCGA (Prostate Adenocarcinoma, Provisional, n = 487). p-Values were calculated using Fisher’s exact test. (F) FOXP2 CNAs exhibited a partially mutual exclusivity with ETS fusions in primary prostate tumors from the MSKCC/DFCI dataset (n = 685). -Value calculated by two-tailed Fisher’s exact test.
Figure 2 with 1 supplement
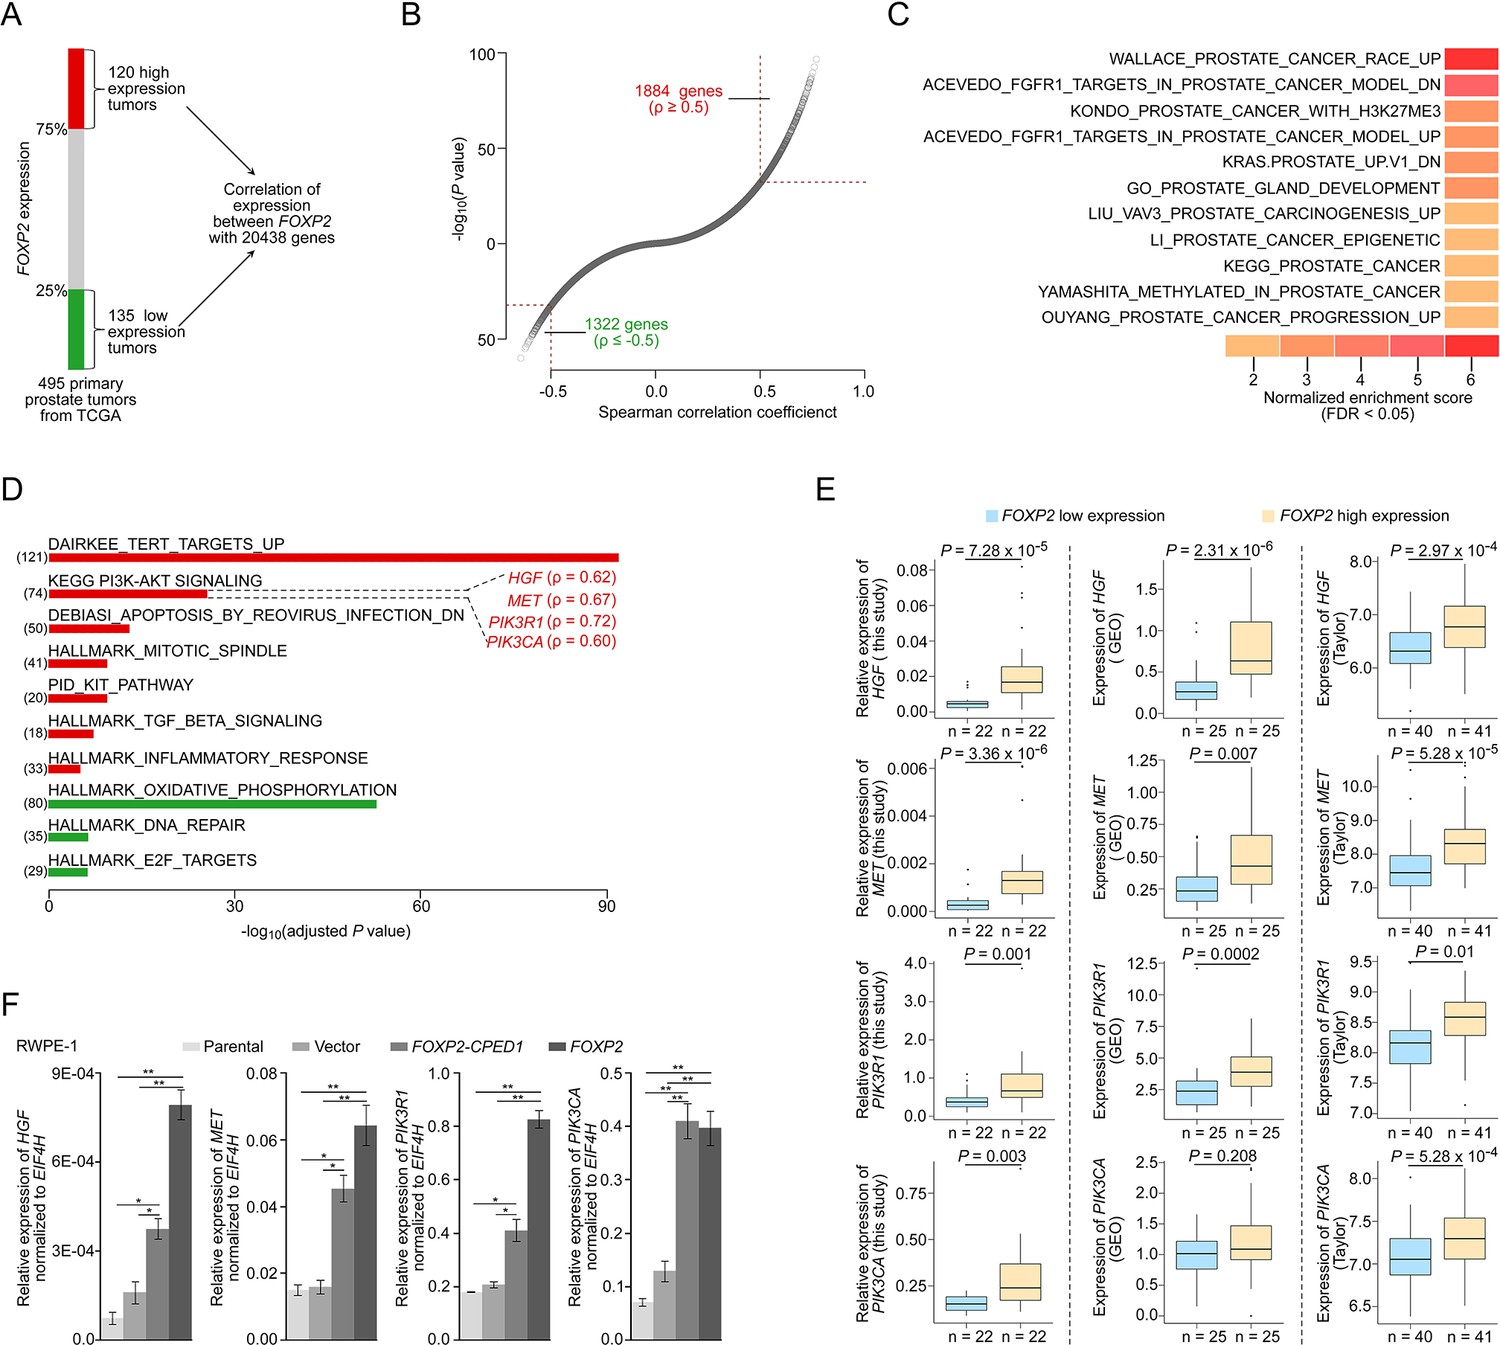
FOXP2 activates oncogenic MET signaling in FOXP2-overexpressing cells and prostate tumors.
(A) Schematic indicating the analysis of the TCGA dataset (Prostate Adenocarcinoma, Provisional, n = 495). In total, n = 255, top 25%, high expression (n = 120), bottom 25%, low expression (n = 135). (B) In the 255 primary prostate tumors shown in (A), the expression of 3206 genes was significantly correlated with the expression of FOXP2 (|Spearman’s ρ ≥ 0.5|; 1884 significantly positively correlated genes; 1322 significantly negatively correlated genes). See also Supplementary file 2. (C) The significant enrichment of the 3206 FOXP2 expression-correlated genes (FECGs) in known prostate cancer gene sets from the Molecular Signatures database by gene set enrichment analysis (GSEA). p-Values were calculated by two-tailed Fisher’s exact test. See also Supplementary file 1c. (D) Analysis of the biological pathways of 3206 FOXP2 expression-correlated genes using gene sets from MSigDB and KEGG. The number in parentheses corresponds to FOXP2 expression-correlated genes that are enriched in the corresponding pathway. The Spearman correlation coefficients between the expression of FOXP2 and the expression of four core components of MET signaling (HGF, MET, PIK3R1, and PIK3CA) are indicated in parentheses. Two-tailed p-values by Fisher’s exact test and adjusted by Bonferroni correlation. See also Supplementary file 1d. (E) The correlation analysis of gene expression between FOXP2 and MET signalling members in our primary prostate tumors (n = 92) and two other human primary prostate cancer datasets (GSE54460, n = 100; Taylor, n = 162) by qPCR. HGF, MET, PIK3R1, and PIK3CA expression levels (normalized to EIF4H) classified by FOXP2 expression level (bottom 25%, low expression; top 25%, high expression). p-Values were calculated by two-tailed Mann–Whitney U-test. (F) In FOXP2- or FOXP2-CPED1-transformed RWPE-1 cells and control cells (parental cells and empty vector-expressing cells), the relative mRNA expression levels of HGF, MET, PIK3R1, and PIK3CA (normalized to EIF4H) were examined by qPCR. p-Values calculated by two-tailed Student’s t-test, mean ± SD; n = 3. *p<0.05, **p<0.005.
Figure 2—figure supplement 1
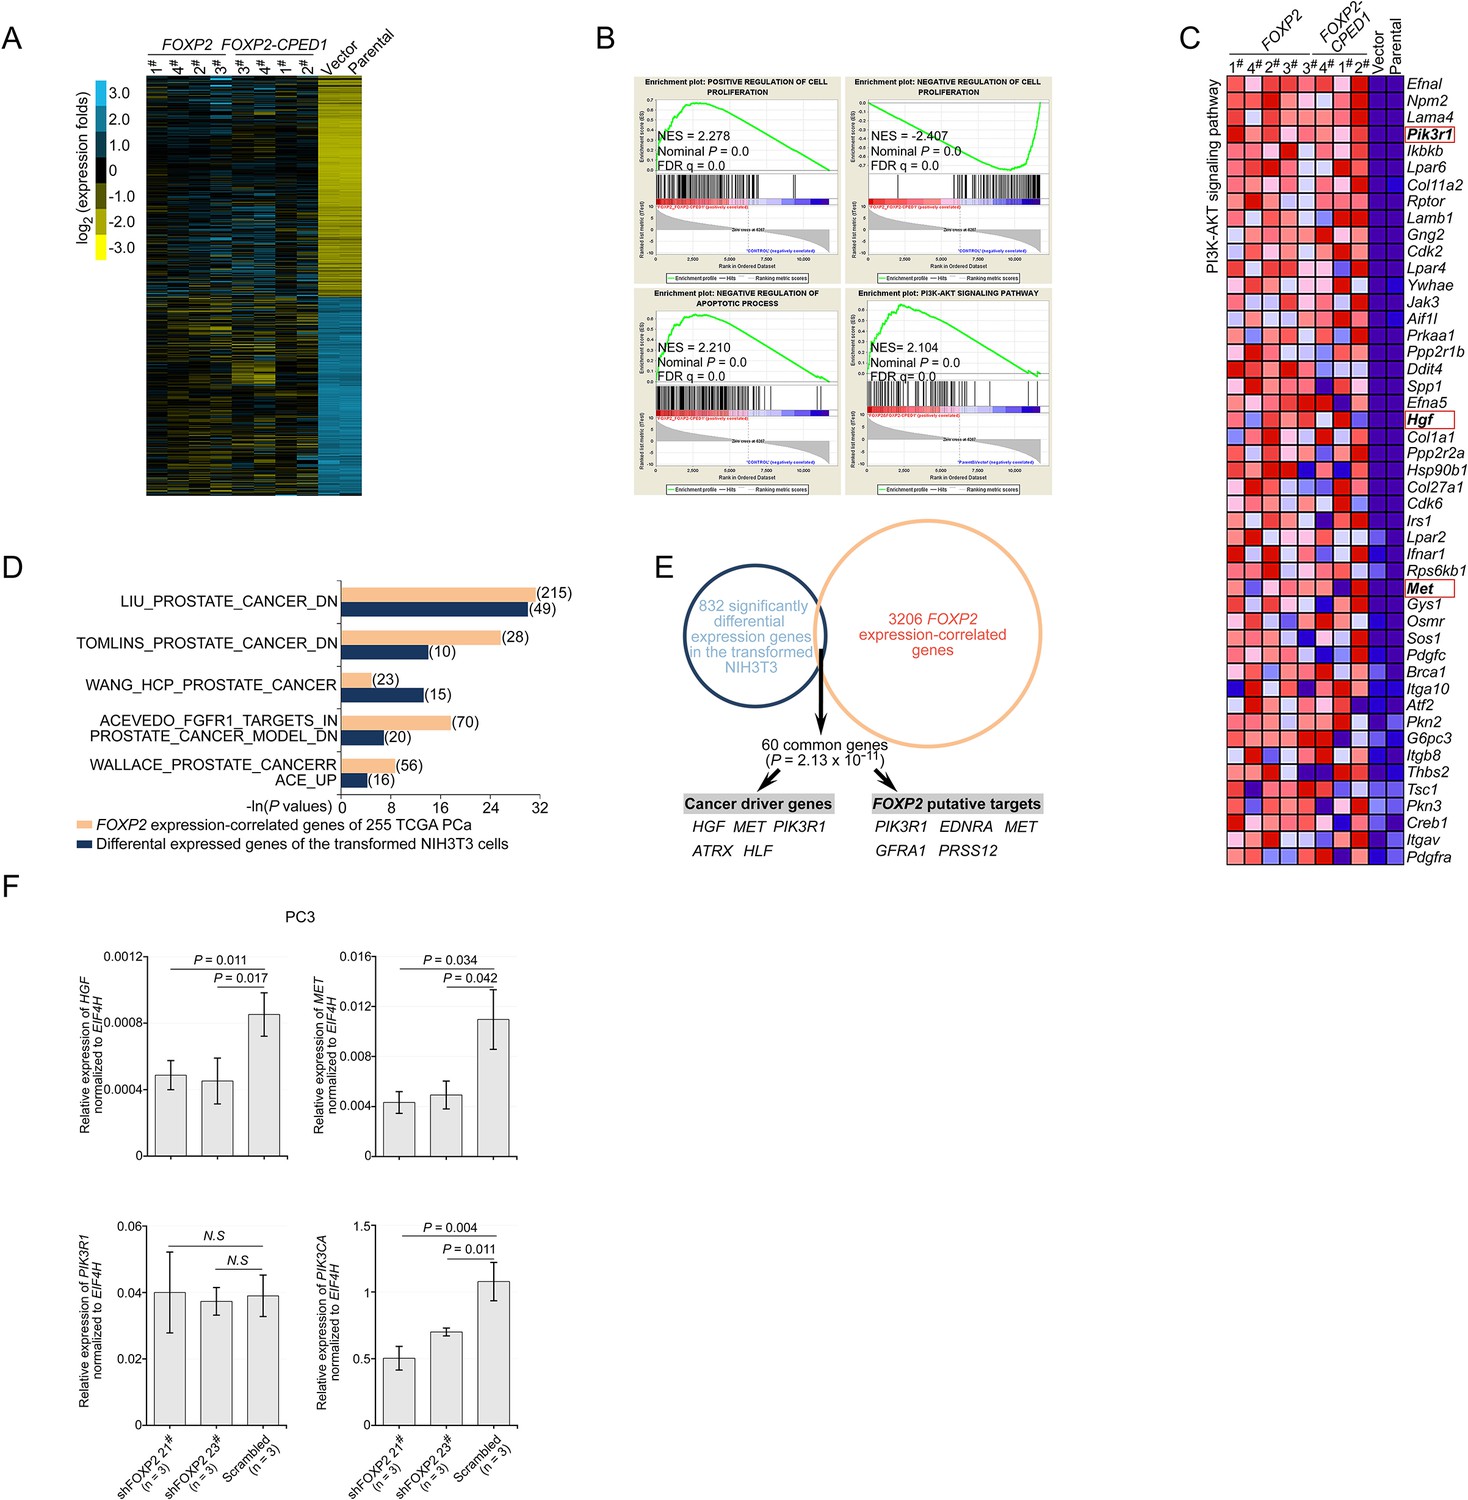
FOXP2 activates oncogenic MET signaling in FOXP2-overexpressing cells.
(A) Gene expression heat map of the significantly upregulated and downregulated genes from RNA sequencing analysis of NIH3T3 cells overexpressing FOXP2 or FOXP2-CPED1 relative to control cells. Yellow indicates high expression, blue indicates low expression. (B) Gene set enrichment analysis (GSEA) plots of the ranked list of differentially expressed genes in the FOXP2- or FOXP2-CPED1-transformed NIH3T3 cells and control cells (parental or stably expressing lentiviral vector NIH3T3 cells) were generated with four gene sets. NES, normalized enrichment score; FDR, false discovery rate. (C) Heat map of differentially expressed genes contributing to the GSEA core enrichment of the PI3K-AKT pathway, involving Met signaling components (Pik3r1, Hgf, and Met, marked by red rectangle) in the transformed NIH3T3 cells. Red, high expression; blue, low expression. (D) GSEA showing the enrichment of 832 differentially expressed genes in the FOXP2 or FOXP2-CPED1 transformed NIH3T3 cells and the enrichment of 3206 FOXP2 expression-correlated genes (FECGs) in 255 human prostate cancer samples from the TCGA dataset (Prostate Adenocarcinoma, Provisional) in known prostate cancer gene sets from Molecular Signatures database. The number of enriched genes is indicated in parentheses. p-Values by two-tailed Fisher’s exact test. (E) The overlap between 832 significantly differentially expressed genes in the FOXP2 or FOXP2-CPED1-transformed NIH3T3 cells and 3206 FECGs in human prostate tumors from the TCGA dataset (Prostate Adenocarcinoma, Provisional). Sixty common genes are represented in the overlap (p=2.13 × 10⁻¹¹ by two-tailed Fisher’s exact test), including five cancer drivers and five FOXP2 putative targets previously identified by ChIP-on-chip or ChIP assays. (F) In prostate cancer, PC3 cells stably expressing control vector or FOXP2 shRNA (two clones, #21 and #23), the relative mRNA expression levels of HGF, MET, PIK3R1, and PIK3CA (normalized to EIF4H) were examined by qPCR. p-Values calculated by the Mann–Whitney U-test, mean ± SD; n = 3.
Figure 3 with 1 supplement

Targeting MET signaling inhibits FOXP2-induced oncogenic effects.
(A) Immunoblotting of the expression levels of p-Met (Y1234/1235) and p-Akt (S473) in NIH3T3 cells overexpressing FOXP2 or FOXP2-CPED1 (left) or in RWPE-1 cells overexpressing FOXP2 or FOXP2-CPED1 (right). The experiment was repeated three times with similar results. Relative ratios of the intensities of the p-Met, p-Akt, Met, and Akt protein bands relative to the beta-Actin band are shown bottom. (B) Protein blot analysis of the expression of p-Met (Y1234/1235) and p-Akt (S473) in LNCaP (left) or PC3 cells (right) that stably expressed scrambled vector and FOXP2 shRNA, respectively. The experiment was repeated three times with similar results. Relative ratios of the intensities of the p-Met, p-Akt, Met, and Akt protein bands relative to the beta-Actin band are shown bottom. (C) Protein blot analysis of the activity of MET (Y1234/1235) and AKT (S473) in human localized primary prostate tumors (n = 18) with high and low FOXP2 expression, respectively. (D, E) IC50 curves of the vector, FOXP2- or FOXP2-CPED1-overexpressing NIH3T3 cells (D) or -overexpressing RWPE-1 cells (E) treated with the MET inhibitor foretinib or the AKT inhibitor MK2206 assessed at 48 hr after the treatment. Mean ± SD; n = 3. (F–G) Western blot analysis of the expression levels of p-Met (Y1234/1235) and p-Akt (S473) in the FOXP2- or FOXP2-CPED1-overexpressing NIH3T3 cells or -overexpressing RWPE-1 cells after 48 hr treatment with vehicle (0.4% DMSO) and the MET inhibitor foretinib (0.5 μM for NIH3T3 cells, 1 μM for RWPE1 cells) (F) or the AKT inhibitor MK2206 (1 μM for NIH3T3 cells, 2.5 μM for RWPE1 cells) (G). The experiment was repeated twice with similar results. Relative ratios of the intensities of the p-Met, p-Akt, and Met protein bands relative to the beta-Actin band are shown bottom. (H) Left: soft agar assay of the stable FOXP2- or FOXP2-CPED1-overexpressing NIH3T3 cells treated with vehicle, MET inhibitor, or AKT inhibitor. Images of representative cells treated with the MET inhibitor foretinib and AKT inhibitor MK2206. Scale bars, 100 μm. Right: bar graph showing the percentage of the colonies formed by these NIH3T3 cells after treatment with the indicated MET or AKT inhibitors normalized to those of DMSO-treated cells. *p<0.01, **p<0.005 by two-tailed Student’s t-test, mean ± SD; n = 4. (I) Left: focus formation assay of the stable FOXP2- or FOXP2-CPED1-overexpressing RWPE-1 cells treated with vehicle, the MET inhibitor foretinib or the AKT inhibitor MK2206. Right: bar graph showing the percentage of the colonies formed by these REPW-1 cells after treatment with the indicated MET or AKT inhibitors normalized to those of DMSO-treated cells. **p<0.005 by two-tailed Student’s t-test, mean ± SD; n = 4. (J) CUT&Tag density heat maps for FOXP2-occupied genomic locations within ± 1.5 kb of the transcription start site (TSS) in LNCaP cells overexpressing HA-tagged FOXP2. All peaks were rank ordered by FOXP2 distribution from high to low. (K) CUT&Tag identified binding site of FOXP2 in MET. Representative track of FOXP2 at the MET gene locus is shown. The blue square denotes the binding site unique to FOXP2.
-
Figure 3—source data 1
Uncropped blot for Figure 3A.
- https://cdn.elifesciences.org/articles/81258/elife-81258-fig3-data1-v2.zip
-
Figure 3—source data 2
Uncropped blot for Figure 3B.
- https://cdn.elifesciences.org/articles/81258/elife-81258-fig3-data2-v2.zip
-
Figure 3—source data 3
Uncropped blot for Figure 3C.
- https://cdn.elifesciences.org/articles/81258/elife-81258-fig3-data3-v2.zip
-
Figure 3—source data 4
Uncropped blot for Figure 3F.
- https://cdn.elifesciences.org/articles/81258/elife-81258-fig3-data4-v2.zip
-
Figure 3—source data 5
Uncropped blot for Figure 3G.
- https://cdn.elifesciences.org/articles/81258/elife-81258-fig3-data5-v2.zip
Figure 3—figure supplement 1
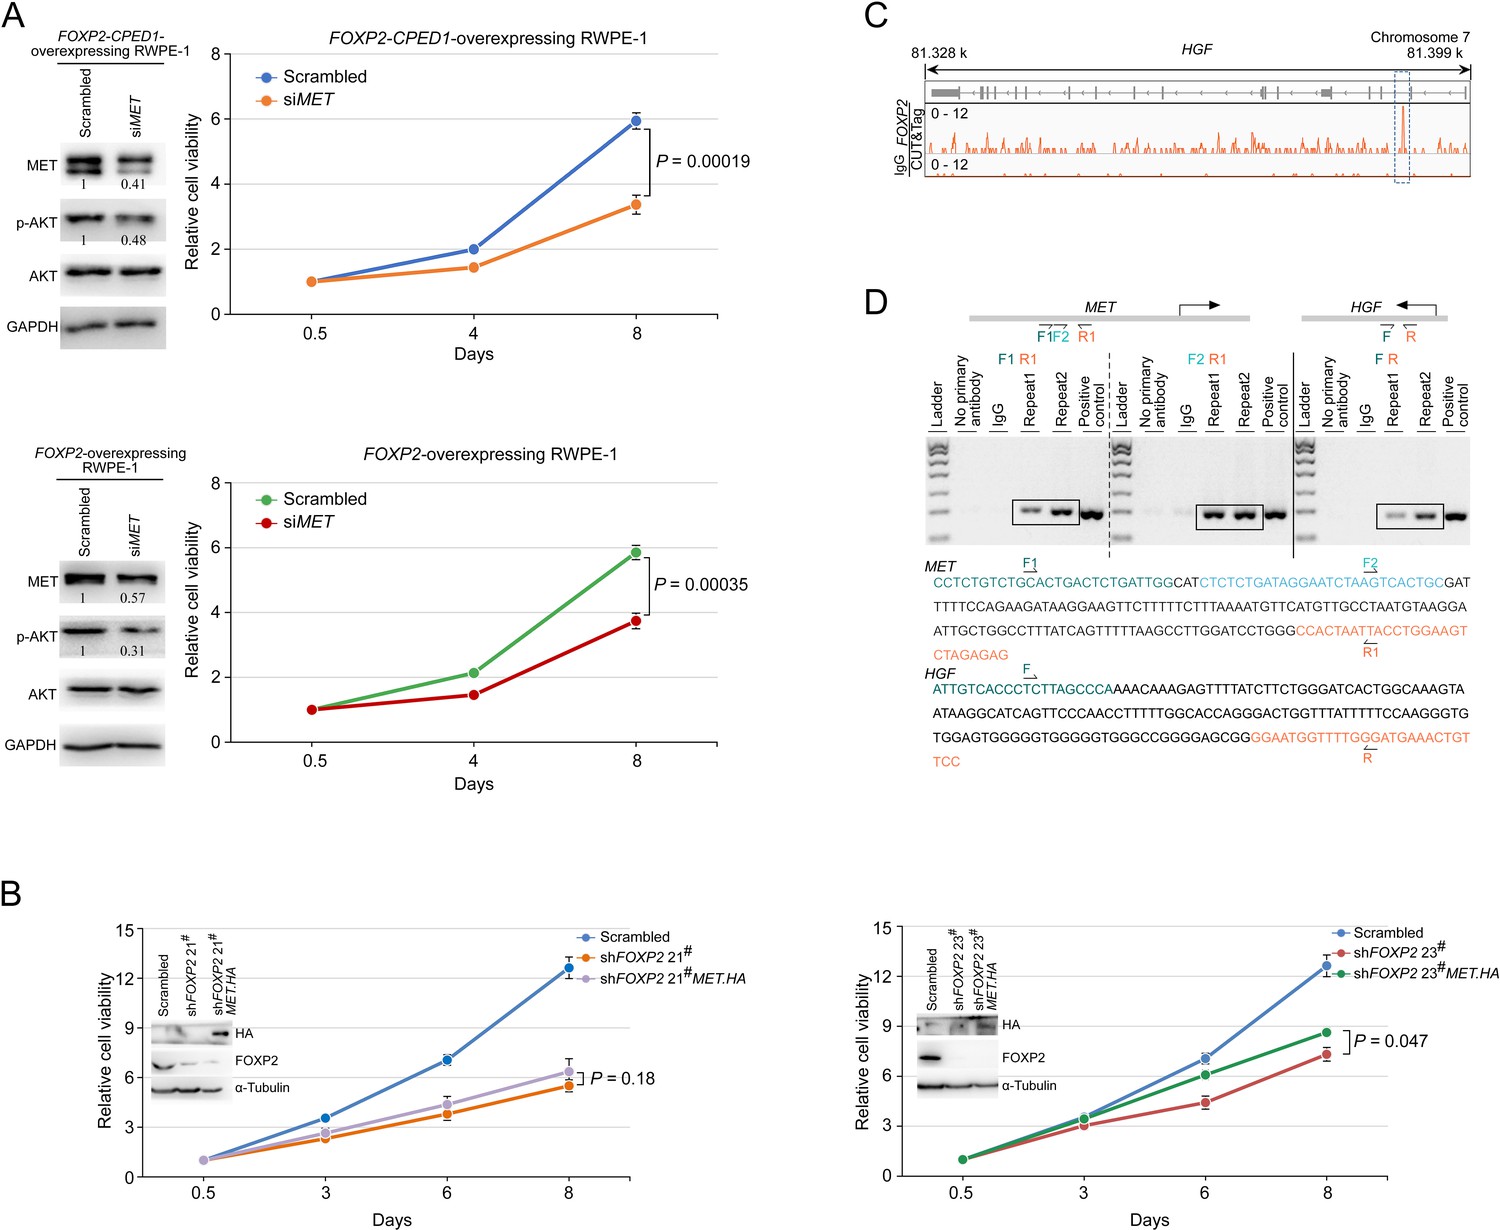
FOXP2 activates oncogenic MET signaling in FOXP2-overexpressing cells.
(A) Protein blot showing expression level of MET and AKT in RWPE-1 cells stably expressing FOXP2 or FOXP2-CPED1 treated with the control siRNA and siMET. Relative ratios of the intensities of the MET and p-AKT protein bands relative to the GAPDH band are shown bottom. CellTiter-Glo assay was performed to determine the growth of the corresponding RWPE-1 cells treated with the control siRNA and siMET, respectively, over a three-point time course. The data resulted from three independent experiments with four replicates per group. p-Values calculated by two-tailed Student’s t-test, mean ± SD; n = 3. (B) Celltiter-Glo assay was performed to test the effect of HA-tagged MET overexpression on the growth of PC3 prostate cancer cells stably expressing FOXP2 shRNA (two clones, #21 and #23). The data of representative experiments resulted from three independent experiments with four replicates per group. p-Values calculated by two-tailed Student’s t-test, mean ± SD; n = 3. Immunoblot showing exogenous expression of HA-tagged MET protein in PC3 cells stably expressing FOXP2 shRNA. (C) CUT&Tag identified binding site of FOXP2 in HGF. Representative track of FOXP2 at the HGF gene locus is shown. (D) CUT&Tag followed by PCR analysis verified FOXP2 occupancy at the MET and HGF in LNCaP cells. Schematic of primer sets (F1-R1 and F2-R1 for MET, F-R for HGF) used for PCR amplification. Nucleotide sequences of the DNA regions occupied by FOXP2 in the MET and HGF are shown. Negative control: samples not incubated with the primary antibody or incubated with nonspecific IgG. Positive control: genomic DNA from LNCaP cells.
-
Figure 3—figure supplement 1—source data 1
Uncropped blot for Figure 3—figure supplement 1A.
- https://cdn.elifesciences.org/articles/81258/elife-81258-fig3-figsupp1-data1-v2.zip
-
Figure 3—figure supplement 1—source data 2
Uncropped blot for Figure 3—figure supplement 1B.
- https://cdn.elifesciences.org/articles/81258/elife-81258-fig3-figsupp1-data2-v2.zip
-
Figure 3—figure supplement 1—source data 3
Uncropped gel for Figure 3—figure supplement 1D.
- https://cdn.elifesciences.org/articles/81258/elife-81258-fig3-figsupp1-data3-v2.zip
Figure 4 with 1 supplement
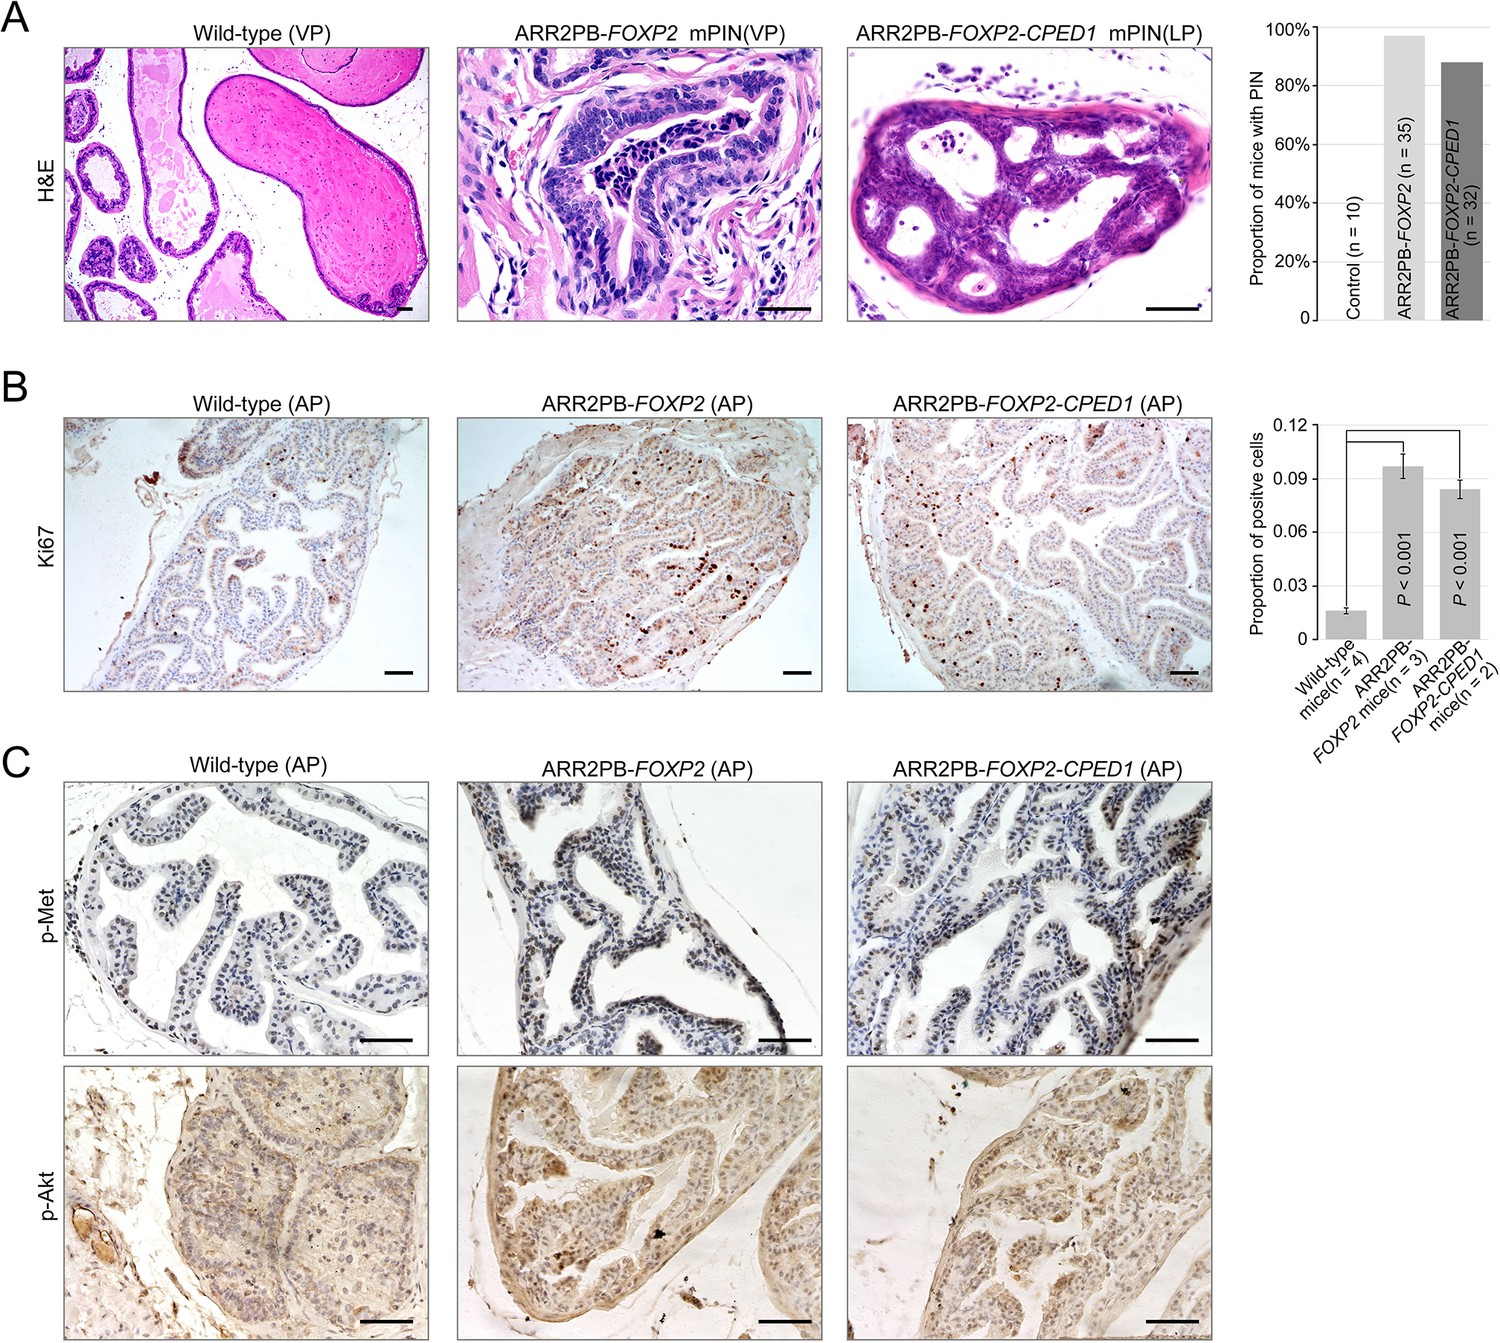
Prostate-specific overexpression of FOXP2 causes prostatic intraepithelial neoplasia.
(A) Histological images of prostatic intraepithelial neoplasia in ARR2PB-FOXP2 or ARR2PB-FOXP2-CPED1 mice (×200) compared to wild-type control (×40) (mice 14 mo of age). A bar graph showing the incidence of mPIN in transgenic mice at an average of 14 mo of age. See Supplementary file 1e for details. (B) Immunohistochemistry of Ki67 in prostate glands reveals a significant increase in proliferation for ARR2PB-FOXP2 or ARR2PB-FOXP2-CPED1 mice at 6 mo of age (×100). The bar graph shows the proportion of Ki67-positive cells per gland (mean ± SD) reported for at least three representative prostate glands per mouse. p-Values were calculated by two-tailed Student’s t-test. (C) Immunohistochemical analysis of Met (Y1234/1235) (upper) and Akt (S473) (lower) activity in prostate glands shows the upregulation of Met signaling in ARR2PB-FOXP2 and ARR2PB-FOXP2-CPED1 mice (×200).
Figure 4—figure supplement 1
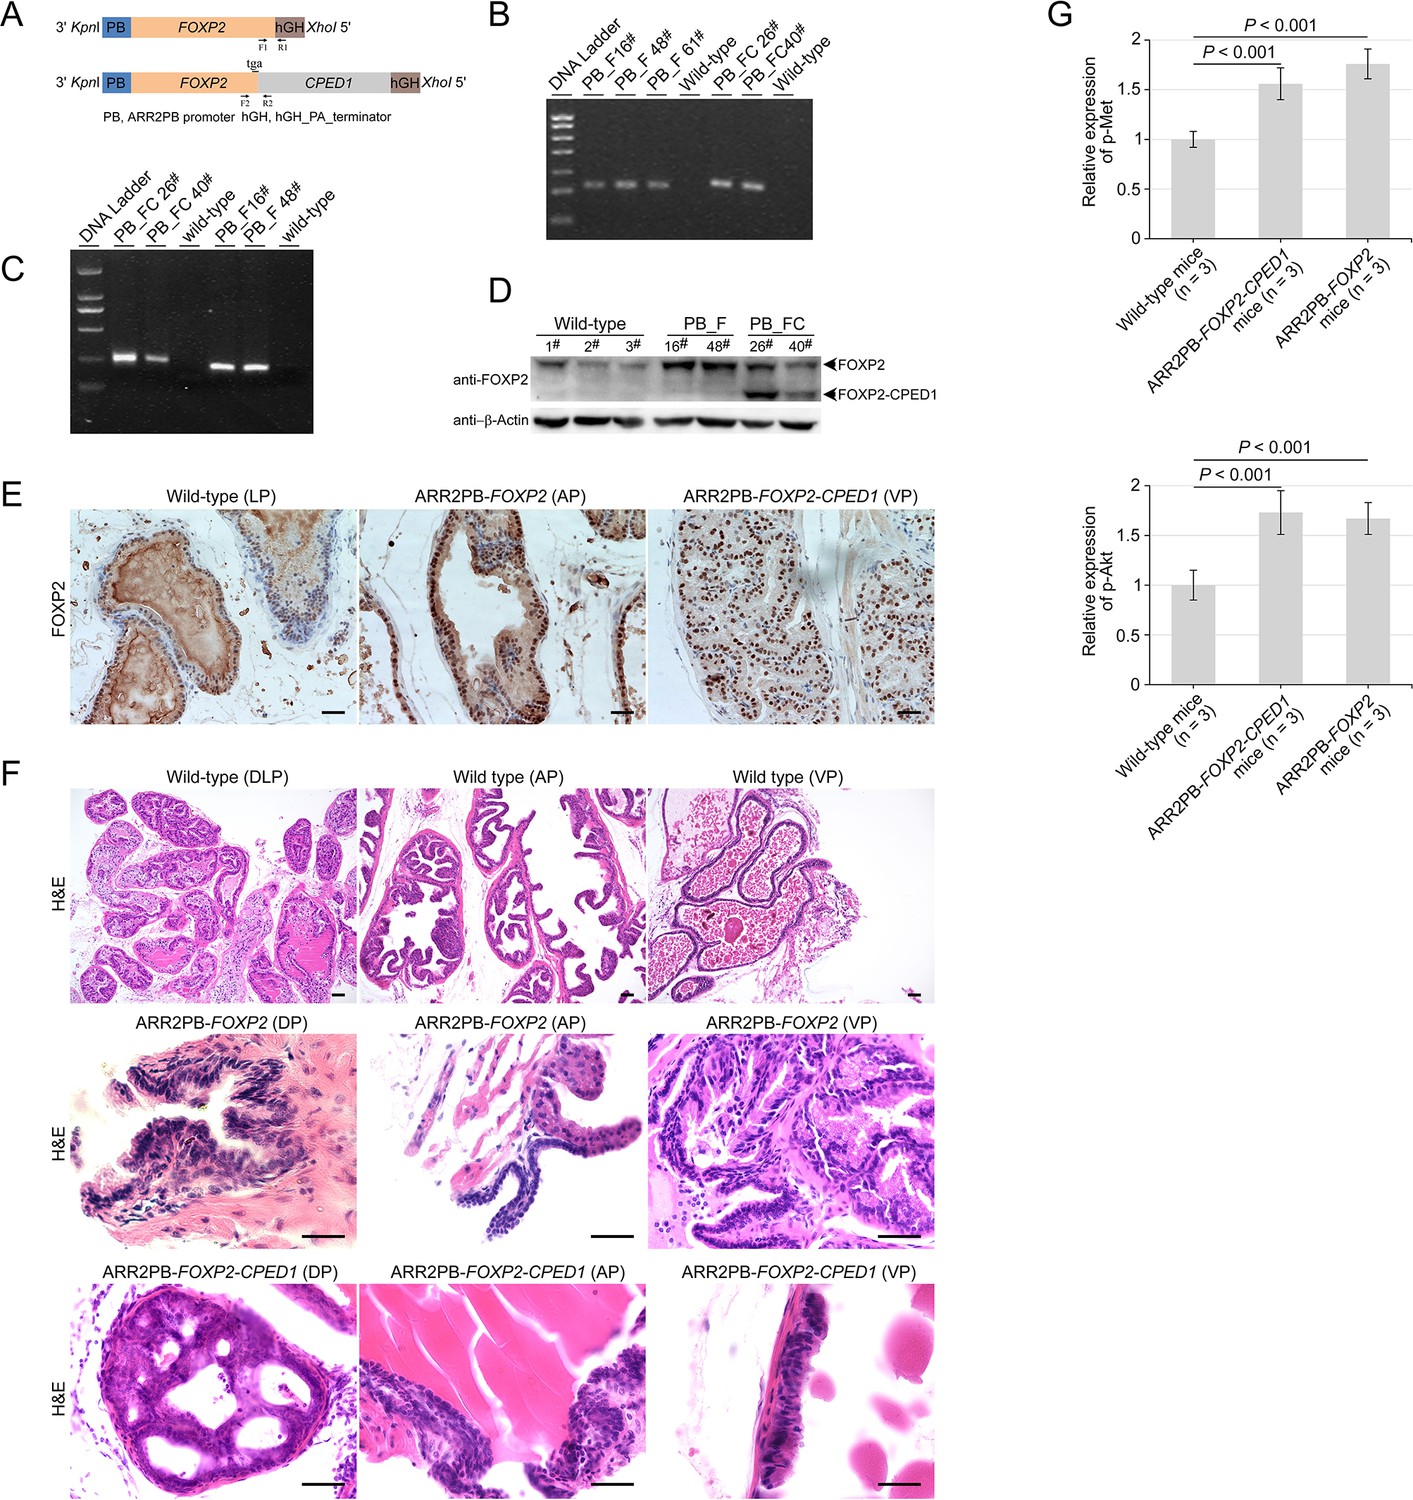
Generation of transgenic mice with prostate-specific expression of FOXP2 or FOPX2-CPED1.
(A) Schematic of the FOXP2 and FOPX2-CPED1 transgene constructs with a composite ARR2PB promoter and a hGH_PA_terminator. Identification of ARR2PB-FOXP2 or ARR2PB-FOXP2-CPED1 transgenic mice at genomic and mRNA levels by PCR and RT-PCR using primers (F1 and R1, or F2 and R2). (B) Genotyping of ARR2PB-FOXP2 or ARR2PB-FOXP2-CPED1 transgenic mice at genomic level using PCR. PB_F, ARR2PB-FOXP2; PB_FC, ARR2PB-FOXP2-CPED1. (C) Specific detection of the mRNA expression levels of FOXP2 or FOXP2-CPED1 in prostates from both transgenic mice by RT-PCR. (D) Detection of the protein abundance in prostates from transgenic mice and their littermate mice by immunoblot with an antibody against N terminus of FOXP2. (E) Immunohistochemical staining for FOXP2 or truncated FOXP2 staining in the indicated prostate glands from ARR2PB-FOPX2 and ARR2PB-FOPX2-CPED1 transgenic mice (×200), demonstrating markedly increased protein expression in transgenic mice. AP, anterior prostate; VP, ventral prostate. (F) Representative histological images of normal prostate glands in wild-type control mice (×40) and mPIN (×200) in ARR2PB-FOPX2 and ARR2PB-FOPX2-CPED1 transgenic mice at an average of 14 mo of age. mPIN, murine prostatic intraepithelial neoplasia; AP, anterior prostate; VP, ventral prostate; DP, dorsal prostate; DLP, dorsal-lateral prostate. (G) Bar graphs show semi-quantitative analysis of the expression of Met (Y1234/1235) (upper) and Akt (S473) (lower) for five prostate glands per mouse (three mice from each group) by Image-Pro Plus 6.0 software. p-Values were calculated by two-tailed Mann–Whitney U-test.
-
Figure 4—figure supplement 1—source data 1
Uncropped gel for Figure 4—figure supplement 1C.
- https://cdn.elifesciences.org/articles/81258/elife-81258-fig4-figsupp1-data1-v2.zip
-
Figure 4—figure supplement 1—source data 2
Uncropped blot for Figure 4—figure supplement 1D.
- https://cdn.elifesciences.org/articles/81258/elife-81258-fig4-figsupp1-data2-v2.zip
Author response image 1

A CellTiter-Glo assay was used to test the growth of HEK293 cells treated with the control siRNA and siFOXP2 (#2 5’- TGGACAGTCTTCAGTTCTA-3’, #3 5’-CCACCAATAACTCATCATT-3’) over a fourpoint time course.
Experiments were performed in triplicate and repeated five times with similar results. Inset, Protein blot showing knockdown of FOXP2 protein in cells. *P < 0.05 and **P < 0.01 by the MannWhitney U test, mean ± SD; n = 5.
Author response image 2
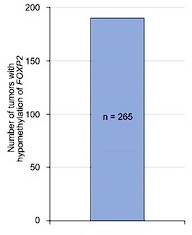
Methylation status of FOXP2 gene in tumors from COSMIC datasets.
Author response image 3

Celltiter-Glo assay showed that HA-tagged MET overexpression was able to partially rescue the cell growth of PC3 prostate cancer cells stably expressing FOXP2 shRNA (two clones, #21 and #23).
P values calculated by the Mann-Whitney U test, mean ± s.d.; n = 4. Immunoblot showing ectopic expression of HA-tagged MET protein in PC3 cells stably expressing FOXP2 shRNA.
Additional files
-
MDAR checklist
- https://cdn.elifesciences.org/articles/81258/elife-81258-mdarchecklist1-v2.pdf
-
Supplementary file 1
Details of the clinical information of the samples by RNA-seq, the fusion genes identified in this study, the gene set enrichment analyses conducted, the transgenic mouse prostates examined, and the primers used.
- https://cdn.elifesciences.org/articles/81258/elife-81258-supp1-v2.docx
-
Supplementary file 2
Correlation analyses in this study.
- https://cdn.elifesciences.org/articles/81258/elife-81258-supp2-v2.xlsx
Download links
A two-part list of links to download the article, or parts of the article, in various formats.
Downloads (link to download the article as PDF)
Open citations (links to open the citations from this article in various online reference manager services)
Cite this article (links to download the citations from this article in formats compatible with various reference manager tools)
FOXP2 confers oncogenic effects in prostate cancer
eLife 12:e81258.
https://doi.org/10.7554/eLife.81258


