A critical region of A20 unveiled by missense TNFAIP3 variations that lead to autoinflammation
- Sorbonne Université, Institut National de la Santé et de la Recherche Médicale (INSERM), "Maladies génétiques d’expression pédiatrique", France
- Département de Génétique Médicale, Hôpital Armand Trousseau, Assistance Publique-Hôpitaux de Paris, France
- Département de Médecine Interne et Immunologie Clinique, Normandie Univ, UNICAEN, UR4650 PSIR, CHU de Caen Normandie, France
- Service de chirurgie pédiatrique, CHU de Caen Normandie, France
Figures
Figure 1 with 1 supplement
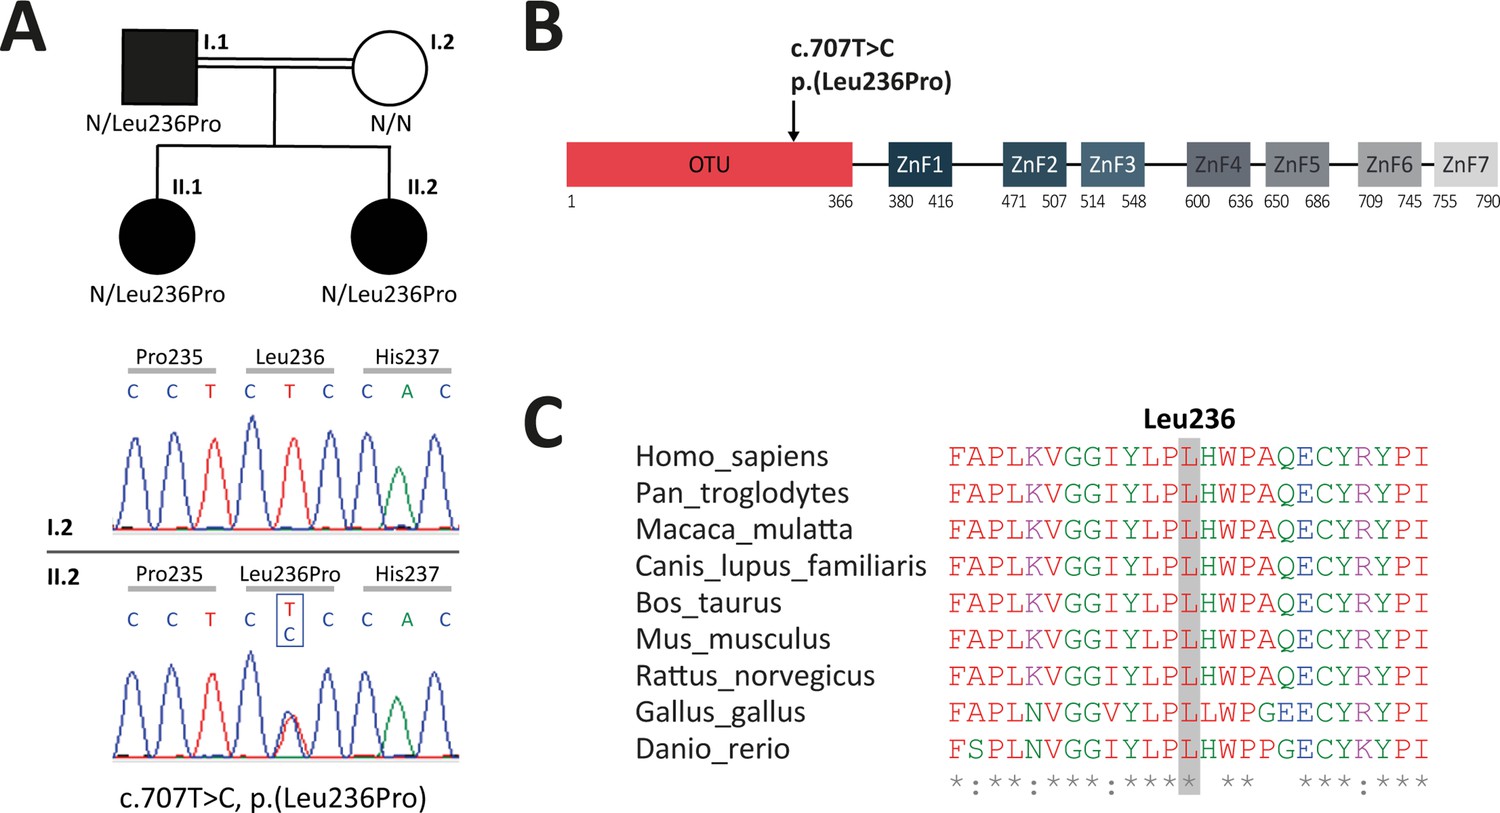
Analysis of familial segregation of the c.707T>C, p.(Leu236Pro) variation and its localization on A20 protein.
(A) Upper panel – genealogical tree of the patients with A20 haploinsufficiency (HA20) (individuals I.1, II.1, and II.2). Lower panel – electropherograms from Sanger sequencing showing the heterozygous c.707T>C, p.(Leu236Pro) variation in individual II.2 but not in her healthy mother (individual I.2). (B) Schematic representation of A20 with domain organization showing the ovarian tumor (OTU) domain harboring the p.(Leu236Pro) variation as well as the zinc finger (ZnF) domains. (C) Evolutionary conservation of the A20 Leu236 residue across species.
Figure 1—figure supplement 1

Genealogical tree and electropherograms from Sanger sequencing of the patients with A20 haploinsufficiency (HA20) (individuals I.1, II.1, and II.2) and the healthy individual I.2.
Electropherograms from Sanger sequencing showing the heterozygous c.707T>C, p.(Leu236Pro) variation in individuals I.1, II.1, and II.2 but not in the healthy individual I.2.
Figure 2
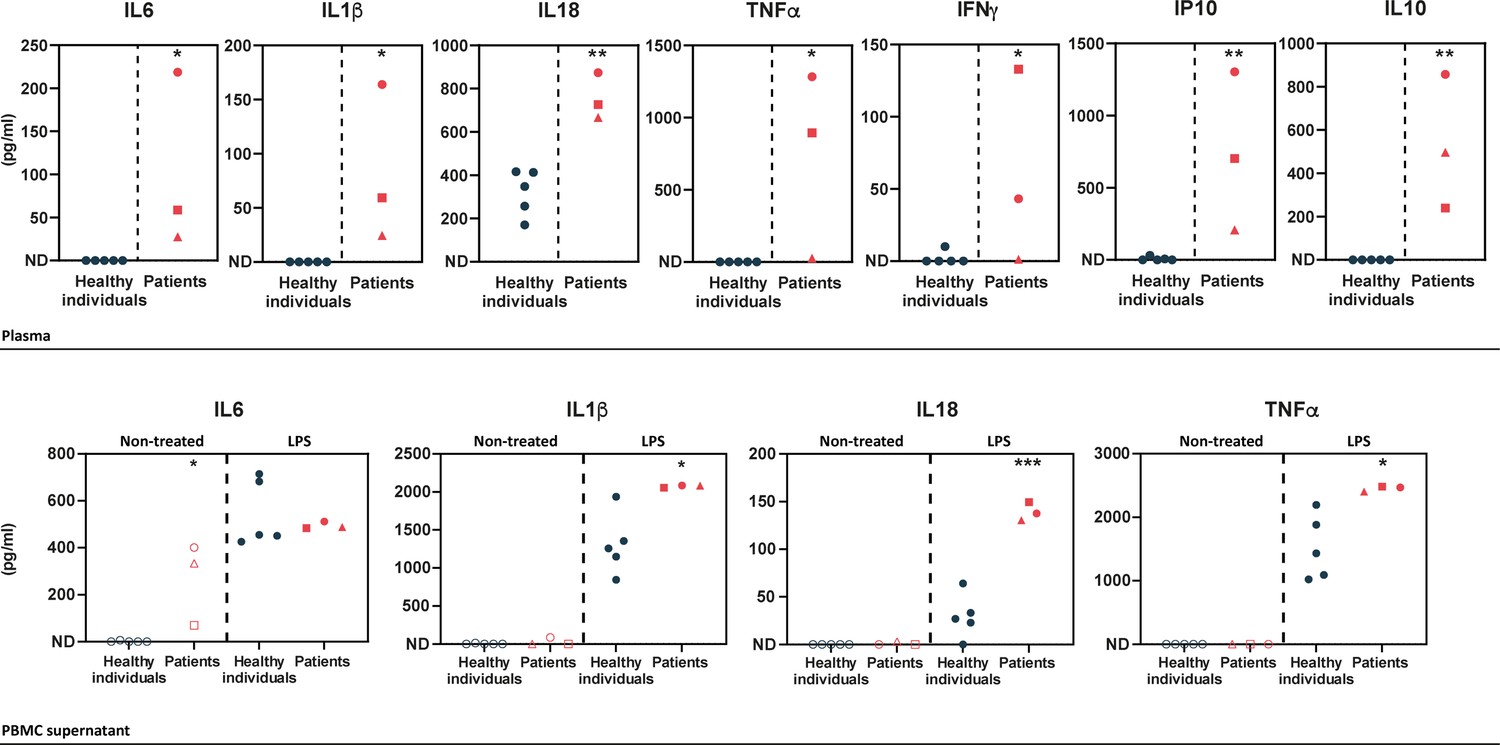
Upper panel – ELISA-assessed plasma cytokine levels in the patients (individual I.1: red square, individual II.1: red triangle, and individual II.2: red circle) and five healthy donors (blue circles).
Lower panel – ELISA-assessed cytokine levels in peripheral blood mononuclear cell (PBMC) supernatants prior to (empty symbols) and upon (filled symbols) LPS treatment (100 ng/mL for 16 hr) (individual I.1: red square, individual II.1: red triangle, and individual II.2 red circle, and five healthy donors: blue circles). ND: not detected. Unpaired two-tailed Student’s t-test was used and asterisks indicate that the mean of the cytokine levels quantified in samples from five healthy individuals is significantly different from the mean of the cytokine levels quantified in samples from the three patients. p-Values <0.05 were considered statistically significant. p-Values <0.05, <0.01, and <0.001 are indicated with *, **, and ***, respectively.
Figure 3
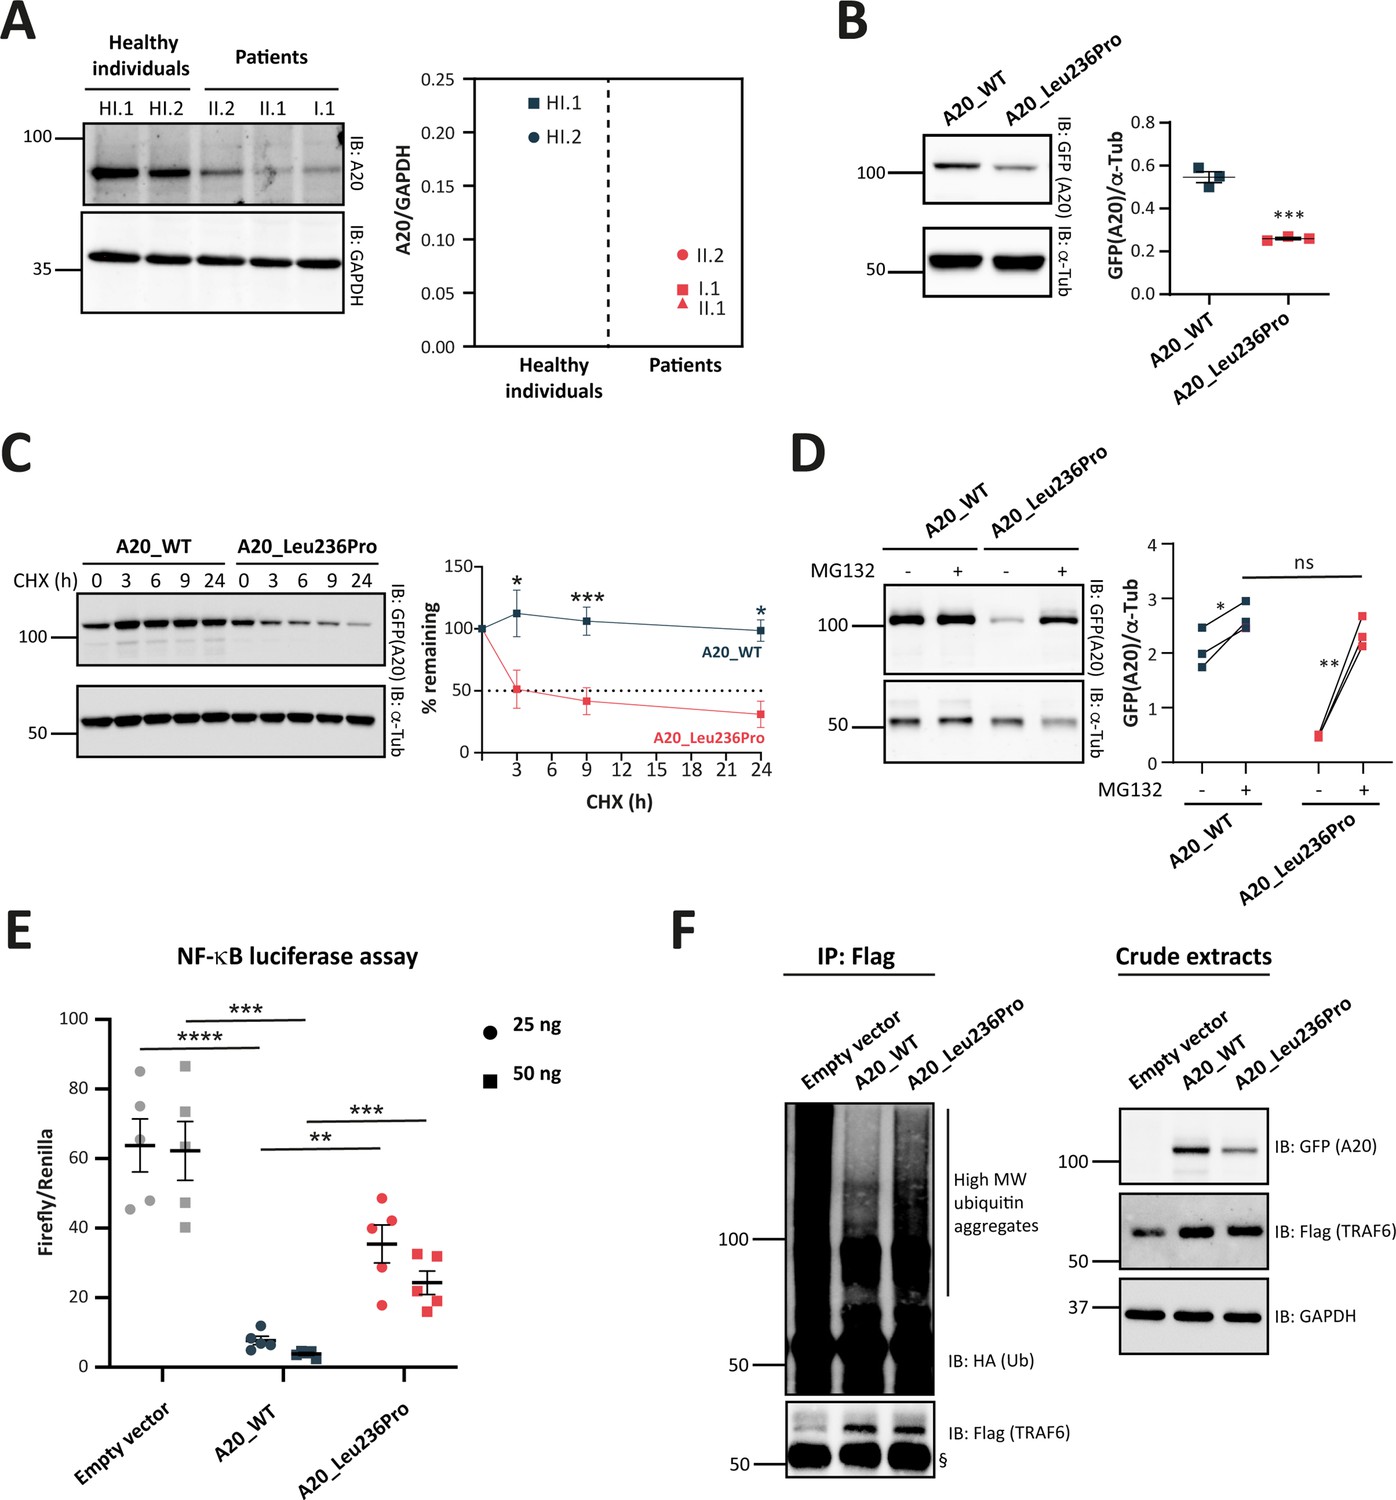
Evaluation of the pathogenicity of the A20_Leu236Pro variation through cell-based assays.
(A) A20 protein expression in peripheral blood mononuclear cells (PBMCs) of healthy individuals and individuals I.1, II.1, and II.2. (B) Steady-state protein levels of A20_WT and A20_Leu236Pro upon transient expression in HEK293T (n=3, p-value = 0.0004). (C) Protein levels of A20_WT and A20_Leu236Pro upon transient expression in HEK293T and treatment with cycloheximide (100 μg/mL) at the indicated time points. (n=3, p-value = 0.0158, 0.0008, and 0.026 for time points 3, 9, and 24 hr, respectively). (D) Protein levels of A20_WT and A20_Leu236Pro upon transient expression in HEK293T and treatment with MG132 (20 μM – 5 hours) (+) or without MG132 (-) and with DMSO (n=3, p-values for (A20_WT-DMSO vs -MG132), (A20_Leu236Pro-DMSO vs -MG132), and (A20_WT-MG132 vs A20_Leu236Pro-MG132)=0.037, 0.006, and 0.125, respectively). (E) Quantification of the NF-κB signaling in HEK293T cells transiently expressing 25 or 50 ng of empty vector, A20_WT or A20_Leu236Pro. Cells were treated with 10 ng/mL TNFα for 5 hr. Firefly luciferase activity was normalized to the Renilla signal (n=5), p-values for (A20_WT vs Empty vector – 25 ng), (A20_WT vs A20_Leu236Pro – 25 ng), (A20_WT vs Empty vector – 50 ng), (A20_WT vs A20_Leu236Pro – 50 ng) are <0.0001, = 0.0011, = 0.0001, and = 0.0003, respectively. (F) Ubiquitination profile of A20 target TRAF6 (flag-tagged) upon co-expression with GFP-vector, GFP-tagged A20_WT, or A20_Leu236Pro together with HA-K63Ub. Flag-TRAF6 was immunoprecipitated from protein lysates using the ANTI-FLAG M2 Magnetic beads and high molecular weight ubiquitin aggregates were revealed by immunoblotting of precipitates with HA-specific antibody. The § sign indicates the antibody heavy chain. The expression of the proteins in the crude extracts is shown to the right. This experiment is representative of a set of three experiments performed independently. For all western blot experiments, equal amounts of protein extracts were subjected to SDS-PAGE and immunoblotted with the indicated antibodies. The A20 or GFP (the TNFAIP3-expressing plasmid used is pEGFP-C1-A20) signal was quantified with ImageJ software and normalized to the amount of GAPDH or α-tubulin used as a loading control. For (A, B, C, D, and E), unpaired two-tailed Student’s t-test was used and asterisks indicate that the mean is significantly different; p-values <0.05 were considered statistically significant. p-Values <0.05, <0.01, <0.001, and <0.0001 are indicated with *, **, ***, and ****, respectively. Data are plotted with SEM error bars.
-
Figure 3—source data 1
A20 protein expression in peripheral blood mononuclear cells (PBMCs) of healthy individuals and individuals I.1, II.1, and II.2.
Uncropped western blot images of A20 and GAPDH protein expression in PBMCs of the patients and healthy individuals.
- https://cdn.elifesciences.org/articles/81280/elife-81280-fig3-data1-v1.pdf
-
Figure 3—source data 2
Protein levels of A20_WT and A20_Leu236Pro upon transient expression in HEK293T.
Uncropped western blot images of GFP-A20 and α-tubulin protein expression (n=4).
- https://cdn.elifesciences.org/articles/81280/elife-81280-fig3-data2-v1.pdf
-
Figure 3—source data 3
Protein levels of A20_WT and A20_Leu236Pro upon transient expression in HEK293T and treatment with cycloheximide.
Uncropped western blot images of GFP-A20 and α-tubulin protein expression (n=3).
- https://cdn.elifesciences.org/articles/81280/elife-81280-fig3-data3-v1.pdf
-
Figure 3—source data 4
Protein levels of A20_WT and A20_Leu236Pro upon transient expression in HEK293T and treatment with MG132.
Uncropped western blot images of GFP-A20 and α-tubulin protein expression (n=3).
- https://cdn.elifesciences.org/articles/81280/elife-81280-fig3-data4-v1.pdf
-
Figure 3—source data 5
Ubiquitination profile of Flag-TRAF6 upon expression of A20_WT or A20_Leu236Pro.
Uncropped western blot images of Flag immunoprecipitated samples (HA-ubiquitin and Flag-TRAF6) and crude extracts: GFP-A20, Flag-TRAF6, and GAPDH (n=3).
- https://cdn.elifesciences.org/articles/81280/elife-81280-fig3-data5-v1.pdf
Figure 4
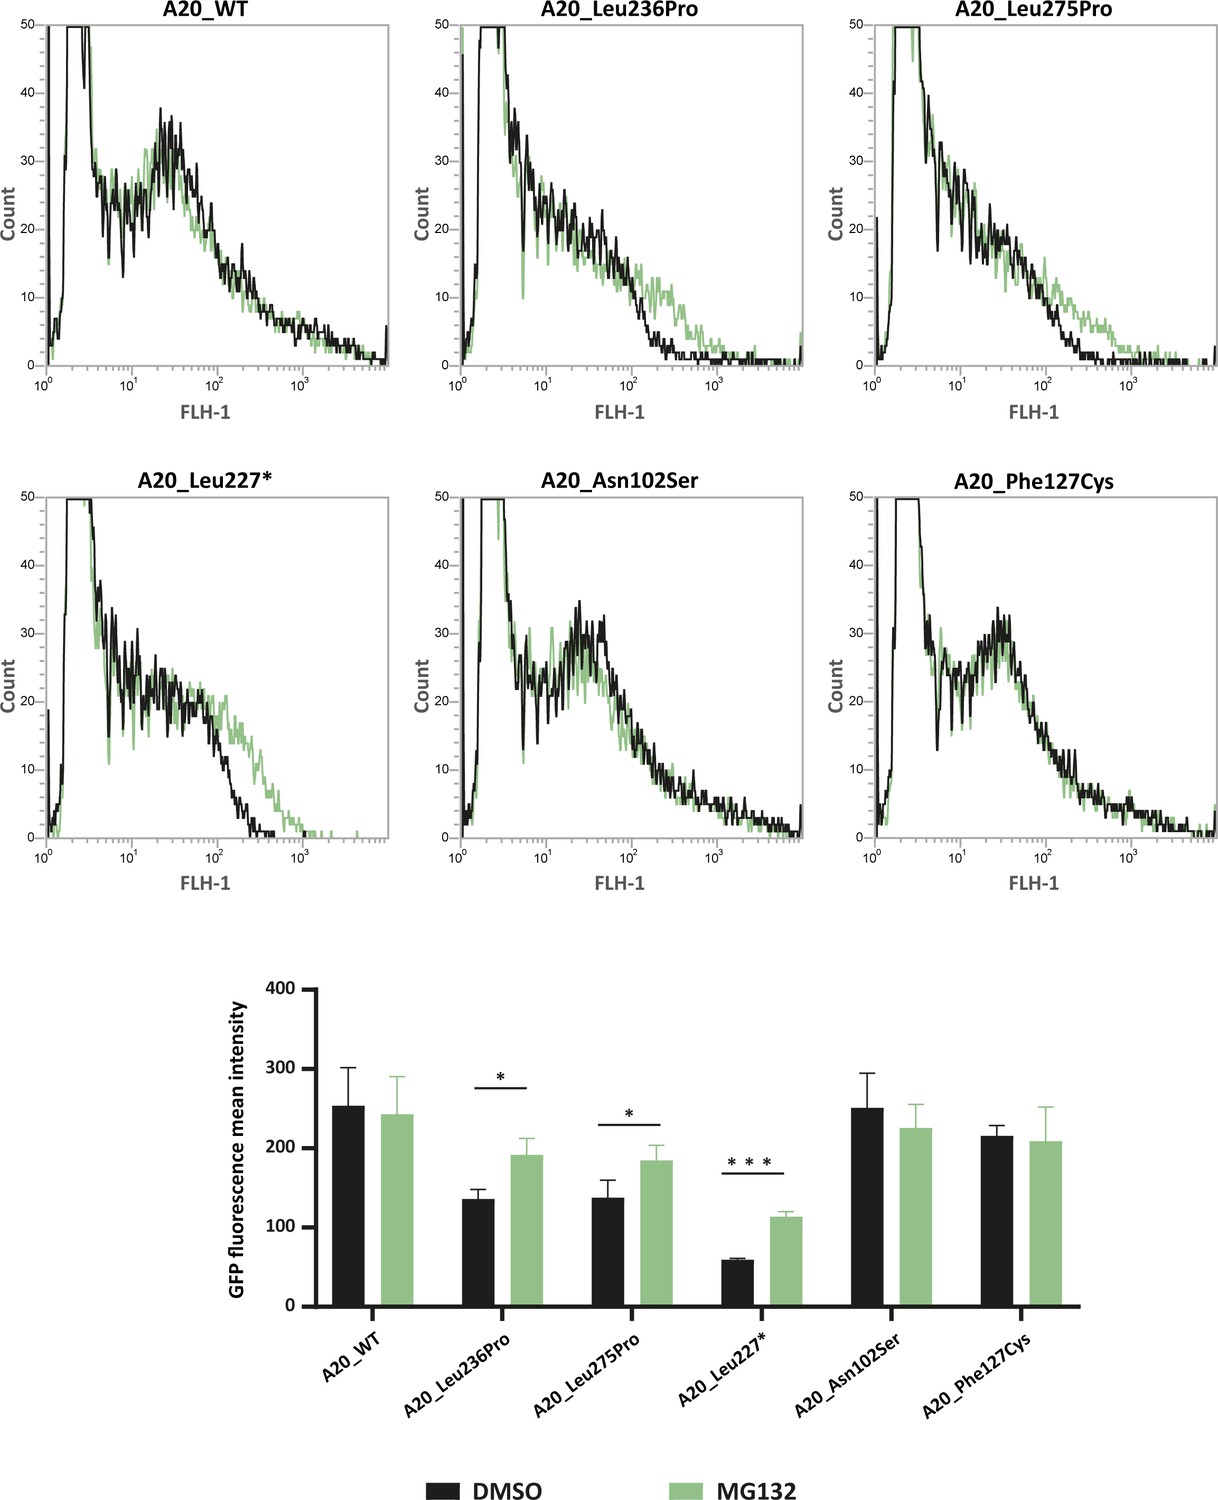
Flow cytometry quantification of green fluorescent protein (GFP) intensity in protein extracts from HEK293T cells expressing GFP-tagged A20_WT or A20 variants treated with DMSO or MG132 (20 μM – 5 hr).
Representative fluorescence-activated cell sorting (FACS) profiles (counts versus FLH-1 – CyflowCube 6) are shown and the mean fluorescence values from A20 samples ± SEM are represented in the histograms (n=3). Unpaired two-tailed Student’s t-test was used and asterisks indicate that the mean is significantly different; p-values <0.05 were considered statistically significant. p-Values <0.05 and <0.001 are indicated with * and ***, respectively.
-
Figure 4—source data 1
Raw data of flow cytometry analysis of GFP-A20_WT and GFP-tagged A20 variants (Experiment 1).
- https://cdn.elifesciences.org/articles/81280/elife-81280-fig4-data1-v1.pdf
-
Figure 4—source data 2
Raw data of flow cytometry analysis of GFP-A20_WT and GFP-tagged A20 variants (Experiment 2).
- https://cdn.elifesciences.org/articles/81280/elife-81280-fig4-data2-v1.pdf
-
Figure 4—source data 3
Raw data of flow cytometry analysis of GFP-A20_WT and GFP-tagged A20 variants (Experiment 3).
- https://cdn.elifesciences.org/articles/81280/elife-81280-fig4-data3-v1.pdf
Figure 5
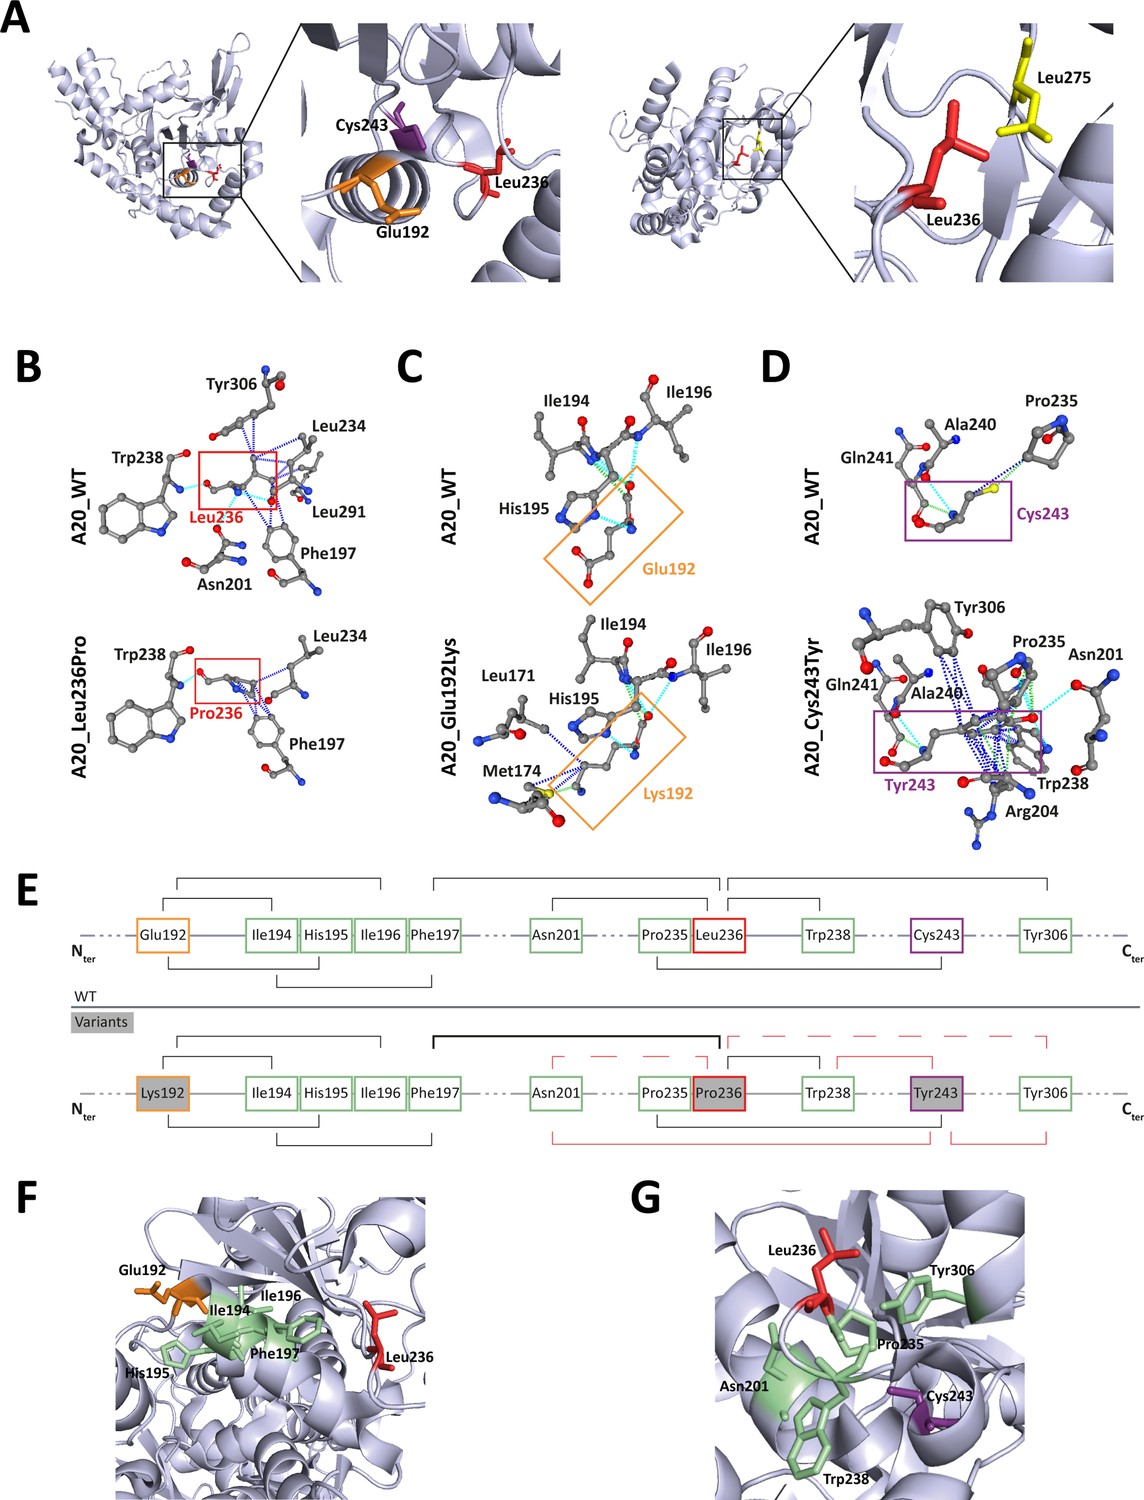
Localization and interactions of amino acids involved in A20 variants.
(A) Amino acids Leu236 (red), Glu192 (orange), and Cys243 (purple) are placed on the crystal structure of the ovarian tumor (OTU) domain of A20 using the 3zjd crystal available of PDB and PyMol software. (B, C, D) Prediction of the amino acid interactions in A20_WT or A20 variant proteins established by (B) Leu236 (upper panel) or Pro236 (lower panel), (C) Glu192 (upper panel) or Lys192 (lower panel), (D) Cys243 (upper panel) or Tyr243 (lower panel), using the 3zjd crystal available of PDB and the PremPS in silico prediction tool. Oxygen atoms are represented in red; nitrogen atoms are represented in blue; the remaining atoms are in gray. The interactions are shown in dotted lines: hydrophobic (dark blue), polar (turquoise blue), and Van der Waals (green). (E) Schematic representation of the predicted amino acid interactions in A20_WT (upper panel) and the variant protein (lower protein). The amino acids involved in pathogenic variations are: Glu192 (orange frame), Leu236 (red frame), and Cys243 (purple frame). On the lower panel, the variant counterpart is represented in gray background and changes in amino acid interactions compared to A20_WT are represented in red: full lines represent newly formed interaction, dotted lines represent the loss of an interaction compared to A20_WT, the thicker line represents a higher number of possible interactions. (F, G) Amino acids are placed on the crystal structure of the OTU domain of A20 using the 3zjd crystal available of PDB and PyMol software: residues not affected by variations are shown in light green, Glu192 is shown in orange, Leu236 in red. and Cys243 in purple. In (F), the helix formed by amino acids 111–149 is hidden to allow for better graphical representation of the amino acids of interest.
Tables
Table 1
Phenotypic features of individuals I.1, II.1, and II.2 carrying the heterozygous TNFAIP3 variation c.707T>C (p.Leu236Pro).
| Individual | I.1 | II.1 | II.2 |
|---|---|---|---|
| Gender | M | F | F |
| Current age | 38 | 15 | 13 |
| Age at onset | 15 years | 5 years | 15 months |
| Recurrent fever | Yes | Yes | Yes |
| CRP (mg/L) | 15 | 7 | 7 |
| Ulcers | Oral, genital | Oral, genital (rare) | Oral, genital (rare) |
| Gastrointestinal | Abdominal pain, diarrhea, colonic ulcerations | Abdominal pain, diarrhea | Abdominal pain, diarrhea |
| Musculoskeletal | Myalgia – oligoarthralgia (knee or ankle) | No | Asymmetric oligoarthralgia (large joints) |
| Skin | Folliculitis | Acne, folliculitis | Folliculitis |
| Ocular | Episcleritis – anterior uveitis | No | No |
| Cardiovascular | No | No | No |
| Hepatic | No | No | No |
| Treatment | Colchicine – corticosteroids – azathioprine | Colchicine | Colchicine |
| CRP: C-reactive protein |
Table 2
Patients’ phenotype and molecular features associated with the c.707T>C, p.(Leu236Pro) and all the TNFAIP3 missense variations reported in the literature.
| Molecular TNFAIP3 (NM_006290) anomaly | c.707T>C, p.(Leu236Pro) | c.305A>G, p.(Asn102Ser) | c.386C>T, p.(Thr129Met) | c.574G>A, p.(Glu192Lys) | c.728G>A, p.(Cys243Tyr) | c.824T>C, p.(Leu275Pro) | c.929T>C, p.(Ile310Thr) | c.1129G>A, p.(Val377Met) | c.1428G>A, p.(Met476Ile) | c.1639G>A, p.(Ala547Thr) | c.1804A>T, p.(Thr602Ser) | c.1939A>C, p.(Thr647Pro) | c.2126A>G, p.(Gln709Arg) | |
|---|---|---|---|---|---|---|---|---|---|---|---|---|---|---|
| Reference | Current study | Chen et al., 2020b | Aslani et al., 2022 | Kadowaki et al., 2021 | Shigemura et al., 2016 | Aslani et al., 2022 | Kadowaki et al., 2021 | Niwano et al., 2022 | Dong et al., 2019 | Tian et al., 2022 | Jiang et al., 2022 | Mulhern et al., 2019 | Kadowaki et al., 2021 | |
| Domain | OTU | OTU | OTU | OTU | OTU | OTU | OTU | Between OTU and Znf1 | Znf2 | Znf3 | Znf4 | Between Znf4 and Znf5 | Znf6 | |
| HA20 hallmark features of the index case | Age at onset | 15 months | 15 years | 4 months | 11 months | 9 years | 3 months | 12 years | 20 years | 13 years | 18 years | Before 32 months | 6 months | 12 years |
| Recurrent fever | Yes | No | Yes& | Yes | Yes | Yes | Yes | Yes | Yes | Yes | Yes | No | No | |
| Ulcers | Oral and genital (rare) | Oral and gastrointestinal | No | Aphthous stomatitis | Oral, genital and gastrointestinal | No | Gastrointestinal | No | Oral and gastrointestinal | Oral and genital | Oral, genital, and gastrointestinal | Oral (occasional) | No | |
| Family segregation | Sister and father carrying the variation and presenting HA20 symptoms | Father and brother carry the variation and suffer from recurrent fever and oral ulcers – milder symptoms | No family history | Father carries the variation with recurrent stomatitis, folliculitis, and hemorrhoids | Mother and three other family members carry the variation and suffer from ulcers | No family history – de novo variation | Mother carries the variation, no symptoms | Mother and brother with same symptoms – no genetic analysis | Mother carries the variation and shows milder symptoms | Mother and sisters carry the variation and suffer from isolated oral ulcers | Mother and brother carry the variation and suffer from oral ulcers | Mother and sister carry the variation and are (mildly) symptomatic | Father carries the variation, no symptoms | |
| Treatment | Colchicine (partial response) | Glucocorticoids and thalidomide (less frequent and less severe symptoms) | Etoposide, oral dexamethasone, and cotrimoxazole (deceased from cerebral hemorrhage) | Corticosteroids (variable response) | Colchicine (unsuccessful) Corticosteroids (successful) | Anti-TNFα (successful) | Colchicine (no response), NSAIDs and corticosteroids (partial response), infliximab +methotrexate (successful) | Colchicine (no response), corticosteroids +TNFα inhibitors (successful) | Acyclovir and corticosteroids (transient improvement) | Corticosteroids, methotrexate, and thalidomide. Tacrolimus and leflunomide (successful) | Colchicine and corticosteroids | Corticosteroids and immunosuppressors (cyclophosphamide) (unsuccessful) – Jak1/2 inhibitors (considerable improvement) | Corticosteroids | |
| Variation characteristics | GnomAD (v2.1.1) | Absent | 3482/281824 (6,3% in Latino population) | 4/282896 | Absent | Absent | Absent | 3/282356 | 10/251,490 | Absent | Absent | Absent | 511/282864 | Absent |
| CADD score (GRCh37-v1.6) | 29.5 | 25.8 | 25.8 | 32 | 25.9 | 31 | 22.6 | 0.001 | 28 | 8.432 | 2.206 | 14.1 | 14.12 | |
| Conservation | Highly conserved | Highly conserved | Partially conserved | Highly conserved | Highly conserved | Highly conserved | Partially conserved | Poorly conserved (met in several species) | Highly conserved | Poorly conserved | Partially conserved | Poorly conserved | Partially conserved | |
| PremPS predicted ΔΔG (kcal/mol) | 1.82 | 0.78 | –0.38 | 0.65 | 0.05 | 1.80 | 1.01 | na | na | na | na | na | na | |
| Functional consequence | Reduced A20 expression (in vitro and patient’s samples) and reduced NF-κB inhibition, decrease of deubiquitinase activity (in vitro)* | Reduced NF-κB inhibition (in vitro)* | Reduced A20 expression and reduced NF-κB inhibition (in vitro)* | Reduced A20 expression (in vitro) data from the current study | Reduced A20 expression – Inhibition of NF-κB was comparable to that of the wild-type (in vitro)* | Enhanced phosphorylation of NF-κB p65, reduced A20 expression, and attenuated phosphorylation of A20 in patient’s samples* | Decreased A20 expression, NF-κB pathway overactivation, and synthesis of TNF-α was upregulated in patient-derived cells* | Increased IκBα degradation and p65 phosphorylation in patient’s samples and in vitro (THP-1 cells)* | Altered NEMO ubiquitination in patients’ samples – reduced NF-kB inhibition (in vitro) (Kadowaki et al., 2021)* | Inhibition of NF-κB was comparable to that of the wild-type (in vitro)* | ||||
| Pathogenic significance§ | Likely pathogenic | Benign | Uncertain significance | Likely pathogenic | Likely pathogenic | Pathogenic | Uncertain significance | Uncertain significance | Uncertain significance | Uncertain significance | Likely pathogenic | Likely benign | Likely benign | |
| GnomAD: Genome Aggregation Database, CADD: Combined Annotation-Dependent Depletion, na: not applicable $: according to the papers reporting the variation: c.305A>G, p.(Asn102Ser) (Chen et al., 2020a); c.386C>T, p.(Thr129Met) and c.824T>C, p.(Leu275Pro) (Aslani et al., 2022), c.574G>A, p.(Glu192Lys), c.929T>C, p.(Ile310Thr) and c.2126A>G, p.(Gln709Arg) (Kadowaki et al., 2021), c.728G>A, p.(Cys243Tyr) (Shigemura et al., 2016), c.1428G>A, p.(Met476Ile) (Dong et al., 2019), c.1129G>A, p.(Val377Met) (Niwano et al., 2022), c.1639G>A, p.(Ala547Thr) (Tian et al., 2022), c.1804A>T, p.(Thr602Ser) (Jiang et al., 2022) and c.1939A>C, p.(Thr647Pro) (Mulhern et al., 2019); §: according to the ACMG criteria for pathogenicity (Richards et al., 2015). | ||||||||||||||
-
GnomAD: Genome Aggregation Database, CADD: Combined Annotation-Dependent Depletion, na: not applicable.
-
*
according to the papers reporting the variation: c.305A>G, p.(Asn102Ser) (Chen et al., 2020a); c.386C>T, p.(Thr129Met) and c.824T>C, p.(Leu275Pro) (Aslani et al., 2022), c.574G>A, p.(Glu192Lys), c.929T>C, p.(Ile310Thr) and c.2126A>G, p.(Gln709Arg) (Kadowaki et al., 2021), c.728G>A, p.(Cys243Tyr) (Shigemura et al., 2016), c.1428G>A, p.(Met476Ile) (Dong et al., 2019), c.1129G>A, p.(Val377Met) (Niwano et al., 2022), c.1639G>A, p.(Ala547Thr) (Tian et al., 2022), c.1804A>T, p.(Thr602Ser) (Jiang et al., 2022) and c.1939A>C, p.(Thr647Pro)(Mulhern et al., 2019).
Additional files
Download links
A two-part list of links to download the article, or parts of the article, in various formats.
Downloads (link to download the article as PDF)
Open citations (links to open the citations from this article in various online reference manager services)
Cite this article (links to download the citations from this article in formats compatible with various reference manager tools)
A critical region of A20 unveiled by missense TNFAIP3 variations that lead to autoinflammation
eLife 12:e81280.
https://doi.org/10.7554/eLife.81280


