Pancreatic tumors exhibit myeloid-driven amino acid stress and upregulate arginine biosynthesis
- Ben May Department for Cancer Research, University of Chicago, United States
- Metabolomics Platform, Comprehensive Cancer Center, University of Chicago, United States
- Cellular and Molecular Biology Program, University of Michigan-Ann Arbor, United States
- Department of Radiation Oncology, University of Michigan, United States
- Department of Molecular and Integrative Physiology, University of Michigan-Ann Arbor, United States
- Department of Pathology, University of Chicago, United States
Figures
Figure 1 with 3 supplements
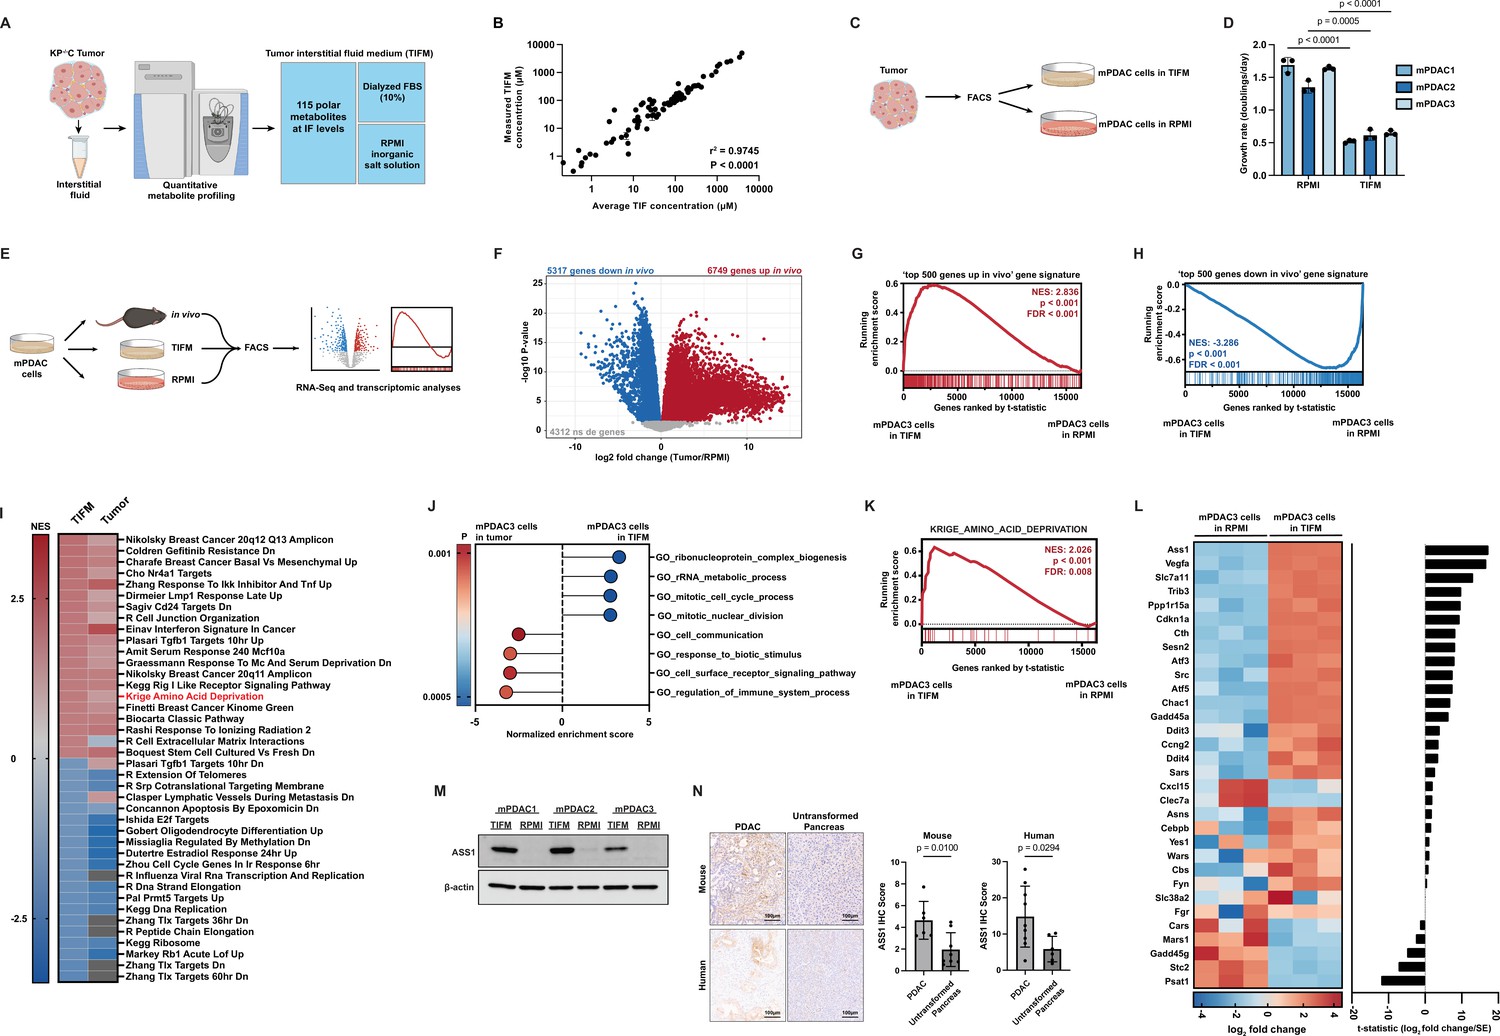
Culturing pancreatic ductal adenocarcinoma (PDAC) cells in physiological nutrients levels better recapitulates the transcriptomic profile of cancer cells in the tumor microenvironment, including changes in expression of arginine metabolism genes.
(A) Diagram of the Tumor Interstitial Fluid Medium (TIFM) formulation. (B) Scatter plot of liquid chromatography–mass spectrometry (LC–MS) measurements of metabolite concentrations in TIFM (n = 6) plotted against expected concentrations of the metabolite in TIFM (average concentration of the given metabolite in mouse PDAC TIF). The values represent the mean of LC–MS measurements, and the error bars represent ± standard deviation (SD). r2 and p-value were determined by Pearson correlation. (C) Diagram of the generation of paired PDAC cell lines grown in TIFM or in RPMI isolated from mouse PDAC tumors. PDAC tumors were used for the interstitial fluid (IF) measurements on which the TIFM formulation is based. (D) Cell proliferation rate of paired murine PDAC (mPDAC) cell lines grown in TIFM or RPMI (n = 3). The values represent the mean and the error bars represent ± SD. Statistical significance was calculated using a two-tailed Student’s t test. (E) Diagram of workflow for the transcriptomic comparison of mPDAC3-TIFM cells grown in TIFM (n = 3), RPMI (n = 3), or as orthotopic allograft murine tumors (n = 6). mPDAC cells from each condition were isolated by fluorescence-activated cell sorting (FACS) and RNA was isolated for transcriptomic analysis by next generation sequencing. (F) Volcano plot of differentially expressed genes (DEGs) between mPDAC3-TIFM cells growing in vivo versus cultured in RPMI (Tumor/RPMI). Blue: downregulated genes in tumors with adjusted p < 0.05. Red: upregulated genes in vivo with adjusted p < 0.05. Gray: genes with adjusted p > 0.05. Adjusted p-value was calculated using Limma with the Benjamini and Hochberg false discovery rate method (Benjamini and Hochberg, 1995). (G, H) Gene Set Enrichment Analysis (GSEA) of transcriptomic data from mPDAC3 cells cultured in TIFM versus mPDAC3 cells cultured in RPMI using custom gene sets generated from DEG analysis in (F) (see Materials and methods for details on custom gene sets). Genes are ranked by t-statistic metric for differential expression between TIFM and RPMI cultured mPDAC3-TIFM cells calculated with limma. The top segment of this plot shows the running enrichment score for the gene set as the analysis progresses down the ranked list. The bottom section shows where each member of the gene set as it appears in the ranked gene list. (I) (left column) Heatmap of normalized enrichment scores (NES) for top 40 enriched or depleted gene sets from MsigDB curated gene set (C2) collection in mPDAC3-TIFM cells cultured in TIFM versus mPDAC3 cells cultured in RPMI. (right column) NES for these gene sets in mPDAC3-TIFM cells grown in vivo versus in RPMI. Gray boxes represent gene sets not differentially enriched between conditions. (J) Main cellular processes differentially expressed in mPDAC3-TIFM cells grown TIFM versus in vivo (TIFM/in vivo) as determined by GSEA analysis with MsigDB Gene ontology (GO)-based (C5) gene set collection. Only gene sets with an nMoreExtreme = 0 were considered in this analysis. Many GO gene sets have overlapping members and enrichment scores driven by the same set of differentially expressed genes. Therefore, we selected the largest gene sets containing these differentially expressed genes for display. (K) GSEA analysis of the MsigDB Krige_Amino_Acid_Deprivation signature in mPDAC3-TIFM cells cultured in TIFM versus in RPMI. (L) (left) Row-scaled heatmap of the log2 fold change of trimmed mean of M values (TMM) normalized gene counts for Krige_Amino_Acid_Deprivation genes in mPDAC3-TIFM cells cultured in TIFM versus RPMI. (right) t-Statistic metric for differential expression calculated with limma for expression of indicated genes between mPDAC3-TIFM cells cultured in TIFM versus RPMI. (M) Immunoblot analysis of ASS1 in mPDAC cell lines grown in TIFM or RPMI as indicated. (N) (left) Representative images of immunohistochemical (IHC) staining for ASS1 in KrasLSL-G12D; Trp53fl/fl; Ptf1aCreER murine PDAC tumors (n = 6) and untransformed murine pancreas (n = 8) as well as in human PDAC tumors (n = 9) and untransformed human pancreas (n = 6). Scale bar: 100 µm. (right) IHC scores were calculated as described in Materials and methods. Regions of ductal epithelial cells (for untransformed pancreas) and malignant (for PDAC tumors) cells were annotated for this analysis. Statistical significance was calculated using a two-tailed Student’s t test.
-
Figure 1—source data 1
Table of differentially expressed genes between mPDAC3-TIFM cells isolated from orthotopic tumors (in vivo) versus cultured in RPMI (RPMI) and generated by limma analysis of transcriptomic data.
logFC(in vivo/RPMI) and t-statistic (t) outputs from limma are reported in this table.
- https://cdn.elifesciences.org/articles/81289/elife-81289-fig1-data1-v2.xlsx
-
Figure 1—source data 2
Table of the top 40 differentially enriched MSigDB curated gene sets (C2 collection) between mPDAC3-TIFM cells cultured in TIFM (TIFM) and mPDAC3-TIFM cells cultured in RPMI (RPMI) as shown in Figure 1I.
Normalized enrichment scores (TIFM-RPMI_NES column). Positive NES scores indicate higher enrichment in TIFM cultured cells, negative NES scores indicate enrichment in RPMI. Normalized enrichment scores for the same gene sets are also shown for differential expression analysis of mPDAC3-TIFM cells isolated from orthotopic tumors (in vivo) versus cultured in RPMI (RPMI) (In_vivo-RPMI_NES column).
- https://cdn.elifesciences.org/articles/81289/elife-81289-fig1-data2-v2.xlsx
-
Figure 1—source data 3
Table of Gene Set Enrichment Analysis (GSEA) using Gene ontology (GO)-based signatures (MSigDB C5) on differential expression data from mPDAC3-TIFM cultured in Tumor Interstitial Fluid Medium (TIFM) versus isolated from orthotopic tumors (in vivo).
Positive NES scores indicate higher enrichment in TIFM cultured cells, negative NES scores indicate enrichment in cells isolated from tumors.
- https://cdn.elifesciences.org/articles/81289/elife-81289-fig1-data3-v2.xlsx
-
Figure 1—source data 4
Full unedited immunoblots (left) and full immunoblots with sample and band identification (right) for immunoblots shown in Figure 1M.
Raw image files also included.
- https://cdn.elifesciences.org/articles/81289/elife-81289-fig1-data4-v2.zip
Figure 1—figure supplement 1

Murine pancreatic ductal adenocarcinoma (mPDAC) cells cannot proliferate in Tumor Interstitial Fluid Medium (TIFM) after long-term culture in RPMI.
mPDAC cells were isolated from a mouse pancreatic ductal adenocarcinoma (PDAC) tumor and cultured directly in TIFM or RPMI. After long-term culture (>1 month) in either media condition, cells were plated into the other media (i.e., cells grown in TIFM were subsequently cultured in RPMI and cells grown to RPMI were subsequently grown in TIFM, as indicated). The proliferation rate of the cells upon switching media conditions was measured (n = 3). The values represent the mean and the error bars represent ± standard deviation (SD) and statistical significance was calculated using a two-tailed Student’s t test.
Figure 1—figure supplement 2
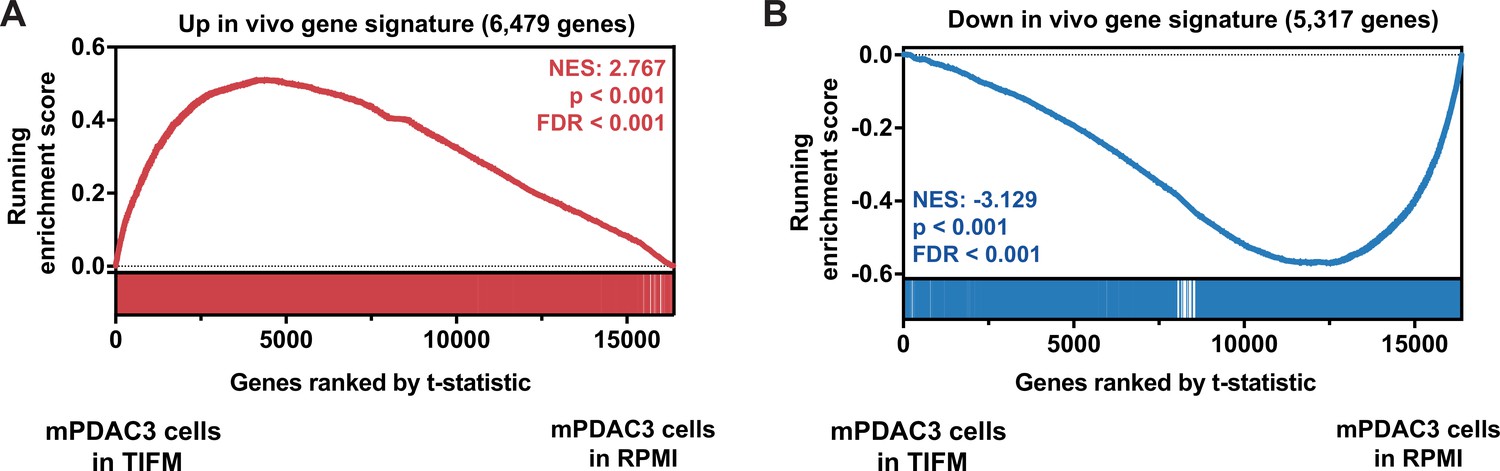
Gene Set Enrichment Analysis (GSEA) using gene signatures of all significantly upregulated and all significantly downregulated genes in murine pancreatic ductal adenocarcinoma (mPDAC) cells isolated from tumors versus RPMI cultures shows mPDAC cells cultured in Tumor Interstitial Fluid Medium (TIFM) better recapitulate the transcriptomic behavior of pancreatic ductal adenocarcinoma (PDAC) cells in vivo.
Custom gene sets of all (A) up- and (B) downregulated genes in mPDAC3-TIFM cells growing in vivo compared to standard culture were generated from differential expression analysis data (Figure 1—source data 1). Using these gene sets, GSEA was performed on transcriptomic data from mPDAC3-TIFM cells cultured in TIFM versus in RPMI. The gene list was ranked by t-statistic metric for differential expression calculated with limma. The top segment of this plot shows running ES for the gene set as the analysis progresses down the ranked list. The bottom section shows where each member of the gene set as it appears in the ranked gene list.
Figure 1—figure supplement 3

Correlation between gene expression changes in mPDAC3-TIFM cells cultured in Tumor Interstitial Fluid Medium (TIFM) and in vivo.
Log2 fold changes in mean gene expression between mPDAC3-TIFM cells in TIFM (n = 3) versus RPMI (n = 3) (x-axis) compared to mPDAC3-TIFM cells in vivo (n = 6) versus in RPMI (n = 3) (y-axis). Statistical significance was determined by Pearson correlation r = 0.3733, p < 0.0001.
Figure 2 with 3 supplements
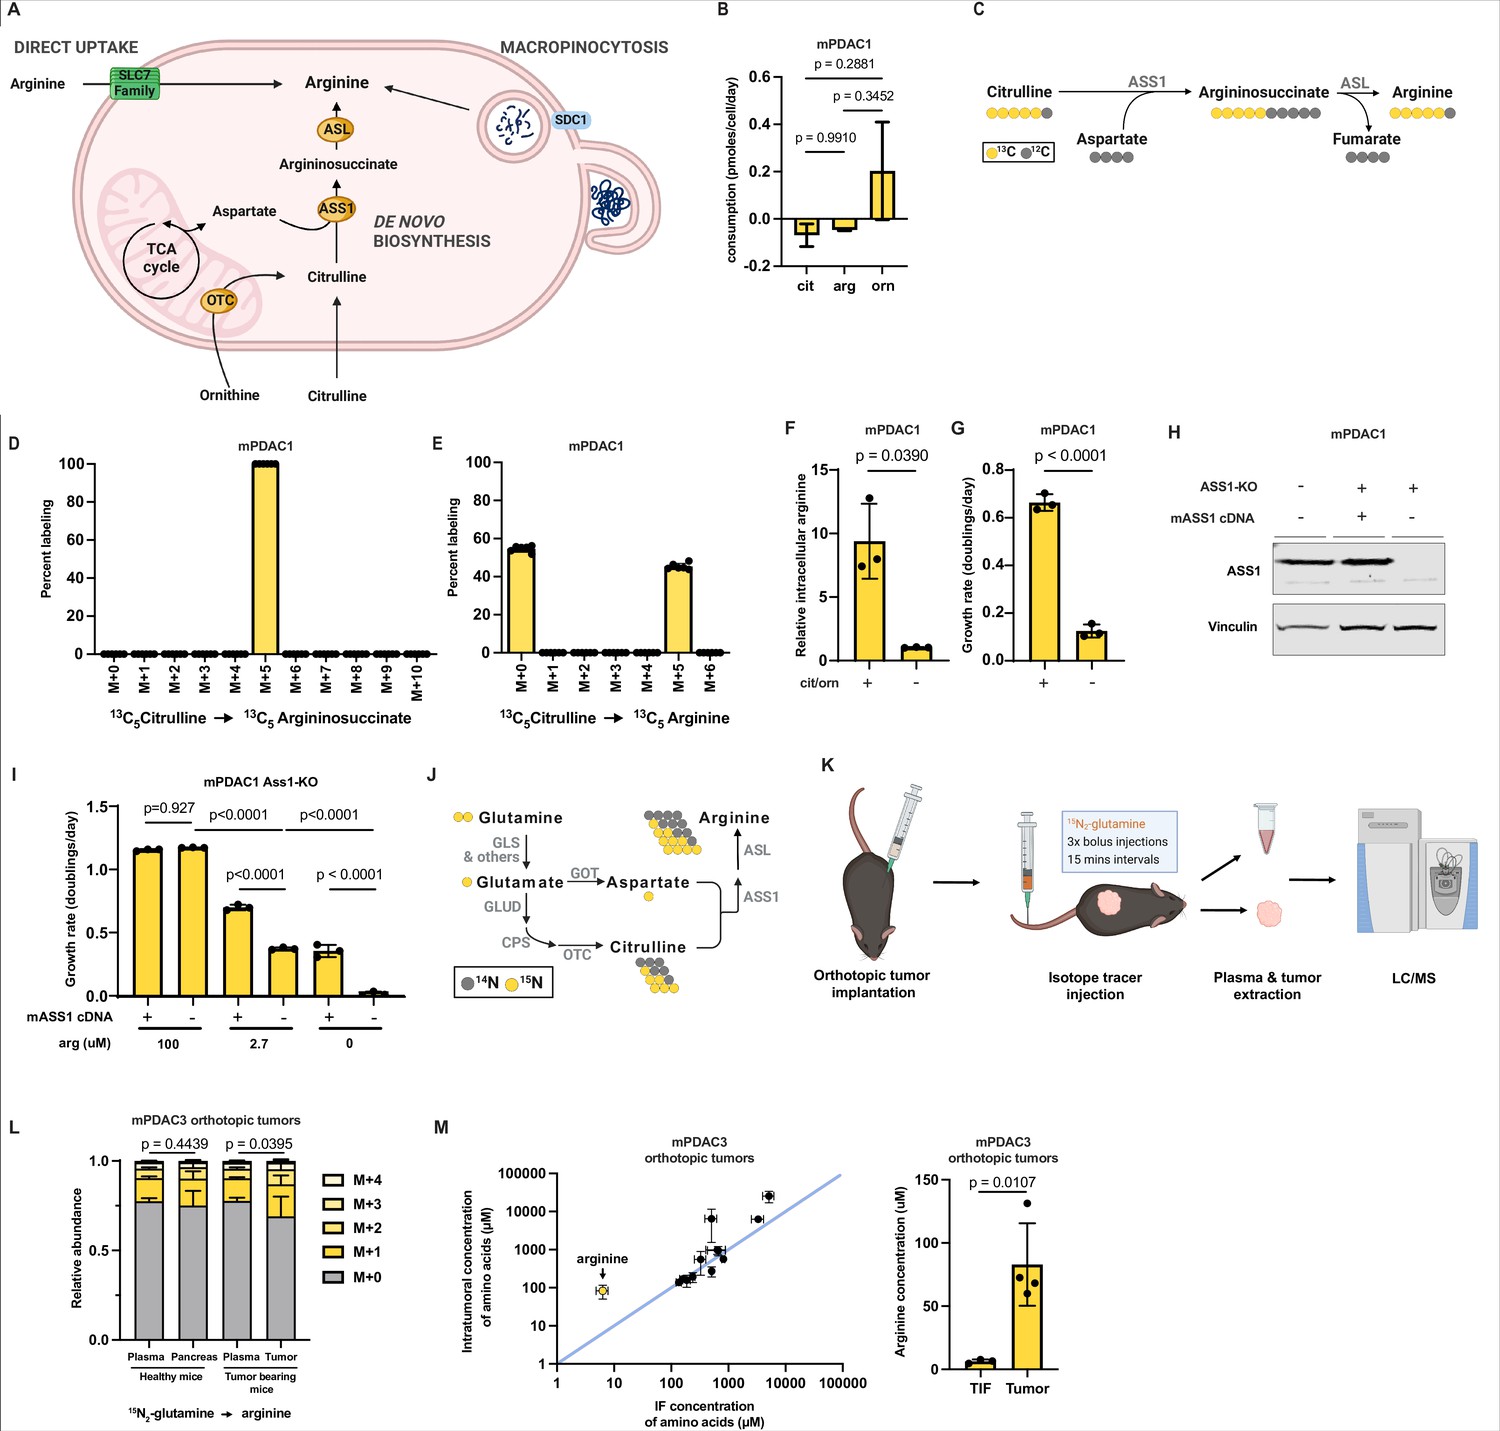
Arginine biosynthesis allows pancreatic ductal adenocarcinoma (PDAC) cells to adapt to low microenvironmental levels of arginine.
(A) Cells can acquire arginine by either of three routes: direct uptake of free arginine from the microenvironment, de novo synthesis, and uptake and breakdown of extracellular protein (macropinocytosis). (B) Cellular consumption/release rate of citrulline, ornithine, and arginine by mPDAC1-TIFM cells cultured in Tumor Interstitial Fluid Medium (TIFM; n = 6). Statistical significance was calculated using an ordinary one-way analysis of variance (ANOVA) test with Tukey’s multiple comparison correction. (C) Diagram showing the metabolic pathway mediating isotopic label incorporation from 13C5-citrulline into arginine. (D) Mass isotopomer distribution of intracellular argininosuccinate and (E) intracellular arginine in mPDAC1 cells grown in TIFM with 13C5-citrulline at PDAC interstitial fluid (IF) concentration (67 µM) (n = 6). (F) Relative intracellular arginine levels of mPDAC1 cells grown in TIFM with (+) or without (−) TIF concentrations of citrulline (cit) and ornithine (orn). Statistical significance was calculated using a two-tailed Student’s t test. (G) Proliferation rate of mPDAC1 cells in same conditions as (F) (n = 3). Statistical significance was calculated using a two-tailed Student’s t test. (H) mPDAC1-TIFM cells were infected with lentiviruses encoding a Ass1 targeting CRISPR vector. Ass1 knockout cells were then infected with lentiviruses expressing either CRISPR resistant Ass1 cDNA or empty vector (E.V.), as indicated. An immunoblot analysis of ASS1 and vinculin (loading control) of protein lysates from these modified cells is shown. (I) Cell proliferation rate of cells in (H) grown in TIFM with different arginine concentrations as indicated (n = 3). Statistical significance was calculated using an ordinary one-way ANOVA test with Tukey’s multiple comparison correction. (J) Diagram showing the metabolic pathways mediating isotopic label incorporation from 15N2-glutamine into arginine. (K) Diagram of stable isotope tracing by bolus intravenous injections of 15N2-glutamine in orthotopic mPDAC3-TIFM tumor-bearing mice and non-tumor-bearing controls followed by plasma sampling and tumor extraction for analysis of intratumoral metabolite labeling during the period of kinetic labeling. (L) Relative abundance of 15N-labeled arginine isotopomers in tissues or plasma after 15N2-glutamine tail-vein bolus injections (n = 7). Statistical significance was calculated using a paired, one-tail Student’s t test. (M) (left) Concentrations of amino acids in IF (n = 3) and tumor samples (n = 4) of mPDAC3-RPMI orthotopic tumors measured by liquid chromatography–mass spectrometry (LC–MS). (right) Bar graph of intratumoral versus IF samples of arginine. For all panels, the bar graphs represent the mean and the error bars represent ± SD. Statistical significance was calculated using a two-tailed Student’s t test.
-
Figure 2—source data 1
Table of metabolite consumption/release rates for mPDAC1-TIFM cells cultured in Tumor Interstitial Fluid Medium (TIFM) and mPDAC1-RPMI cells cultured in RPMI.
ND = metabolite not detected.
- https://cdn.elifesciences.org/articles/81289/elife-81289-fig2-data1-v2.xlsx
-
Figure 2—source data 2
Mass isotopomer distributions for all metabolites analyzed by liquid chromatography–mass spectrometry (LC–MS) from tissues or plasma samples after 15N2-glutamine tail-vein bolus injections in healthy and tumor-bearing mice, as described for Figure 2L.
- https://cdn.elifesciences.org/articles/81289/elife-81289-fig2-data2-v2.xlsx
-
Figure 2—source data 3
Tumor density and intratumoral concentrations of amino acids in mPDAC3 orthotopic tumors and TIF.
(A) Tumor diameter and weight of mPDAC3-TIFM-based orthotopic tumors were measured to calculate tumor volume and density of this tumor model (n = 4). (B) Metabolite concentrations in mPDAC3 orthotopic tumors and TIF samples in Figure 2M. See Measuring intratumor and interstitial fluid (IF) concentrations of amino acids for experimental details.
- https://cdn.elifesciences.org/articles/81289/elife-81289-fig2-data3-v2.xlsx
-
Figure 2—source data 4
Full unedited immunoblots (left) and full immunoblots with sample and band identification (right) for immunoblots shown in Figure 2H.
Immunoblot analysis was performed in cells after 24 hr of growth in Tumor Interstitial Fluid Medium (TIFM) or TIFM + 100 μM as indicated. Raw image files also included.
- https://cdn.elifesciences.org/articles/81289/elife-81289-fig2-data4-v2.zip
Figure 2—figure supplement 1
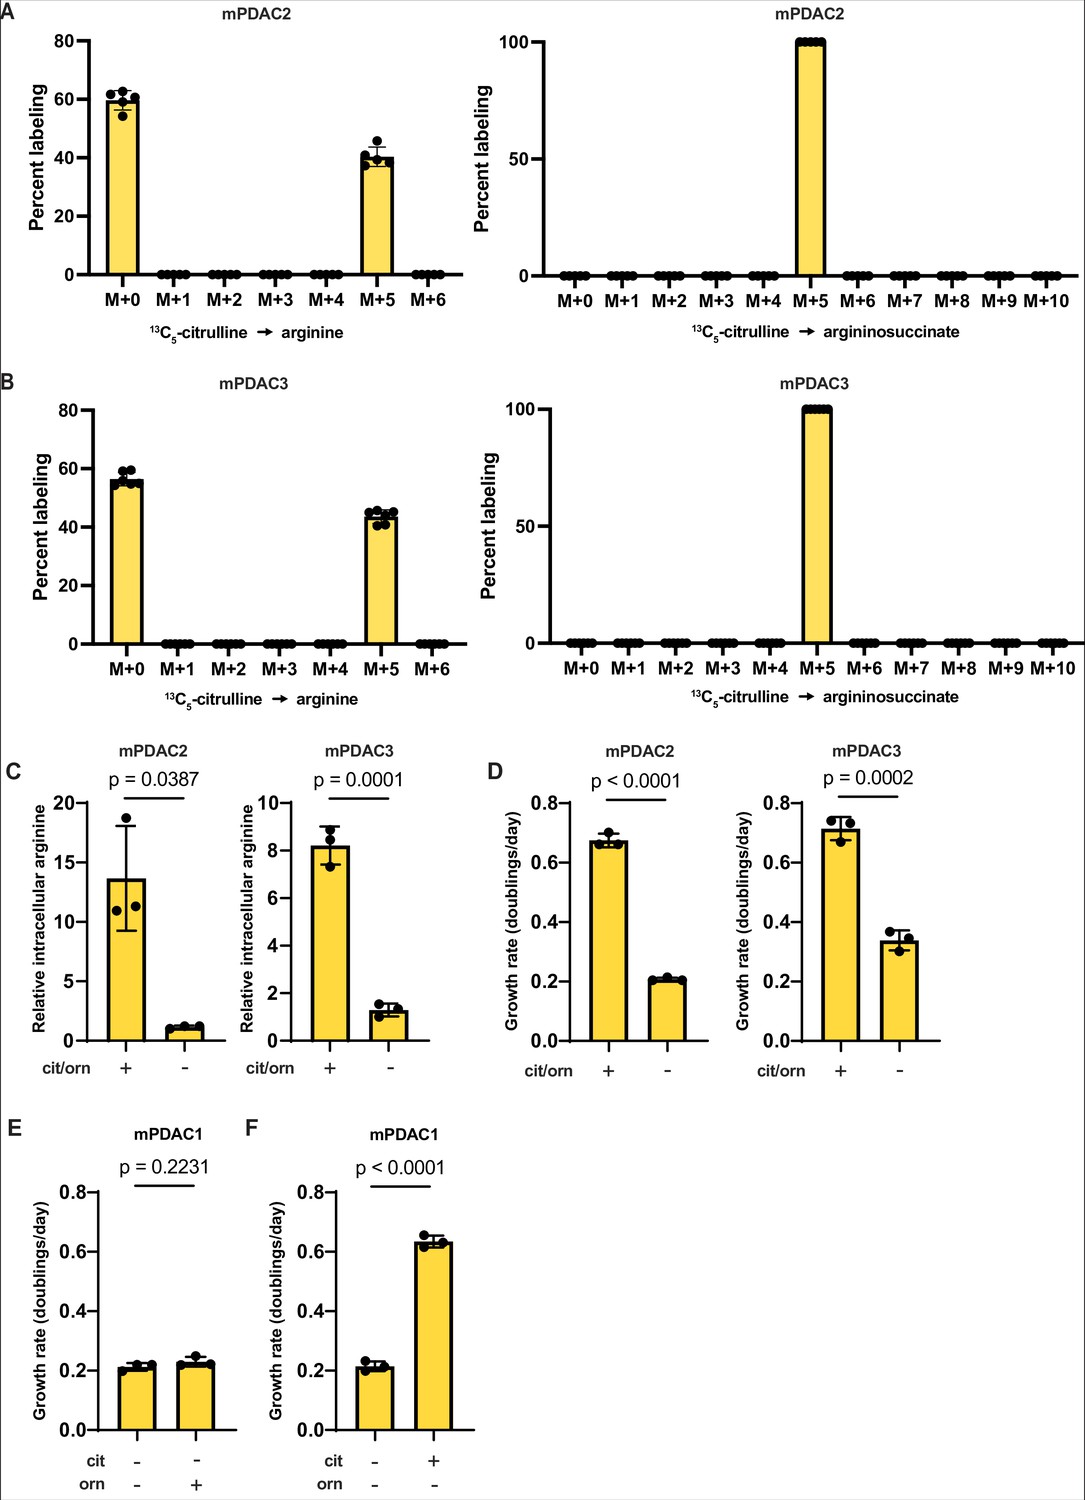
Arginine biosynthesis allows for adaptation to low physiological levels of microenvironmental arginine in multiple murine pancreatic ductal adenocarcinoma (mPDAC) cell lines.
(A) Mass isotopomer distribution of intracellular argininosuccinate and intracellular arginine in mPDAC2 cells grown in Tumor Interstitial Fluid Medium (TIFM) with 13C5-citrulline at pancreatic ductal adenocarcinoma (PDAC) interstitial fluid (IF) concentration (67 µM) (n = 6). (B) Mass isotopomer distribution of intracellular argininosuccinate and intracellular arginine in mPDAC3 cells grown in TIFM with 13C5-citrulline at PDAC IF concentration (67 µM) (n = 6). (C) Relative intracellular arginine levels of mPDAC2-TIFM and mPDAC3-TIFM cells grown in TIFM with (+) or without (−) PDAC IF concentrations of citrulline (cit) and ornithine (orn) (n = 3). Statistical significance was calculated using a two-tailed Student’s t test. (D) Cell proliferation rate of mPDAC2-TIFM and mPDAC3-TIFM cells in same conditions as (C) (n = 3). Statistical significance was calculated using a two-tailed Student’s t test. (E) Cell proliferation rate of mPDAC1-TIFM cells with or without TIFM concentrations of ornithine (orn) (n = 3). Statistical significance was calculated using a two-tailed Student’s t test. (F) Cell proliferation rate of mPDAC1-TIFM cells with or without TIFM concentrations of citrulline (cit) (n = 3). Statistical significance was calculated using a two-tailed Student’s t test.
Figure 2—figure supplement 2
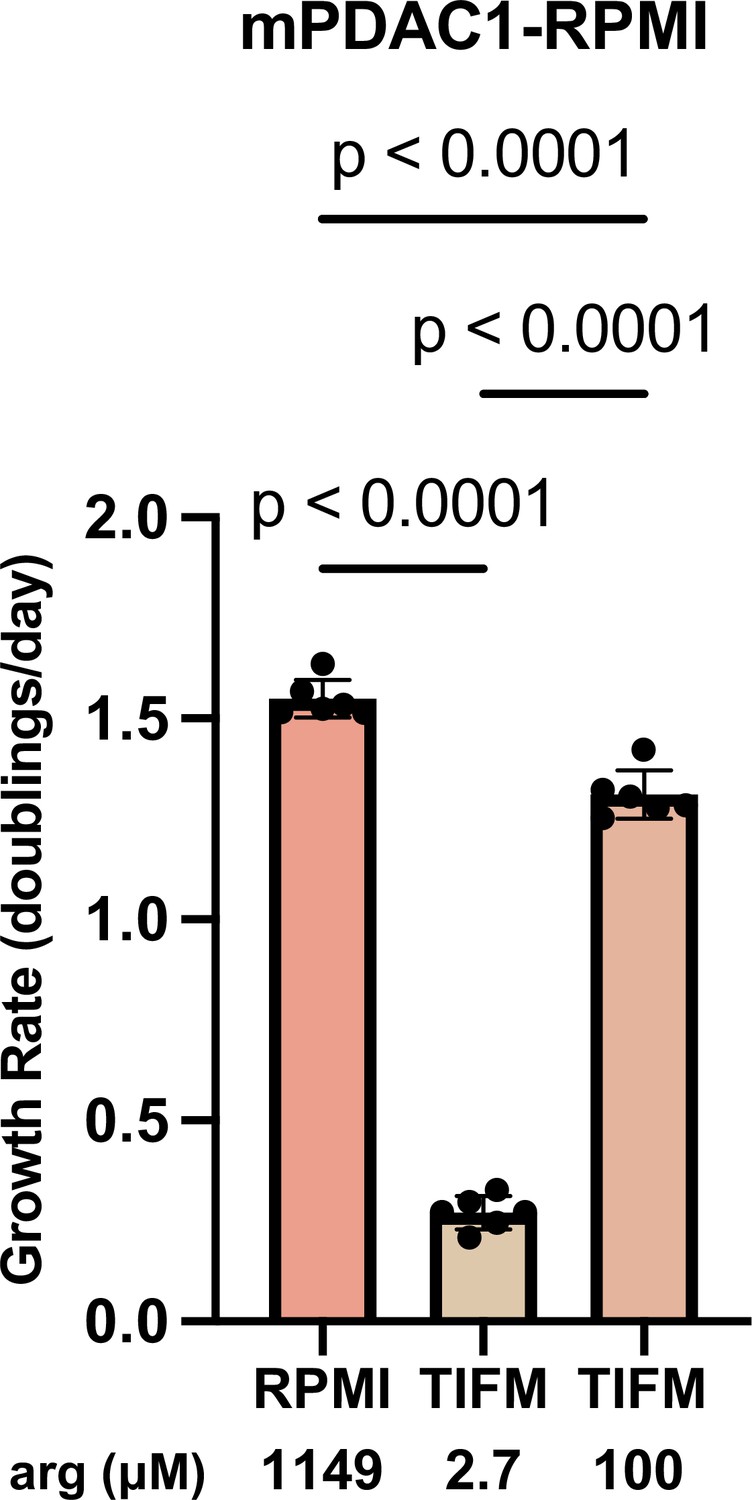
Arginine supplementation rescues cell proliferation defect of mPDAC1-RPMI cells in Tumor Interstitial Fluid Medium (TIFM).
mPDAC1-RPMI were cultured in TIFM, TIFM supplemented with 100 µM arginine or in RPMI, as indicated. The proliferation rate of mPDAC1-RPMI cells immediately after switching the cells to the indicated media was measured (n = 6). The values represent the mean and the error bars represent ± standard deviation (SD). Statistical significance was calculated using an ordinary one-way analysis of variance (ANOVA) test with Tukey’s multiple comparison correction.
Figure 2—figure supplement 3

Inhibiting de novo arginine synthesis does not impair pancreatic ductal adenocarcinoma (PDAC) tumor progression.
(A) Tumor weight of mPDAC3-TIFM-ASS1KO (n = 14), and mPDAC3-TIFM-ASS1KO;mASS1 (n = 15) orthotopic tumors. Statistical significance was calculated using a two-tailed Student’s t test. (B) Arginine concentration in the TIF of mPDAC3-TIFM-ASS1KO (n = 11), and mPDAC3-TIFM-ASS1KO;mASS1 (n = 12) orthotopic tumors. Statistical significance was calculated using a two-tailed Student’s t test.
Figure 3 with 1 supplement
Enhanced uptake of environmental arginine allows pancreatic ductal adenocarcinoma (PDAC) cells to cope with inhibition of de novo arginine synthesis.
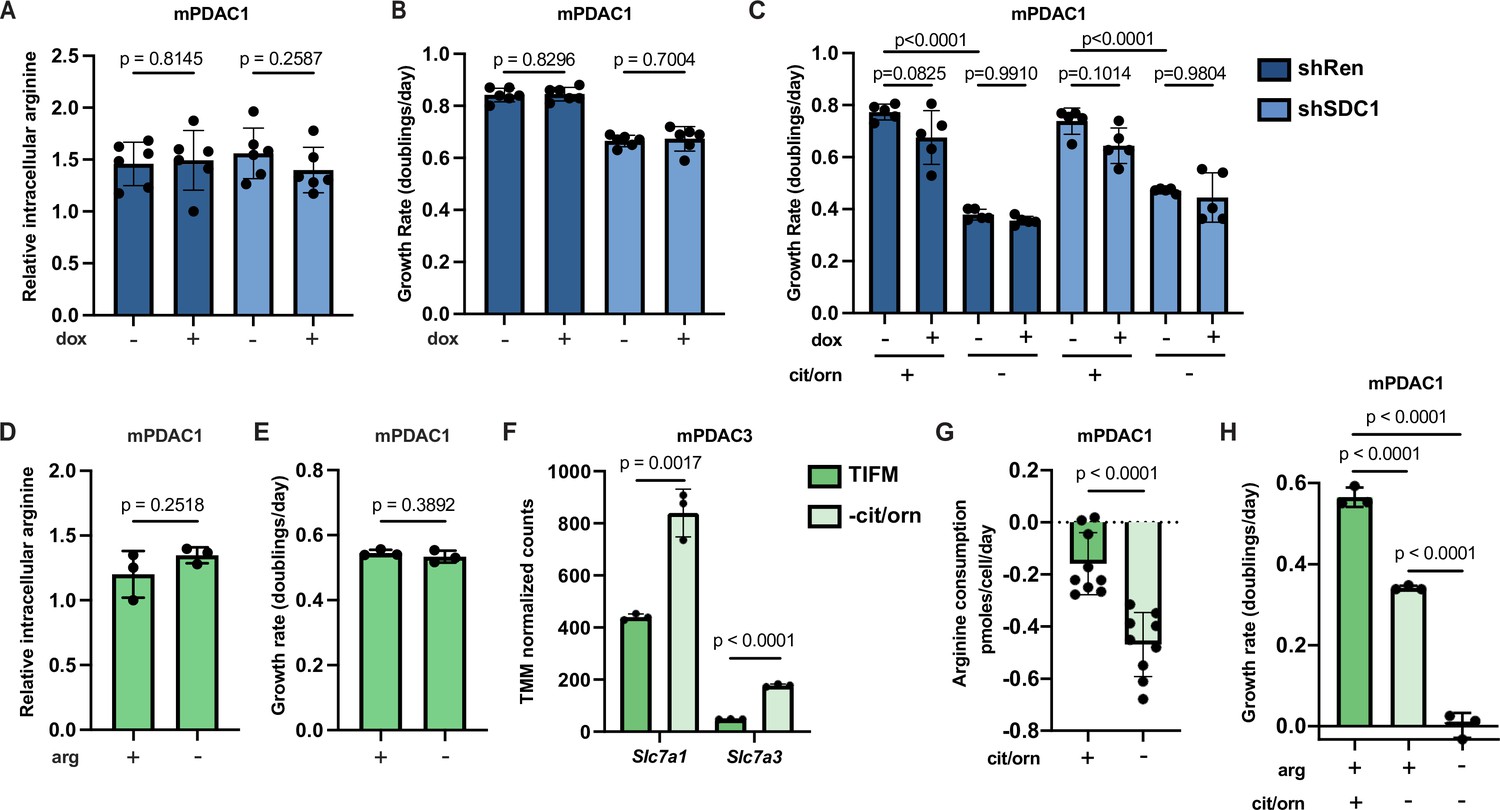
(A) Relative intracellular arginine levels of mPDAC1-TIFM cells infected with lentiviruses encoding a doxycycline-inducible Sdc1 targeting shRNA or a Renilla luciferase targeting control shRNA (shRen) treated with 1 µg/ml doxycycline or vehicle (n = 6). (B) Cell proliferation rate of mPDAC1-TIFM cells in same conditions as (A) (n = 6). (C) Proliferation rate of mPDAC1-TIFM cells as in (A) cultured in Tumor Interstitial Fluid Medium (TIFM) with or without citrulline (cit) and ornithine (orn) (n = 5). (D) Relative intracellular arginine levels of mPDAC1-TIFM cells grown in TIFM with or without TIFM concentrations of arginine (arg) (n = 3). (E) Cell proliferation rate of mPDAC1-TIFM cells in same conditions as (D) (n = 3). (F) Trimmed mean of M values (TMM)-normalized counts for Slc7a1 and Slc7a3, two cationic amino acid transporters capable of transporting arginine, from transcriptomic analysis (see Materials and methods) of mPDAC3-TIFM cells grown in either TIFM or TIFM without citrulline and ornithine (n = 3). (G) Per-cell consumption rate of arginine by mPDAC1-TIFM cells cultured in TIFM with or without citrulline and ornithine. Cells were supplemented with 20 μM arginine to enable the consumption measurements (n = 9). (H) Proliferation rate of mPDAC1-TIFM cells grown with or without TIFM concentrations of citrulline, ornithine, or arginine, as indicated (n = 3). For all panels, bar graphs represent the mean, and the error bars represent ± SD. Statistical significance for panels C and H was calculated using an ordinary one-way analysis of variance (ANOVA) test with Tukey’s multiple comparison correction. For panels A, B, and D–G, statistical significance was calculated using a two-tailed Student’s t test.
Figure 3—figure supplement 1

Murine pancreatic ductal adenocarcinoma (mPDAC) cells do not upregulate macropinocytosis after inhibition of arginine synthesis, but instead require arginine uptake to cope with inhibition of de novo arginine synthesis.
(A) RTqPCR analysis for Sdc1 in mPDAC1-TIFM cells infected with lentiviruses encoding a dox-inducible Sdc1 targeting shRNA or Renilla luciferase targeting control shRNA (shRen) with and without treatment with 1 µg/ml doxycycline or vehicle (n = 6). (B) Macropinocytosis activity measured by kinetic DQ-BSA uptake assay in mPDAC1-TIFM cells from (A). (C) Macropinocytosis activity measured by kinetic DQ-BSA uptake in mPDAC1-TIFM cells treated with 10 µM hydroxychloroquine (HQ) or vehicle (water). (D) Cell proliferation rate of mPDAC1-TIFM cells in same conditions as (C) (n = 3). (E) Relative intracellular arginine levels of mPDAC1-TIFM cells grown in Tumor Interstitial Fluid Medium (TIFM) with or without pancreatic ductal adenocarcinoma (PDAC) interstitial fluid (IF) concentrations of citrulline, ornithine, or arginine, as indicated (n = 3). (F) Proliferation rate of mPDAC2-TIFM and mPDAC3-TIFM cells grown in TIFM with or without PDAC IF concentrations of citrulline, ornithine, or arginine, as indicated (n = 3). For all panels, bar graphs represent the mean, and the error bars represent ± standard deviation (SD). For panels A and D, statistical significance was calculated using a two-tailed Student’s t test. Statistical significance for panels E and F was calculated using an ordinary one-way analysis of variance (ANOVA) test with Tukey’s multiple comparison correction.
Figure 4 with 3 supplements
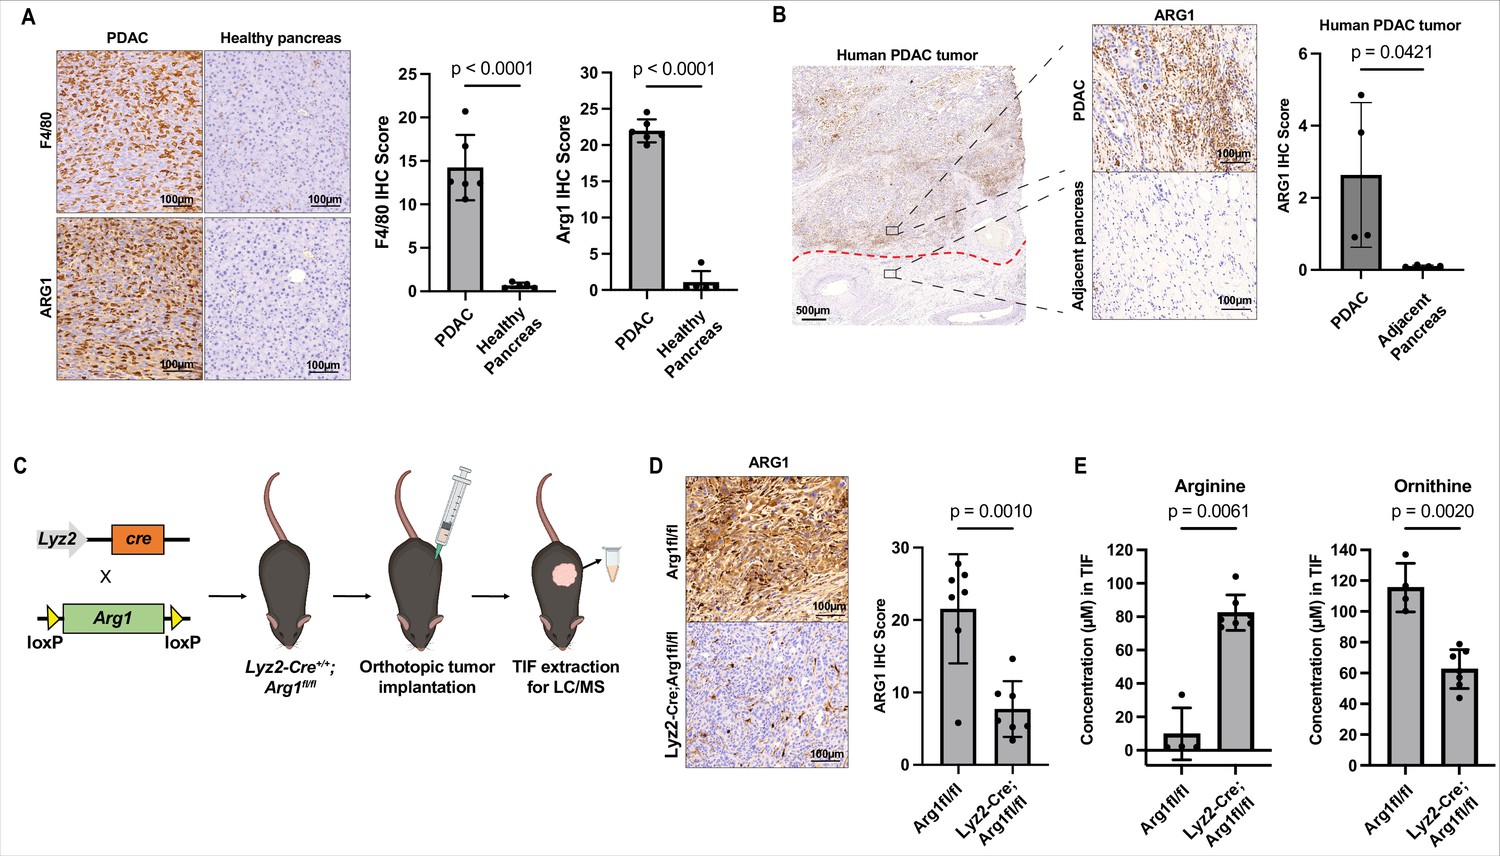
Myeloid arginase causes microenvironmental arginine depletion in pancreatic ductal adenocarcinoma (PDAC) tumors.
(A) Representative images (left) and immunohistochemical (IHC) score (right) of IHC staining for F4/80 and ARG1 in an orthotopic mPDAC1-TIFM tumor (n = 5) and in healthy murine pancreas (n = 5). Scale bars: 100 µm. Multiple regions of malignant tissue for each sample were used to assess staining and the same annotated regions for F4/80 were utilized to assess ARG1 expression. (B) Representative images (left) and IHC score (right) of IHC staining for ARG1 in an advanced human PDAC tumors and adjacent untransformed pancreas (n = 4). Multiple regions with myeloid cells for untransformed pancreas and for PDAC tumors for were used for this analysis. Scale bar: 500 and 100 µm, as indicated. (C) Schematic for crossing of Lyz2-Cre and Arg1fl/fl, tumor implantation in Lyz2-Cre+/+; Arg1fl/fl progeny, and subsequent interstitial fluid (IF) extraction. (D) Representative images (left) and IHC score (right) of IHC staining for ARG1 protein expression in orthotopic mPDAC3-TIFM tumors from Lyz2-Cre+/+; Arg1fl/fl (n = 7) and Arg1fl/fl littermate controls (n = 7). Scale bar: 100 µm. Multiple regions of malignant tissue for each sample were used to assess ARG1 staining. (E) Absolute concentration of arginine and ornithine in the IF of orthotopic mPDAC3-TIFM tumors from Lyz2-Cre+/+; Arg1fl/fl (n = 7) and Arg1fl/fl littermate controls (n = 4). Statistical significance for all figures was calculated using a two-tailed Student’s t test.
-
Figure 4—source data 1
Metabolite concentrations measured in the interstitial fluid (IF) of orthotopic mPDAC3-TIFM tumors from Lyz2-Cre+/+; Arg1fl/fl and Arg1fl/fl littermate controls in Figure 4E and metabolite concentrations measured in the IF of mPDAC3-TIFM orthotopic tumors after treatment with 100 mg/kg of arginase inhibitor CB-1158 or vehicle in Figure 4—figure supplement 1.
- https://cdn.elifesciences.org/articles/81289/elife-81289-fig4-data1-v2.xlsx
-
Figure 4—source data 2
Mass isotopomer distributions for metabolites analyzed by liquid chromatography–mass spectrometry (LC–MS) from tumors or plasma samples after 15N2-glutamine infusion in tumor-bearing Lyz2-Cre+/+; Arg1fl/fl and Arg1fl/fl littermate controls.
- https://cdn.elifesciences.org/articles/81289/elife-81289-fig4-data2-v2.xlsx
Figure 4—figure supplement 1
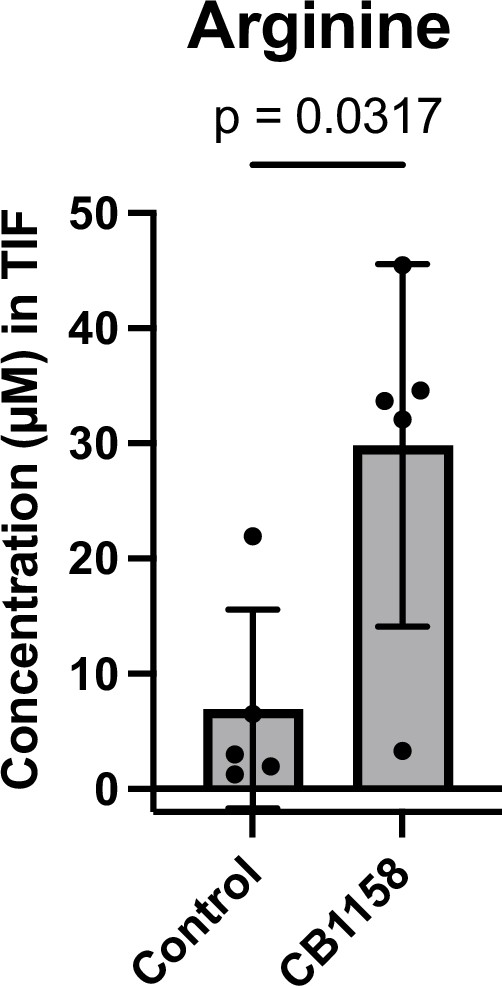
Treatment with arginase inhibitor CB-1158 increases arginine levels in murine pancreatic ductal adenocarcinoma (mPDAC) tumor TIF.
Absolute concentration of arginine in the interstitial fluid (IF) of mPDAC3-TIFM orthotopic tumors after treatment with 100 mg/kg of arginase inhibitor CB-1158 or vehicle (n = 5). Statistical significance was calculated using a two-tailed Student’s t test.
Figure 4—figure supplement 2

Murine pancreatic ductal adenocarcinoma (mPDAC) tumors in Lyz2-Cre+/+; Arg1fl/fl mice and controls show no difference in ASS1 expression.
Representative images (left) and immunohistochemical (IHC) score (right) of IHC staining for ASS1 protein expression in orthotopic mPDAC3-TIFM tumors from Lyz2-Cre+/+; Arg1fl/fl (n = 7) and Arg1fl/fl littermate controls (n = 7). Multiple regions of malignant tissue for each sample were used to assess ASS1 staining. Statistical significance for all figures was calculated using a two-tailed Student’s t test.
Figure 4—figure supplement 3

15N2-glutamine tracing in Lyz2-Cre+/+; Arg1fl/fl, mPDAC3-TIFM tumor-bearing mice does not show reduction of arginine biosynthesis.
Mass isotopomer distributions of glutamine, citrulline, aspartate, argininosuccinate, and arginine in mPDAC3 tumors in Lyz2-Cre+/+; Arg1fl/fl (n = 9) and Arg1fl/fl (n = 3) hosts after 15N2-glutamine infusion. Statistical significance was calculated using a paired, two-tailed Student’s t test.
Additional files
-
Supplementary file 1
Table with complete formulation of Tumor Interstitial Fluid Medium (TIFM) including all commercial suppliers and manufacturer part numbers for each metabolite included in TIFM.
- https://cdn.elifesciences.org/articles/81289/elife-81289-supp1-v2.xlsx
-
Supplementary file 2
Table of primers used for qPCR analyses of Sdc1, primers used for genotyping analysis of Lyz2-Cre and Arg1fl/fl alleles, shRNA hairpin sequences, and sgRNA sequences used in this study.
- https://cdn.elifesciences.org/articles/81289/elife-81289-supp2-v2.xlsx
-
MDAR checklist
- https://cdn.elifesciences.org/articles/81289/elife-81289-mdarchecklist1-v2.pdf
Download links
A two-part list of links to download the article, or parts of the article, in various formats.
Downloads (link to download the article as PDF)
Open citations (links to open the citations from this article in various online reference manager services)
Cite this article (links to download the citations from this article in formats compatible with various reference manager tools)
Pancreatic tumors exhibit myeloid-driven amino acid stress and upregulate arginine biosynthesis
eLife 12:e81289.
https://doi.org/10.7554/eLife.81289


