Calcium dependence of both lobes of calmodulin is involved in binding to a cytoplasmic domain of SK channels
- Department of Neuroscience, The University of Texas at Austin, United States
Figures
Figure 1
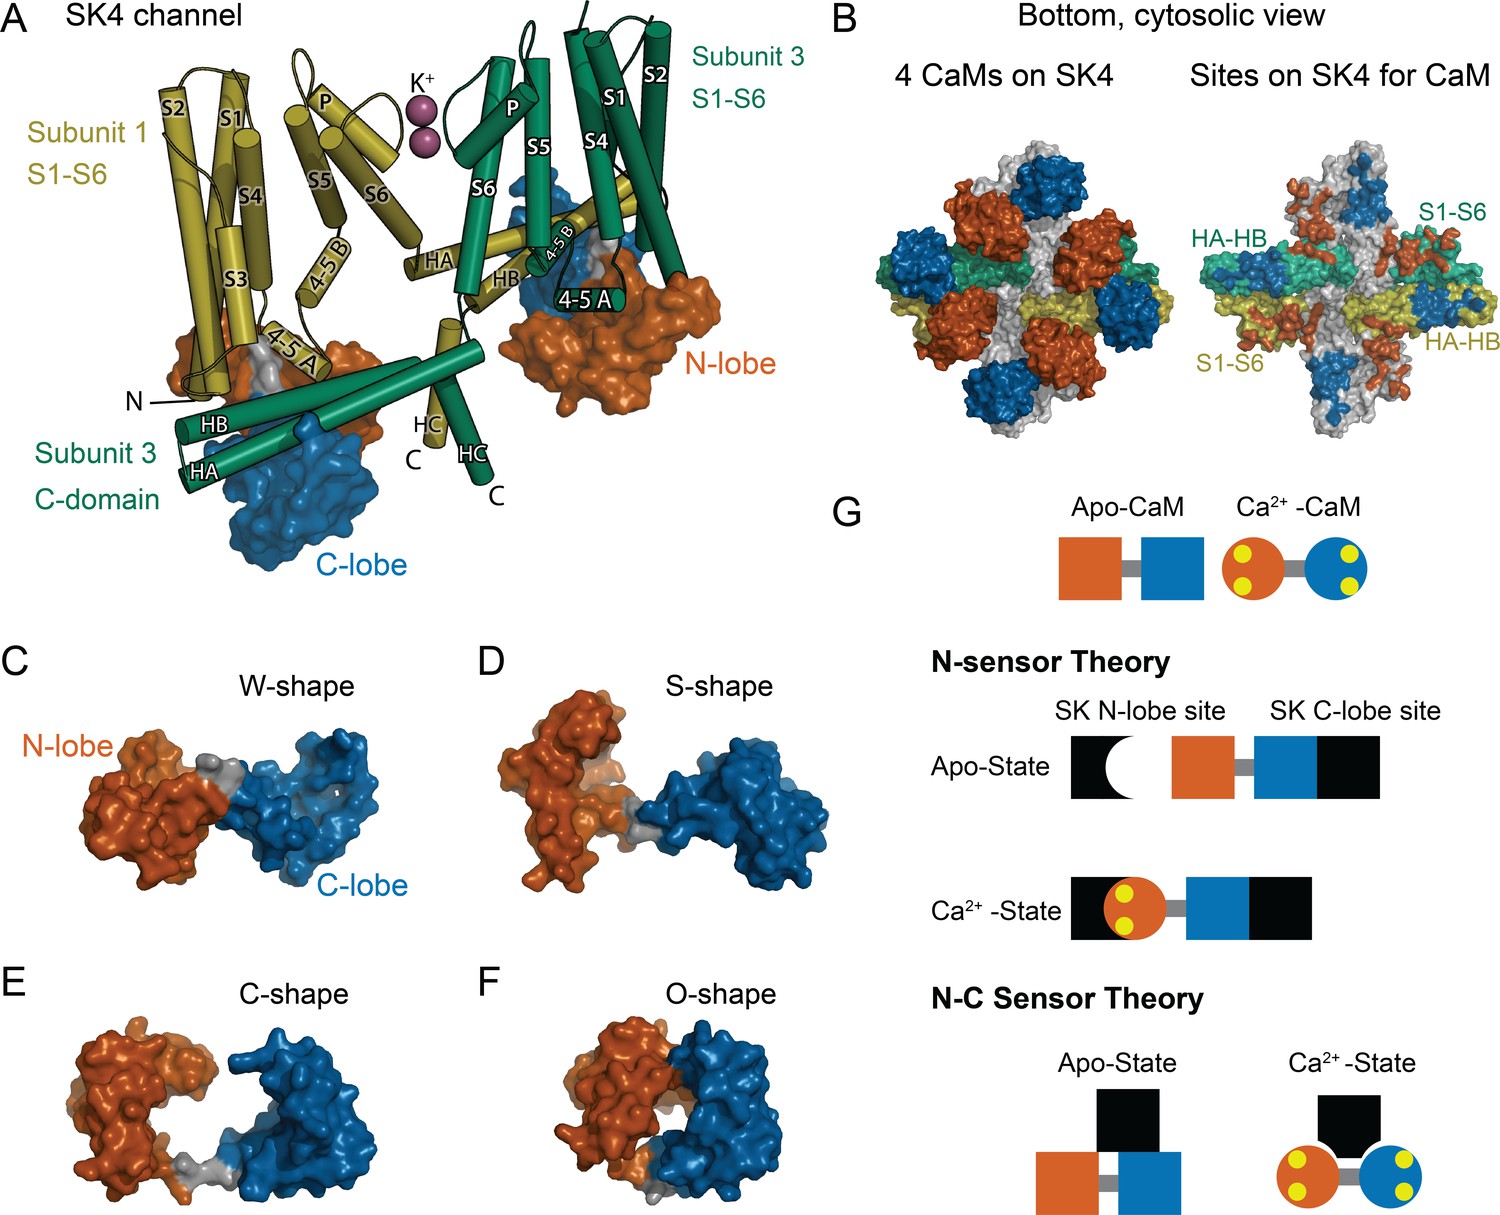
CaM as an SK Ca2+ sensor.
(A) Cartoon representation of the SK4 K+ ion channel shown as cylindrical helices and molecular surface depictions of CaM (pdb 6CNN). For clarity, only two of four subunits and CaMs are shown. Subunit 1 is yellow and subunit 3 is green. The N-lobe surface of CaM is vermillion, and the C-lobe surface of CaM is blue. Transmembrane helices are shown as S1–S6, and SK C-domain helices are shown as HA–HC. The peptide used in the binding studies, SKp, includes HA, HB, and part of HC. Diagonal subunits of SK4 bind a CaM in EM structure. Intracellular helix 4–5 A between S4 and S5 of transmembrane segments bind in a pocket of the N-lobe of CaM. C-domain helices HA and HB of the cross-subunit bind the C-lobe of CaM. (B) Bottom views of SK4 showing all four subunits showing CaMs bound, left side, or with CaM models removed, right side. The colors are the same as in panel A. The subunits that are not depicted in A are gray. On the right side, the SK sites that bind CaM are colored the same as the CaM lobes they contact. Panels (C–F) demonstrate the lobes of CaM can reorient to form diverse conformation states. The lobes of CaM can when bound to SK4 (pdb 6CNN) form a W-shape in C, when not bound to protein (pdb 1CLL) form an S-shape in D, when bound to an SK2 peptide (pdb 1G4Y) form a C-shape in E, or when bound to an MLCK peptide (pdb 1CDL) form an O-shape in F. (G) The N-sensor hypothesis of SK activation by CaM claims the N-lobe of CaM to be the Ca2+ sensor. The N-lobe binds a Ca2+-dependent site when Ca2+ binds to it. The C-lobe remains anchored to a site with no local change. In the NC-sensor hypothesis, both lobes of CaM are functional Ca2+ sensors. At trace Ca2+, the C-lobe dominates the interaction. At high Ca2+, a different binding mode is revealed that binds both Ca2+-bound lobes. The binding sites for each lobe of CaM need not be on the same subunit and the depiction is meant to emphasize that SK responds to Ca2+ binding to both lobes of CaM.
Figure 2
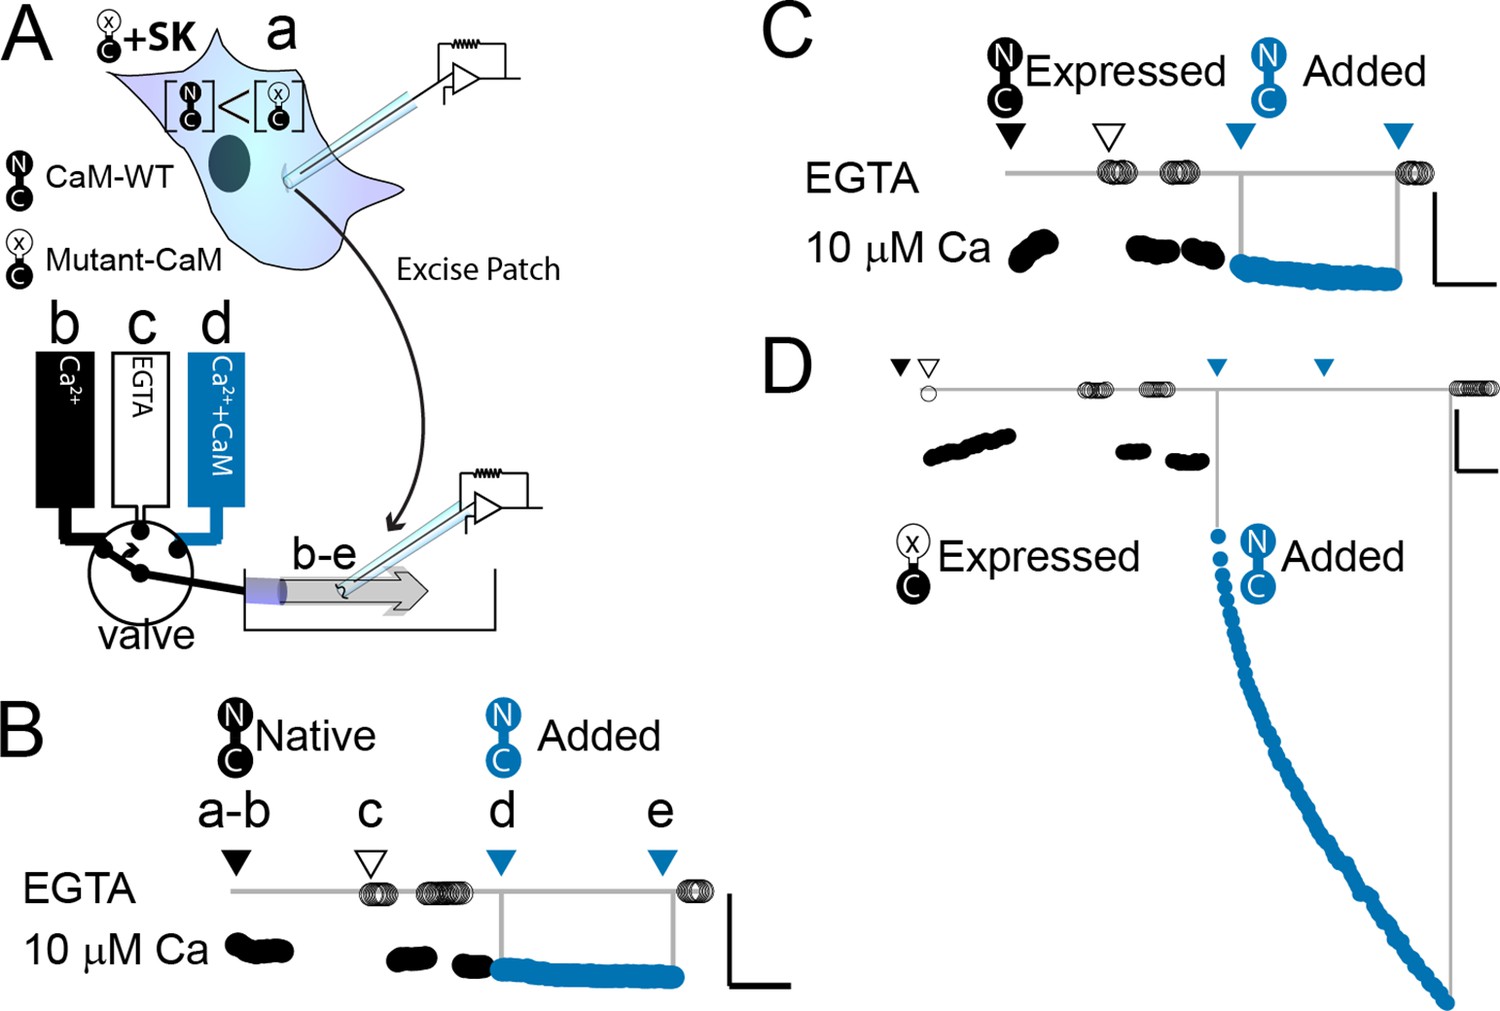
WT-CaM recovers SK2 current in HEK293 cells.
(A) Cartoon depicts patch excision at time zero (a) and moving an electrode into the flow path from a fast solution exchanger (b–d). For simplicity, only three of eight solution positions are depicted. The illustration in (A) best describes the conditions for the experiment in panel (D). The scale bars in B–D indicate 0.13 nA and 50 s for horizontal and vertical lines, respectively. Average current level at −60 mV measured every 3 s from a patch excised from HEK 293 cells transfected with rSK2 only in (B), cotransfected with excess WT-CaM in (C), or cotransfected with excess mutant CaM (E1Q) in (D). Note that in (B) rSK2 contacted endogenous CaM, and that in both (C) and (D) WT- and mutant CaM are massively overexpressed relative to endogenous CaM. Traces show rSK2 current before (black) and after (blue) application of exogenous WT-CaM protein. Time point labels in (B–D) are the same as in (A): a. patch excision, b. movement of electrode to the Ca2+ solution-exchange stream, c. first application of EGTA (Ethylene glycol-bis(β-aminoethyl ether)-N,N,N′,N′-tetraacetic acid tetrasodium salt) to find basal patch current, d. timepoint at which purified, recombinant WT-CaM applied shown in blue trace, e. timepoint at which fractional recovery is measured. WT-CaM is indicated by a dumbbell with an N- and a C-lobe. E1Q is depicted as a dumbbell with an ‘x’ in the upper lobe to indicate where Ca2+ binding is disrupted.
Figure 3
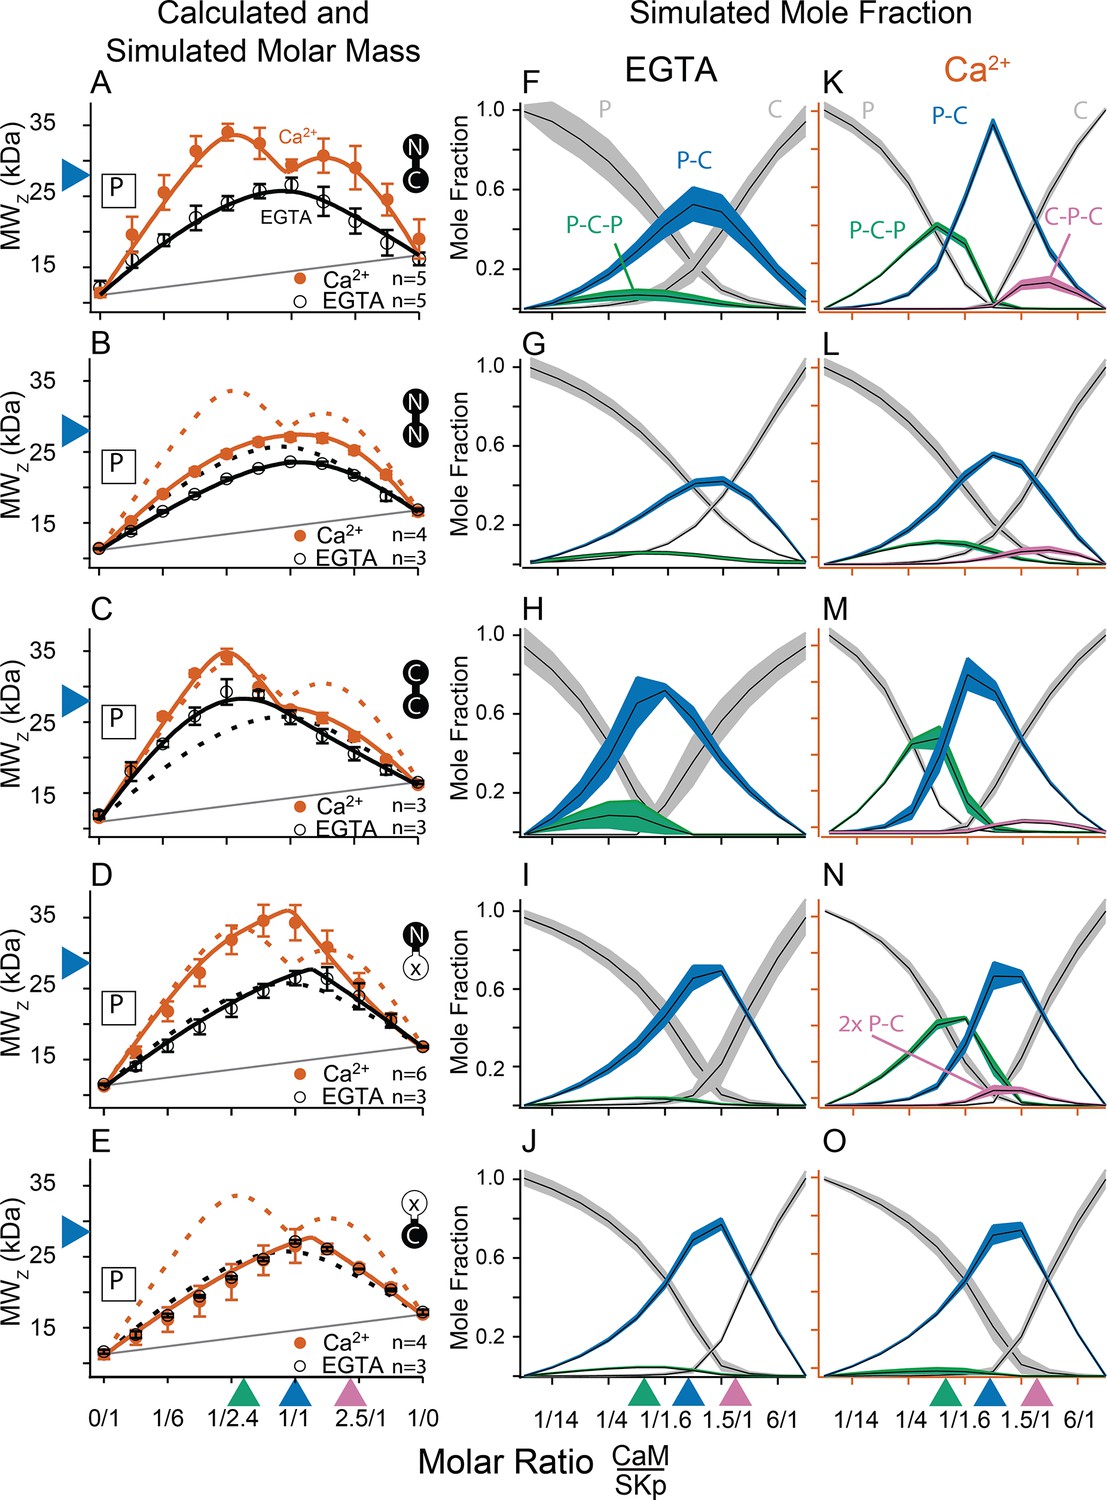
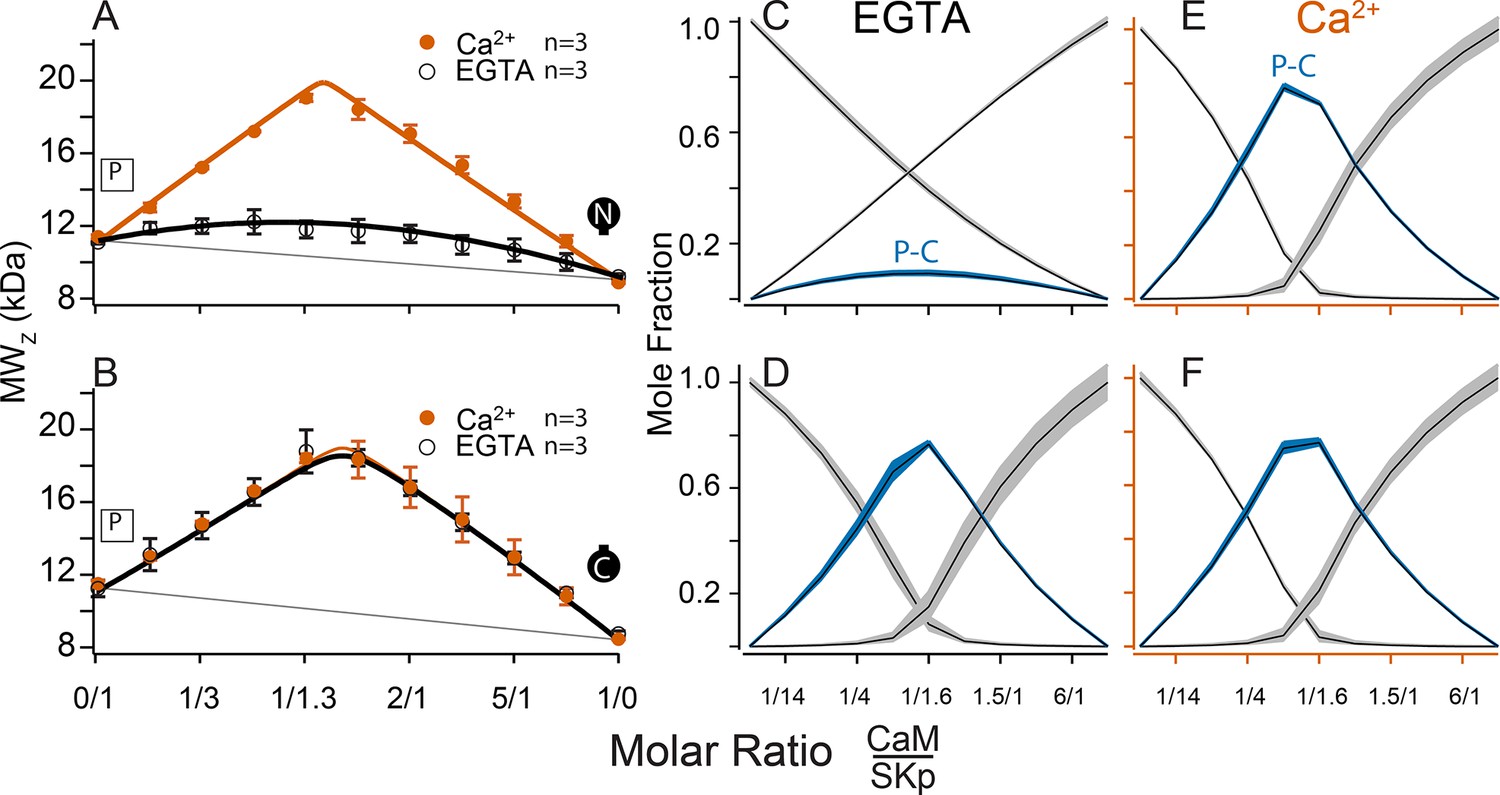
Composition-gradient multi-angle light scattering (CG-MALS) assays of SKp-binding full-length CaM constructs.
A 1/1 complex of SKp/WT-CaM is 28 kDa and indicated by blue arrows on the left panels. Each row assays the complex formation of SKp (P) with a specific CaM construct indicated by labels: Row (A) WT-CaM, (B) Double N-lobe CaM, (C) Double C-lobe CaM, (D) C-lobe Ca2+ mutant CaM, and (E) N-lobe Ca2+ mutant CaM. (A–E) Weight average molar mass as a function of molar ratio of CaM:SKp, black circles 5 mM EGTA, vermillion circles 2 mM CaCl2. Error bars show standard error of the mean. Solid curves connecting data points are simulations using association constants derived from fits. Gray lines show what points would follow if there was no interaction. Dashed lines in B–E are the same curves as in panel A for comparison. Panels (F–J) in 5 mM EGTA and (K–O) in 2 mM Ca2+ show fitted mole fractions of different complexes required in the experimental solution to produce the data in (A–E). Shaded regions are within the standard error of the mean. The gray regions (P) and (C) correspond to fraction of unbound SKp (P) or CaM (C) protein. The arrows along the bottom indicate where the total molar ratios of SKp:CaM are 2:1 green, 1:1 blue, and 1:2 purple.
Figure 4
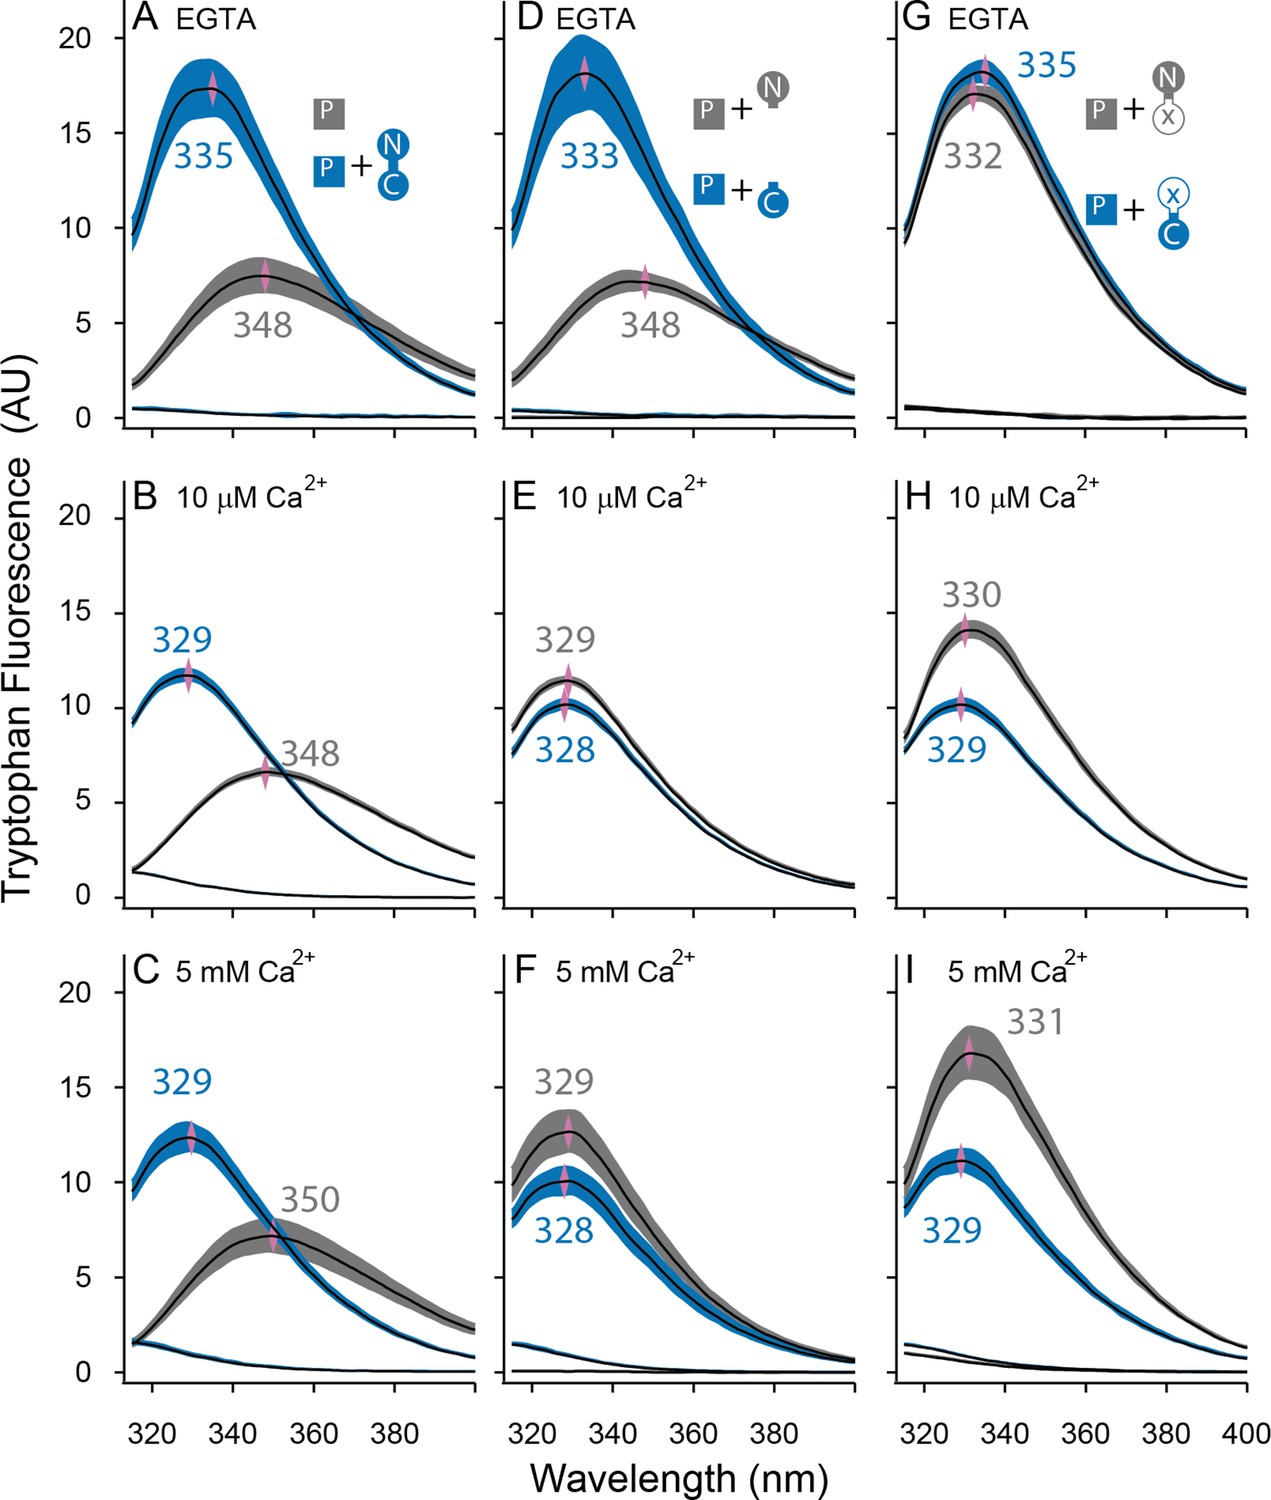
Both lobes can alter the environment of W432 of SKp.
Shown are averaged fluorescent emission spectra from excitation at 265 nm. Shaded regions are within the standard error of the mean. Rows of panels have the same concentration of Ca2+. Top row was measured in 5 mM EGTA (<5 nM Ca2+), middle row at 10 µM free Ca2+, bottom row in 5 mM Ca2+. (A–C) SKp (P) emission spectra are shaded gray. SKp emission spectra with equimolar CaM are shaded blue. (D–F) SKp emission spectra with equimolar N-CaM (gray) or C-CaM (blue). (G–I) SKp emission spectra with equimolar CaM (E12Q) (gray) or CaM (E34Q) (blue). Controls of CaM emission without SKp present are included in most panels. Purple diamonds and nearby values indicate the wavelength (nm) where the peak average intensity was located.
Figure 5
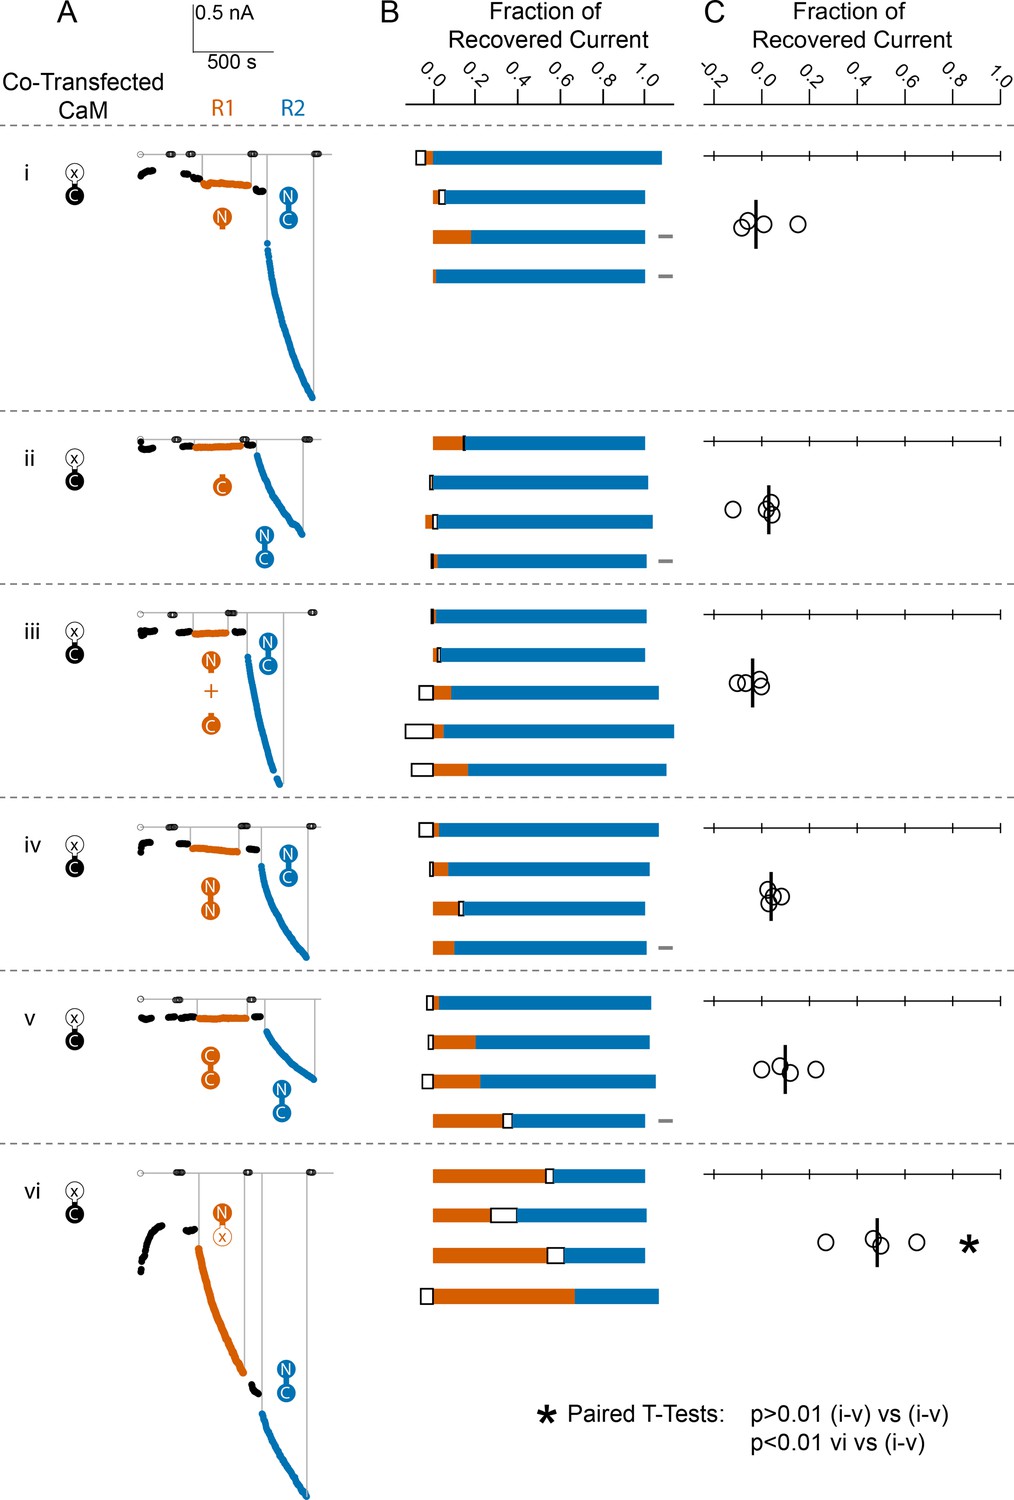
Comparison of fractional SK2 current recovery with various CaM constructs.
Column (A): Average current levels at −60 mV measured every 3 s from patches excised from cells cotransfected (CT) with rSK2 and mutant CaM (E1Q). Basal EGTA (open black circles) and Ca2+ (filled black circles) currents are established, exogenous non-WT-CaM protein is applied (R1 – vermillion traces), washed out (black traces again), WT-CaM protein is applied (R2 – blue traces), then washed out (black traces). Each row (i–vi) is an experiment with the non-WT-CaM as indicated by the vermillion labels under R1. Column (B): Each bar represents a different patch. The blue portion of the bar represents the fraction of current recovered by exogenous WT-CaM, the vermillion portion represents the fraction recovered by exogenous non-WT-CaM, and the unfilled portion represents the fraction of drift in current at 10 µM free Ca2+ after application of non-WT-CaM and before application of WT-CaM. The gray rectangles to the right of certain experiments indicate that they deviated slightly from the experimental protocol described in the Materials and methods, primarily in solution changes before and after non-WT-CaM. Column (C): Fraction of SK current recovered with the application of non-WT-CaM constructs relative to WT-CaM. Each open black circle represents a different patch, and the black vertical bar is the median fractional recovery. In B, fractional recovery extended beyond 1 and below 0 in some experiments due to current drifting up or down slightly across solution changes and over the course of recovery. Similarly, in C, fractional recovery for some experiments was below 0 due to current decreasing slightly during application of non-WT-CaM construct. In paired T-tests, rows i–v were not significantly different from each other (each p > 0.01), but row vi was different from each other row (each p < 0.01).
Figure 6
Composition-gradient multi-angle light scattering (CG-MALS) assays of SKp binding to half-CaM molecules.
(A, B) Weight average molar mass as a function of molar ratio of half-CaM:SKp, black circles 5 mM EGTA, vermillion circles 2 mM CaCl2. Error bars show standard error of the mean. Lines connecting data points are simulations using association constants calculated from fits. Panels (C, D) in 5 mM EGTA and (E, F) in 2 mM Ca2+ show fitted mole fractions of free or bound proteins using the data in A, B. Shaded regions around the curve are within the standard error of the mean.
Figure 7
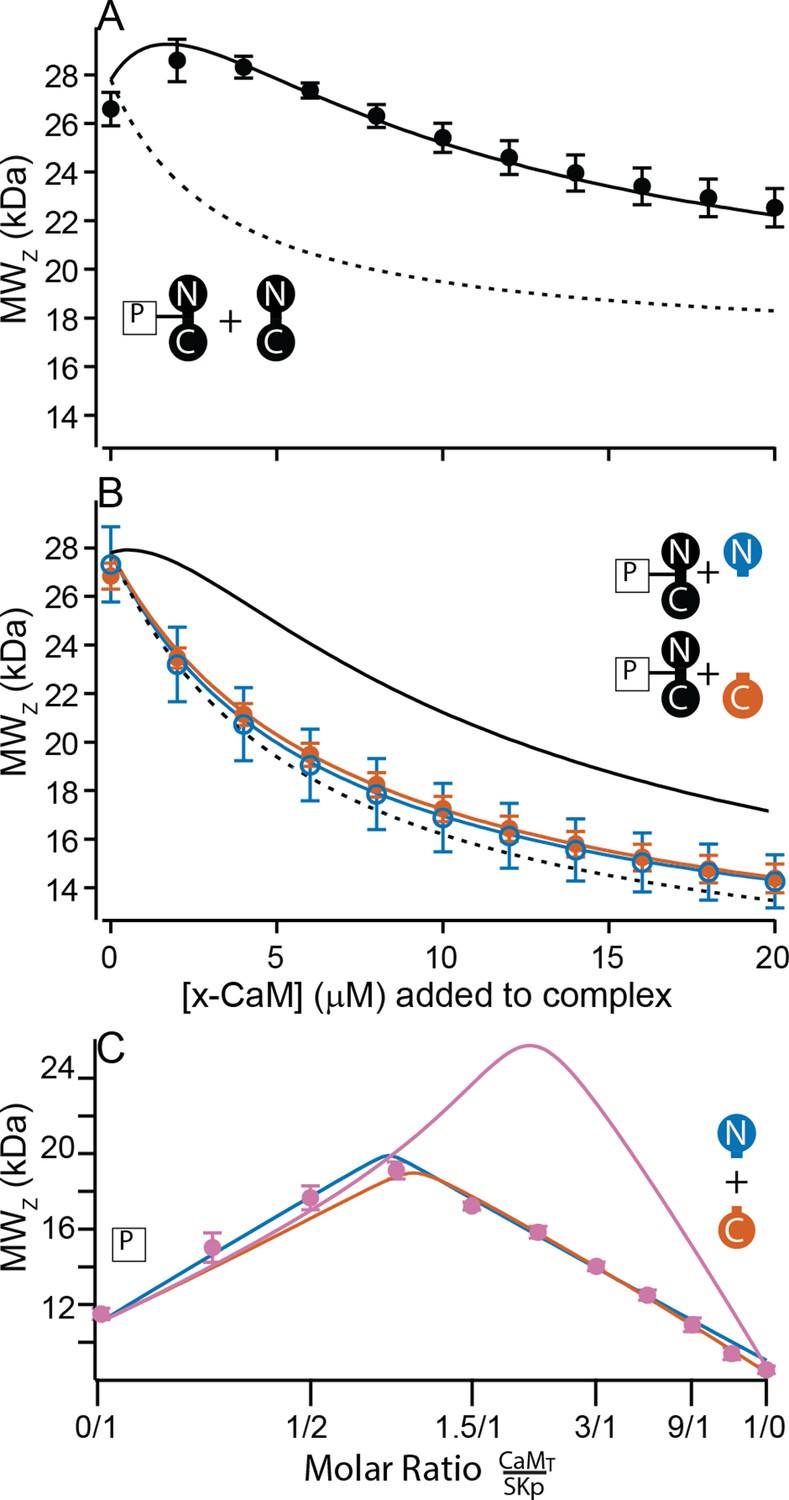
Only full-length CaM can bind to form the C-P-C complex.
(A, B) Weight average molar mass of complex as a function of added CaM. Note that the weight average molar mass decreases at higher concentrations of unbound protein relative to a complex. Full-length, WT-CaM was premixed with SKp at a 1:1 molar ratio to form the P-C complex. The same amount of P-C complex is mixed with increasing concentrations of WT-CaM (A) or half-CaM (B) N-CaM open blue circles, C-CaM closed vermillion circles. Solid line shows predicted weight average molar mass of C-P-C at higher concentrations of CaM using association constants used from fits to Figure 3A. The dashed line shows prediction if P-C stays bound but no additional molecules bind. (C) Weight average molar mass, closed circles, as a function of molar ratio of total CaM:SKp at 2 mM Ca2+. CaMT (total CaM) has equal parts of N-CaM and C-CaM. Blue line is the simulation N-CaM binding to SKp from Figure 6A, vermillion line C-CaM binding to SKp from Figure 6B, and purple line is a simulation if both N-CaM and C-CaM bind SKp together.
Figure 8
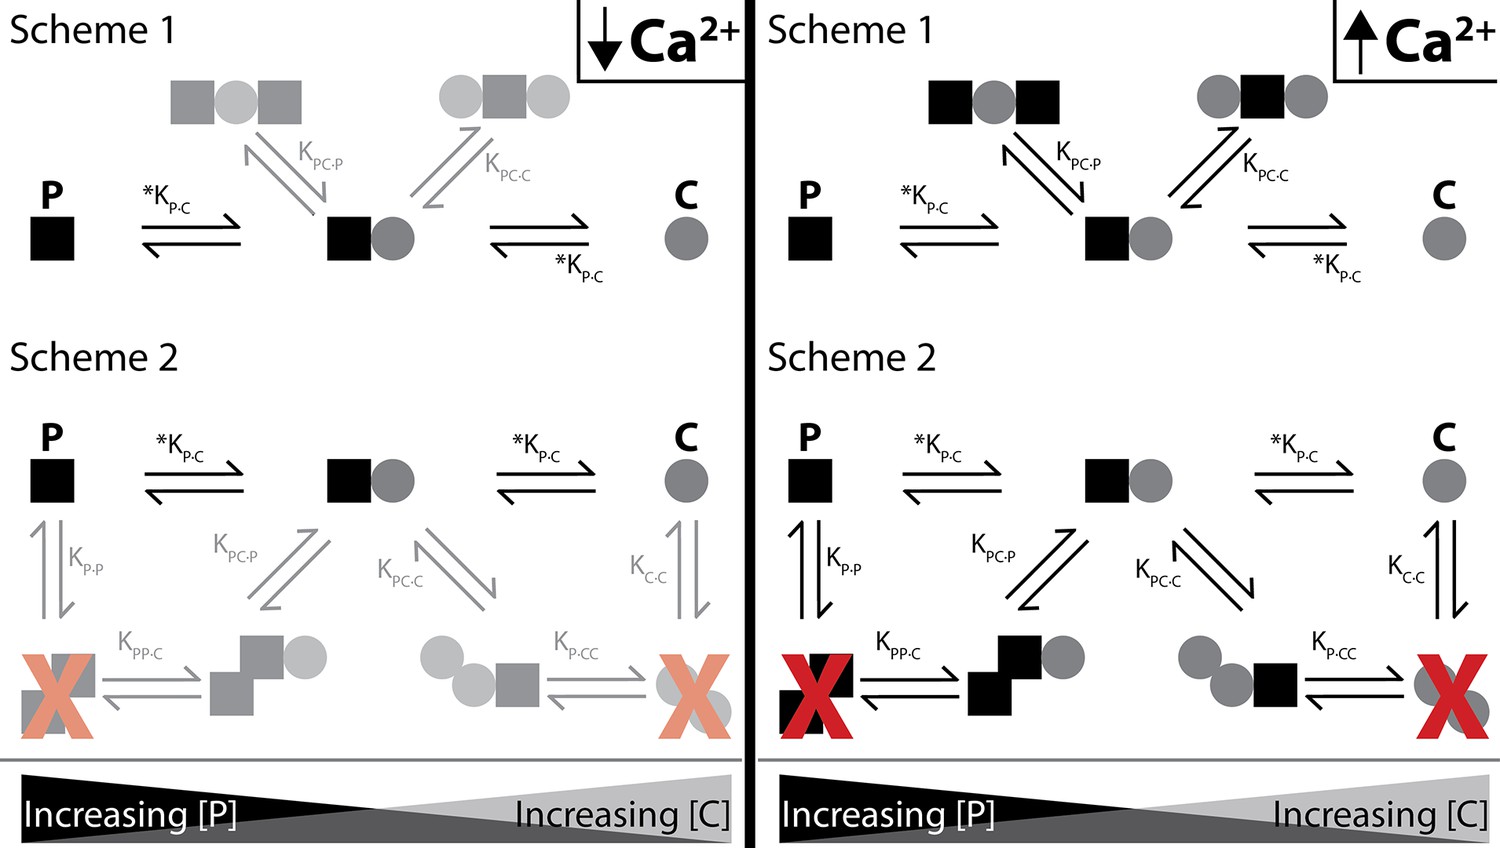
Shematics showing different configurations of stoichiometries between WT-CaM and SKp.
SKp is represented as a black square; CaM is represented as a gray circle. Different stoichiometries are favored at different molar ratios of peptide and CaM in solution. Ca2+ allows peptide and CaM to bind with additional stoichiometries.
Tables
Table 1
Quantification of effects exogenous CaM protein has on SK current recovery.
| CaM construct | n | Fraction of recovered current (median) | Fraction of recovered current (mean) | Standard deviation |
|---|---|---|---|---|
| WT | 25 | .95 | .86 | .21 |
| CaM (E34Q) | 4 | .54 | .50 | .16 |
| N-CaM | 4 | .02 | .05 | .09 |
| C-CaM | 4 | .007 | .03 | .08 |
| N-CaM + C-CaM | 5 | .05 | .07 | .06 |
| Double N-lobe | 4 | .09 | .08 | .04 |
| Double C-lobe | 4 | .21 | .19 | .12 |
Table 2
Fitted association constants, KA, from composition-gradient multi-angle light scattering (CG-MALS), shown as ‘mean log KA (standard error) n’, where n = number of trials.
| SKp + CaM construct | 1SKp/1CaM(P-C) | 2SKp/1CaM(P-C-P) | 1SKp/2CaM(C-P-C) | 2SKp/2CaM(2x P-C) | |||||||
|---|---|---|---|---|---|---|---|---|---|---|---|
| −Ca2+ | +Ca2+ | −Ca2+ | +Ca2+ | −Ca2+ | +Ca2+ | −Ca2+ | +Ca2+ | ||||
| WT-CaM | 6.9 (0.2)5 | 10.4 (0.2)5 | 12.2 (0.1)5 | 17.0 (0.2)5 | – | 16.0 (0.3)5 | – | – | |||
| NN-CaM | *6.4 (0.1)3 | 7.0 (0.1)4 | 11.5 (0.1)3 | 12.5 (0.1)4 | – | 12.3 (0.1)4 | – | – | |||
| CC-CaM | 9.9 (0.1)3 | 9.7 (0.9)3 | 15.1 (0.5)3 | 16.5 (1.0)3 | – | 14.8 (0.9)3 | – | – | |||
| N-CaM | 5.1 (0.1)3 | 8.9 (0.7)3 | – | – | – | – | – | – | |||
| C-CaM | 7.6 (0.2)3 | 8.1 (0.7)3 | – | – | – | – | – | – | |||
| CaM (E12Q) | 8.2 (0.7)3 | 8.8 (0.8)3 | 13.2 (0.7)3 | 14.0 (0.9)3 | – | – | – | – | |||
| CaM (E34Q) | 8.3 (0.8)3 | 9.1 (0.1)6 | 13.1 (0.9)3 | 15.8 (0.1)6 | – | – | – | 23.3 (0.1)6 | |||
-
*
Italicized values fall outside the limit of detection for modeling KA, or fits are ill constrained.
Additional files
Download links
A two-part list of links to download the article, or parts of the article, in various formats.
Downloads (link to download the article as PDF)
Open citations (links to open the citations from this article in various online reference manager services)
Cite this article (links to download the citations from this article in formats compatible with various reference manager tools)
Calcium dependence of both lobes of calmodulin is involved in binding to a cytoplasmic domain of SK channels
eLife 11:e81303.
https://doi.org/10.7554/eLife.81303


