Cross-talk between red blood cells and plasma influences blood flow and omics phenotypes in severe COVID-19
- Dynamics of Fluids, Department of Experimental Physics, Saarland University, Germany
- Institute for Clinical and Experimental Surgery, Campus University Hospital, Saarland University, Germany
- Cysmic GmbH, Germany
- Department of Biochemistry and Molecular Genetics, University of Colorado Denver, United States
- Department of Anesthesiology, Intensive Care, Emergency and Pain Medicine, University Hospital Wuerzburg, Germany
- Department of Anesthesiology, Intensive Care Medicine and Pain Therapy, University Hospital Frankfurt, Germany
- Fraunhofer Institute for Translational Medicine and Pharmacology ITMP, Germany
- Department of Physics and Materials Science, University of Luxembourg, Luxembourg
- Theoretical Medicine and Biosciences, Campus University Hospital, Saarland University, Germany
Figures
Figure 1 with 2 supplements

Representative red blood cell (RBC) shapes in healthy and COVID-19 patients and related phase diagrams.
(A) Overview of the four sample groups, referred to as ‘X RBCs in X plasma’, e.g. CinC for Control RBCs in Control plasma, and so on for PinP, PinC, and CinP. (B) Representation images of RBC shapes in stasis for the four sample groups. Scale bars in (B) correspond to a length of 10 µm. Representative images of (C) healthy and (D) pathological RBC shapes found in COVID-19 patients. Scale bars in (C) and (D) correspondto a length of 2.5 μm. (E) Representative shape phase diagrams of two donors (a control and a patient) for the four sample groups. The upper panels show the phase diagrams of the donors in autologous plasma, while the lower panels correspond to the same donors in allogeneic exchanged plasma.
-
Figure 1—source data 1
Patient information.
- https://cdn.elifesciences.org/articles/81316/elife-81316-fig1-data1-v1.xlsx
Figure 1—figure supplement 1
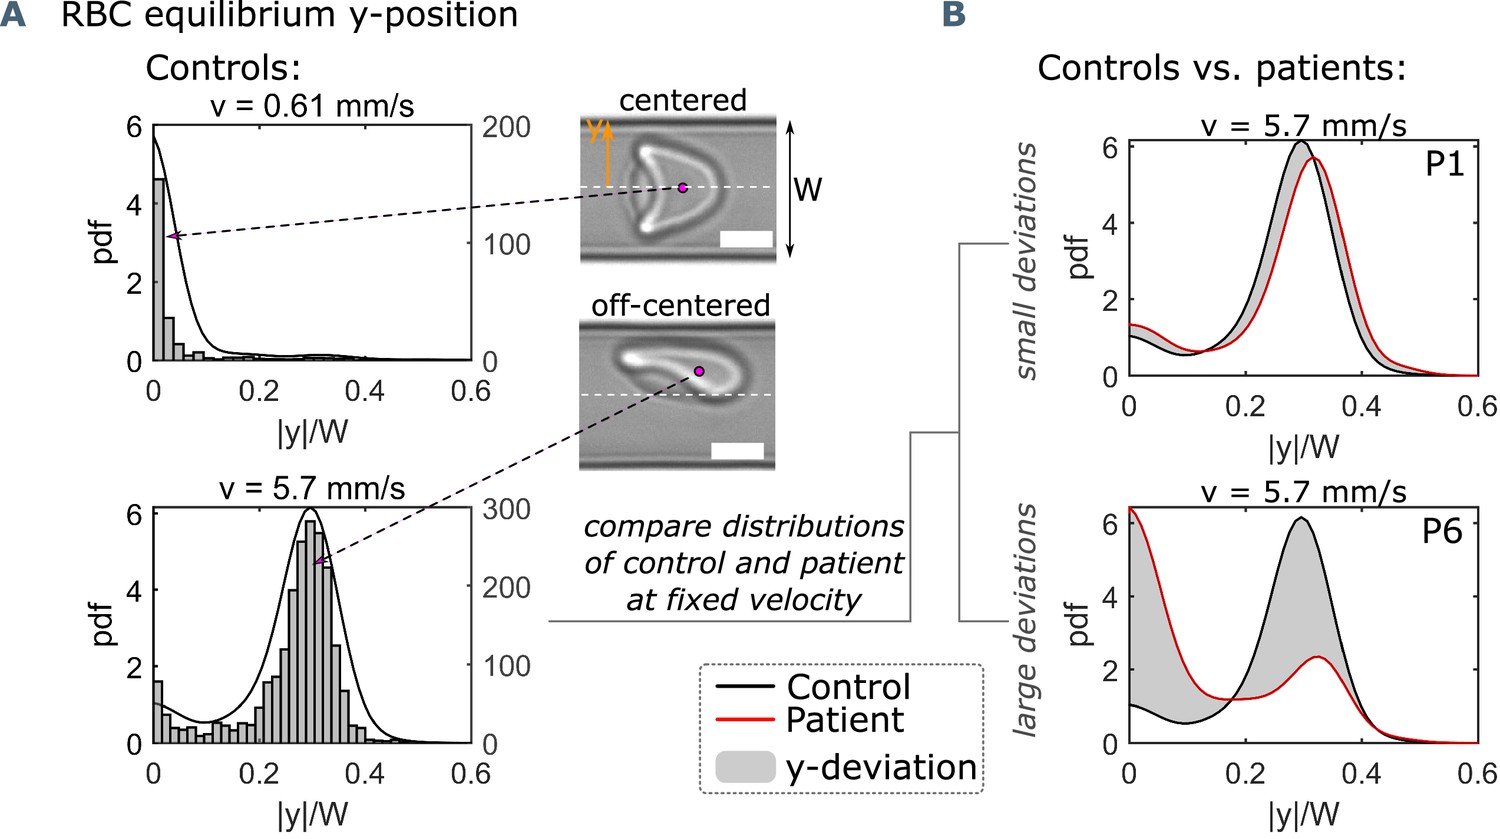
Single-cell flow characteristics.
(A) Histograms and probability density distributions (pdfs) of the absolute value of the RBC y-position, normalized by the channel width W, at a representative low and high mean RBC velocity of 0.61 mm s−1 and 5.7 mm s−1, respectively. Scale bars represent a length of 5 μm. (B) Pdfs of the normalized y-position at 5.7 mm s−1 for a healthy control and two patients (P1 and P6), indicating a small and large y-deviation (gray area) between the control and the corresponding patient.
Figure 1—figure supplement 2
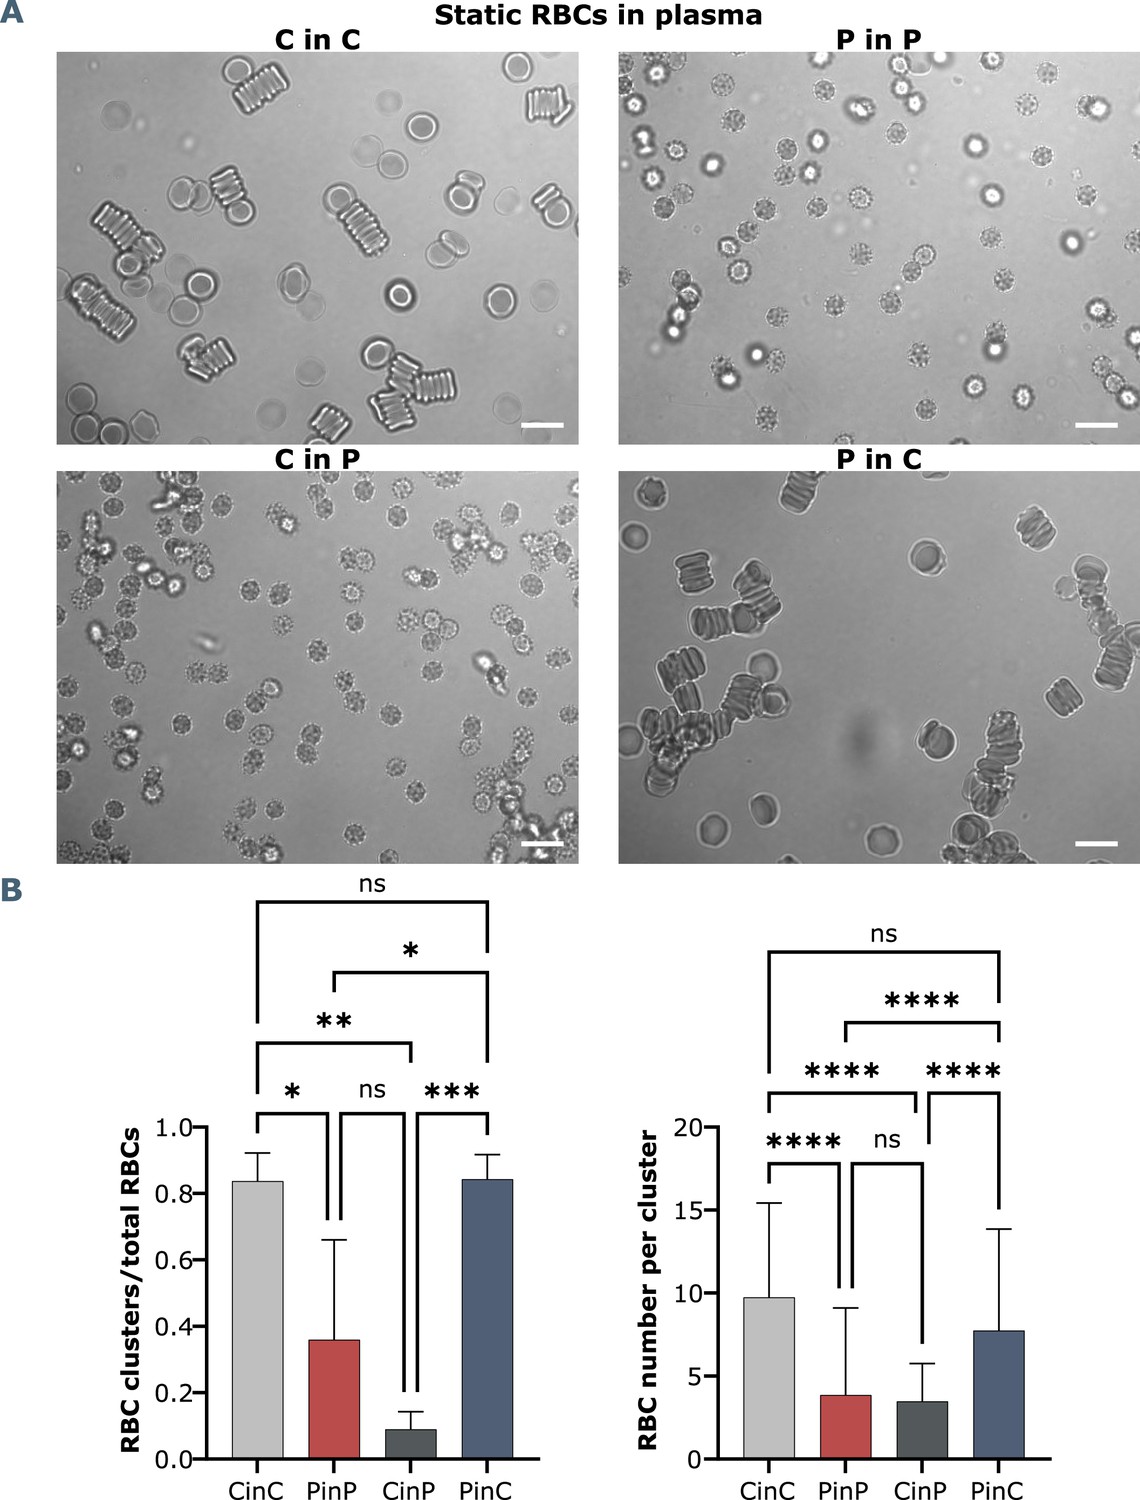
Brightfield microscopy and quantification of RBC shapes and clusters in stasis.
(A) Representative RBC images from one healthy control in autologous plasma (CinC), one COVID-19 patient (PinP), and respective plasma exchanges, with control RBCs in patient plasma (CinP) and patient RBCs in control plasma (PinC). Scale bars represent 10 μm. (B) Quantification and statistical analysis by ANOVA from seven COVID-19 patients and three healhty controls. Left panel: ratio of RBC clusters over the total number of RBCs, right panel: number of RBCs per cluster.
Figure 2
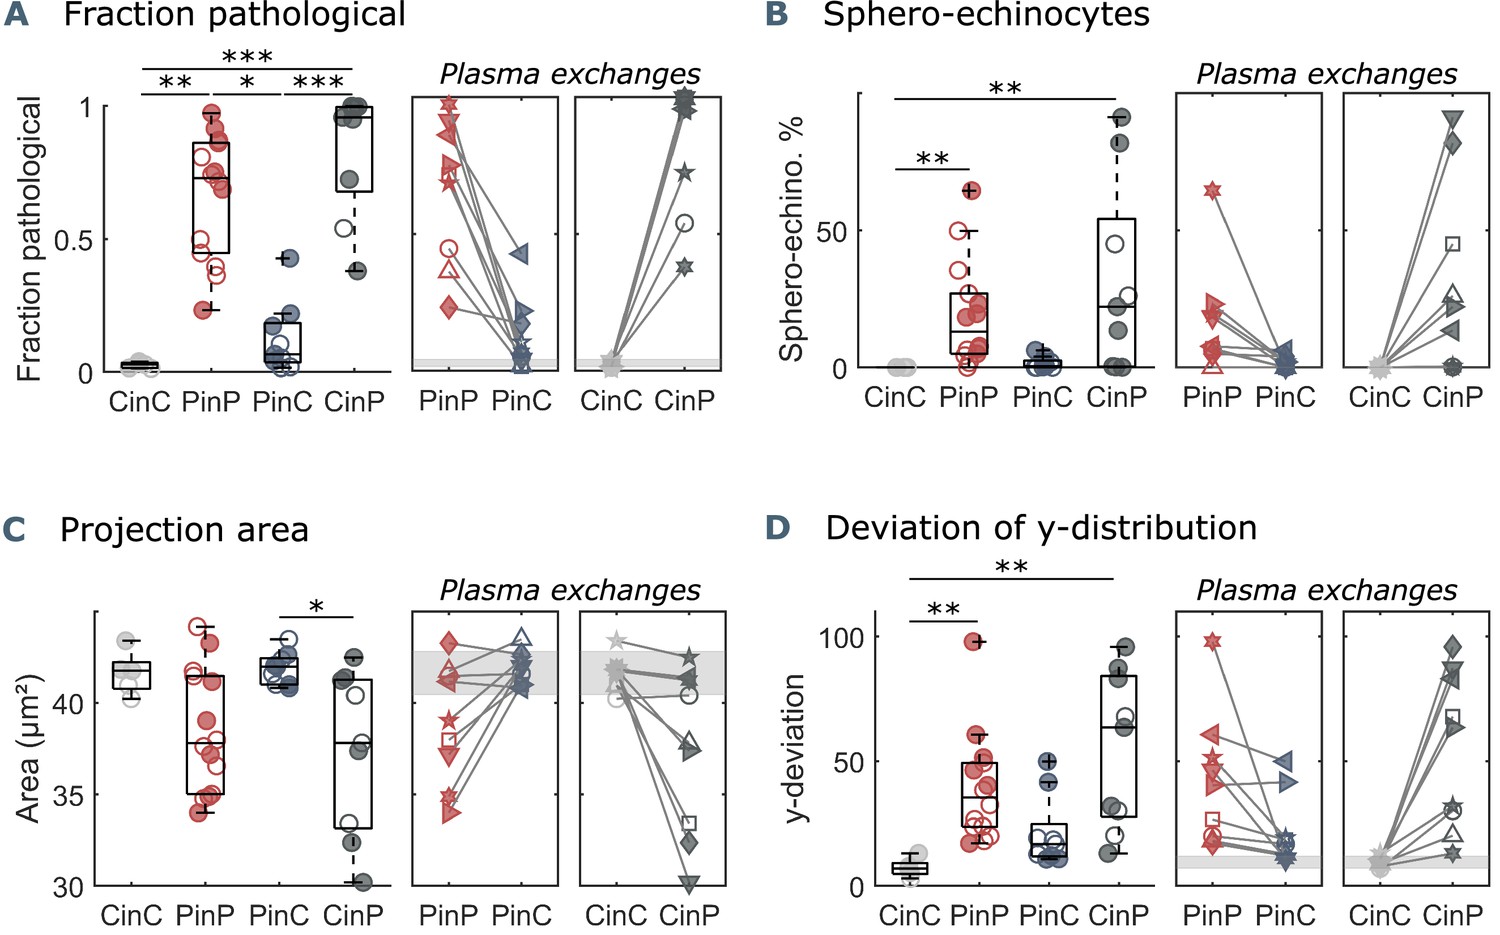
Parameters used for microfluidic flow analysis for the four sample groups.
(A) Fraction of pathological RBC shapes, (B) percentage of sphero-echinocytes, (C) RBC 2D projection area in a velocity range of 1-3 mm s-1, and (D) deviation of the RBC distribution in y-direction based on the average of controls (CinC) in a velocity range of 5-10 mm s-1. Left panels (A–D) show data as boxplots with superimposed individual data points. Filled symbols correspond to samples that are included in the metabolomics and proteomics analyses (Figure 3 and Figure 4). The bottom and top of each box are the 25th and 75th percentiles of the sample, respectively. The line in the middle of each box is the sample median. Whiskers go from the end of the interquartile range to the furthest observation. Data beyond the whisker length are marked as outliers with ’+’ signs. * refers to a significance level of p<0.05, ** to p<0.01, and *** to p<0.001. Right panels (A–D) show the effect of plasma exchange for individual donors. Gray areas correspond to the mean and standard deviations for controls (CinC) of the corresponding data.
Figure 3
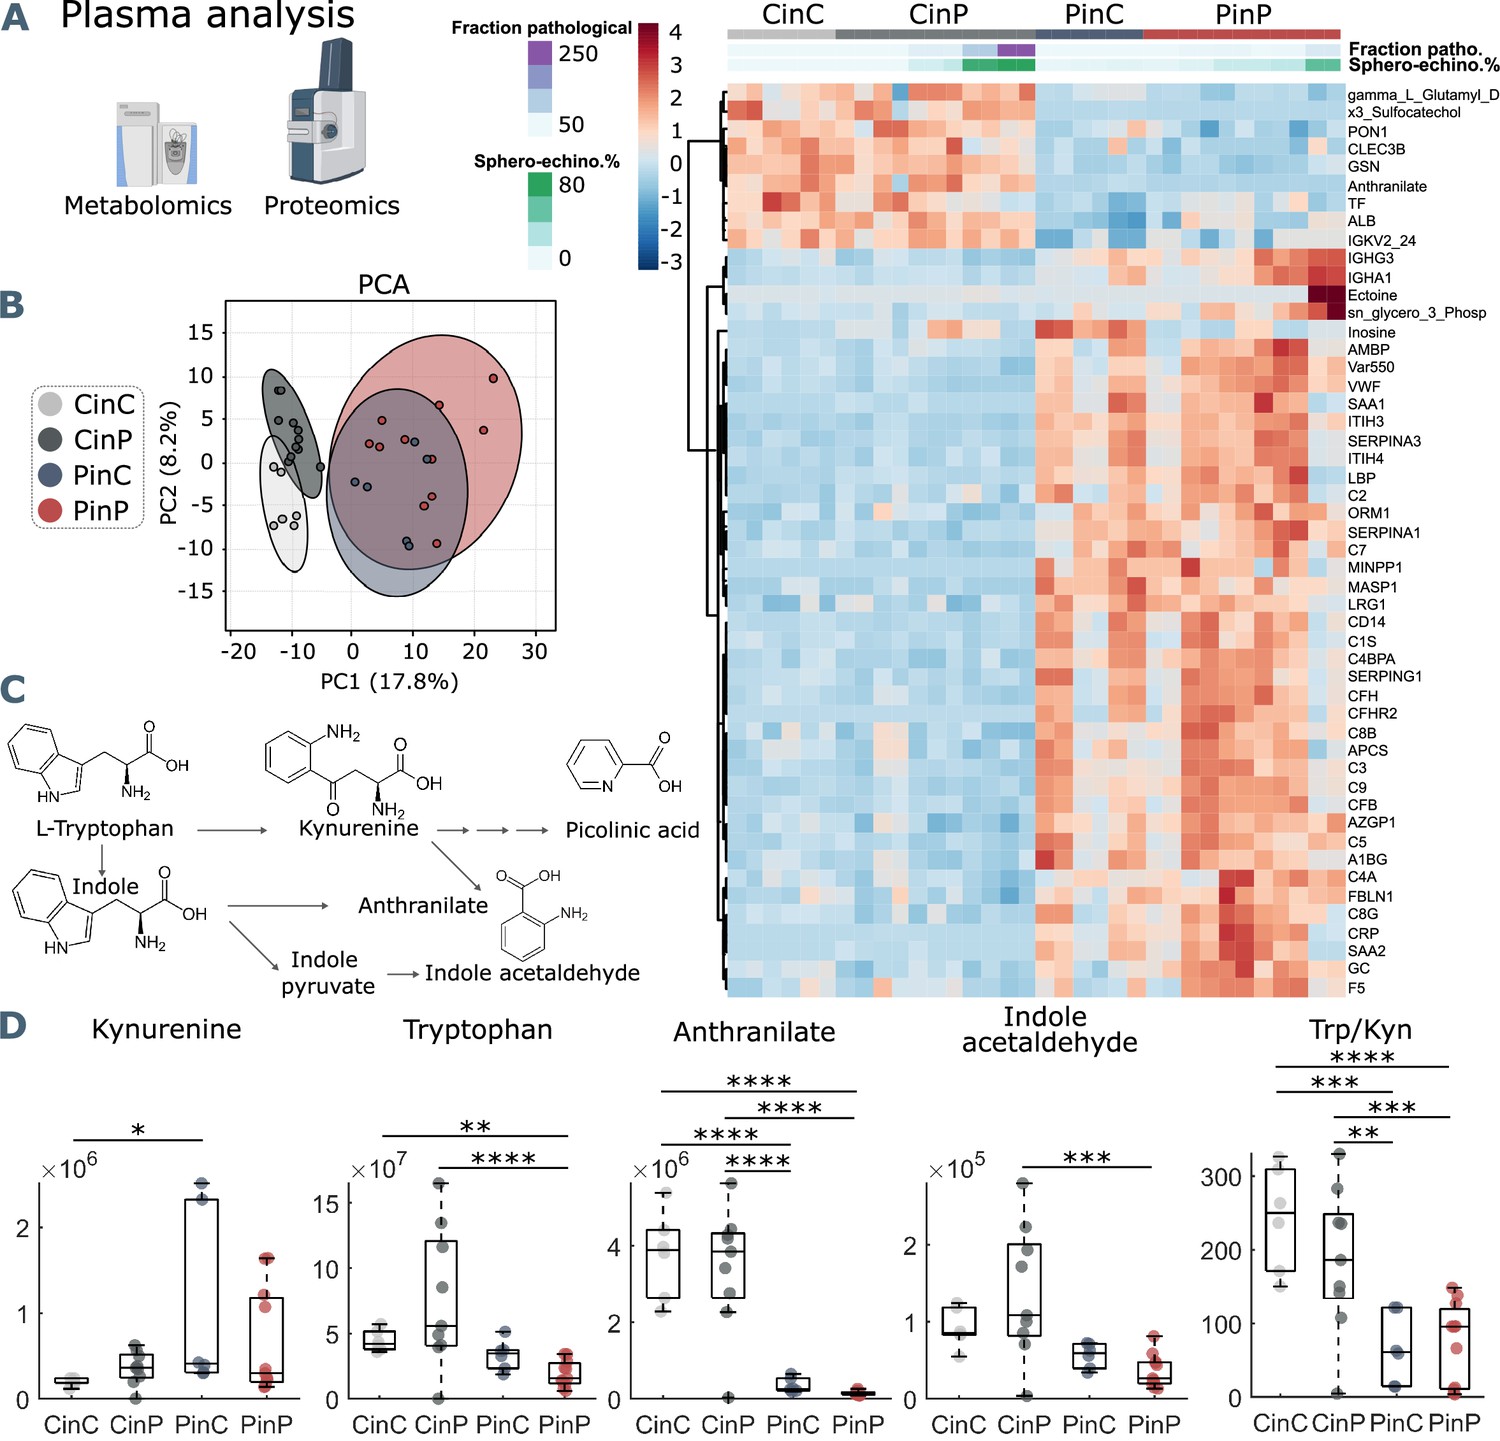
Metabolomics and proteomics analyses of plasma from the four sample groups.
(A) Hierarchical clustering analysis of the top 50 metabolites and proteins by two-way ANOVA test that exhibited the most pronounced changes. (B) Principal component analysis (PCA) performed on the metabolomics and proteomics plasma data presented in Figure 3—source data 1 shows distinct groups. (C) Schematic representation of tryptophan pathway to kynurenine, anthranilate, and indole acetaldehyde formation. (D) Boxplots of all samples for each group showing statistical differences in selected molecules generated in the tryptophan-kynurenine pathway. Y-axis indicates peak areas for each selected analyte, as determined by UHPLC-MS. Statistically-significant differences exist between controls (CinC) and patients (PinP) in the levels of tryptophan and anthranilate. Plasma exchanges cause strong significant differences in anthranilate levels and the ratio tryptophan-kynurenine (Trp/Kyn) in all groups, a marker of COVID-19 disease severity and mortality in previous studies (D’Alessandro et al., 2021b).
-
Figure 3—source data 1
All analyzed metabolites and proteins.
- https://cdn.elifesciences.org/articles/81316/elife-81316-fig3-data1-v1.xlsx
Figure 4 with 2 supplements
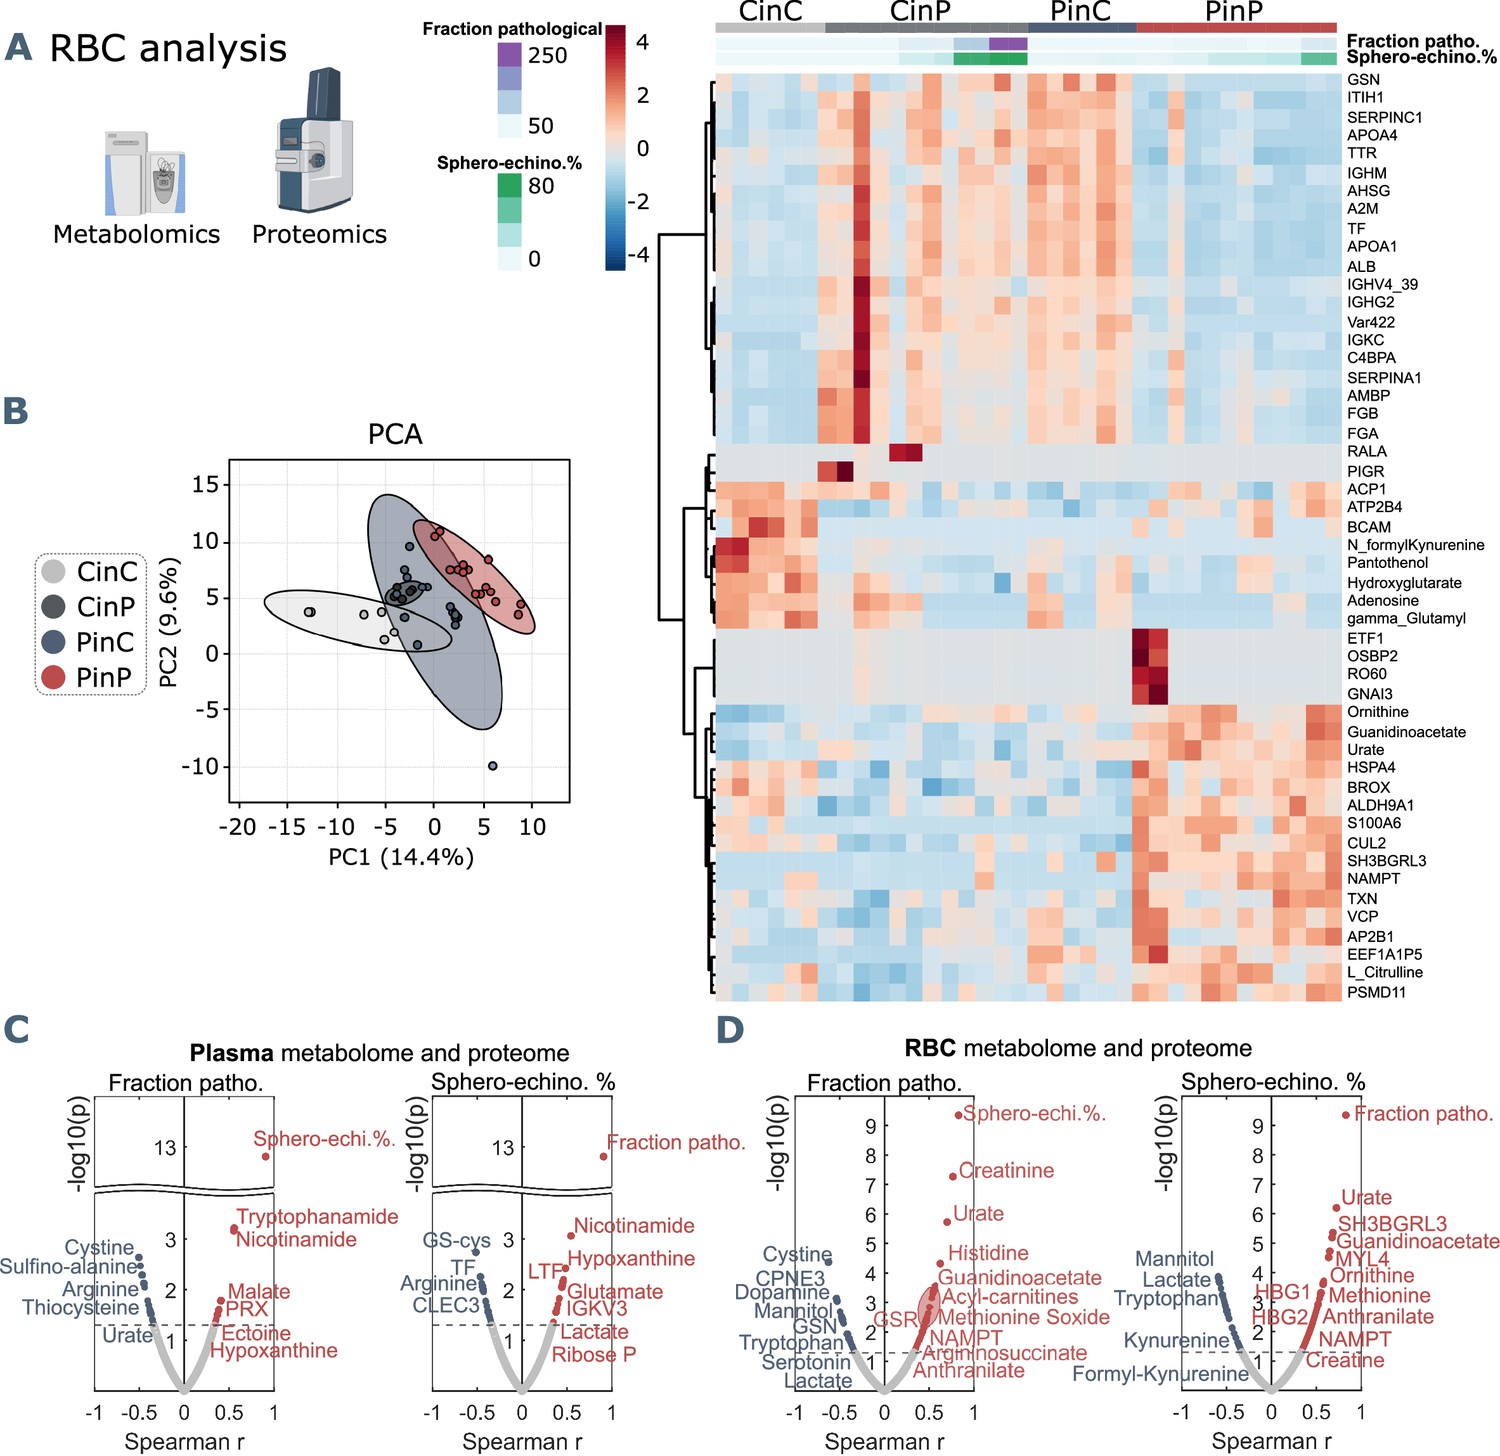
Metabolomics and proteomics analyses on RBCs of the four sample groups and correlation analyses with shape parameters.
(A) Hierarchical clustering analysis of the top 50 metabolites and proteins in RBCs by two-way ANOVA test that exhibited the most pronounced changes. (B) PCA analysis performed on the metabolomics and proteomics from RBC content presented in Figure 3—source data 1 showing clusters of each sample group, where CinC is neighboured by the overlapping clusters CinP and PinC, and PinP as the furthest cluster. Plasma and RBC Spearman correlation analysis of RBC shape parameters with omics data. Volcano plot representations highlight the most significant proteins and metabolites in plasma (C) and in RBCs (D) positively (red) or negatively (blue) correlated to the fraction of pathological RBC shapes (left panels in C and D) or sphero-echinocyte percentage (right panels in C and D). p values are plotted on the y-axis versus magnitude of change (fold change) on the x-axis; significance threshold is set at p<0.05.
Figure 4—figure supplement 1
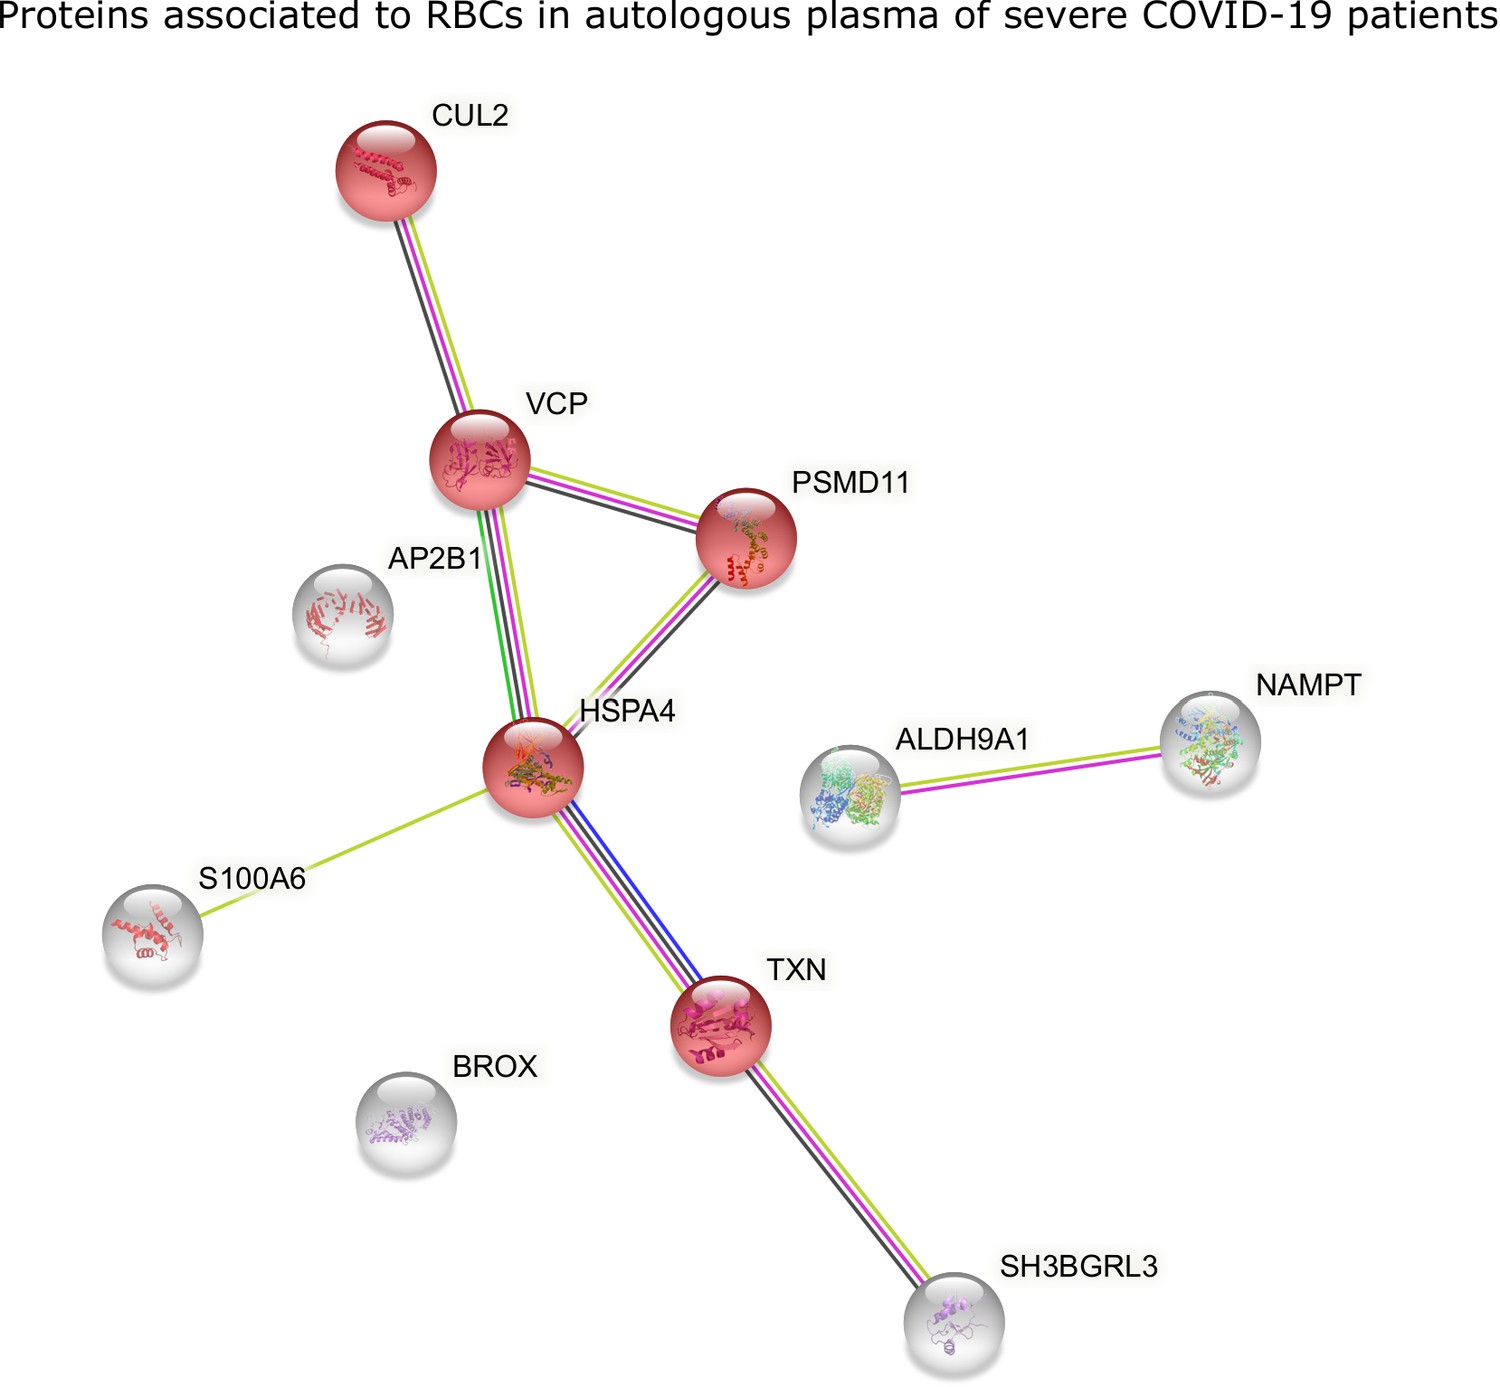
STRING analysis of proteins in RBCs of COVID-19 patients.
STRING analysis of proteins with significantly higher levels in RBCs of COVID-19 patients in autologous plasma. Evidenced in red are proteins associated with cellular responses to stress, involving ubiquitin-protein ligase complexes (CUL2), proteasome (PSMD11) and redox activity (TXN).
Figure 4—figure supplement 2
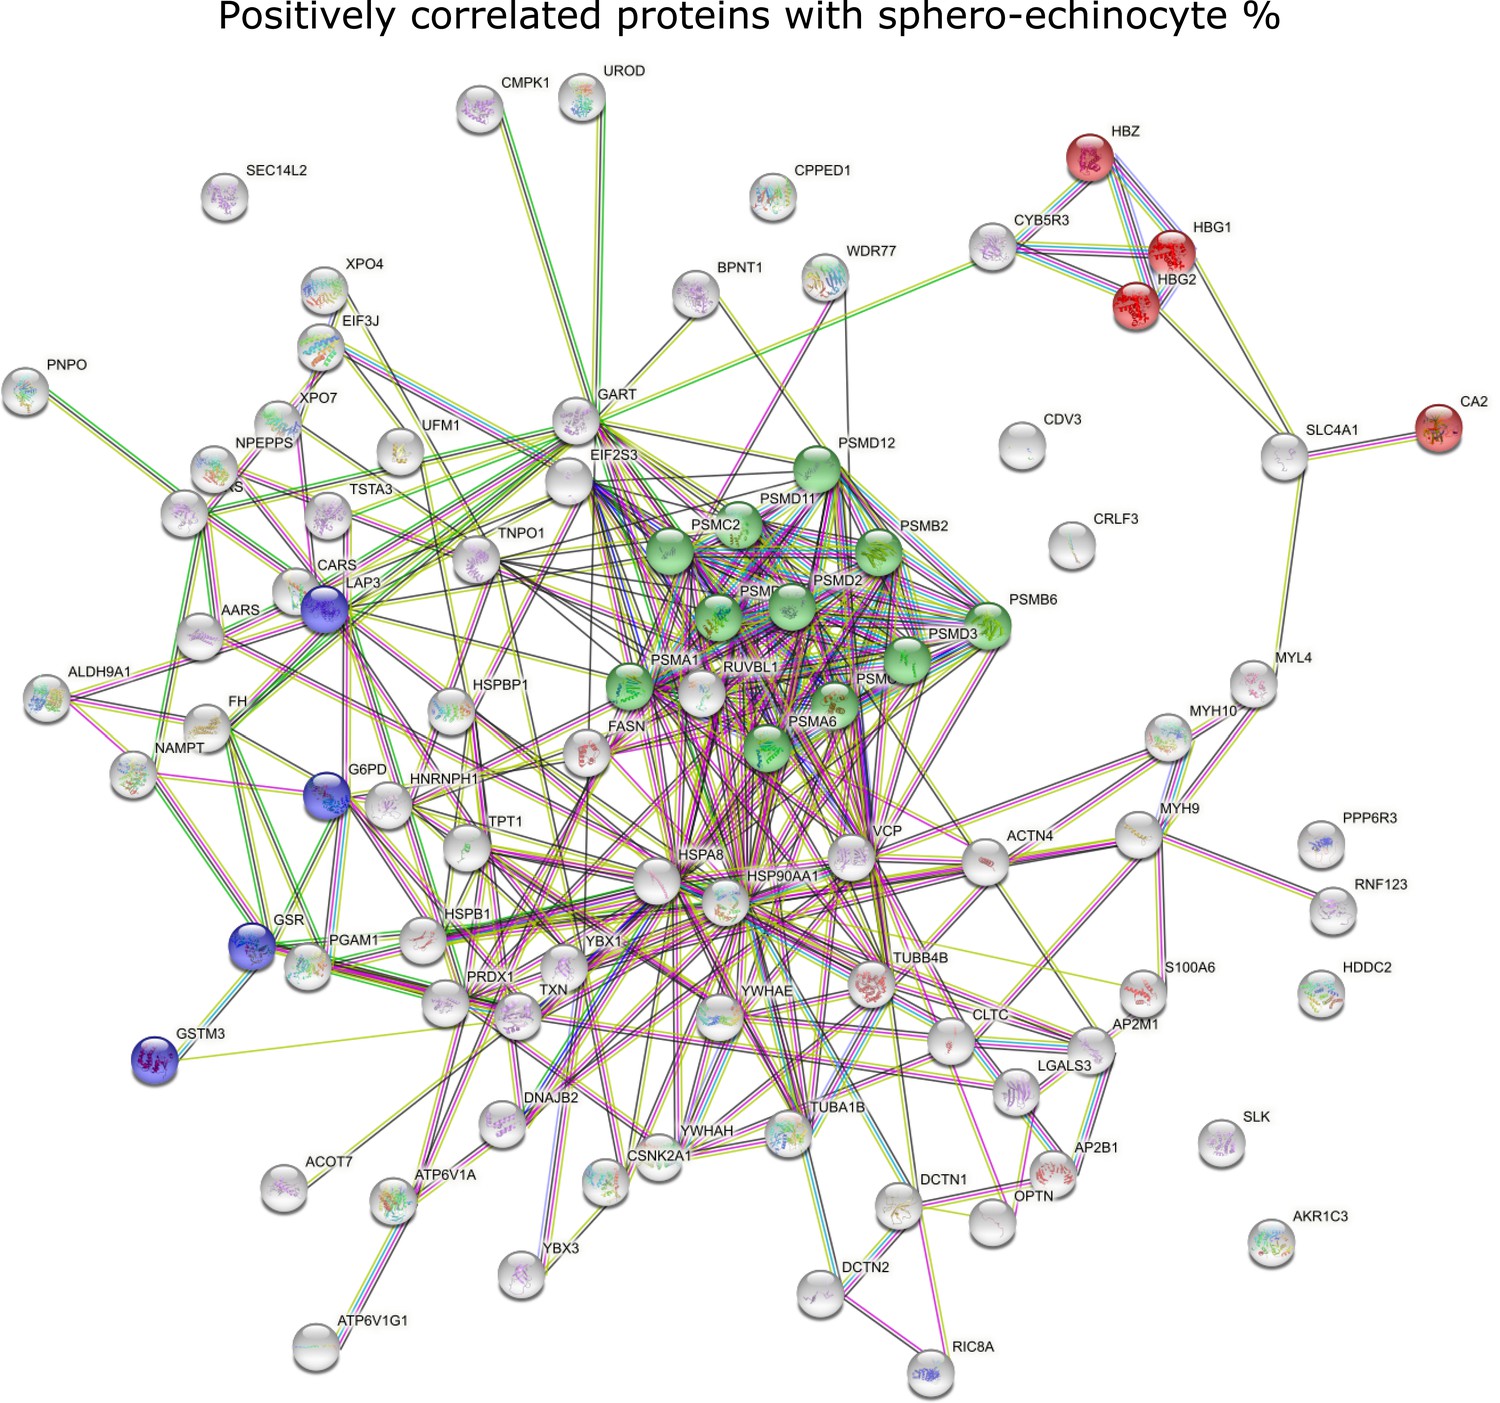
STRING analysis of positively correlated proteins with spheroechinocyte percentage, highlighting the main processes involving pathological RBCs in COVID-19.
Red: proteins involved in gas transport; green: proteasome-related proteins; purple: glutathione metabolism-related proteins.
Additional files
Download links
A two-part list of links to download the article, or parts of the article, in various formats.
Downloads (link to download the article as PDF)
Open citations (links to open the citations from this article in various online reference manager services)
Cite this article (links to download the citations from this article in formats compatible with various reference manager tools)
Cross-talk between red blood cells and plasma influences blood flow and omics phenotypes in severe COVID-19
eLife 11:e81316.
https://doi.org/10.7554/eLife.81316


