Landmark-based spatial navigation across the human lifespan
- Sorbonne Université, INSERM, CNRS, Institut de la Vision, France
- Kavli Institute for Systems Neuroscience, Centre for Neural Computation, The Egil and Pauline Braathen and Fred Kavli Centre for Cortical Microcircuits, NTNU, Norway
- Max Planck Institute for Human Cognitive and Brain Sciences, Germany
- Institut de la Vision, Streetlab, France
- Department of Ophthalmology, The University of Pittsburgh School of Medicine, United States
- CHNO des Quinze-Vingts, INSERM-DGOS CIC, France
- Department of Ophthalmology, Fondation Ophtalmologique Rothschild, France
Figures
Figure 1 with 1 supplement
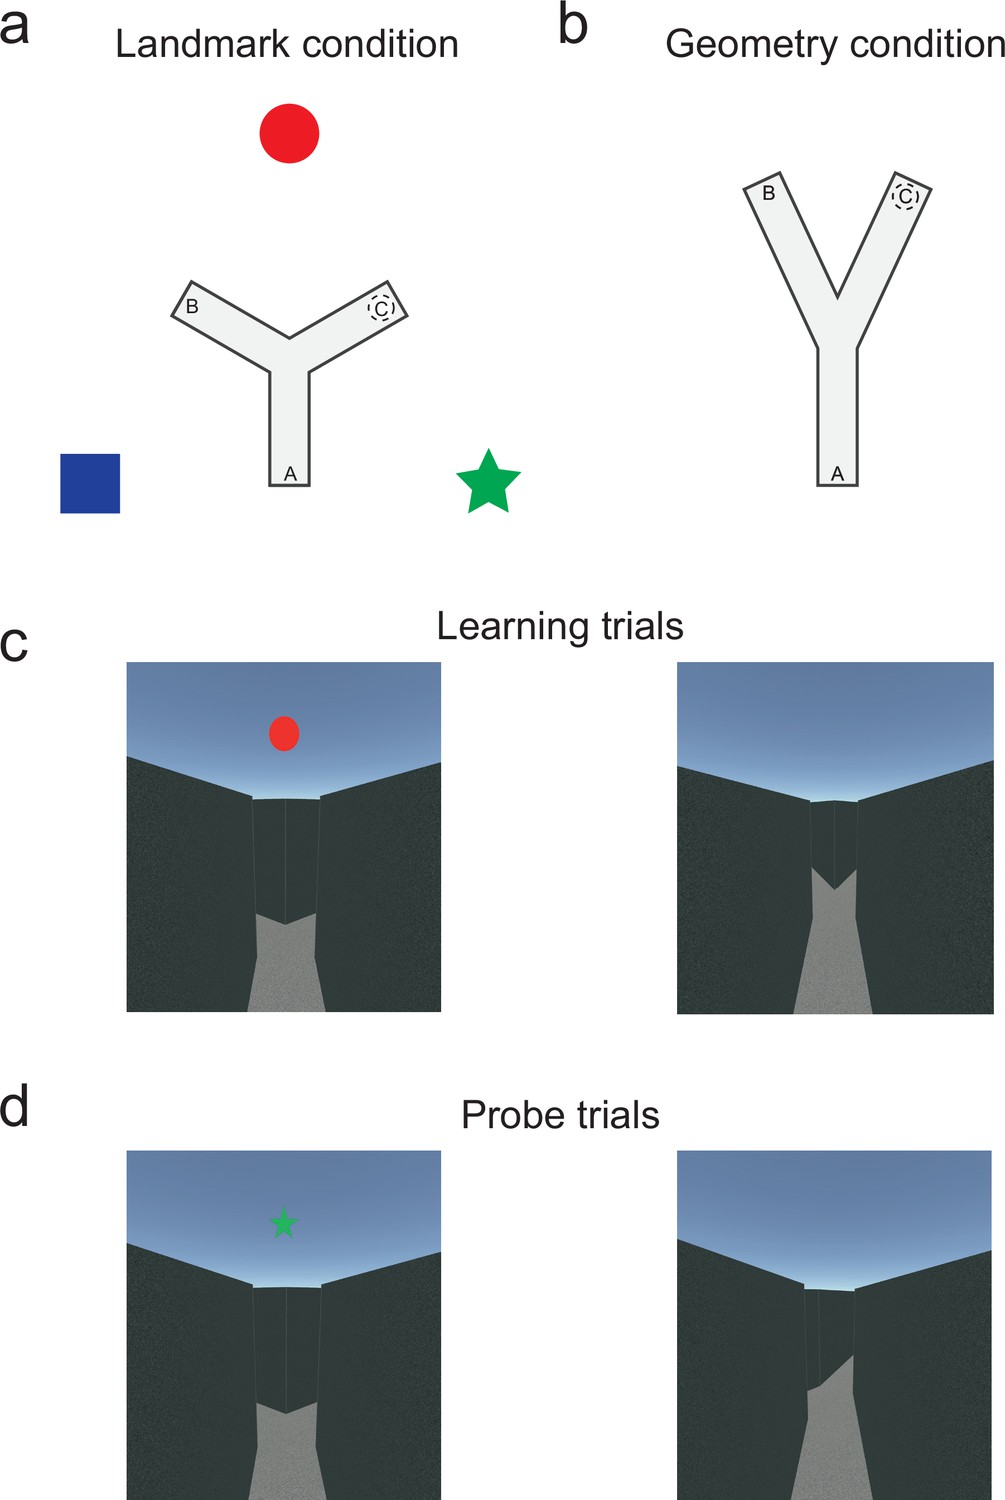
Immersive Y-maze tasks to assess the relative influence of landmark and geometric spatial cues as a function of age.
(a) Top view of the Y-maze during the classical landmark condition (i.e., equiangular Y-maze; arm separation: 120°/120°/120°). Three distinct, distal landmarks (blue square, red circle, green star) cued the environment. (b) Top view of the Y-maze during the novel geometry condition (i.e., anisotropic geometric layout with no landmarks; arm separation: 50°/155°/155°). As depicted in the figure, the corridors in this condition were 54% longer than in the landmark condition to avoid the participants to see the end of the corridors from the starting locations. (c) Example of first-person perspective from the departure location during learning trials (i.e., position A in the maze) in the landmark and geometry condition (left and right, respectively). (d) Example of first-person perspective from the departure location during probe trials (i.e., position B in the maze) in the landmark and geometry condition (left and right, respectively). See Figure 1—figure supplement 1 for details on the real-world replica.
Figure 1—figure supplement 1
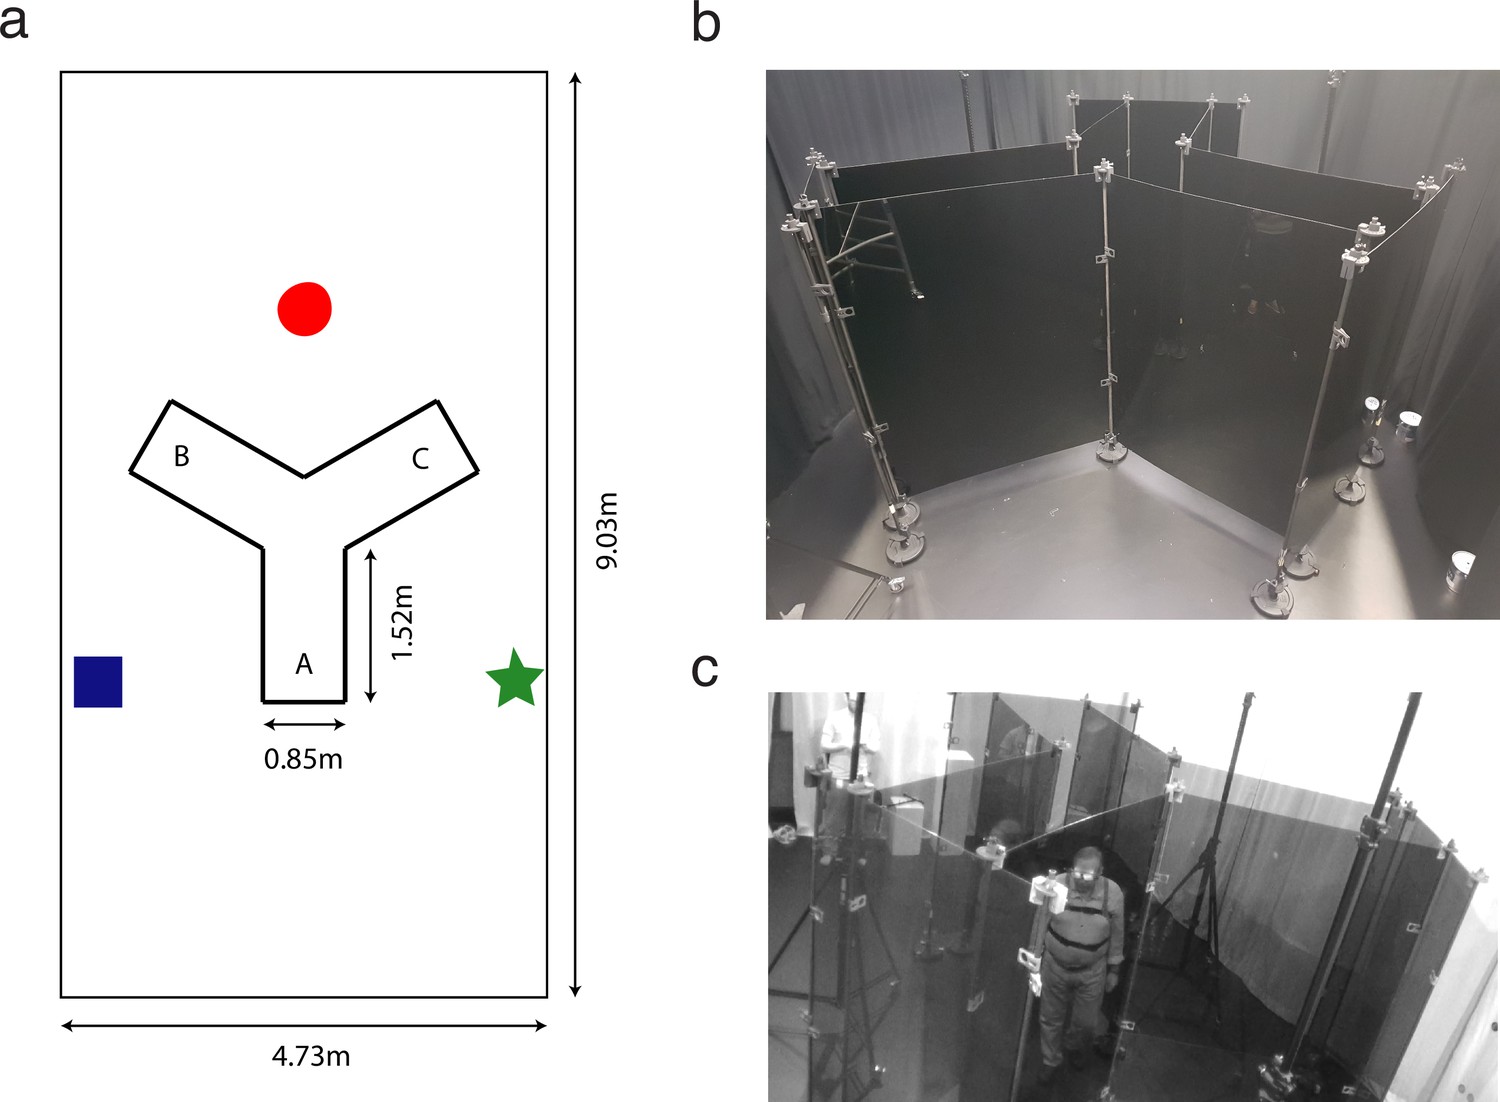
Real-world Y-maze implementation.
(a) Dimensions of the Y-maze in meters, as seen from above. Panels are 2.23 m high. A–C differentiate the three corridors (see protocol). Landmarks are 0.45 m2 pictures hanging from the ceiling at 2.82 m. They are positioned at 2.3 m from the maze center. (b, c) Customized Plexiglas panels were used to build the maze, which reflected the visible radiation while allowing infrared light to pass. Custom-made support frames held the IR-pass panels vertically.
Figure 2 with 1 supplement
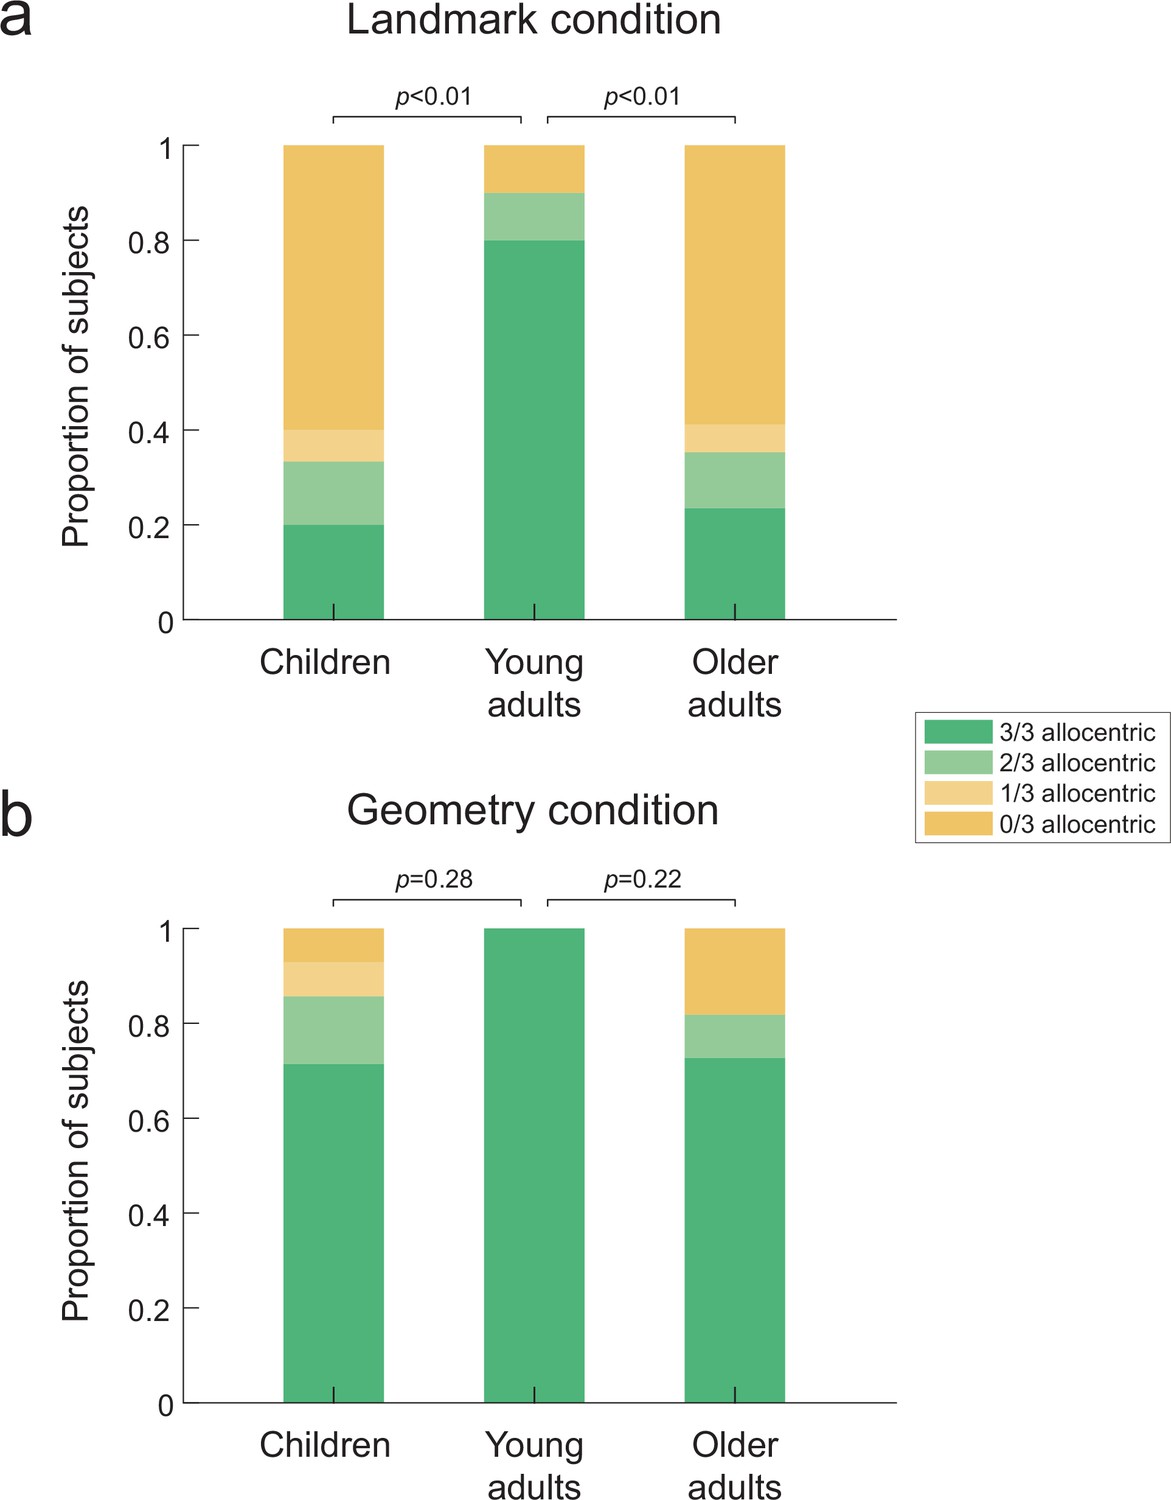
Proportion of allocentric behavioral responses during probe trials in the three age groups.
Bar plots indicate the proportion of subjects who made either a majority (i.e., 3/3 or 2/3) or a minority (i.e., 1/3 or 0/3) of allocentric choices during the three probe trials. That is, green corresponds to allocentric responses, whereas yellow indicates egocentric behaviors. (a) In the landmark condition (n=42), children and older adults failed to solve the Y-maze task since they mostly adopted an egocentric behavior. By contrast, a significant majority of young adults were able to solve the task allocentrically. (b) In the geometry condition (n=37), the three age groups behaved similarly, with children and older adults mostly using an allocentric strategy as young adults. p-Values correspond to pairwise comparisons using Fisher’s exact test across the corresponding age groups and strategy preferences. The source data for this figure is available in the Figure 2—source data 1. This figure corresponds to the strategy preference observed in the virtual reality settings. The same data for the real-world replica can be found in Figure 2—figure supplement 1a.
-
Figure 2—source data 1
Proportion of allocentric behavioral responses during probe trials across age groups.
- https://cdn.elifesciences.org/articles/81318/elife-81318-fig2-data1-v3.zip
Figure 2—figure supplement 1

Proportion of allocentric choices in the three probe trials.
(a) Proportion of subjects behaving allocentrically in the real-world Y-maze during the landmark condition (n = 17 participants: nine young and eight healthy older adults). (b–d) Proportion of subjects behaving allocentrically in the virtual Y-maze during landmark vs. geometry condition (n = 79 participants: 29 children, 22 young adults, and 28 healthy older adults). p-Values correspond to pairwise comparisons using Fisher’s exact test.
Figure 3 with 1 supplement
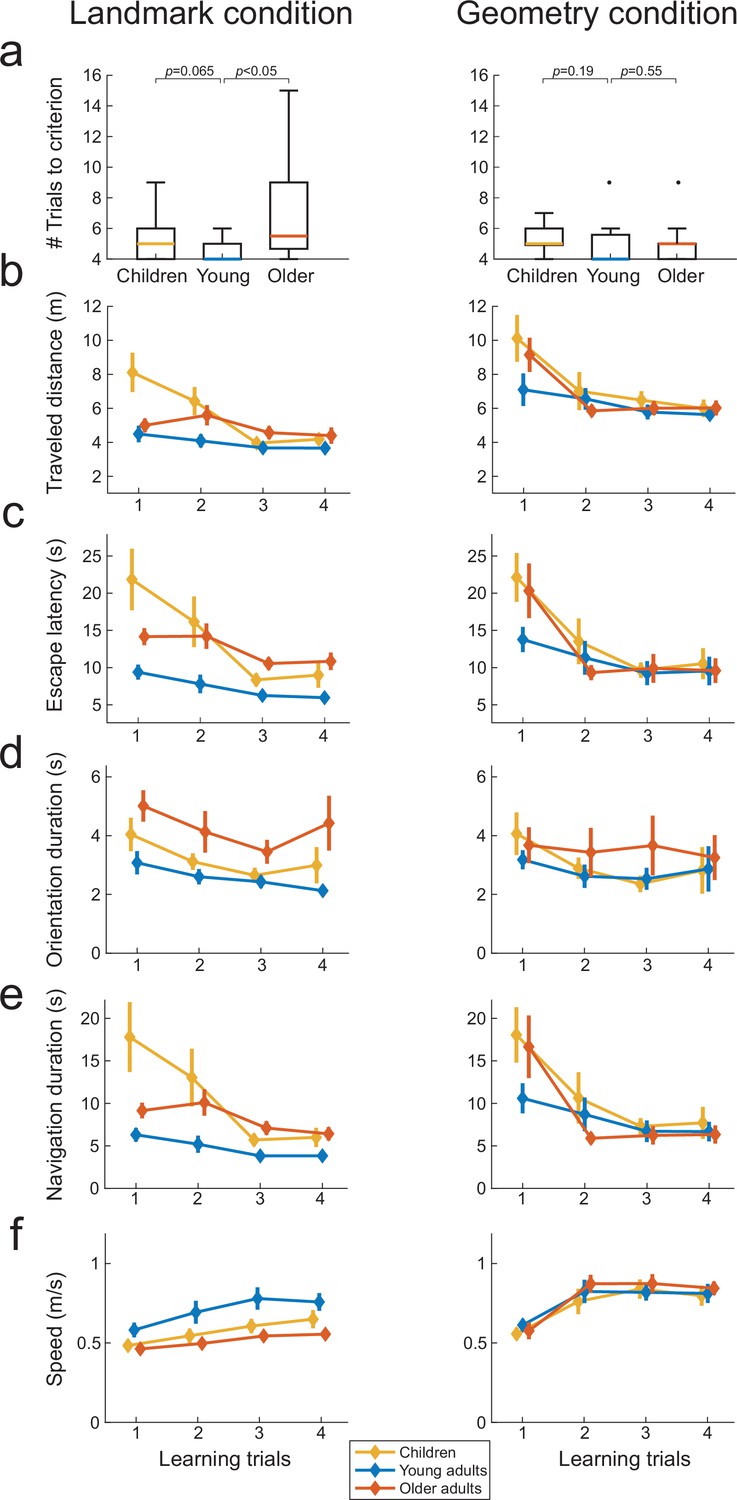
Spatial navigation performance during learning trials across the three age groups in the landmark (n=42, left) and geometry (n=37, right) conditions (a–f).
Colored lines represent median values for the three age groups. Box plots in (a) show the median (colored lines), the interquartile range (25th and 75th percentiles, length of the boxes), 1.5× interquartile range (whiskers) and outliers (dots). Error bars represent the standard error of the mean. p-Values in (a) shows uncorrected two-samples Mann–Whitney U tests.
Figure 3—figure supplement 1
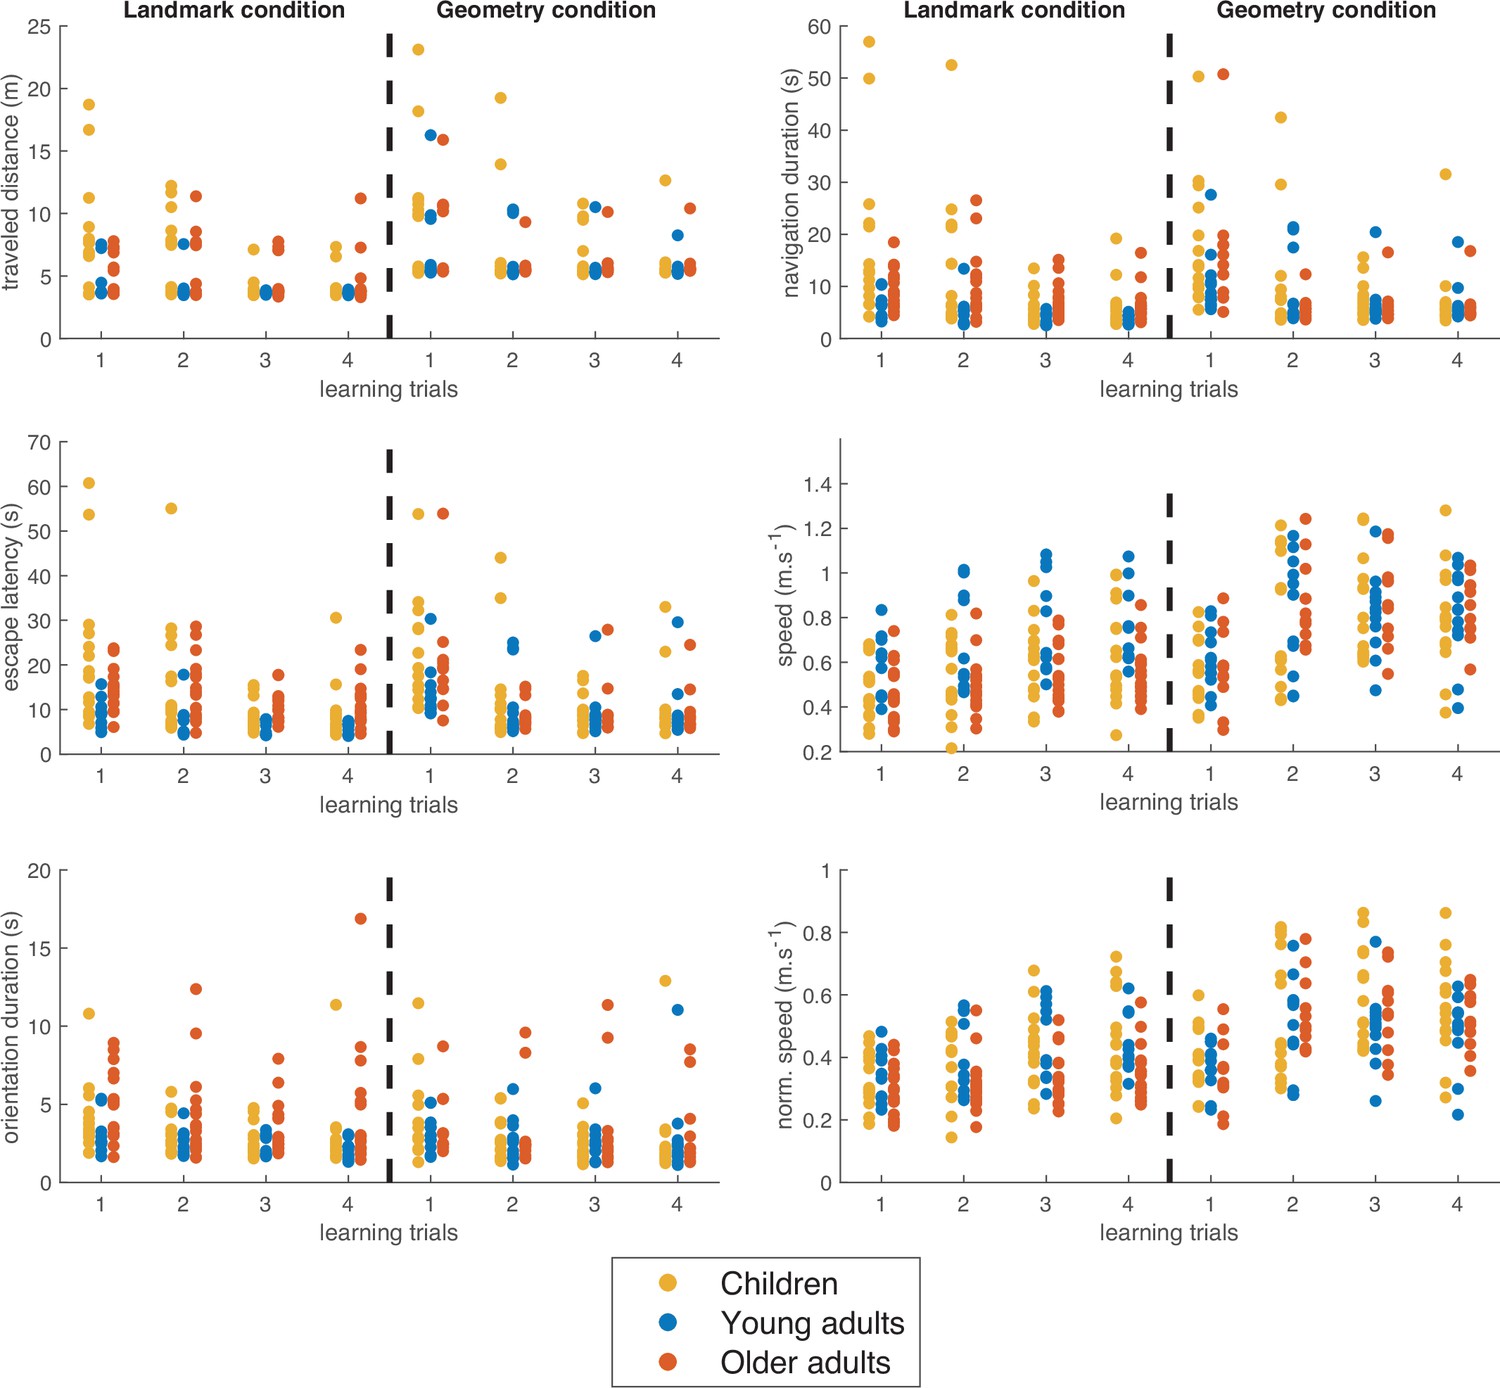
Scatter plots of the navigation variables for the first four trials of the learning phase across the three age groups.
Color code: children (yellow), young (blue), and older (orange) adults.
Figure 4 with 1 supplement
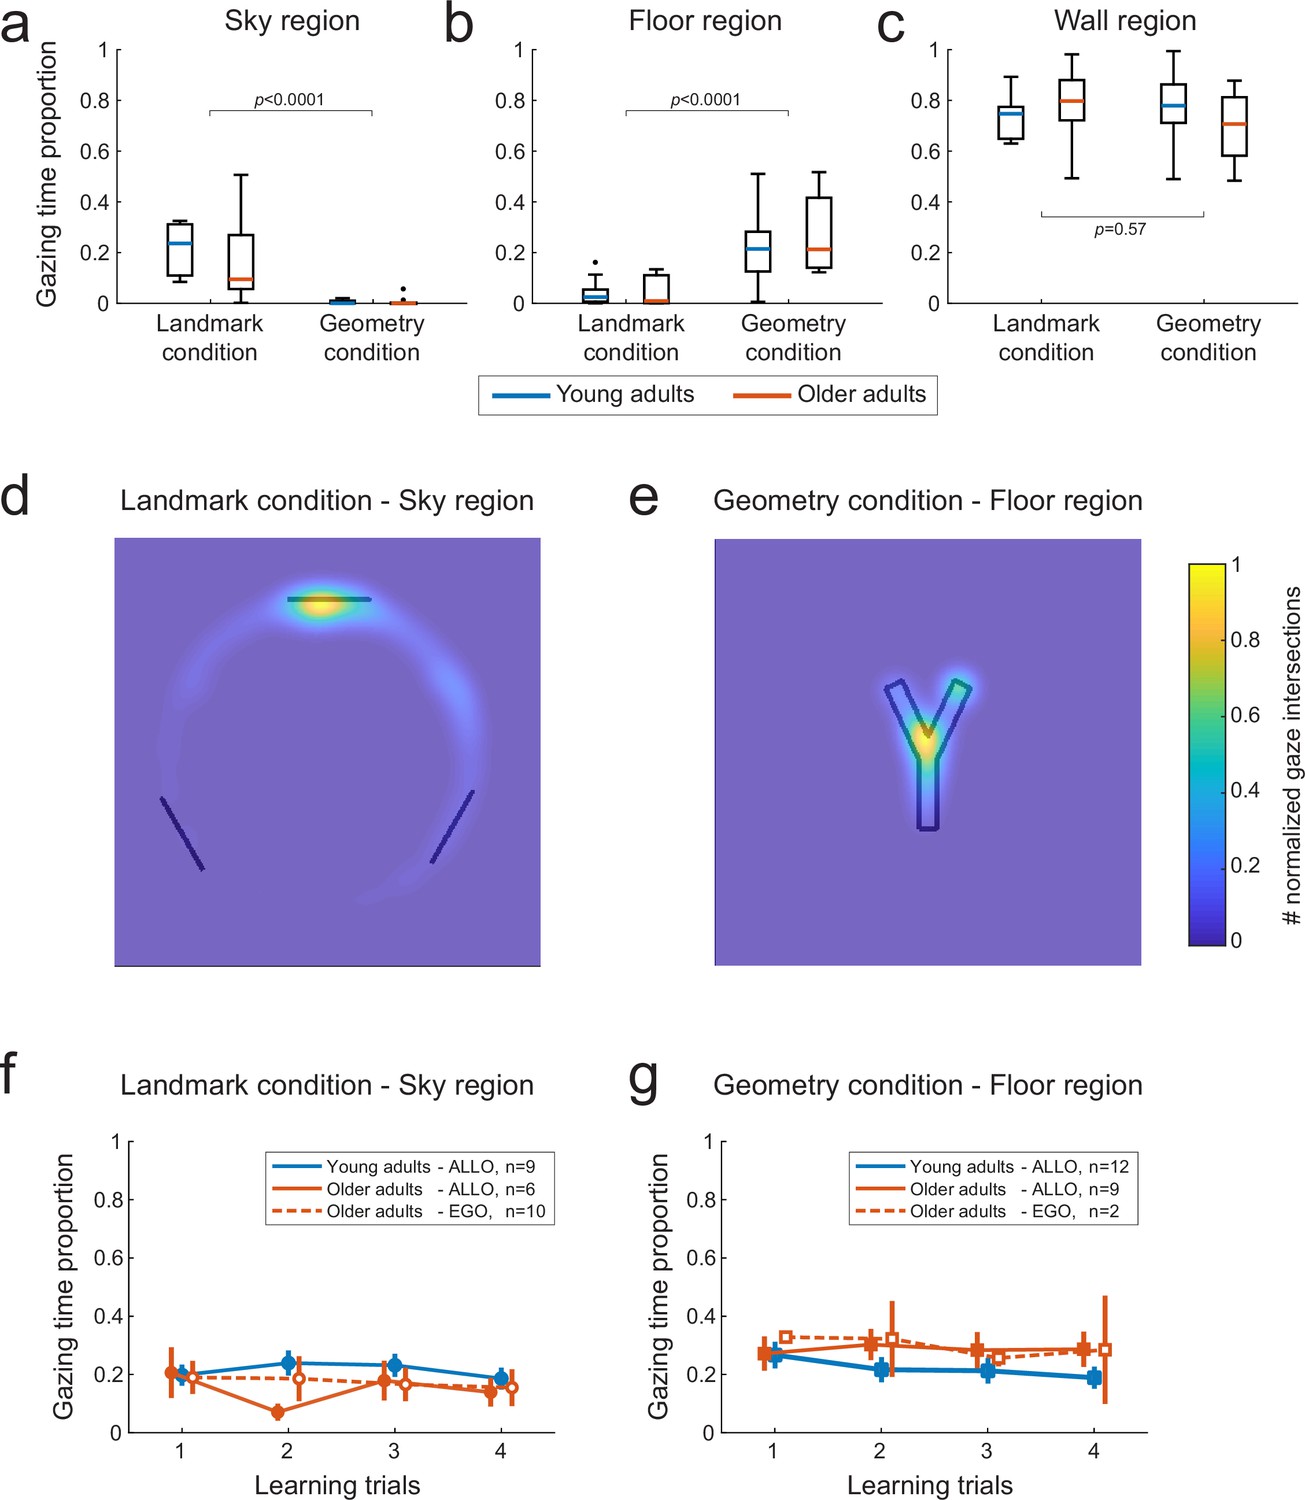
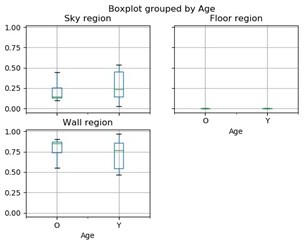
Gaze-mediated exploratory behavior during spatial learning.
(a–c) Gaze dwell-time proportion for sky (a), floor (b), and wall (c) regions of the virtual space as a function of age (young adults n=22, older adults n=28) and experimental condition (landmark n=27, geometry n=23). We found a double dissociation between the time spent at visually exploring sky and floor regions in the landmark and geometry conditions (a and b, respectively). Neither age nor condition affected the gaze time proportion relative to the walls of the maze (c). Data were averaged across the four first trials. Box plots (a–c) show the median (colored lines), the interquartile range (25th and 75th percentiles, length of the boxes), 1.5× interquartile range (whiskers) and outliers (dots). (d) In the landmark condition, the spatial distribution of the visual focus of attention over the sky region showed that subjects gazed mostly at the landmark facing the departure point. Heatmaps data were pooled across age and the color bar normalization was computed for each group separately. (e) In the geometry condition, subjects mostly focused on the fork area of the Y-maze floor. (fg) Gaze dwell-time proportion in the sky region of the landmark condition(d) and the floor region of the geometry condition (e) as a function of learning trials, for young and older allocentric and egocentric subjects. No significant difference existed as either a function of age or strategy preference. Error bars show standard error of the mean.
Figure 4—figure supplement 1
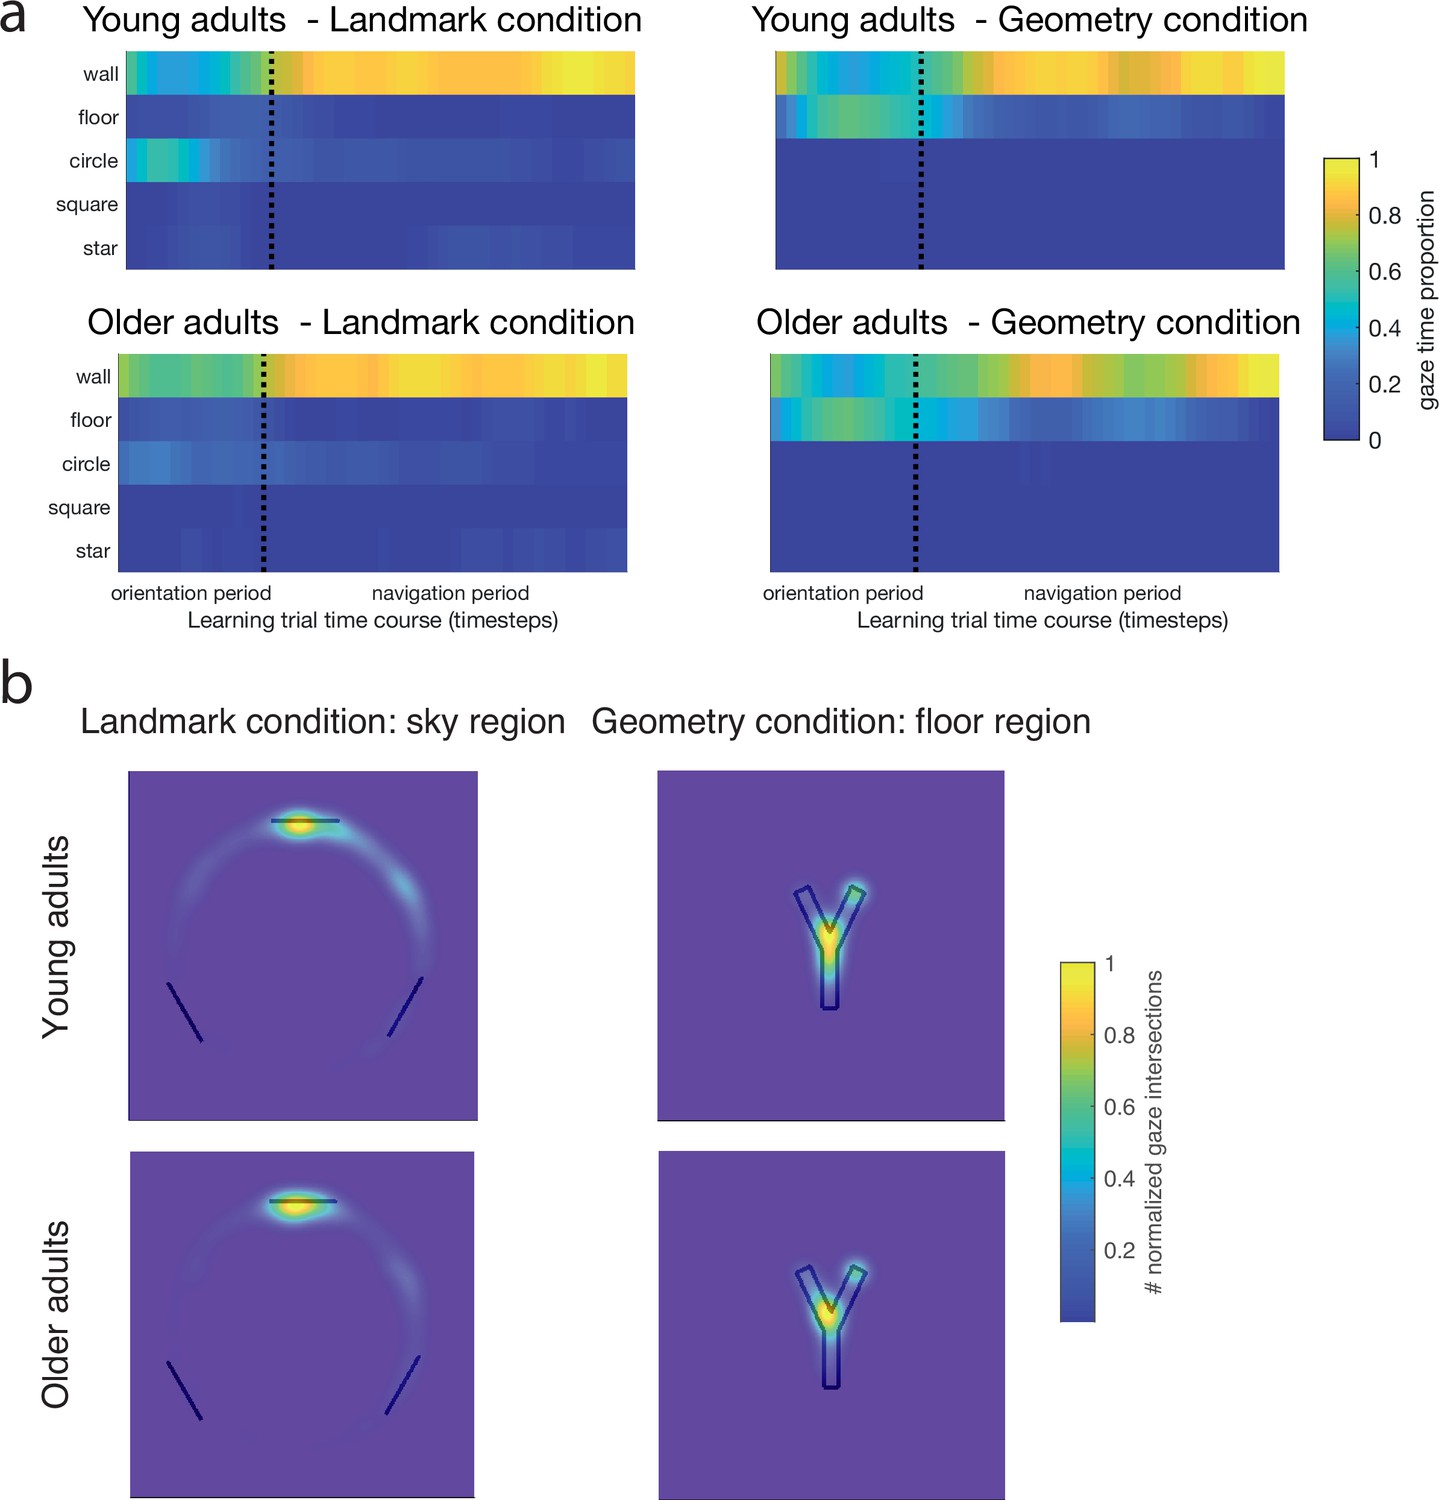
Oculomotor behavior in the learning phase in young and older groups.
(a) Gaze dwell-time proportion for floor and wall regions as well as for the three landmark sectors of the sky region. (b) Spatial distribution of visual focus of attention over the sky region of the landmark condition (left) and over the floor region of the geometry condition (right), for young (top, n=22) and older (bottom, n=28) adults. Oculomotor data were averaged (in a) and pooled (in b) across the four learning trials. Heatmap color bar normalization in (b) was computed for each group separately.
Figure 5 with 1 supplement
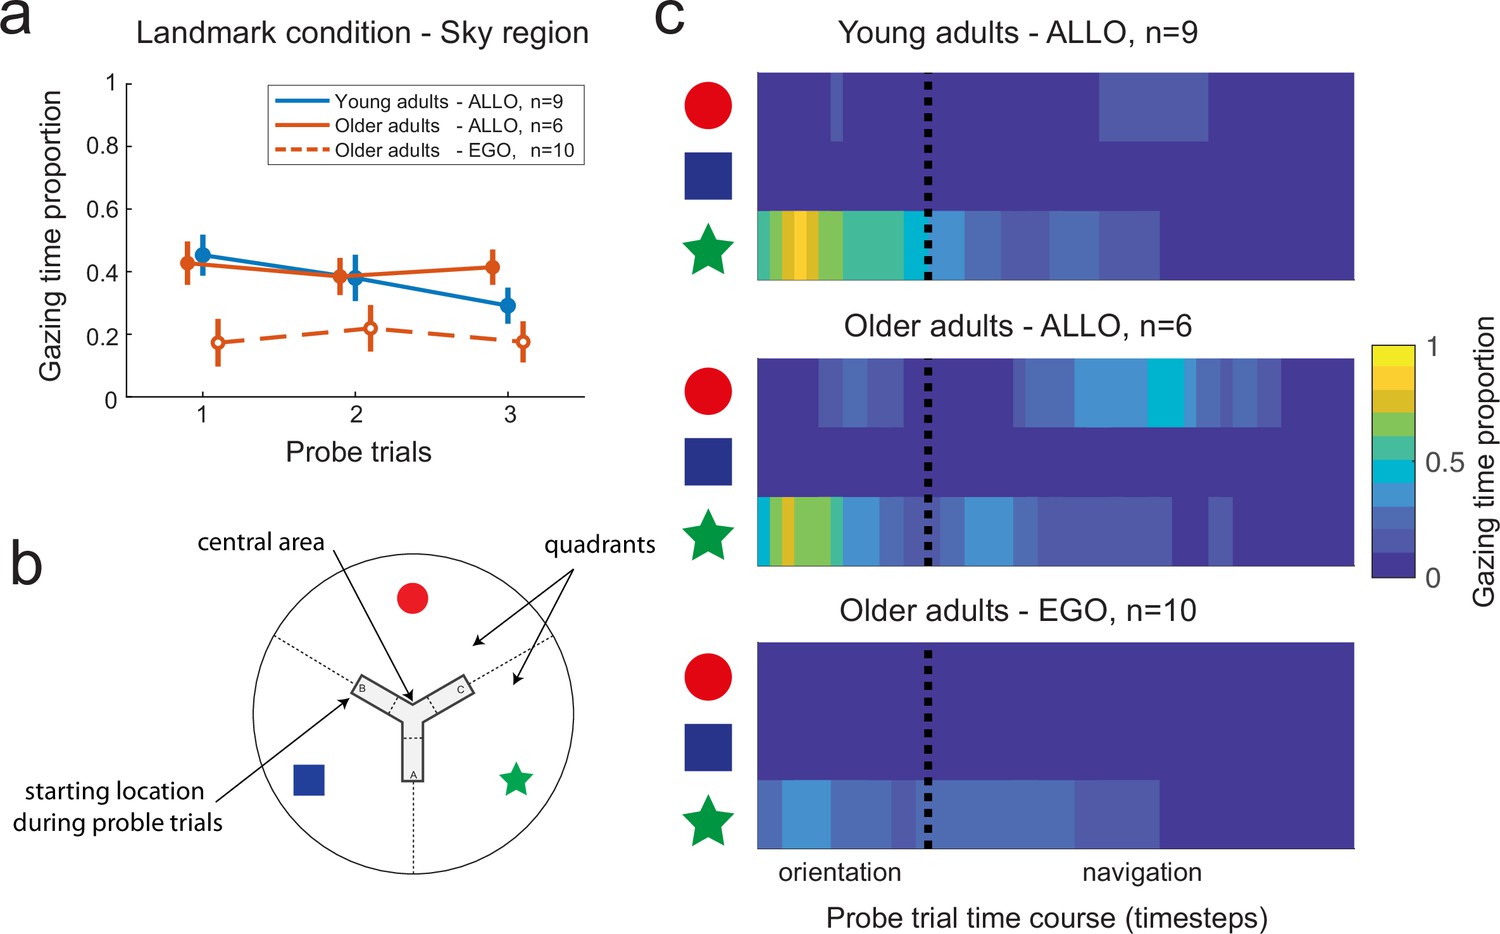
Gaze dynamics in the probe trials of the landmark condition.
(a) Gaze dwell-time proportion relative to the sky region for young and older subjects. Independently from age, allocentric navigators explored significantly more the sky region in the probe trials (~40% of the trial) compared to the learning trials (~20% of the trial, see Figure 4f for a comparison). This result did not hold for older egocentric subjects, who spend ~20% of the trial gazing at the sky, irrespective of the learning or probe phases. Error bars show standard error of the mean. (b) For analysis purposes, the sky region was separated in landmark-centered sectors, as indicated by dashed lines. (c) Evolution of gaze dwell-times throughout the probe trials, including orientation and navigation periods, as a function of landmark sectors, age, and navigation strategy. The star sector corresponds to the landmark directly in front of the departure position in probe trials, while the circle sector corresponds to the landmark directly in front of the starting position in the learning trials. Allocentric young and older subjects focused on the star upon opening the eyes to reorient in space and plan their goal-oriented trajectories. During navigation, allocentric older adults switched their visual focus of attention onto the red landmark when being at the center of the maze. Egocentric older adults looked at the star during orientation as well as while navigating toward the center of the maze.
Figure 5—figure supplement 1

Time spent gazing at the three landmarks during the first probe trial of the landmark condition (young adults, n=10 and older adults, n=17).
(a) During the orientation period, (b) during the navigation period, and (c) during the time spent in the central area of the environment. Box plots show the median (colored lines), the interquartile range (25th and 75th percentiles, length of the boxes), 1.5× interquartile range (whiskers) and outliers (circles). Young and older adults data. P-values from the Mann-Whitney U test.
Figure 6
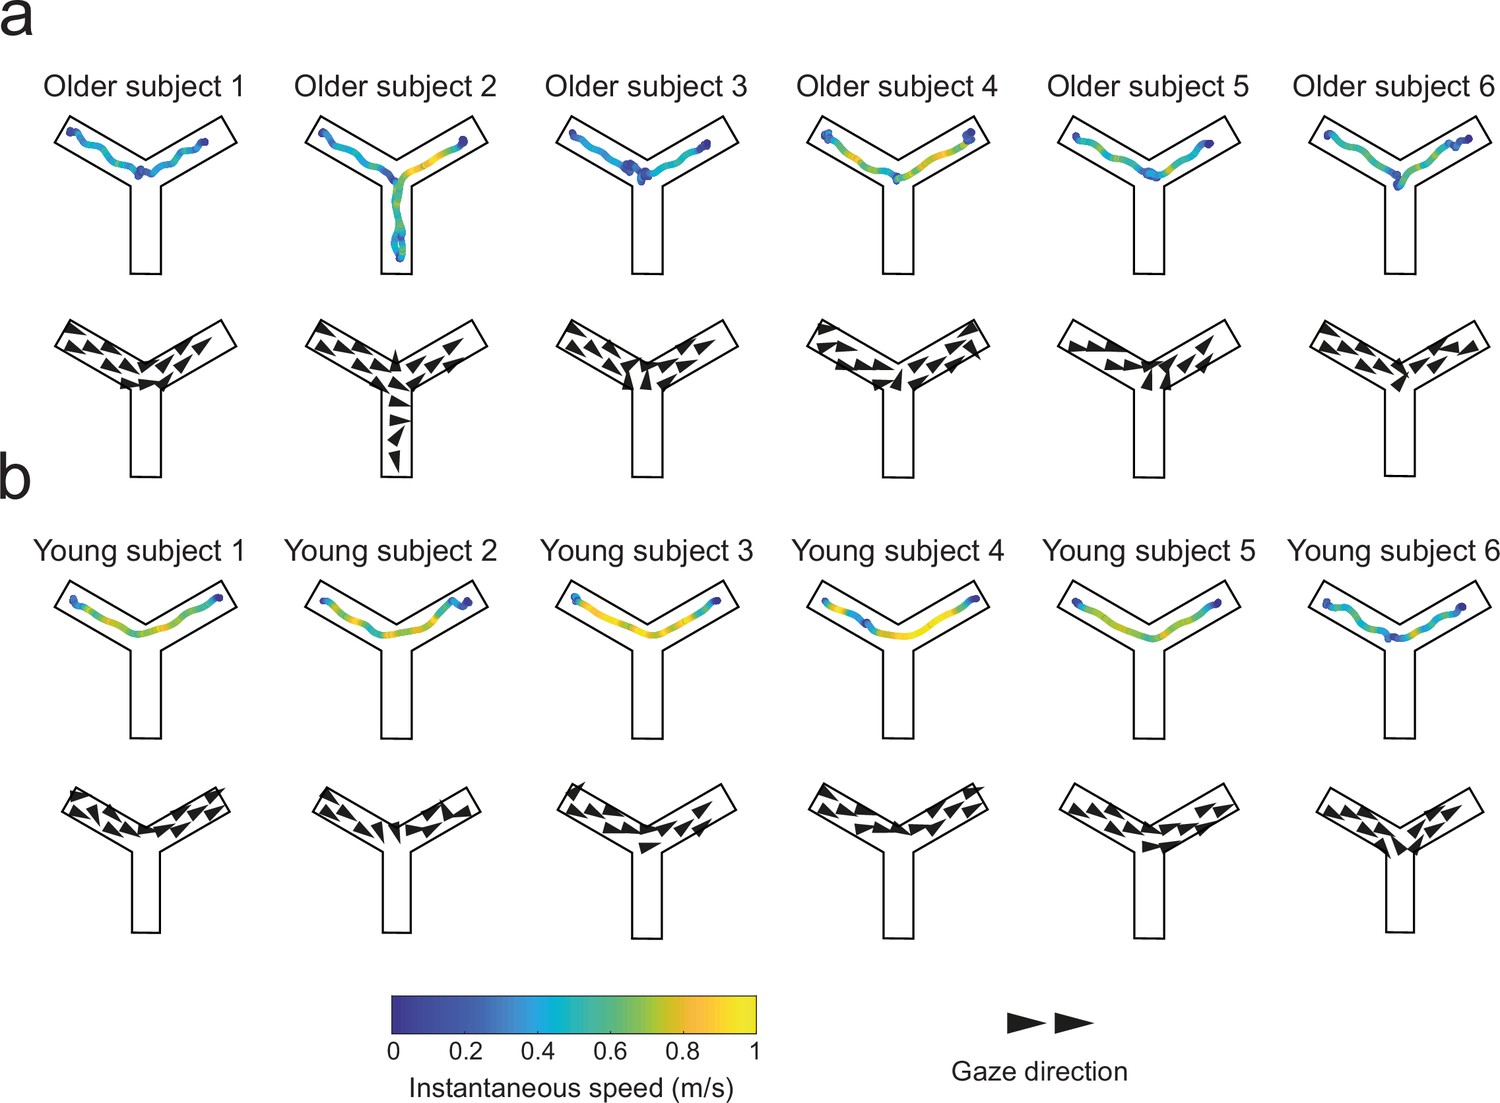
Trajectories and gaze vector field representations in the first probe trials of the landmark condition in young and older adults.
Qualitative representations of goal-oriented trajectories color-coded with instantaneous speed (top rows), and gaze vectors (bottom rows) of six representative young (a) and older (b) allocentric navigators. Older adults tended to slow down at the center of the Y-maze where they eventually gazed at the red circle.
Figure 7 with 1 supplement
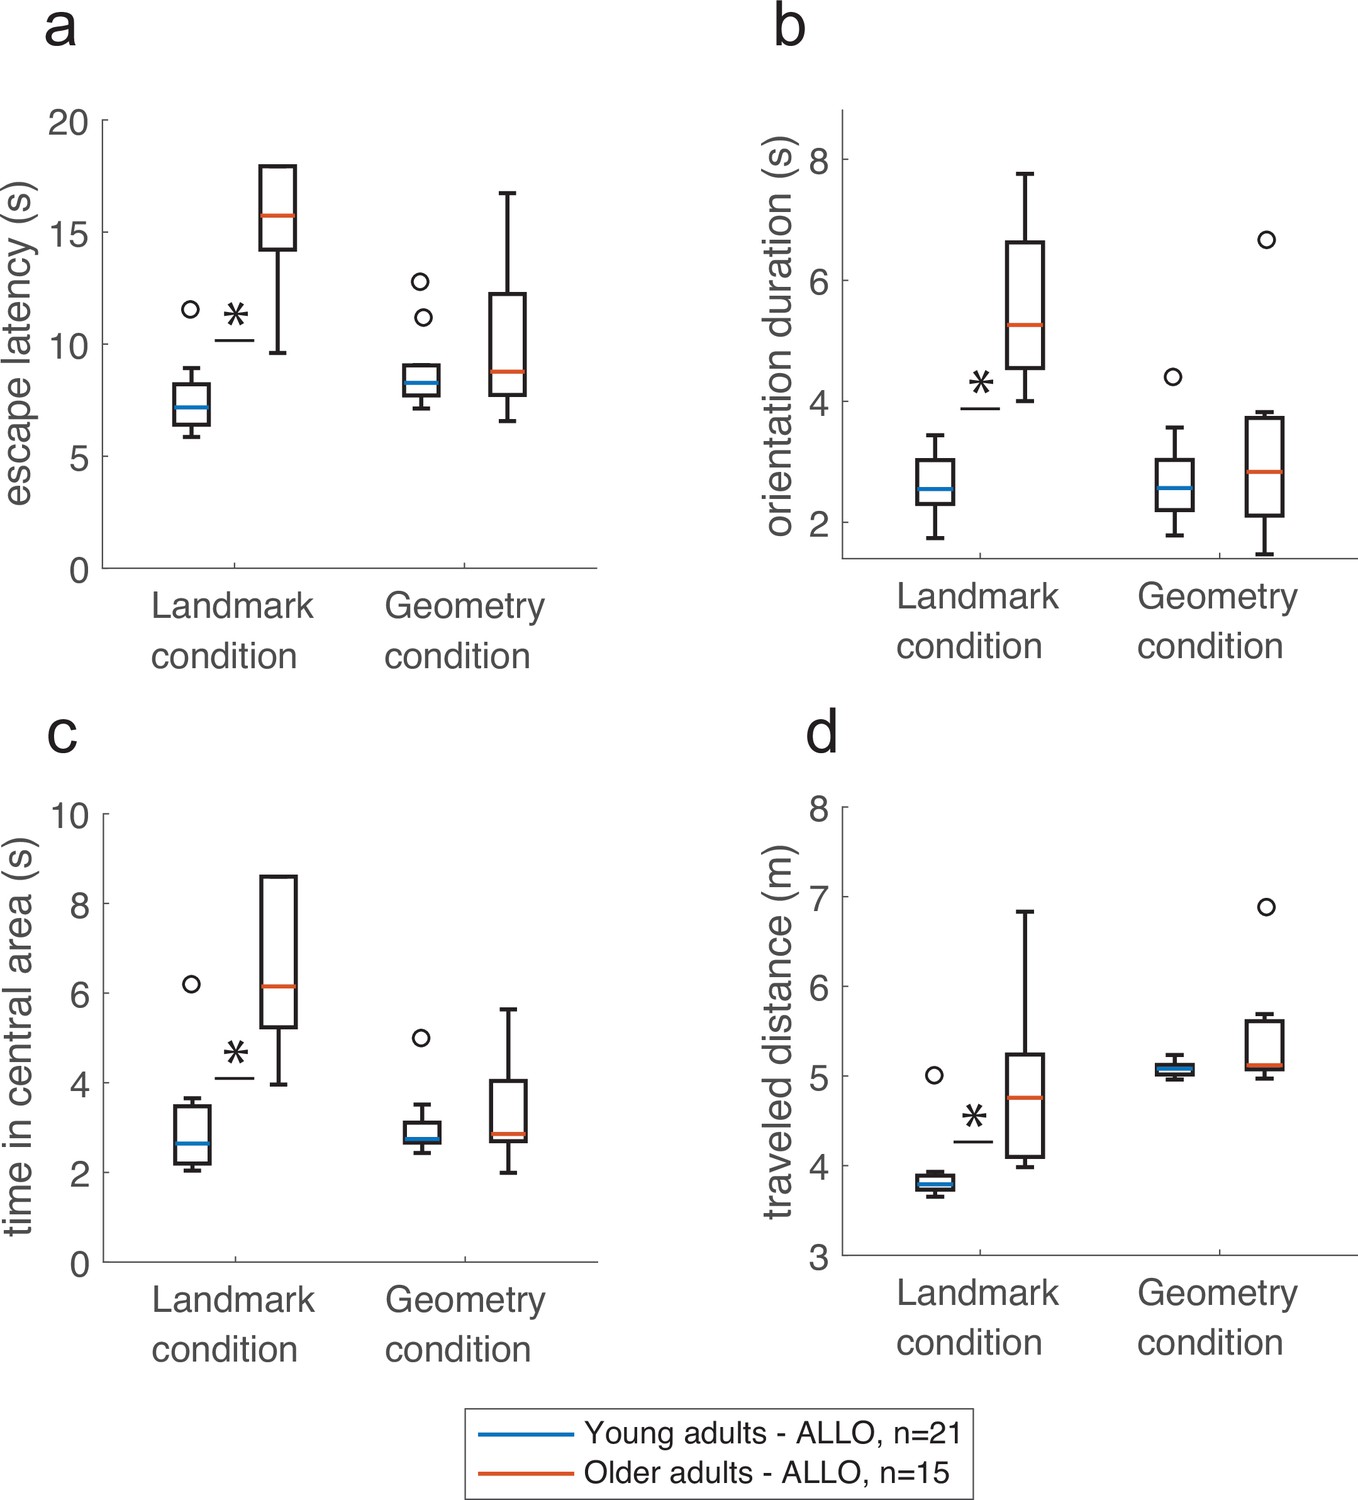
The presence of geometric cues eliminated the effect of age on navigation.
In the landmark condition, older allocentric adults took longer to reach the goal (a), were slower at reorienting in space (b), spent significantly more time in the central area of the maze (c), and their trajectories to the goal were longer compared to young allocentric adults (d). In comparison, there was no age difference in the geometry condition. Box plots in show the median (colored lines), the interquartile range (25th and 75th percentiles, length of the boxes), 1.5× interquartile range (whiskers) and outliers (circles). Stars indicate significant simple effect or Mann-Whitney test. These analysis were carried out in n=36 allocentric adults.
Figure 7—figure supplement 1
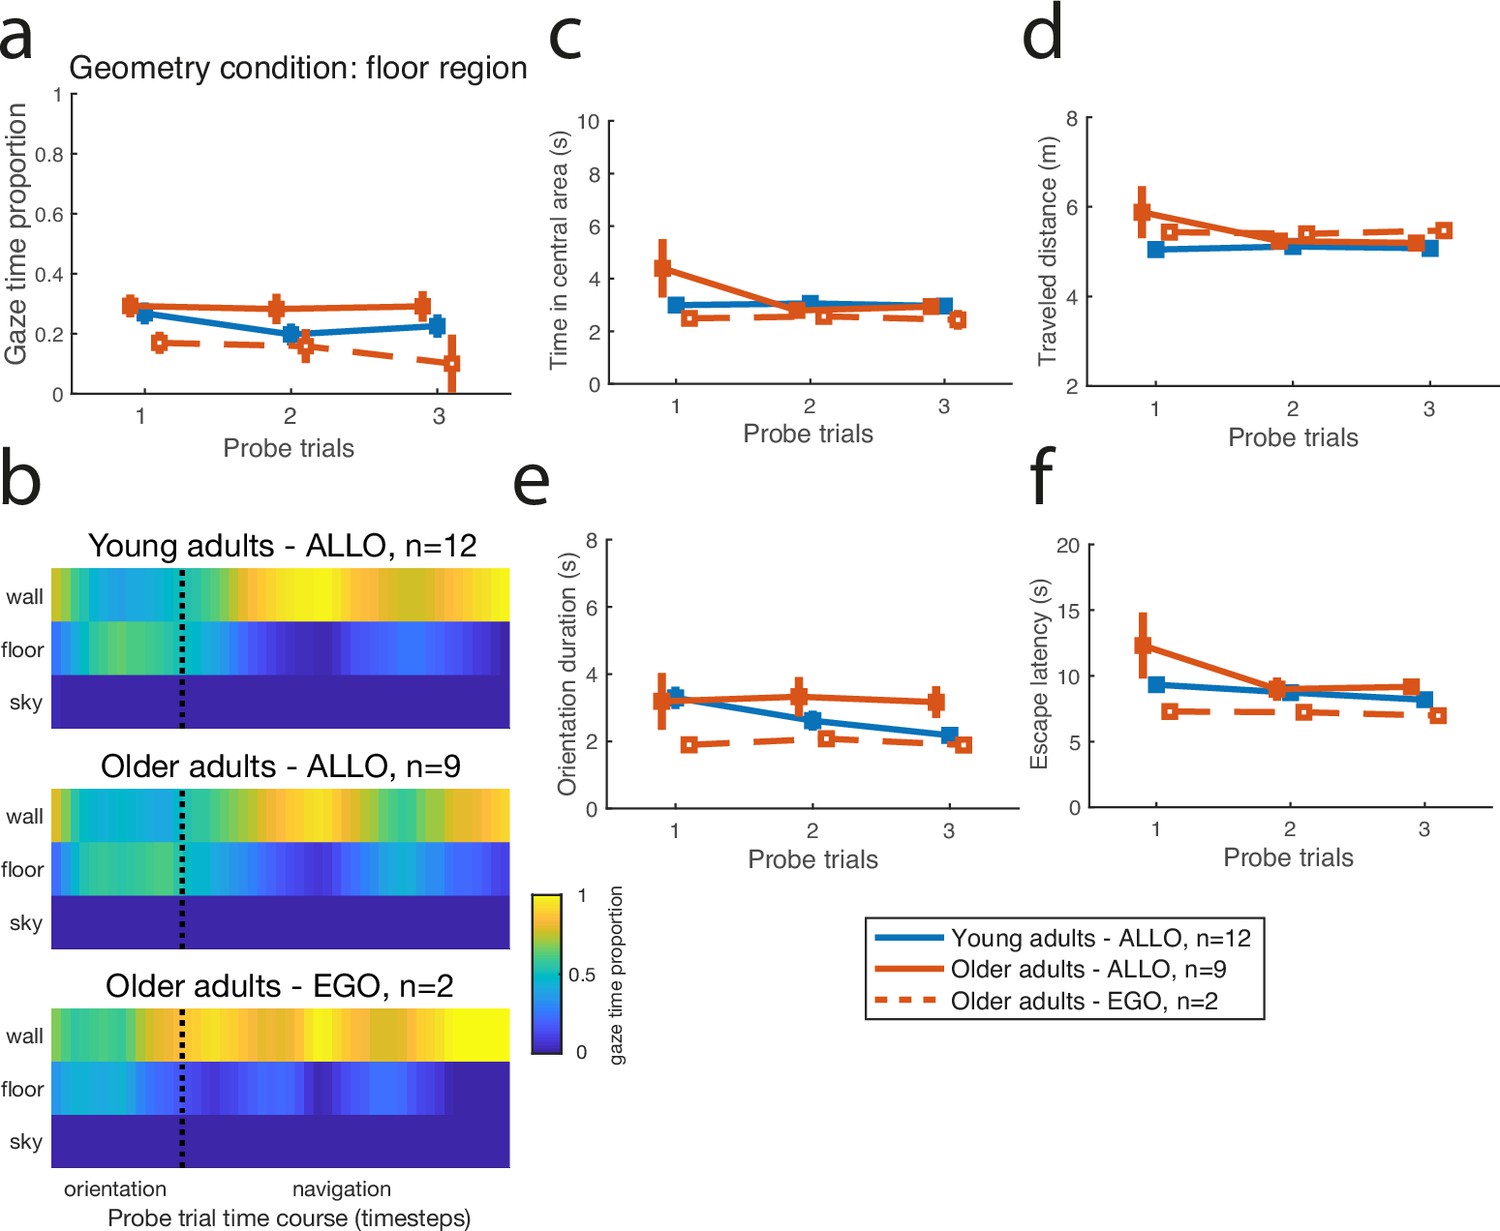
Oculomotor behavior and navigation measures in the probe trials of the geometry condition.
(a) Gaze dwell-time proportion over the floor region for young allocentric subjects as well as older allocentric and egocentric navigators (there was no young egocentric subjects in the geometry condition). (b) Evolution of gaze dwell-time proportion for wall, floor, and sky regions across probe trials. (c–f) Time spent in central area, traveled distance, orientation duration, and escape latency during probe trials. Error bars represent the standard error of the mean.
Figure 8
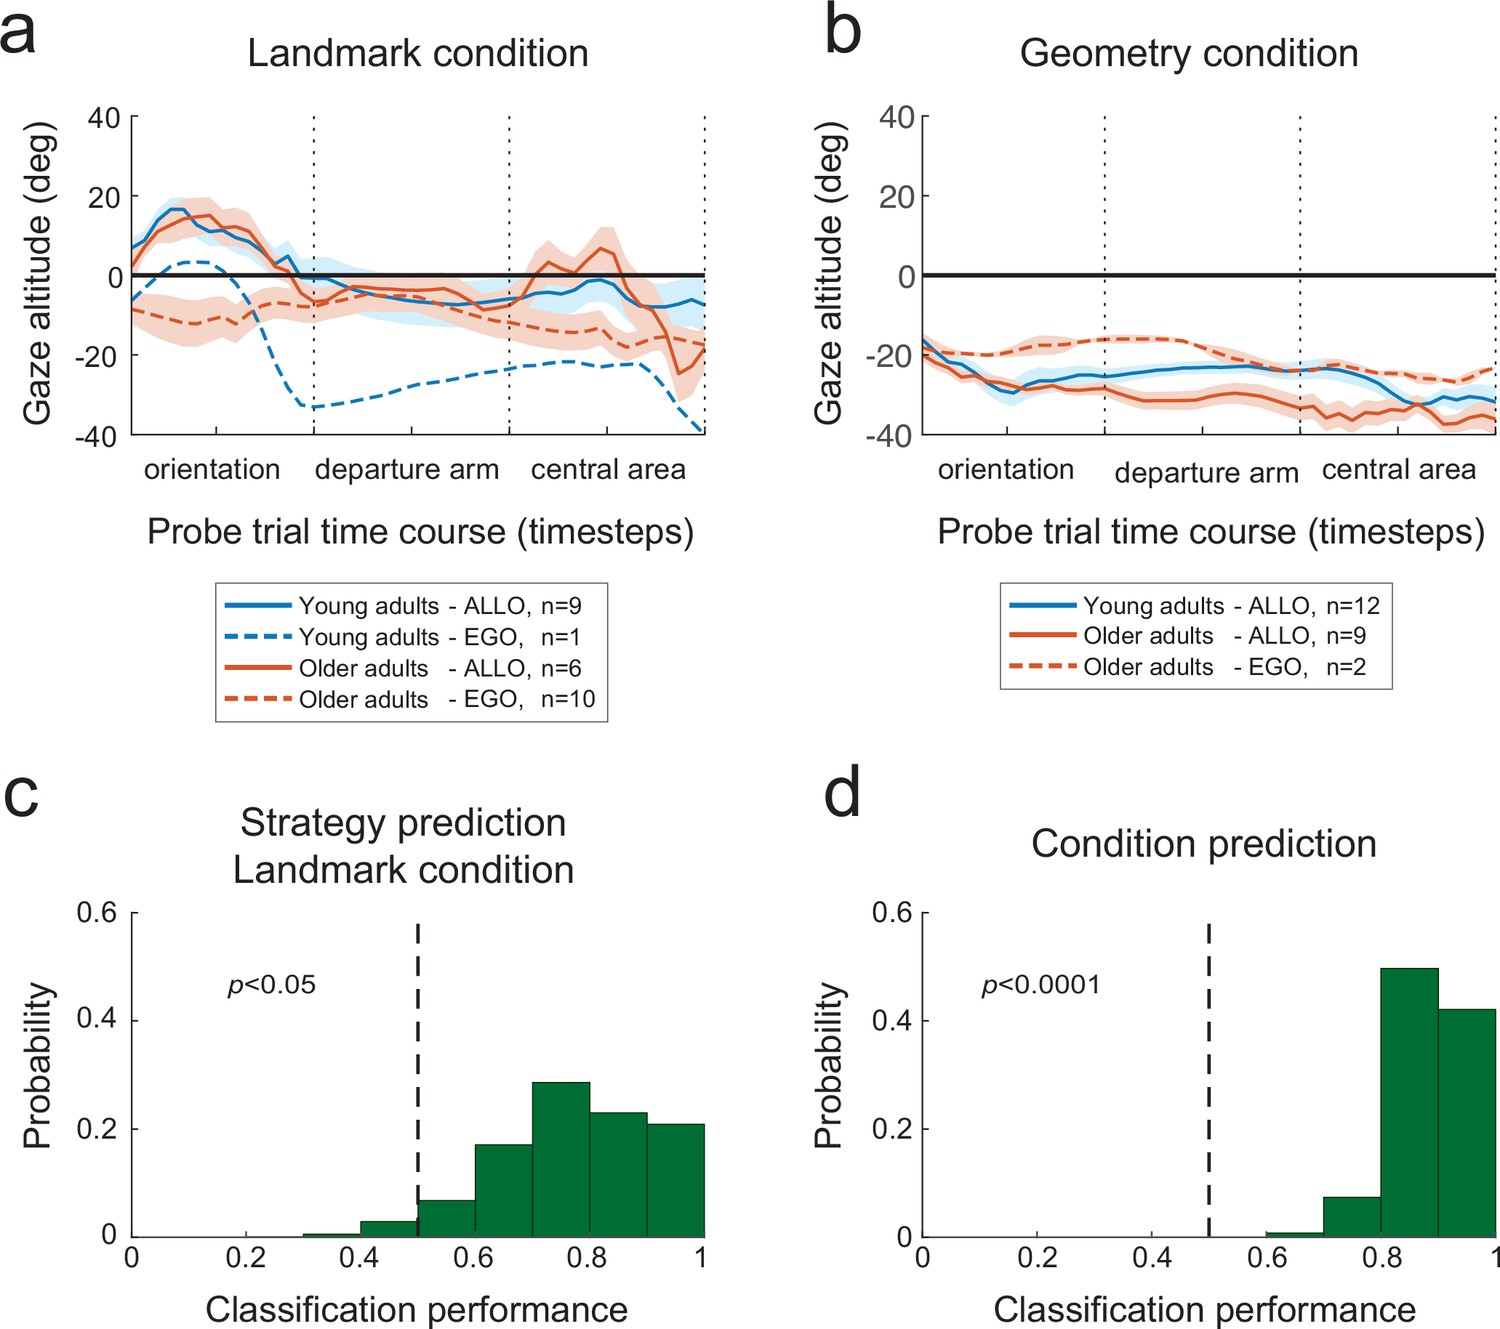
Predictive eye-motion statistics.
(a, b) Evolution of gaze altitude throughout probe trials. In both the landmark (a) and geometry (b) conditions, the gaze altitude during reorientation differed between allocentric and egocentric navigators. Eye level is denoted by 0. Shaded areas represent the between-subject standard error of the mean. (c) Distribution of the proportion of correct single-subject-single-trial predictions of the strategy used to solve the landmark condition of the Y-maze, based on the gaze altitude statistics during reorientation. The dashed vertical line indicates chance-level prediction, that is, the area to the left of the dashed line represents the probability (p-value) that less than half of the subjects in the validation set were correctly classified. (d) Prediction performance with respect to the experimental condition, that is, landmark vs. geometry, again on the basis of gaze altitude statistics during reorientation.
Figure 9 with 3 supplements
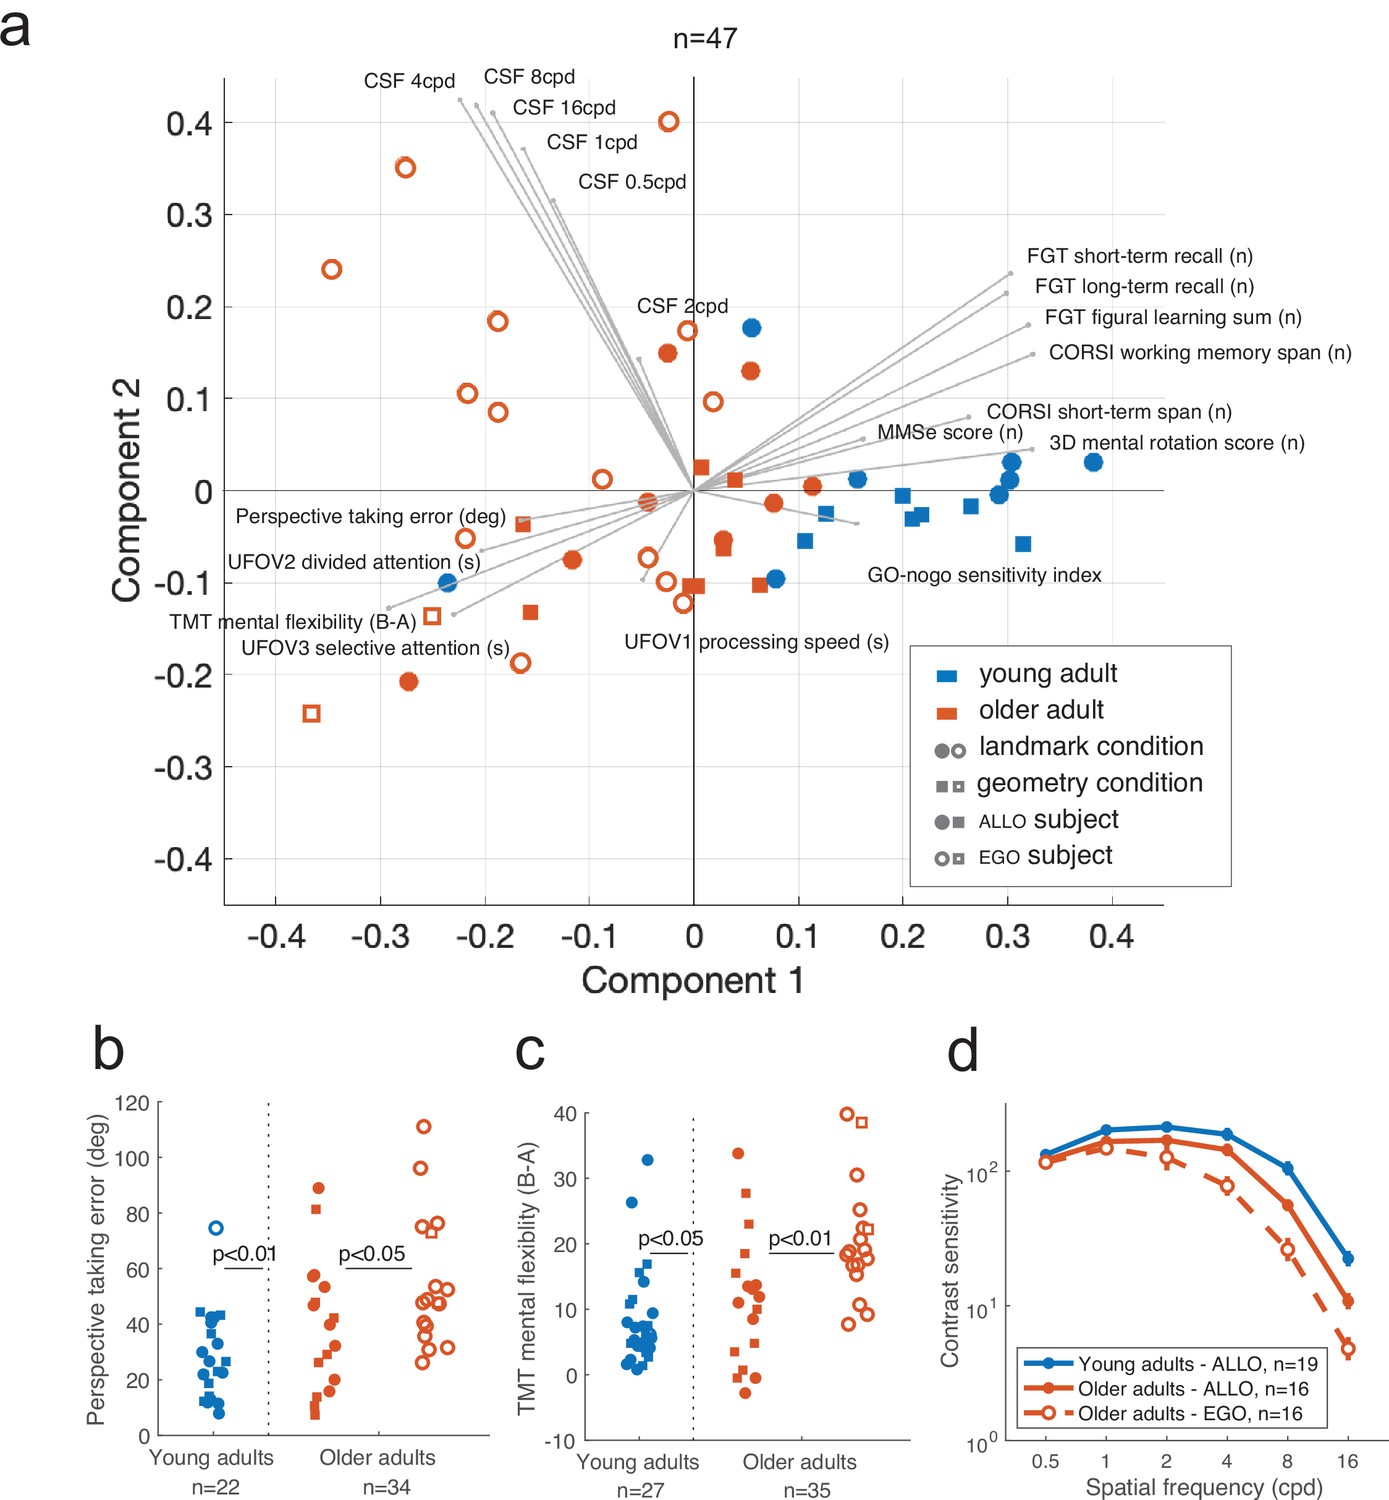
Visuo-cognitive multivariate analysis of age-related modulation of spatial behavior.
(a) Principal component analysis (PCA) across 19 measures of visual, attentional, mnemonic, and spatial reasoning capabilities (see Supplementary file 3 for test descriptions). Participants could be discriminated based on their age and, within the older population, their strategy preference. PCA was performed on 47 participants for whom we had the complete visuo-cognitive battery. (b–d) Scores of perspective taking, TMT mental flexibility, and contrast sensitivity. Error bars in (d) represent the standard error of the mean.
Figure 9—figure supplement 1

Cognitive screening results for adult participants.
p-Values indicated to the left of the dashed vertical lines correspond to the comparison of the ‘Age effect’ (young vs. older adults, pooled across the two versions), whereas the other p-values concern the ‘Strategy effect’ (allocentric vs. egocentric within the older group of participants). See Supplementary file 3 for the description of all cognitive tests. We specify the n in each group since some subjects had one or more missing data among all the 19 measurements.
Figure 9—figure supplement 2
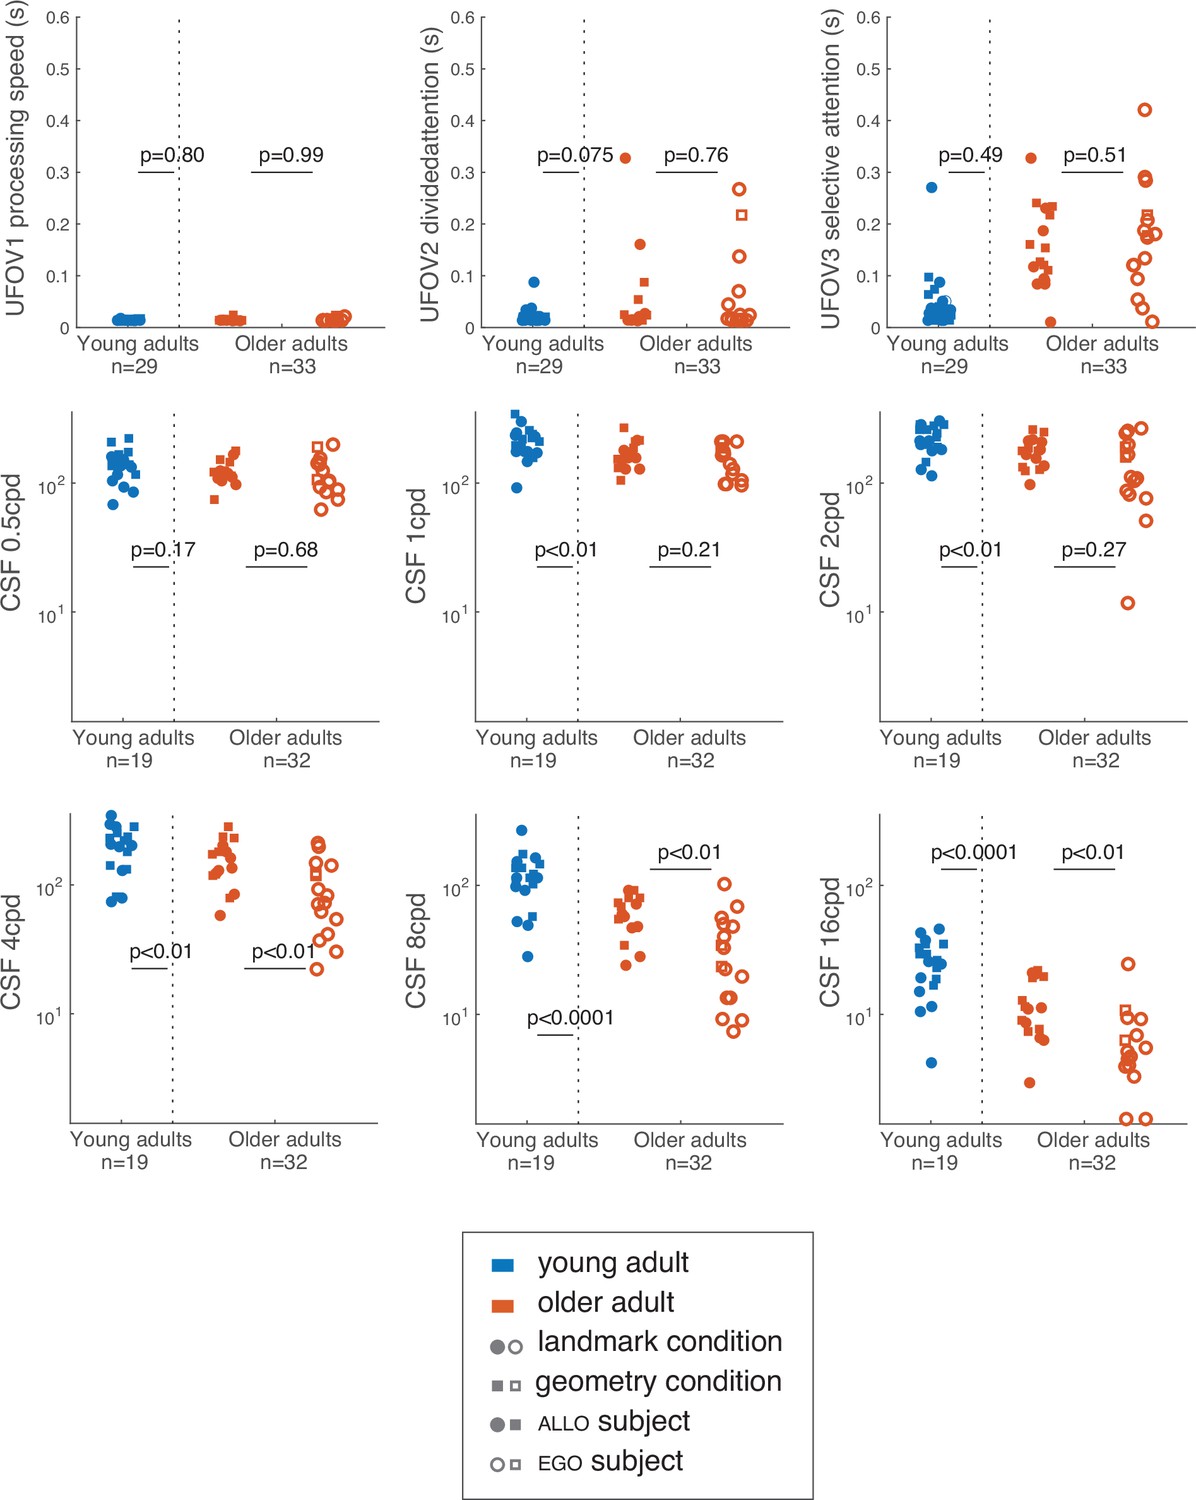
Visual screening results for adult participants.
p-Values indicated to the left of the dashed vertical lines correspond to the comparison of the ‘Age effect’ (young vs. older adults, pooled across the two versions), whereas the other p-values concern the ‘Strategy effect’ (allocentric vs. egocentric within the older group of participants). See Supplementary file 3 for the description of all visual tests. We specify the n in each group since some subjects had one or more missing data among all the 19 measurements.
Figure 9—figure supplement 3
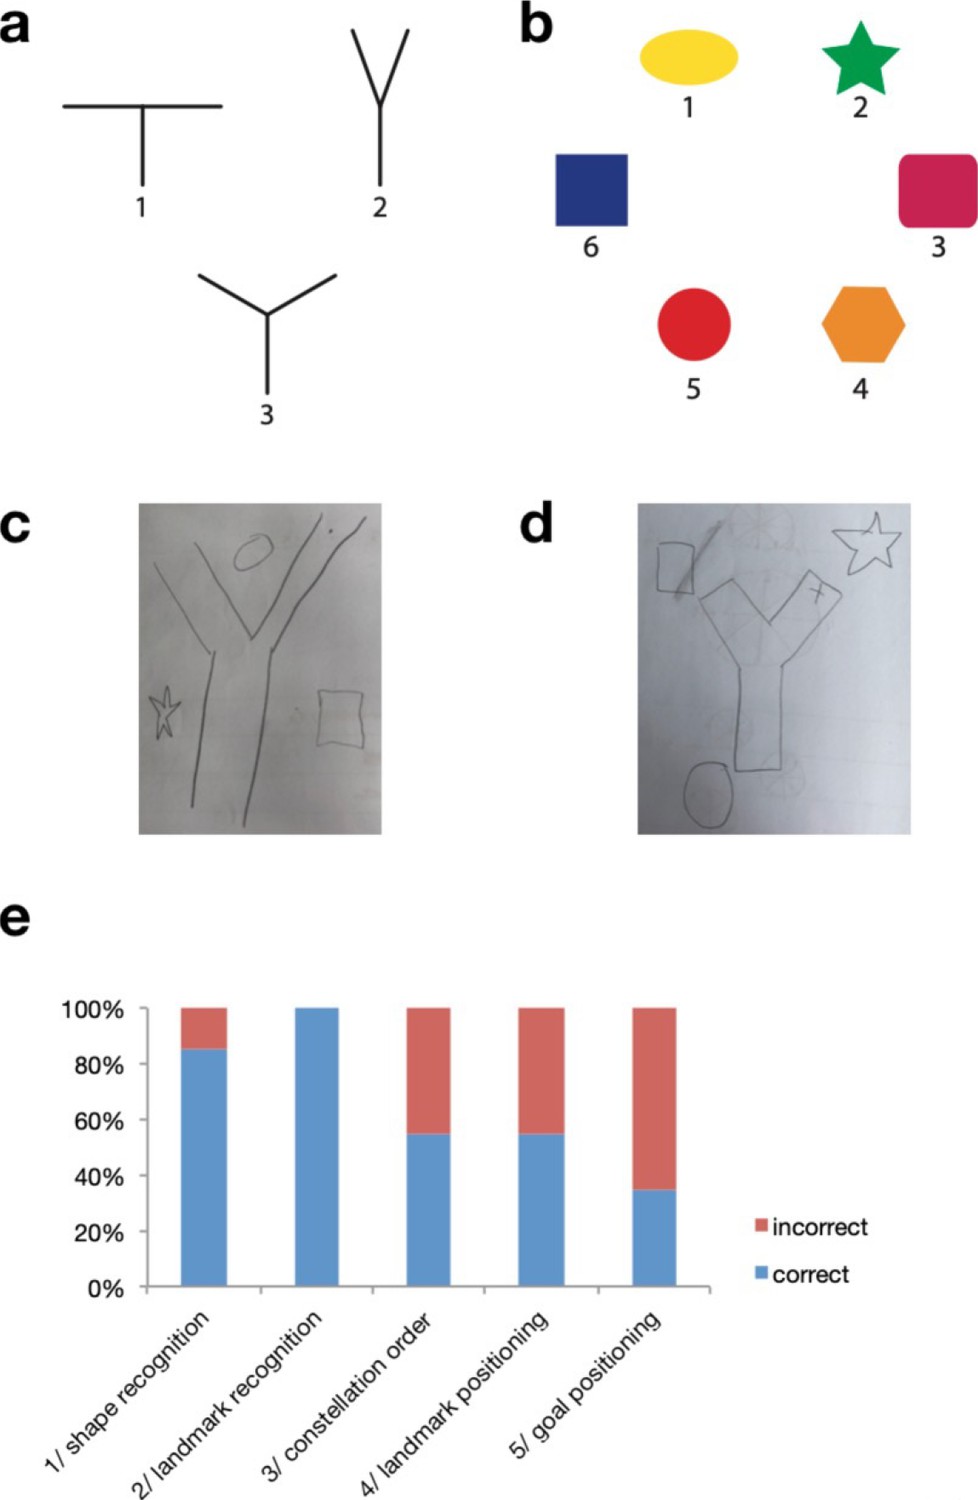
Results from post-experiment self-reported visuo-spatial memory of landmarks.
(a) Recognition of the maze shape (among three possibilities). (b) Recall of the landmarks (among six possibilities). (c, d) Drawing of a top view map of the maze with the landmark array (c: example of a correct map; d: example of an incorrect one). (e) Quantitative performance of participants.
Author response image 1
Videos
Video 1
Disorientation of a participant in immersive virtual conditions.
Video 2
Examples of learning and probe trials in real-world conditions.
Additional files
-
Supplementary file 1
Number of observations, mean, and standard deviation of age in different age groups.
- https://cdn.elifesciences.org/articles/81318/elife-81318-supp1-v3.docx
-
Supplementary file 2
Number of observations, mean, and standard deviation of age in different age groups for the experiments in real-world setting.
- https://cdn.elifesciences.org/articles/81318/elife-81318-supp2-v3.docx
-
Supplementary file 3
List of visual and cognitive tests performed by a subset of our adult participants.
- https://cdn.elifesciences.org/articles/81318/elife-81318-supp3-v3.docx
-
Supplementary file 4
Inclusion/exclusion criteria used for the SilverSight cohort (adult participants).
- https://cdn.elifesciences.org/articles/81318/elife-81318-supp4-v3.docx
-
MDAR checklist
- https://cdn.elifesciences.org/articles/81318/elife-81318-mdarchecklist1-v3.pdf
-
Source data 1
Participants’ demographics.
- https://cdn.elifesciences.org/articles/81318/elife-81318-data1-v3.zip
Download links
A two-part list of links to download the article, or parts of the article, in various formats.
Downloads (link to download the article as PDF)
Open citations (links to open the citations from this article in various online reference manager services)
Cite this article (links to download the citations from this article in formats compatible with various reference manager tools)
Landmark-based spatial navigation across the human lifespan
eLife 12:e81318.
https://doi.org/10.7554/eLife.81318


