The impact of lag time to cancer diagnosis and treatment on clinical outcomes prior to the COVID-19 pandemic: A scoping review of systematic reviews and meta-analyses
- Division of Cancer Epidemiology, McGill University, Canada
- Department of Oncology, McGill University, Canada
Figures
Figure 1
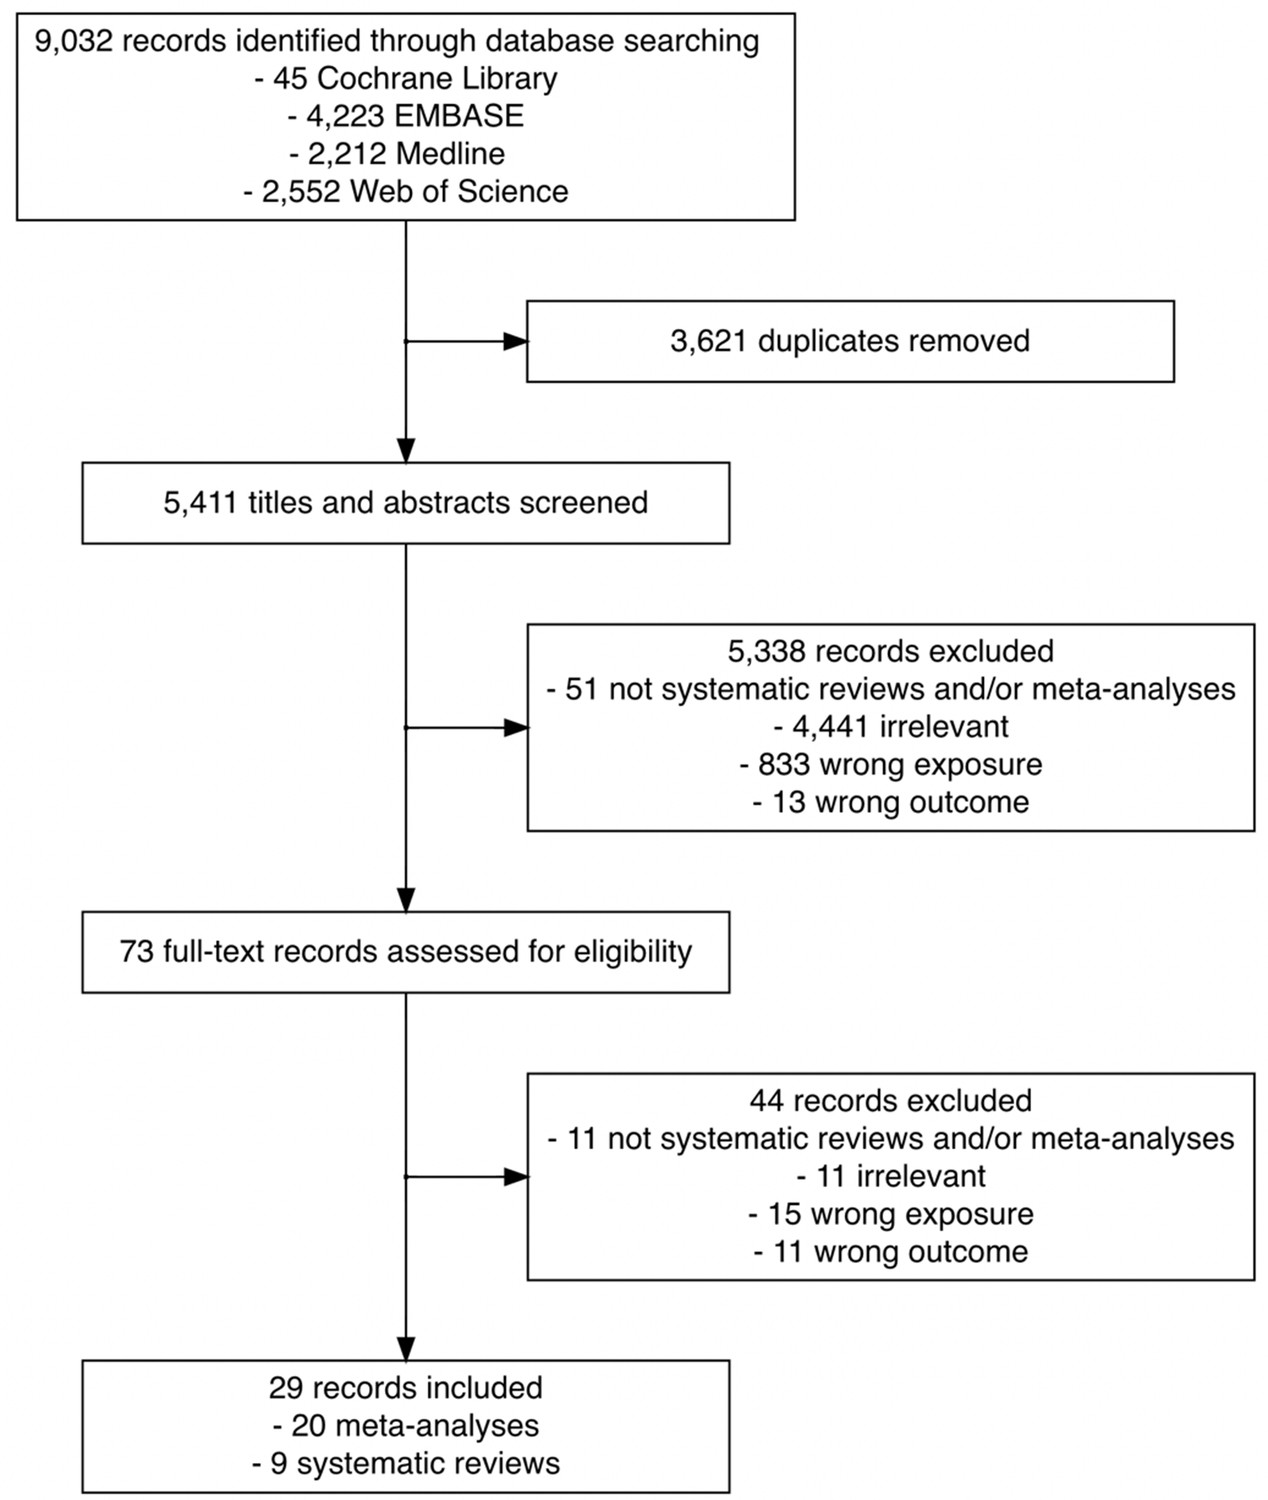
Flowchart of the search and study selection of systematic reviews and meta-analyses on the association between time to cancer diagnosis and/or treatment and clinical outcomes.
Figure 2
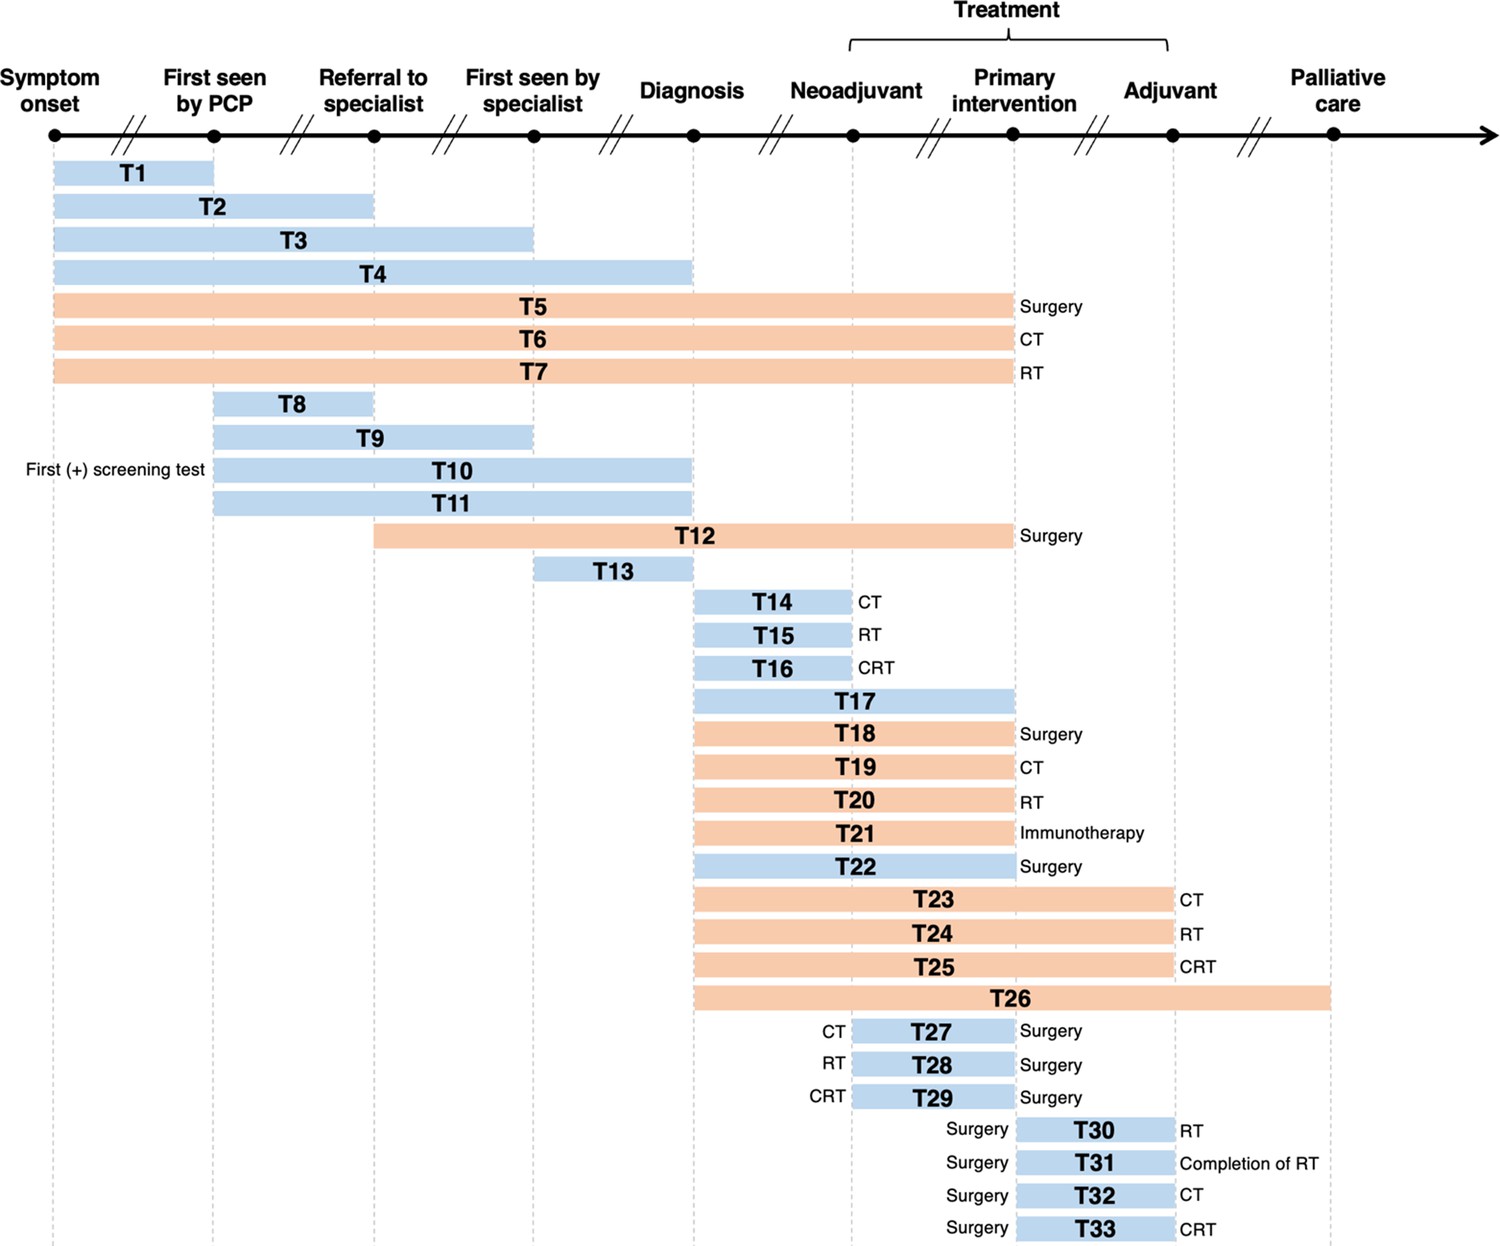
Visualization of lag time intervals identified in systematic reviews and/or meta-analyses on the association between time to cancer diagnosis and/or treatment and clinical outcomes.
Top arrow represents the cancer care continuum along broad milestones (data points in bold). Oblique breaks denote the incongruency of lag times between milestones (i.e., inconsistent periods of time between milestones; not every cancer patient undergoes all milestones or undergo each milestone sequentially). Each bar indicates a lag time interval (T1–T33). Start and endpoints of each lag time interval are defined by the corresponding milestones. Text before or after a bar defines specific start or endpoints of a lag time interval whenever explicitly reported in a systematic review and/or meta-analysis. Orange shading of bars denotes lag time intervals that do not necessarily include all the milestones through which the bars physically pass (e.g., T18 starts at diagnosis and ends at surgery, without necessarily including neoadjuvant therapy). Blue shading of bars denotes lag time intervals that do include all milestones through which the bars physically pass (e.g., T22 starts at diagnosis and ends at surgery, including neoadjuvant therapy). ART, adjuvant radiotherapy; CRT, chemoradiotherapy; CT, chemotherapy; PCP, primary care provider; RT, radiotherapy.
Tables
Table 1
Lag time intervals evaluated in systematic reviews and meta-analyses on the association between time to diagnosis and/or treatment and clinical outcomes, by cancer site.
| Cancer site | Lag time interval* | First author (year), type of review |
|---|---|---|
| Brain | T30 | Loureiro et al., 2016, meta-analysis |
| T33 | Warren et al., 2019, systematic review | |
| Breast | T32 | Yu et al., 2013, meta-analysis |
| T30 | Gupta et al., 2016, meta-analysis | |
| T32 | Raphael et al., 2016, meta-analysis | |
| T32 | Zhan et al., 2018, meta-analysis | |
| Blood | T21 | Zhao et al., 2019, meta-analysis |
| Colorectal | T32 | Des Guetz et al., 2010, meta-analysis |
| T32 | Biagi et al., 2011, meta-analysis | |
| T29 | Foster et al., 2013, systematic review | |
| T29 | Wang et al., 2016, meta-analysis | |
| T29 | Petrelli et al., 2016, meta-analysis | |
| T29 | Du et al., 2018, meta-analysis | |
| T28 | Wu et al., 2018, meta-analysis | |
| T18 | Hangaard Hansen et al., 2018, meta-analysis | |
| T32 | Petrelli et al., 2019, meta-analysis | |
| Eye | T4 | Mattosinho et al., 2019 meta-analysis |
| Head and neck | T4 | Gómez et al., 2009, meta-analysis |
| T1, T2, T4, T11 | Seoane et al., 2012, meta-analysis | |
| T1, T2, T4, T11 | Seoane et al., 2016, meta-analysis | |
| T29 | Lin et al., 2016, meta-analysis | |
| T17, T30, T31 | Graboyes et al., 2019, systematic review | |
| Paediatric | T4 | Brasme et al., 2012, systematic review |
| T4 | Lethaby et al., 2013, systematic review | |
| Prostate | T18, T20 | van den Bergh et al., 2013, systematic review |
| Ovarian | T32 | Liu et al., 2017, meta-analysis |
| T32 | Usón et al., 2017, meta-analysis | |
| Multisite | T1–T9, T11–T16, T18–T27 | Neal et al., 2015, systematic review |
| T10 | Doubeni et al., 2018, systematic review |
-
*
Lag time intervals correspond to those defined in Figure 2. Reviews on the same cancer site are sorted by publication year.
Table 2
Characteristics of the systematic reviews on the association between time to cancer diagnosis and/or treatment and clinical outcomes, by cancer site/type and lag time interval.
| Cancer | Lag time | Outcome measures | Overall findings | First author (year) | ||
|---|---|---|---|---|---|---|
| Site | Type | Interval | Time range | |||
| Brain | -- | T33 | 15 to >45 days | Overall survival | 4/10 studies: no association between longer time (>45 days) to treatment initiation and overall survival | Warren et al., 2019 |
| 4/10 studies: best overall survival was among patients who experienced a moderate time (~31–42 days) to treatment initiation | ||||||
| 1/10 studies: a longer time (>45 days) to treatment initiation was associated with poorer overall survival | ||||||
| 1/10 studies: improved survival with early treatment initiation (14–21 days) among patients who underwent total resection, and poorer survival for patients who underwent biopsy only | ||||||
| Colorectal | Rectal | T29 | <5 days to >12 weeks | Tumour response rate R0 resection Sphincter preservation Surgical complications Disease recurrence | 4/15 studies: higher rates of pathological complete response with longer time intervals (6–8 weeks) between chemoradiotherapy and surgery | Foster et al., 2013 |
| 3/15 studies: increased tumour downstaging with longer time intervals (6–8 weeks) | ||||||
| No association between longer time intervals and surgical complication rates, sphincter preservation rates, long-term recurrence rates and survival | ||||||
| Colon | T18 | 1 to ≥56 days | Overall survival Disease-specific survival Cause-specific survival | 4/5 studies: no association between treatment delay and reduced overall survival regardless of the time intervals investigated | Hangaard Hansen et al., 2018 | |
| 1/5 studies: a clinically insignificant association between longer treatment delay and reduced overall survival | ||||||
| No association between treatment delay and reduced disease-specific survival | ||||||
| Eye | Retinoblastoma | T4 | 3 to 5 months | Metastasis Mortality Enucleation Extraocular disease | 2/9 studies: association between time to diagnosis (>6 months) and metastatic disease | Mattosinho et al., 2019 |
| 2/9 studies: extended time to diagnosis associated with increasing extraocular disease and mortality rates | ||||||
| No association between time to diagnosis and enucleation | ||||||
| Head and neck | Oropharyngeal | T17 | 20 to 120 days | Overall survival Disease-specific survival Recurrence-free survival Locoregional control | 9/13 studies: association between longer diagnosis to treatment initiation and poorer overall survival | Graboyes et al., 2019 |
| T30 | >6 to ≥64 days | 4/5 studies: association between shorter time from surgery to postoperative radiotherapy and improved overall survival or recurrence-free survival | ||||
| T31 | 77 to 100 days | 4/5 studies: longer time from surgery to postoperative radiotherapy correlated with poorer overall survival | ||||
| Paediatric | Leukemias, lymphomas, brain tumours, neuroblastomas, kidney tumours, soft tissue sarcomas, germ-cell tumours, retinoblastomas | T4 | 2 to 260 weeks | Overall survival Prognostic factors | Delayed diagnosis associated with poorer outcomes among patients with retinoblastoma | Brasme et al., 2012 |
| Limited evidence that a delay in diagnosis might be adversely associated with poor oncologic outcomes for patients with leukemia, nephroblastoma, or rhabdomyosarcoma | ||||||
| No association between longer time to diagnosis and oncologic outcomes among patients with osteosarcoma, Ewing’s sarcoma, or a central nervous system tumour | ||||||
| Medulloblastomas, CNS tumours, retinoblastomas, Ewing’s sarcomas, bone tumours, osteosarcomas, adenocarcinomas | 20 to 116 days | Overall survival | Delay in diagnosis associated with poorer survival among patients diagnosed with Ewing’s Family of soft tissue sarcomas | Lethaby et al., 2013 | ||
| Non-linear association between time to diagnosis and survival among patients with central nervous system tumours and non-rhabdomyosarcomas; shortest time to diagnosis associated with poorer survival, however, subsequent extension of time to diagnosis associated with improved survival | ||||||
| Time to diagnosis not associated with survival in patients diagnosed with bone tumours | ||||||
| Prostate | -- | T18, T20 | 56 days to 3.7 months | Pathologic characteristics Biochemical recurrence Distant metastasis Overall survival Cause-specific survival | 7/17 studies: no association between time to treatment and poorer oncologic outcomes | van den Bergh et al., 2013 |
| 4/17 studies: treatment delay resulted in worse biochemical recurrence rates but no association with overall survival, distant metastasis, or cause-specific survival | ||||||
| Prolonged time to treatment (several months or years) does not adversely impact oncologic outcomes in patients with low-risk prostate cancers | ||||||
| Limited evidence suggests that prolonged time to treatment might have a negative effect on patients with moderate- and high-risk prostate cancers | ||||||
| Multisite | Breast, lung, gastric, oesophageal, gastro-esophageal, pancreatic, hepatocellular, colorectal, prostate, testicular, renal, bladder, upper tract urothelial, cervical, endometrial, ovarian, head and neck, brain/CNS, leukemia, lymphoma, myeloma, connective tissue, carcinoid, thyroid, multisite | T1–T9, T11–T16, T18–T27 | No range of lag times specified | Overall survival Recurrence-free survival Mortality Staging | 142/117 studies: no association between longer delays and poorer outcomes | Neal et al., 2015 |
| 91/117 studies: positive association between longer delays and poorer outcomes | ||||||
| 23/117 studies: negative association between longer delays and poorer outcomes (waiting-time paradox) | ||||||
| Some studies found that a longer time to diagnosis and/or treatment was associated with better OS and RFS, while other studies found the opposite. More studies found that shorter times to diagnosis led to better oncologic outcomes in breast, colorectal, head and neck, testicular, and melanoma | ||||||
| Breast, cervical, colorectal, lung | T10 | 29 to 1092 days | Overall survival Tumour size Tumour stage | Longer wait times associated with a greater risk of poorer clinical outcomes across the breast, cervical, colorectal, and lung cancers | Doubeni et al., 2018 | |
| Limited evidence confirming specific timeframes during which diagnostic testing should be completed after positive screening test | ||||||
-
-- indicates that cancer type was not specified or applicable to the site.
Table 3
Morbidity-related findings of meta-analyses on the association between time to cancer diagnosis and/or treatment and clinical outcomes, by cancer site/type and lag time interval.
| Cancer | Lag time interval | Findings | First author (year) | |||||
|---|---|---|---|---|---|---|---|---|
| Site | Type | Interval | Type | Comparison | Time range | Outcome measures | Pooled risk estimate [95% CI](model type, heterogeneity statistics I2 or Ri) | |
| Blood | Smoldering multiple myeloma | T21 | Categorical | No distinct cut-off specified* | No range of lag times specified | Disease progression | HR: 0.53 [0.33–0.87] (random-effects, I2 = 86%) | Zhao et al., 2019 |
| Therapy response rate | HR: 0.87 [0.73–1.03] (fixed-effects) | |||||||
| Breast | -- | T30 | Continuous | Per 1-month increase | 31 to 203 days | LR | RR: 1.08 [1.02–1.14] (fixed-effects) | Gupta et al., 2016 |
| Colorectal | Rectal | T28 | Categorical | >4 vs. <4 weeks | 5 days to 8 weeks | pCR rate | RR: 15.71 [2.10–117.30] (fixed-effects) | Wu et al., 2018 |
| Downstaging rate | RR: 2.63 [1.77–3.90] (fixed-effects) | |||||||
| TNM stage | RR: 1.49 [1.23–1.81] (fixed-effects) | |||||||
| Sphincter-preserving rate | RR: 1.05 [0.96–1.15] (fixed-effects) | |||||||
| R0 resection rate | RR: 1.08 [0.99–1.19] (fixed-effects) | |||||||
| Incidence of postoperative complications | RR: 0.81 [0.70–0.95] (fixed-effects) | |||||||
| Rectal | T29 | Categorical | >7–8 vs. <7–8 weeks | 5 to >12 weeks | pCR rate | RR: 1.45 [1.18–1.78] (fixed-effects) | Wang et al., 2016 | |
| Categorical | >6–8 vs. <6–8 weeks | 4 to 14 weeks | pCR rate | RR: 1.42 [1.19–1.68] (fixed-effects) | Petrelli et al., 2016 | |||
| Categorical | ≥8 vs. <8 weeks | 4 to 14 weeks | pCR rate | RR: 1.24 [1.14–1.35] (random-effects, I2 = 9.8%) | Du et al., 2018 | |||
| Operative time | SMD: 0.15 [0.03–0.32] (random-effects, I2 = 24.3%) | |||||||
| Incidence of LR | RR: 0.92 [0.61–1.37] (random-effects, I2 = 65.1%) | |||||||
| Postoperative complications | RR: 0.95 [0.83–1.09] (random-effects, I2 = 25.6%) | |||||||
| Anastomotic leakage | RR: 0.89 [0.49–1.63] (random-effects, I2 = 0%) | |||||||
| Sphincter-preserving surgery | RR: 0.99 [0.91–1.07] (random-effects, I2 = 0%) | |||||||
| Head and neck | Oral | T1 | Categorical | No distinct cut-off specified | >30 days to >1 month | TNM staging | RR: 1.55 [1.14–2.12] (fixed-effects) | Seoane et al., 2016 |
| RR: 1.55 [1.14–2.12] (random-effects, Ri = 0.00) | ||||||||
| T11 | Categorical | No distinct cut-off specified | >30 days to >1 month | TNM staging | RR: 1.83, [1.31–2.56] (fixed-effects) | |||
| RR: 2.15 [1.08–4.29] (random-effects, Ri = 0.74) | ||||||||
| T1, T2, T4, T11 | Categorical | No distinct cut-off specified | >30 to >45 days | TNM staging | RR: 1.61 [1.33–1.93] (fixed-effects) | |||
| RR: 1.66 [1.25–2.20] (random-effects, Ri = 0.49) | ||||||||
| Oropharyngeal, Oral (advanced stage) | T4 | Categorical | No distinct cut-off specified | No range of lag times specified | TNM staging | OR: 1.32 [1.07–1.62] (fixed-effects) | Gómez et al., 2009 | |
| OR: 1.25 [0.84–1.85] (random-effects, Ri = 0.70) | ||||||||
| Esophageal | T29 | Categorical | >7–8 vs. ≤7–8 weeks | ≤46 to >64 days | pCR rate | OR: 0.97 [0.73–1.30] (fixed-effects) | Lin et al., 2016 | |
| Postoperative mortality | OR: 0.75 [0.40–1.44] (fixed-effects) | |||||||
| Anastomotic leakage | OR: 1.33 [0.69–1.85] (fixed-effects) | |||||||
| R0 resection rate | OR: 1.71 [1.14–2.22] (fixed-effects) | |||||||
-
Significant pooled risk estimates are bolded.
-
-- indicates that cancer type not specified or applicable to the site.
-
*
Meta-analysis utilized the ‘early’ and ‘late’ lag time interval definitions in included studies without standardization of lag time cut-offs.
-
CI, confidence interval; HR, hazard ratio; LR, local recurrence; OR, odds ratio; pCR, pathological complete response; RR, risk ratio; SMD, standard mean difference.
Table 4
Mortality-related findings of meta-analyses on the association between time to cancer diagnosis and/or treatment and clinical outcomes, by cancer site/type and lag time interval.
| Cancer | Lag time interval | Findings | First author (year) | |||||
|---|---|---|---|---|---|---|---|---|
| Site | Type | Interval | Type | Comparison | Time range | Outcome measures* | Pooled risk estimate [95% CI](model type, heterogeneity statistics I2 or Ri) | |
| Blood | Smoldering multiple myeloma | T21 | Categorical | No distinct cut-off specified† | No range of lag times specified | Mortality | HR: 0.90 [0.72–1.12] (fixed-effects) | Zhao et al., 2019 |
| Brain | Glioblastoma | T30 | Continuous | Per 1-week increase | 12 to 53 days | Mortality | HR: 0.98 [0.90–1.08] (non-adjusted model) | Loureiro et al., 2016 |
| Breast | -- | T30 | Continuous | Per 1-month increase | 31 to 203 days | Mortality | RR: 0.99 [0.94–1.05] (fixed-effects) | Gupta et al., 2016 |
| -- | T32 | Continuous | Per 4-week increase | <21 days to >3 months | Mortality | HR: 1.15 [1.03–1.28] (random-effects, I2 = 75.4%) | Yu et al., 2013 | |
| Worsened DFS | HR: 1.16 [1.01–1.33] (fixed-effects) | |||||||
| -- | Continuous | Per 4-week increase | <21 days to >3 months | Mortality | RR: 1.04 [1.01–1.08] (fixed-effects) | Raphael et al., 2016 | ||
| RR: 1.08 [1.01–1.15] (random-effects, I2 = 60%) | ||||||||
| Worsened DFS | RR: 1.05 [1.01–1.08] (fixed-effects) | |||||||
| RR: 1.05 [1.01–1.10] (random-effects, I2 = 94.9%) | ||||||||
| -- | Continuous | Per 4-week increase | <21 days to >3 months | Mortality | HR: 1.13 [1.08–1.19] (random-effects, I2 = 78.9%) | Liu et al., 2017 | ||
| Worsened DFS | HR: 1.14 [1.05–1.24] (random-effects, I2 = 60.9%) | |||||||
| Colorectal | Rectal | T28 | Categorical | >4 vs. <4 weeks | 5 days to 8 weeks | Mortality | RR: 0.75 [0.53–1.07] (random-effects, I2 = 60%) | Wu et al., 2018 |
| Worsened DFS | RR: 0.78 [0.84–1.14] (fixed-effects) | |||||||
| Rectal | T29 | Categorical | >6–8 vs. <6–8 weeks | 4 to 14 weeks | Mortality | RR: 0.85 [0.50–1.43] (random-effects, I2 = 59%) | Petrelli et al., 2016 | |
| Worsened DFS | RR: 0.81 [0.58–1.12] (random-effects, I2 = 61%) | |||||||
| Rectal | Categorical | ≥8 vs. <8 weeks | 4 to 14 weeks | Mortality | RR: 0.98 [0.91–1.06] (random-effects, I2 = 42.4%) | Du et al., 2018 | ||
| Worsened DFS | RR: 1.04 [0.94–1.14] (random-effects, I2 = 46.7%) | |||||||
| Colorectal (Stage II/III) | T32 | Categorical | >8 vs. <8 weeks | 4 to 8+ weeks | Mortality | RR: 1.20 [1.15–1.26] (fixed-effects) | Des Guetz et al., 2010 | |
| Worsened RFS | RR: 0.98 [0.89–1.08] (fixed-effects) | |||||||
| Colorectal (Stage II/III) | Continuous | Per 4-week increase | 4 to >36 weeks | Mortality | HR: 1.14 [1.10–1.17] (fixed-effects) | Biagi et al., 2011 | ||
| DFS | HR: 1.14 [1.10–1.18] (fixed-effects) | |||||||
| Gastric | Categorical | >6–8 vs. <6–8 weeks | <4 to >12 weeks | Mortality | HR: 1.20 [1.04–1.38] (fixed effects) | Petrelli et al., 2019 | ||
| HR: 1.41 [0.94–1.28] (random-effects, I2 = 90%) | ||||||||
| Colorectal | Mortality | HR: 1.27 [1.21–1.33] (fixed-effects) | ||||||
| HR: 1.27 [1.25–1.28] (random-effects, I2 = 70%) | ||||||||
| Pancreatic | Mortality | HR: 1.00 [1.00–1.01] (fixed-effects) | ||||||
| Head and neck | -- | T1 | Categorical | No distinct cut-off specified | 30 to 60 days | Mortality | RR: 1.54 [1.21–1.94] (fixed-effects) | Seoane et al., 2012 |
| RR: 1.67 [0.88–3.19] (random-effects, Ri = 0.85) | ||||||||
| T2 | Categorical | No distinct cut-off specified | 72 days | Mortality | RR: 2.72 [1.45–5.09] (fixed-effects) | |||
| RR: 3.17 [1.12–9.00] (random-effects, Ri = 0.61) | ||||||||
| T4 | Categorical | No distinct cut-off specified | 108 to 180 days | Mortality | RR: 1.04 [1.01–1.07] (fixed-effects) | |||
| RR: 1.04 [1.01–1.07] (random-effects, Ri = 0.00) | ||||||||
| T11 | Categorical | No distinct cut-off specified | 21 to 106 days | Mortality | RR: 1.34 [1.00–1.78] (fixed-effects) | |||
| RR: 1.32 [0.66–2.66] (random-effects, Ri = 0.82) | ||||||||
| T1, T2, T4, T11 | Categorical | No distinct cut-off specified | 21 to 180 days | Mortality | RR: 1.05 [1.02–1.07] (fixed-effects) | |||
| RR: 1.34 [1.12–1.61] (random-effects, Ri = 0.95) | ||||||||
| Oral | T2 | Categorical | No distinct cut-off specified | >1 month | Mortality | RR: 2.48 [1.39–4.42] (fixed-effects) | Seoane et al., 2016 | |
| RR: 2.48 [1.39–4.42] (random-effects, Ri = 0.00) | ||||||||
| T1, T2, T4, T11 | Categorical | No distinct cut-off specified | >30 to >45 days | Mortality | RR: 1.02 [0.93–1.12] (fixed-effects) | |||
| RR: 1.35 [0.84–2.18] (random-effects, Ri = 0.94) | ||||||||
| Esophageal | T29 | Categorical | >7–8 vs. ≤7–8 weeks | ≤46 to >64 days | Mortality, 2 years | OR: 1.40 [1.09–1.80] (fixed-effects) | Lin et al., 2016 | |
| Mortality, 5 years | OR: 1.14 [0.84–1.54] (fixed-effects) | |||||||
| Ovarian | -- | T32 | Categorical | No distinct cut-off specified | <15 days to >12 weeks | Mortality | HR: 1.18 [1.06–1.32] (random-effects, I2 = 17.6%) | Liu et al., 2017 |
| Continuous | Per 1-week increase | Mortality | HR: 1.04 [1.00–1.09] (random-effects, I2 = 9.05%) | |||||
| -- | Categorical | No distinct cut-off specified | 19 to 42 days | Mortality, 3 years | OR: 1.06 [0.90–1.24] (random-effects, I2 = 64.3%) | Usón et al., 2017 | ||
-
Significant pooled risk estimates are bolded.
-
-- indicates that cancer type not specified or applicable to the site.
-
*
Response variables of interest indicate the directionality of the pooled risk estimate (e.g., RR >1 associated with greater risk of mortality among patients with lag time intervals to cancer care endpoint greater than the lag time cut-off considered by the meta-analysis).
-
†
Meta-analyses utilized the ‘early’ and ‘deferred’ lag time interval definitions in included studies without standardization of lag time cut-offs.
-
CI, confidence interval; DFS, disease-free survival; HR, hazard ratio; I2, heterogeneity; OR, odds ratio; RFS, recurrence-free survival; Ri, proportion of total variance due to between-study variance; RR, risk ratio; SMD, standardized mean difference.
Additional files
-
Supplementary file 1
Search strategy used to identify relevant systematic reviews and meta-analyses on the association between time to cancer diagnosis and treatment and outcomes of interest.
The search was performed on 15 February 2021, limiting to publications from before the COVID-19 pandemic (1 January 2010–31 December 2019), with no restriction on publication language.
- https://cdn.elifesciences.org/articles/81354/elife-81354-supp1-v2.docx
-
Supplementary file 2
Characteristics of included systematic reviews on the association between time to cancer diagnosis and treatment and clinical outcomes.
- https://cdn.elifesciences.org/articles/81354/elife-81354-supp2-v2.docx
-
Supplementary file 3
Characteristics of and subgroup and/or sensitivity analysis reported by included meta-analyses on the association between time to cancer diagnosis and treatment and clinical outcomes.
AC, adjuvant chemotherapy; CI, confidence interval; DFS, disease-free survival; HR, hazard ratio; LR, local recurrence; OR, odds ratio; OS, overall survival; pCR, pathological complete response; RCT, randomized controlled trial; RR, risk ratio; SMM, smoldering multiple myeloma. Significant pooled risk estimates are bolded. -- indicates that subgroup and/or sensitivity analyses were not conducted or were not available.
- https://cdn.elifesciences.org/articles/81354/elife-81354-supp3-v2.docx
-
MDAR checklist
- https://cdn.elifesciences.org/articles/81354/elife-81354-mdarchecklist1-v2.pdf
Download links
A two-part list of links to download the article, or parts of the article, in various formats.
Downloads (link to download the article as PDF)
Open citations (links to open the citations from this article in various online reference manager services)
Cite this article (links to download the citations from this article in formats compatible with various reference manager tools)
The impact of lag time to cancer diagnosis and treatment on clinical outcomes prior to the COVID-19 pandemic: A scoping review of systematic reviews and meta-analyses
eLife 12:e81354.
https://doi.org/10.7554/eLife.81354


