The long noncoding RNA Charme supervises cardiomyocyte maturation by controlling cell differentiation programs in the developing heart
- Department of Biology and Biotechnologies “Charles Darwin”, Sapienza University of Rome, Italy
- Center for Life Nano- and Neuro-Science, Istituto Italiano di Tecnologia (IIT), Italy
- Department of Medical Surgical Sciences and Biotechnologies, Sapienza University of Rome, Italy
- Center for Human Technologies, Istituto Italiano di Tecnologia, Italy
- Epigenetics and Neurobiology Unit, EMBL-Rome, Italy
- DAHFMO-Unit of Histology and Medical Embryology, Sapienza University of Rome, Italy
Figures
Figure 1 with 1 supplement
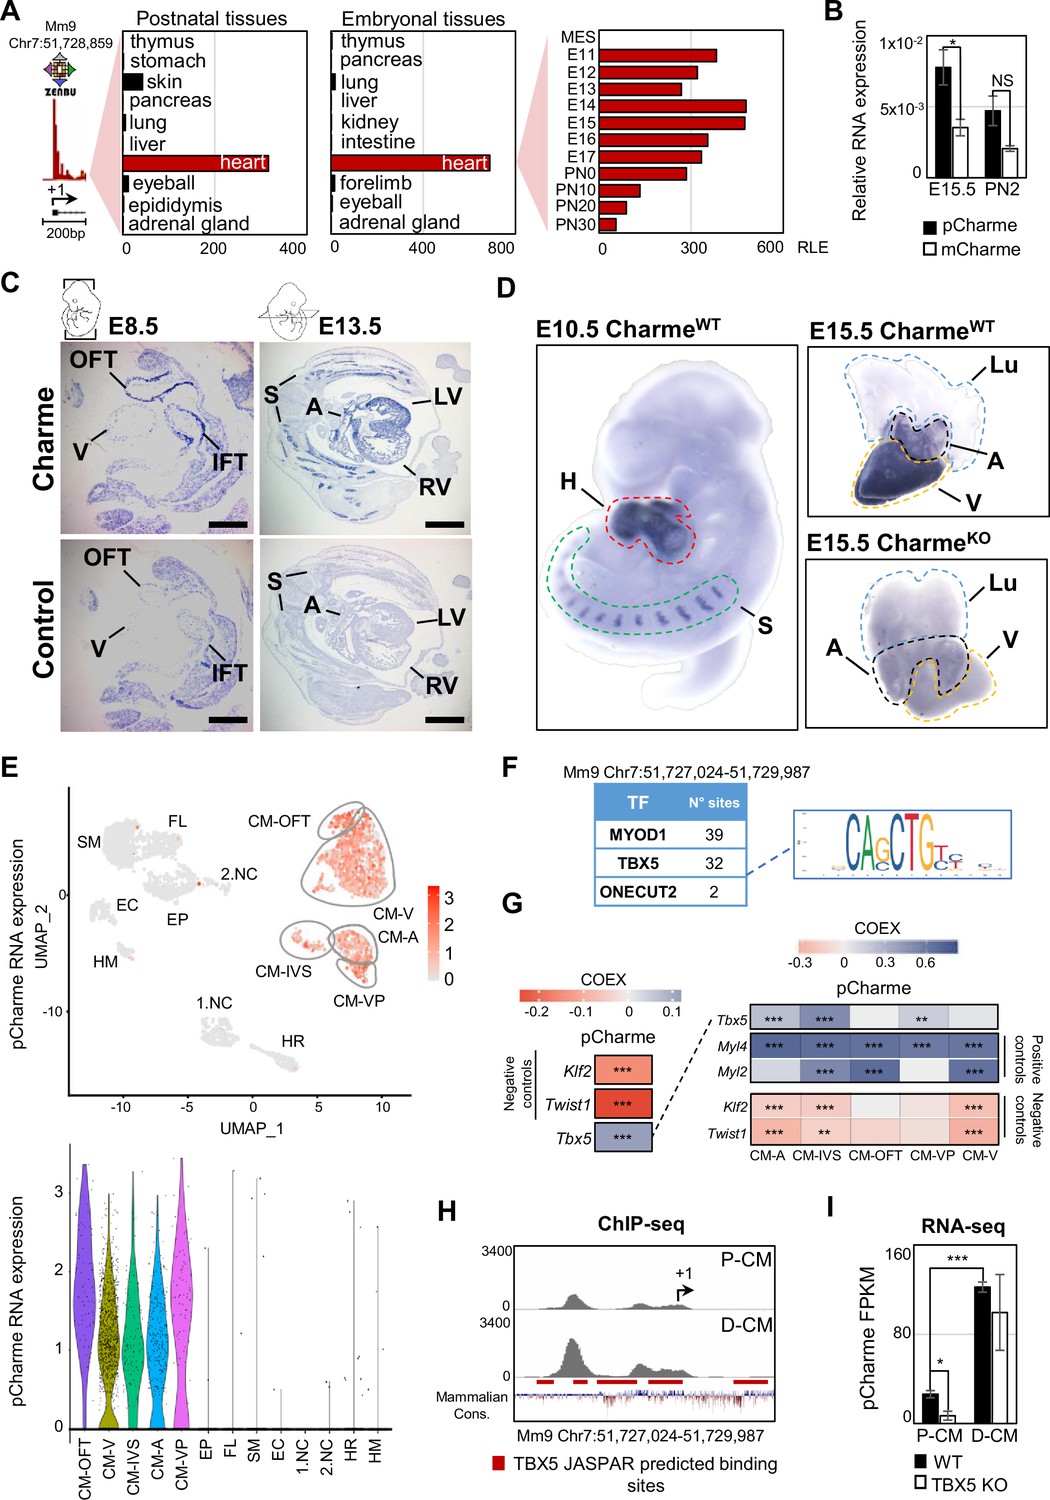
Charme locus expression in developing mouse embryos and in the heart.
(A) Transcriptional start site (TSS) usage analysis from FANTOM5 CAGE phase1 and 2 datasets (skeletal muscle is not included) on the last update of Zenbu browser (https://fantom.gsc.riken.jp/zenbu/; FANTOM5 Mouse mm9 promoterome) showing Charme locus expression in postnatal and embryonal body districts (left and middle panels) and during different stages of cardiac development (right panel, E11–PN30). MES, mesoderm. Bars represent the relative logarithmic expression (RLE) of the tag per million values of Charme TSS usage in the specific samples. (B) Quantitative reverse transcription PCR (RT-qPCR) amplification of pCharme and mCharme isoforms in RNA extracts from CharmeWT E15.5 and neonatal (PN2) hearts. Data were normalized to Gapdh mRNA and represent means ± SEM of 3 independent biological pools (at least 3 littermates/pool). (C) In situ hybridization (ISH) performed on embryonal cryo-sections using digoxigenin-labeled RNA antisense (Charme, upper panel) or sense (control, lower panel) probes against Charme. Representative images from two stages of embryonal development (E8.5 and E13.5) are shown. OFT, outflow tract; IFT, inflow tract; V, ventricle; LV/RV, left/right ventricle; A, atria; S, somites. Scale bars, 1mm. (D) Whole-mount in situ hybridization (WISH) performed on CharmeWT intact embryos (E10.5, left panel) and CharmeWT and CharmeKO hearts at their definitive morphologies (E15.5, right panels). Signal is specifically detected in heart (H, red line) and somites (S, green line). Lungs (Lu, blue line) show no signal for Charme. The specificity of the staining can be appreciated by the complete absence of signal in explanted hearts from CharmeKO mice (Ballarino et al., 2018). A, atria (black line); V, ventricles (yellow line). (E) Upper panel: UMAP plot showing pCharme expression in single-cell transcriptomes of embryonal (E12.5) hearts (Jackson-Weaver et al., 2020). Lower panel: violin plot of pCharme expression in the different clusters (see ‘Materials and methods’ for details). CM, cardiomyocytes; CM-A, atrial-CM; CM-V, ventricular-CM; ISV, interventricular septum; VP, venous pole; OFT, outflow tract; NC, neural crest cells; EP, epicardial cells; FL, fibroblasts-like cells; EC, endothelial cells; SM, smooth muscle cells; HM, hemopoietic myeloid cells; HR, hemopoietic red blood cells. (F) In silico analysis of MYOD1, TBX5, and ONECUT2 transcription factors (TF) binding sites using Castro-Mondragon et al., 2022 (relative profile score threshold = 80%). Castro-Mondragon et al., 2022 MyoD1 and Onecut2 were used as positive and negative controls, respectively. N° sites, number of consensus motifs. (G) COTAN heatmap obtained using the whole scRNA-seq (left) and contrasted subsetted dataset (right) showing pCharme and Tbx5 expression correlation (COEX). Myl4 and Myl2 were used as positive controls for cardiomyocytes while Klf2 and Twist1 as negative controls (markers of EC and NC, respectively). See ‘Materials and methods’ for details. (H) TBX5 ChIP-seq analysis across Charme promoter in murine precursors (P-CM) and differentiated cardiomyocytes (D-CM) (GSE72223, Luna-Zurita et al., 2016). The genomic coordinates of the promoter, the Charme TSS (+1, black arrow), the TBX5 JASPAR predicted binding sites (red lines), and the mammalian conservation track (Mammalian Cons.) from UCSC genome browser are reported. (I) Quantification of pCharme expression from RNA-seq analyses performed in wild type (WT) and TBX5 knockout (KO) murine P-CM and D-CM (SRP062699, Luna-Zurita et al., 2016). FPKM, fragments per kilobase of transcript per million mapped reads. Data information: *p<0.05; ***p<0.001; NS > 0.05, unpaired Student’s t-test.
Figure 1—figure supplement 1
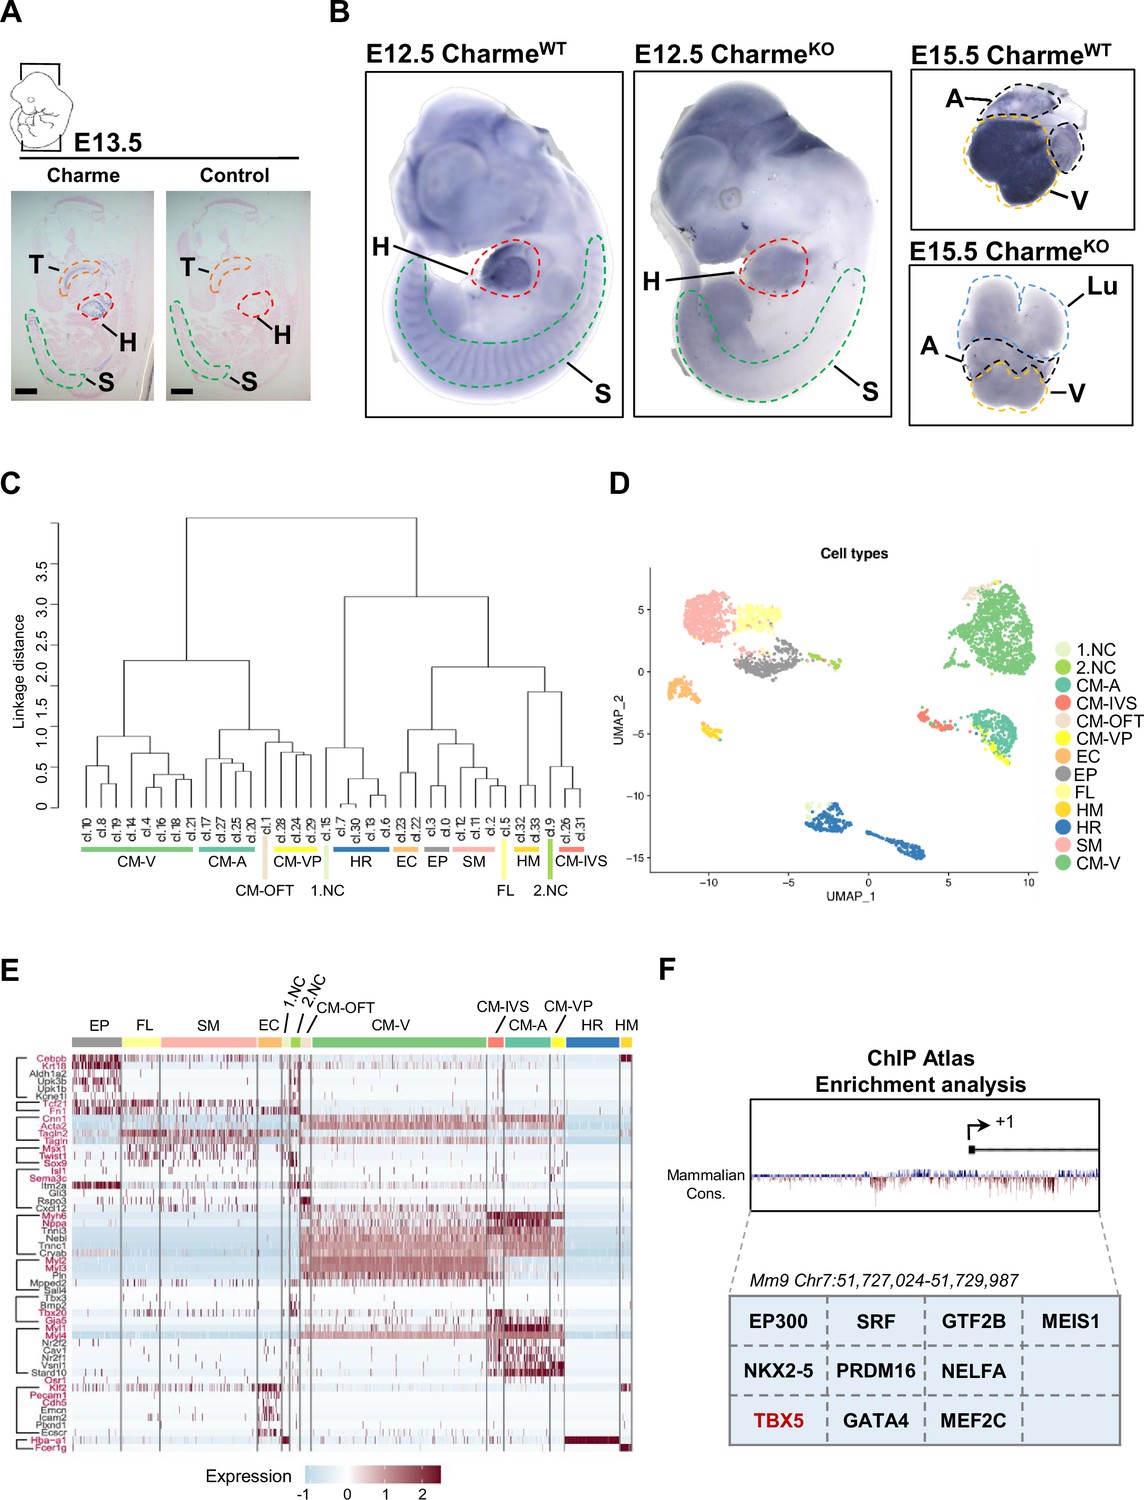
Study of Charme locus expression by WISH and scRNA-seq.
(A) In situ hybridization (ISH) performed on E13.5 embryonal cryo-sections using digoxigenin-labeled RNA antisense (Charme, left panel) or sense (control, right panel) probes against Charme. T, tongue (orange); H, heart (red); S, somites (green). Scale bars, 1mm. (B) Whole-mount in situ hybridization (WISH) performed on CharmeWT and CharmeKO intact embryos (E12.5, left panels) and hearts (E15.5, right panels). Signal is specifically detected in heart (H, red line) and somites (S, green line). The specificity of the staining can be appreciated by the complete absence of signals in the CharmeKO samples. Heart (H, red line); Somites (S, green line); A, atria (black line); V, ventricles (yellow line). (C) Dendrogram showing the relationships between homogeneous clusters. All the informative transcriptome was used to create a hierarchical clustering between homogeneous cell clusters. Colored lines mark which clusters were merged for the final clustering (D and E). CM, cardiomyocytes; A-CM, atrial-CM; V-CM, ventricular-CM; ISV, interventricular septum; VP, venous pole; OFT, outflow tract; NC, neural crest cell; EP, epicardial cells; FL, fibroblasts-like cells; EC, endothelial cells; SM, smooth muscle cells; HM, hemopoietic myeloid cells; HR, hemopoietic red blood cells. (D) Seurat (Stuart et al., 2019) UMAP plot colored by final cell assignments. See ‘Materials and methods’ for details. (E) Heatmap was generated by Seurat DoHeatmap (Stuart et al., 2019) and represents, for each cell of the identified subpopulations, the log normalized expression of cell identity markers (listed on the left). Genes used for cell clustering are marked in red. Maximum expression value (red), minimum expression value (light blue). Correspondence between gene markers and cell types is indicated on the left. (F) In silico analysis of cardiovascular TF binding sites on Charme promoter using the enrichment analysis tool on the ChIP Atlas database (https://chip-atlas.org/enrichment_analysis) by setting the threshold at 200.
Figure 2 with 1 supplement
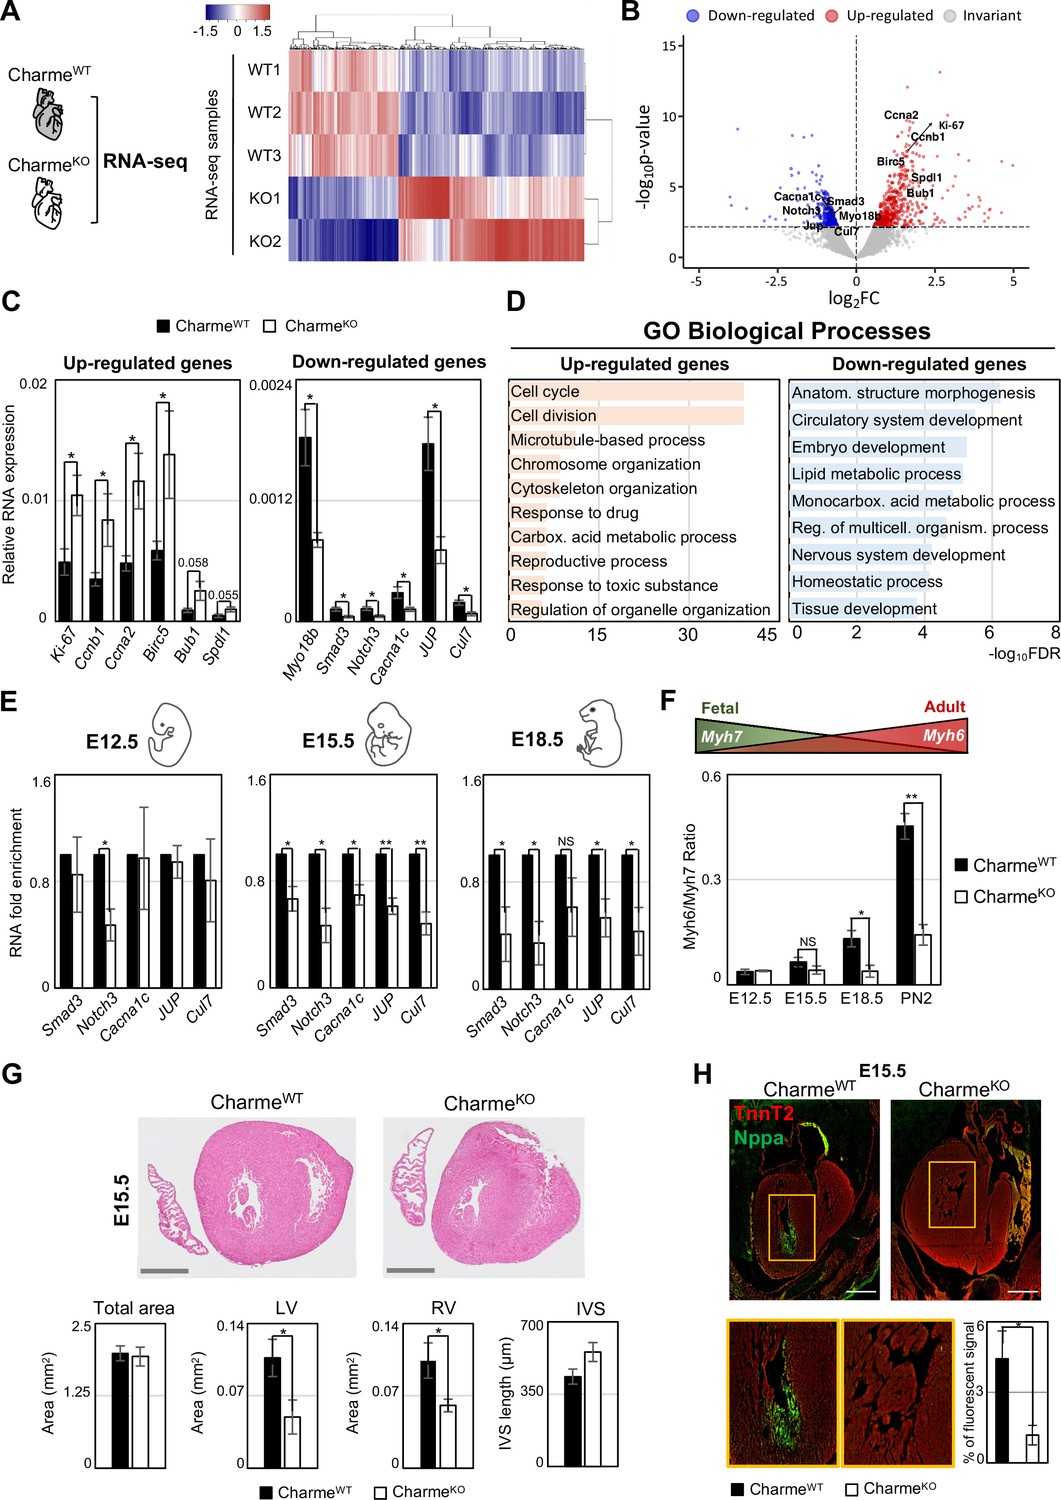
Genome-wide profiling of cardiac CharmeWT and CharmeKO transcriptomes.
(A) Heatmap visualization from RNA-seq analysis of CharmeWT and CharmeKO neonatal (PN2) hearts. Plot was produced by heatmap3 (Zhao, 2021). Expression values were calculated as FPKM, were log2-transformed and mean-centered. FPKM, fragments per kilobase of transcript per million mapped reads. (B) Volcano plots showing differential gene expression from transcriptome analysis of CharmeWT vs. CharmeKO PN2 hearts. Differentially expressed genes (DEGs) validated through RT-qPCR (C) are in evidence. FC, fold change. (C) RT-qPCR quantification of upregulated (left panel) and downregulated (right panel) DEGs in CharmeWT vs. CharmeKO neonatal hearts. Data were normalized to Gapdh mRNA and represent means ± SEM of WT (n = 5) vs. KO (n = 4) independent biological pools (at least 3 littermates/pool). (D) Gene Ontology (GO) enrichment analysis performed by WebGestalt (http://www.webgestalt.org) on upregulated (left panel) and downregulated (right panel) DEGs in CharmeWT vs. CharmeKO pools of neonatal hearts. Bars indicate the top categories of biological processes in decreasing order of – log10FDR. All the represented categories show a false discovery rate (FDR) value <0.05. (E) RT-qPCR quantification of pCharme targets in CharmeWT and CharmeKO extracts from E12.5, E15.5, and E18.5 hearts. DEGs belonging to the GO category ‘anatomical structure morphogenesis’ were considered for the analysis. Data were normalized to Gapdh mRNA and represent means ± SEM of WT and KO (n = 3) independent biological pools (at least 3 littermates/pool). (F) RT-qPCR quantification of the Myh6/Myh7 ratio in CharmeWT and CharmeKO extracts from E12.5, E15.5, and E18.5 and neonatal hearts. Data were normalized to Gapdh mRNA and represent means ± SEM of WT and KO (n = 3) independent biological pools (at least 3 littermates/pool). Schematic representation of the physiological Myh6/Myh7 expression trend is shown. (G) Upper panel: hematoxylin-eosin staining from CharmeWT and CharmeKO E15.5 cardiac transverse sections. Scale bars: 500 μm. Lower panel: quantification of the total area, the left and right ventricle cavities, and the thickness of the interventricular septum (IVS) in CharmeWT and CharmeKO E15.5 hearts. For each genotype, data represent the mean ± SEM of WT and KO (n = 3) biological replicates. (H) Representative images of Nppa (green) and TnnT2 (red) immunostaining in CharmeWT and CharmeKO (E15.5) cardiac sections. Regions of interest (ROI, orange squares) were digitally enlarged on the lower panels. Scale bar: 500 µm. Quantification of the area covered by the Nppa fluorescent signal is shown aside. Data represent the mean (%) ± SEM of WT (n = 4) and KO (n = 3) biological replicates. Data information: *p<0.05; **p<0.01, NS > 0.05, unpaired Student’s t-test.
Figure 2—figure supplement 1
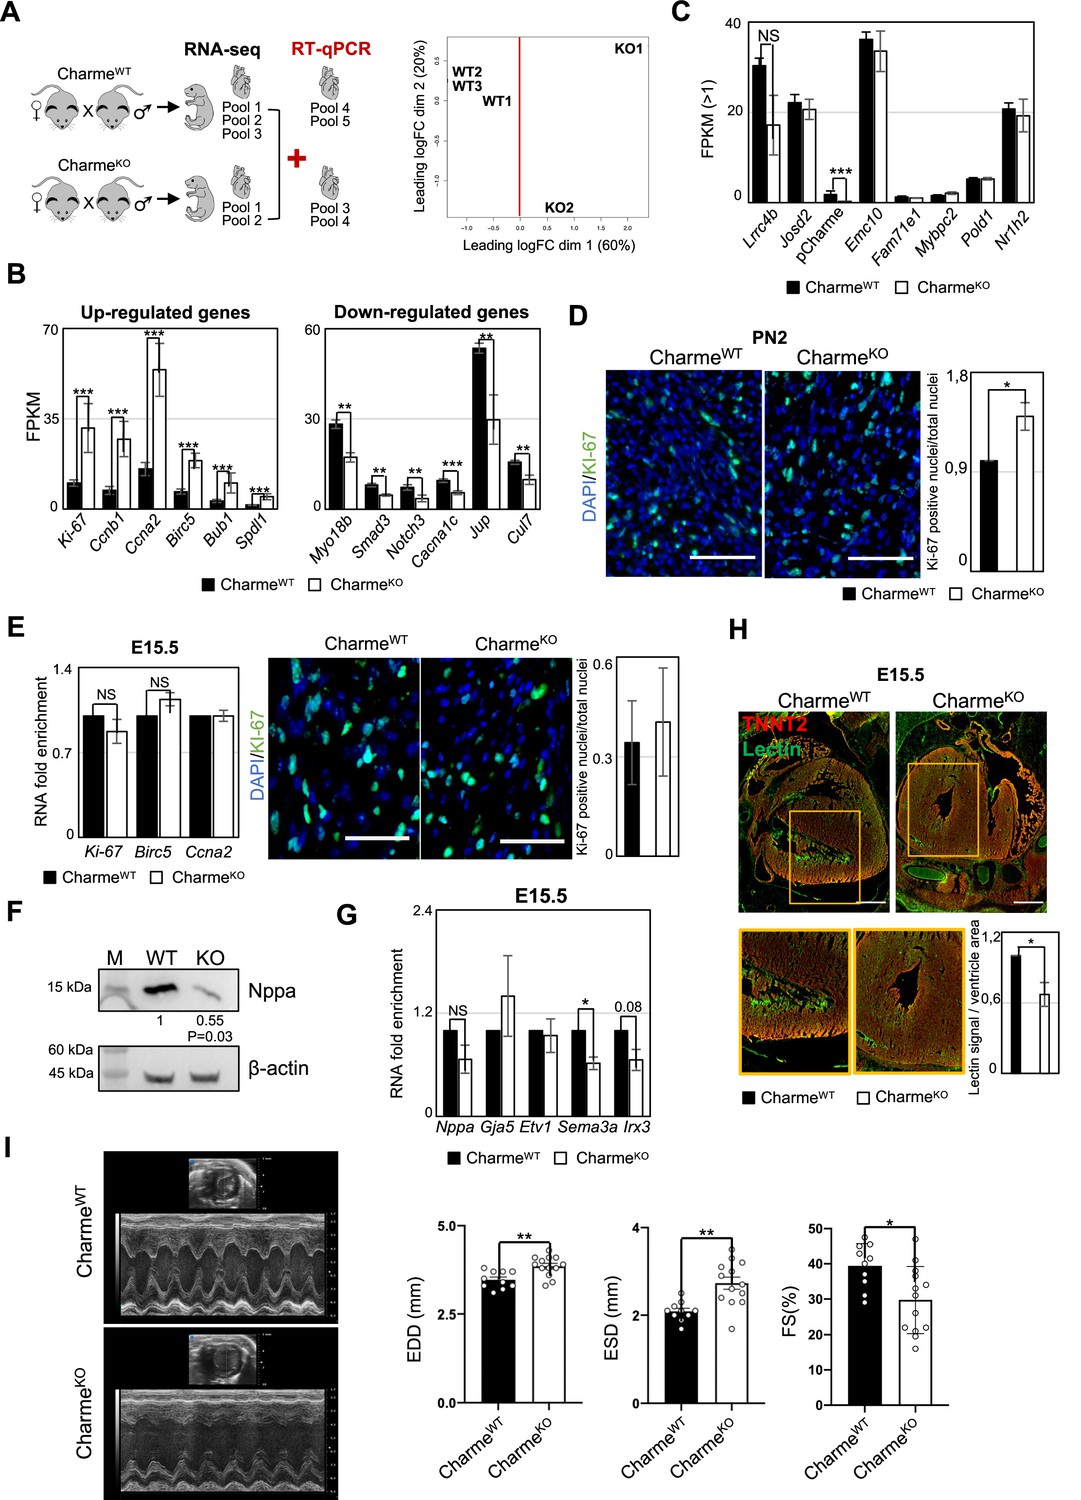
Transcriptomic and phenotypic characterization of CharmeWT and CharmeKO hearts.
(A) Schematic overview of the workflow to identifying differentially expressed genes (DEGs) from CharmeWT and CharmeKO transcriptomes (left panel). Multidimensional scaling plot of leading fold change (FC) between each pair of CharmeWT and CharmeKO RNA-seq samples (right panel). Plot was obtained by using the plotMDS function from edgeR package (Chen et al., 2022). (B) Quantification by RNA-seq (FPKM) of upregulated (left panel) and downregulated (right panel) DEGs in CharmeKO vs. CharmeWT neonatal hearts. (C) Quantification by RNA-seq (FPKM) of pCharme and Charme-neighboring genes expression in CharmeWT vs. CharmeKO neonatal hearts. (D) Left panel: representative images for KI-67 (green) and DAPI (blue) stainings on CharmeWT and CharmeKO neonatal cardiac sections. Scale bars: 70 µm. Right panel: quantification of KI-67-positive nuclei/total nuclei on CharmeWT and CharmeKO cardiac sections from neonatal mice. Data are expressed as mean ± SEM of WT and KO (n = 4) biological replicates. (E) Left panel: RT-qPCR quantification of DEGs belonging to the ‘cell cycle’ GO class from CharmeWT and CharmeKO E15.5 hearts. Data were normalized to Gapdh mRNA and represent means ± SEM of WT and KO (n = 3) independent biological pools (at least 3 littermates/pool). Right panel: representative images for KI-67 (green) and DAPI (blue) stainings on CharmeWT and CharmeKO E15.5 cardiac sections are shown. Quantification of KI-67-positive nuclei/total nuclei on CharmeWT and CharmeKO cardiac sections from E15.5 mice. Data are mean ± SEM. of WT and KO (n = 3) biological replicates. Scale bars: 140 µm. (F) Western blot analysis for NPPA in CharmeWT and CharmeKO E15.5 cardiac extracts. β-ACTIN was used as a loading control. Quantification of NPPA signal intensity relative to β-ACTIN is shown below. Data are mean ± SEM of WT and KO (n=3) biological replicates. *p=0.03. A representative image is shown. (G) RT-qPCR quantification of trabeculae markers expression in CharmeWT vs. CharmeKO E15.5 cardiac extracts. Data were normalized to Gapdh mRNA and represent means ± SEM of WT and KO (n = 3) independent biological pools (at least 3 littermates/pool). (H) Representative image of Lectin (green) and TnnT2 (red) immunostainings in CharmeWT and CharmeKO E15.5 cardiac sections. Regions of interest (ROIs) (orange squares) were digitally enlarged on the lower panels. Scale bars: 500 µm. Quantification of the area covered by the Lectin fluorescence signal is shown aside. For each genotype, data represent the mean ± SEM. of WT and KO (n = 3) biological replicates. (I) Representative M-mode echocardiographic track of CharmeWT and CharmeKO 9–12 months aged mice. Quantification of heart morphology (EDD, end-diastolic diameter; ESD, end-systolic diameter) and function (FS: Fractional Shortening = (EDD-ESD)/EDD) were evaluated. Data represent the mean ± SEM of WT and KO (n = 10–13) biological replicates. Data information: *p<0.05, **p<0.01, ***p<0.001, unpaired Student’s t-test.
Figure 3 with 1 supplement

In fetal cardiomyocytes pCharme promotes MATR3 nuclear condensation.
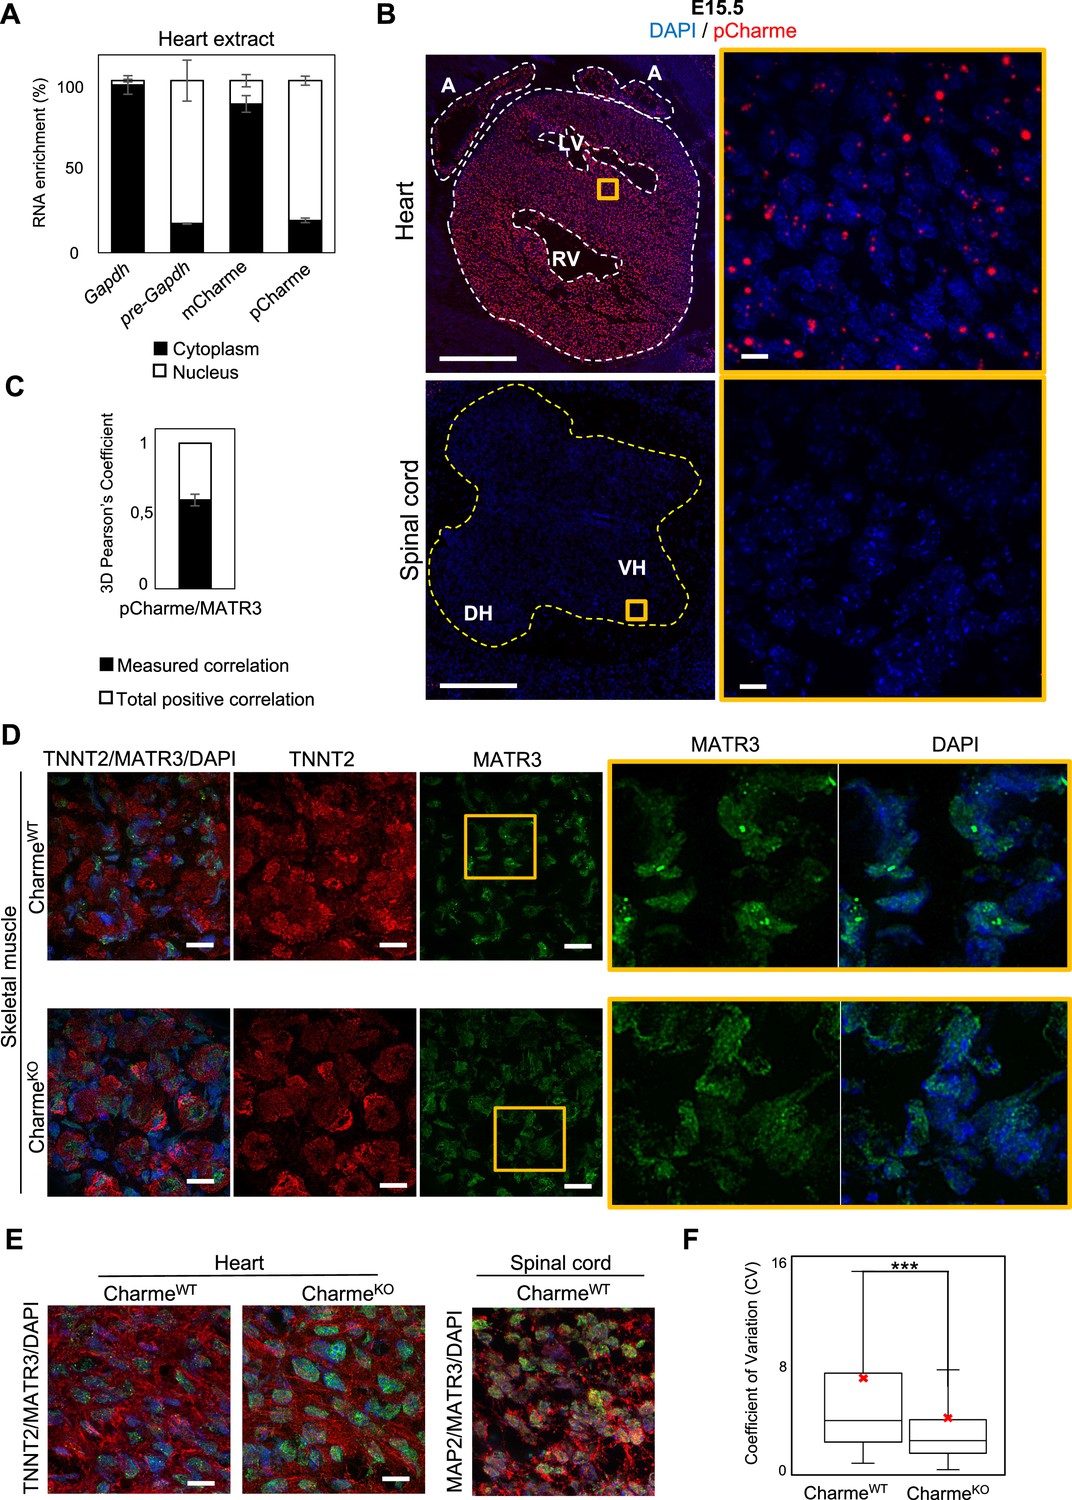
(A) RNA-FISH for pCharme (red) and DAPI staining (blue) in CharmeWT cardiac and spinal cord from E15.5 tissue sections. Whole heart (white dashed lines), spinal cord (yellow dashed line). A, atria; LV and RV, left and right ventricle; DH and VH, dorsal and ventral horn. Scale bars, 500 μm. (B) Upper panel: RNA-FISH for pCharme (red) combined with immunofluorescence for MATR3 (green) and DAPI staining (gray) in CharmeWT from E15.5 cardiac sections. Dashed lines show the edge of nuclei. Lower panel: selected nuclei (yellow dashed lines in the upper panel) were enlarged and processed for isosurface reconstruction (left panel) and digital magnification (right panel). Overlapped signals are shown (asterisks). Scale bars, 5 μm. (C) Upper panel: representative images for MATR3 (green), TnnT2 (red), and DAPI (blue) stainings on CharmeWT and CharmeKO E15.5 cardiac sections. Lower panel: representative images for MATR3 (green), the Microtubule-associated protein 2 (MAP2) (red), and DAPI (blue) stainings on CharmeWT and CharmeKO E15.5 spinal cord sections. Regions of interest (ROI) (orange squares) were digitally enlarged on the right panels. Each image is representative of three individual biological replicates. Scale bars, 10 μm.
Figure 3—figure supplement 1
pCharme and MATR3 nuclear localization analyses.
(A) Quantification of the subcellular distribution of pCharme and mCharme in cardiac tissues from neonatal mice. Histogram shows the quantification by RT-qPCR of the RNA abundance (%) in cytoplasmic versus nuclear compartments. Gapdh and pre-Gapdh RNAs were used, respectively, as cytoplasmic and nuclear controls. Data represent means ± SEM of (n = 3) technical replicates (B) RNA-FISH for pCharme (red) and DAPI staining (blue) in CharmeWT hearts and spinal cord from E15.5 tissue sections (left panels) and their magnification (right panels). Whole heart (white dashed lines), spinal cord (yellow dashed line). A, atria; LV and RV: left and right ventricle; DH and VH: dorsal and ventral horn. Scale bars, 500 μm; 10 μm for magnifications. (C) 3D Pearson’s correlation coefficient of pCharme/MATR3 overlapping signals. Histogram shows the mean ± SEM calculated over 237 colocalized nuclear signals from (n=3) independent experiments. (D) Representative images for MATR3 (green), TnnT2 (red), and DAPI (blue) stainings on CharmeWT and CharmeKO skeletal muscles from E15.5 tissue sections. Regions of interest (ROI) (orange squares) were digitally enlarged on the right panels. Each image is a representative of three individual samples. Scale bars, 10 μm. (E) Left panel: Representative images for for MATR3 (green), TnnT2 (red), and DAPI (blue) stainings on CharmeWT and CharmeKO heart from E15.5 tissue sections. Right panel: representative images for MATR3 (green), MAP2 (red), and DAPI (blue) stainings on CharmeWT and CharmeKO spinal cord from E15.5 tissue sections. Each image is a representative of three individual samples. Scale bars, 10 μm. (F) Quantification of MATR3 fluorescence intensity distribution (CV, coefficient of variation) in CharmeWT (N = 1346 nuclei) and CharmeKO (N = 1404 nuclei). The red X indicates the mean value of CV distribution.
Figure 4 with 1 supplement
MATR3/pCharme nuclear condensates contain key regulators of heart development.
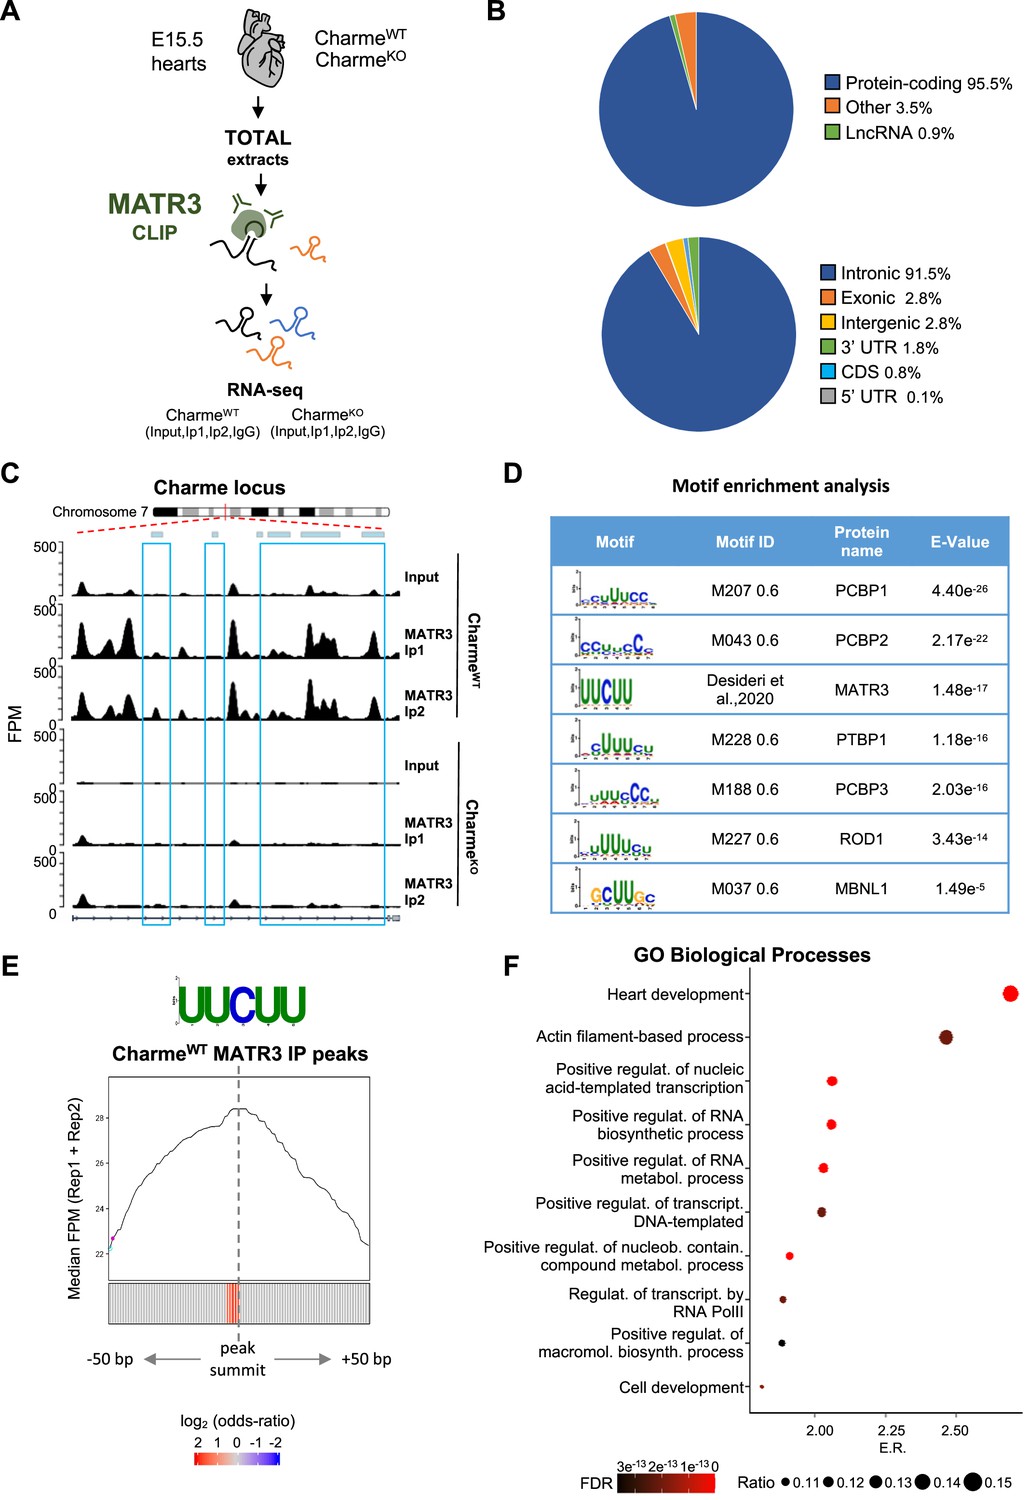
(A) Schematic representation of MATR3 CLIP-seq workflow from fetal (E15.5) CharmeWT and CharmeKO hearts. See ‘Materials and methods’ for details. (B) MATR3 CLIP-seq from fetal hearts. Upper panel: a pie-plot projection representing transcript biotypes of 951 identified MATR3 interacting RNAs. Peaks overlapping multiple transcripts were assigned with the following priority: protein coding, lncRNA, and others. Lower panel: a pie-plot projection representing the location of MATR3 enriched peaks (log2 fold enrichment >2 and false discovery rate [FDR] <0.05). Peaks overlapping multiple regions were assigned with the following priority: CDS, 3’UTR, 5’UTR, exons, introns, and intergenic. Percentages relative to each group are shown. (C) MATR3 CLIP-seq (Input, Ip1, and Ip2) normalized read coverage tracks (FPM) across pCharme from fetal hearts. Significant MATR3 peaks, displaying log2 fold enrichment >2 in both Ip1 and Ip2 samples compared to Input, are demarcated by light-blue boxes. Normalized read coverage tracks (FPM) from MATR3 CLIP-seq in CharmeKO fetal hearts on Charme locus are also shown. Plot obtained using Gviz R package. (D) Motif enrichment analysis perfomed on MATR3 CLIP-seq peaks (CharmeWT) with AME software using 93 RNA binding motifs from CISBP-RNA database. Seven consensus motifs resulted significantly over-represented (E value <0.05) among the MATR3 peaks compared to control regions. See ‘Materials and methods’ for details. (E) Positional enrichment analysis of MATR3 motif in MATR3 CLIP-seq top 500 peaks (CharmeWT, average log2 fold change). For each of the analyzed positions close to peak summit, line plot displays the median CLIP-seq signal (FPM, IP1 + IP2), while heatmap displays the log2 odds ratio of UUCUU motif enrichment. Significant enrichments (Bonferroni corrected p-value<0.05) are shown in red. See ‘Materials and methods’ for details. (F) GO enriched categories obtained with WebGestalt (http://www.webgestalt.org) on protein-coding genes overlapping CharmeWT MATR3 peaks. Dots indicate the top categories of biological processes (description in y-axis) in decreasing order of enrichment ratio (E.R., overlapped genes/expected genes, x-axis). Dot size (ratio) represents the ratio between overlapped gens and GO categories size while dot color (FDR) represents significance. All the represented categories show an FDR < 0.05.
Figure 4—figure supplement 1
Experimental workflow, data output and validation of MATR3 CLIP-seq.
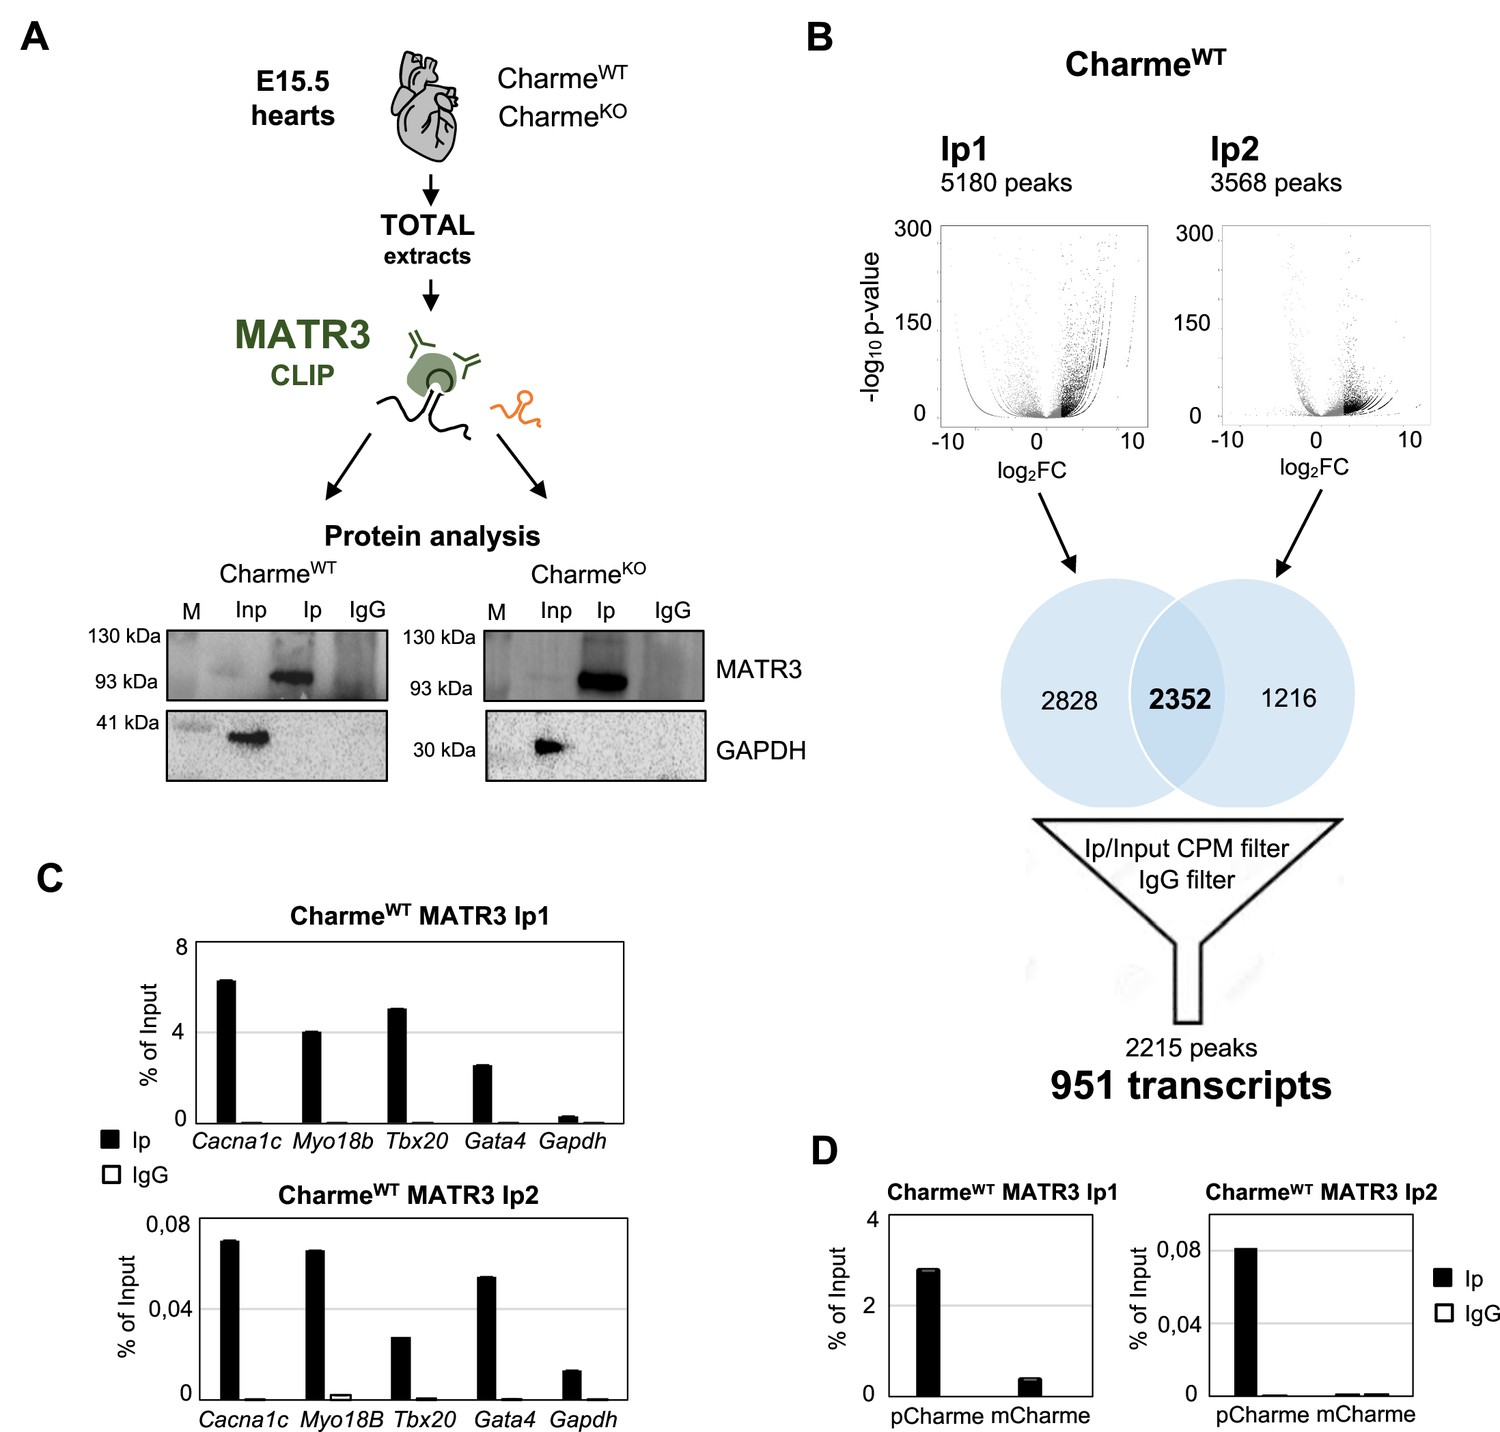
(A) Schematic representation of MATR3-CLIP assay as performed from fetal hearts (E15.5) in CharmeWT and CharmeKO conditions. MATR3 Western blot analysis on the retrieved protein fractions is shown. GAPDH protein serves as a loading control. Input (Inp) samples represent 10% of the total protein extracts. (B) Schematic representation of the workflow used for MATR3 CLIP-seq analysis. Volcano plots represent the fold enrichment over Input (log2 fold enrichment, x-axis) and significance (-log10 p-value, y-axis) of MATR3 peaks in the Ip1 (left panel) and Ip2 (right panel) samples. Black dots represent the significantly enriched peaks (log2 fold enrichment > 2 and false discovery rate [FDR] < 0.05). Venn diagrams depict the intersection between Ip1 and Ip2 significantly enriched peaks. The 2215 filtered peaks correspond to the 951 MATR3-bound transcripts. CPM, counts per million. See ‘Materials and methods’ for details. (C) RT-qPCR quantification of Cacna1c, Myo18b, Tbx20, and Gata4 RNA recovery in MATR3 Ip1 (upper panel), Ip2 (lower panel), and IgG CharmeWT samples. Gapdh RNA serves as negative control. Values are expressed as percentage of input. (D) RT-qPCR quantification of pCharme and mCharme RNA recovery in MATR3 Ip1 (left panel), Ip2 (right panel), and IgG CharmeWT samples. Values are expressed as percentage of input.
Figure 5 with 1 supplement
The pCharme/MATR3 interaction in cardiomyocytes sustains developmental genes expression.
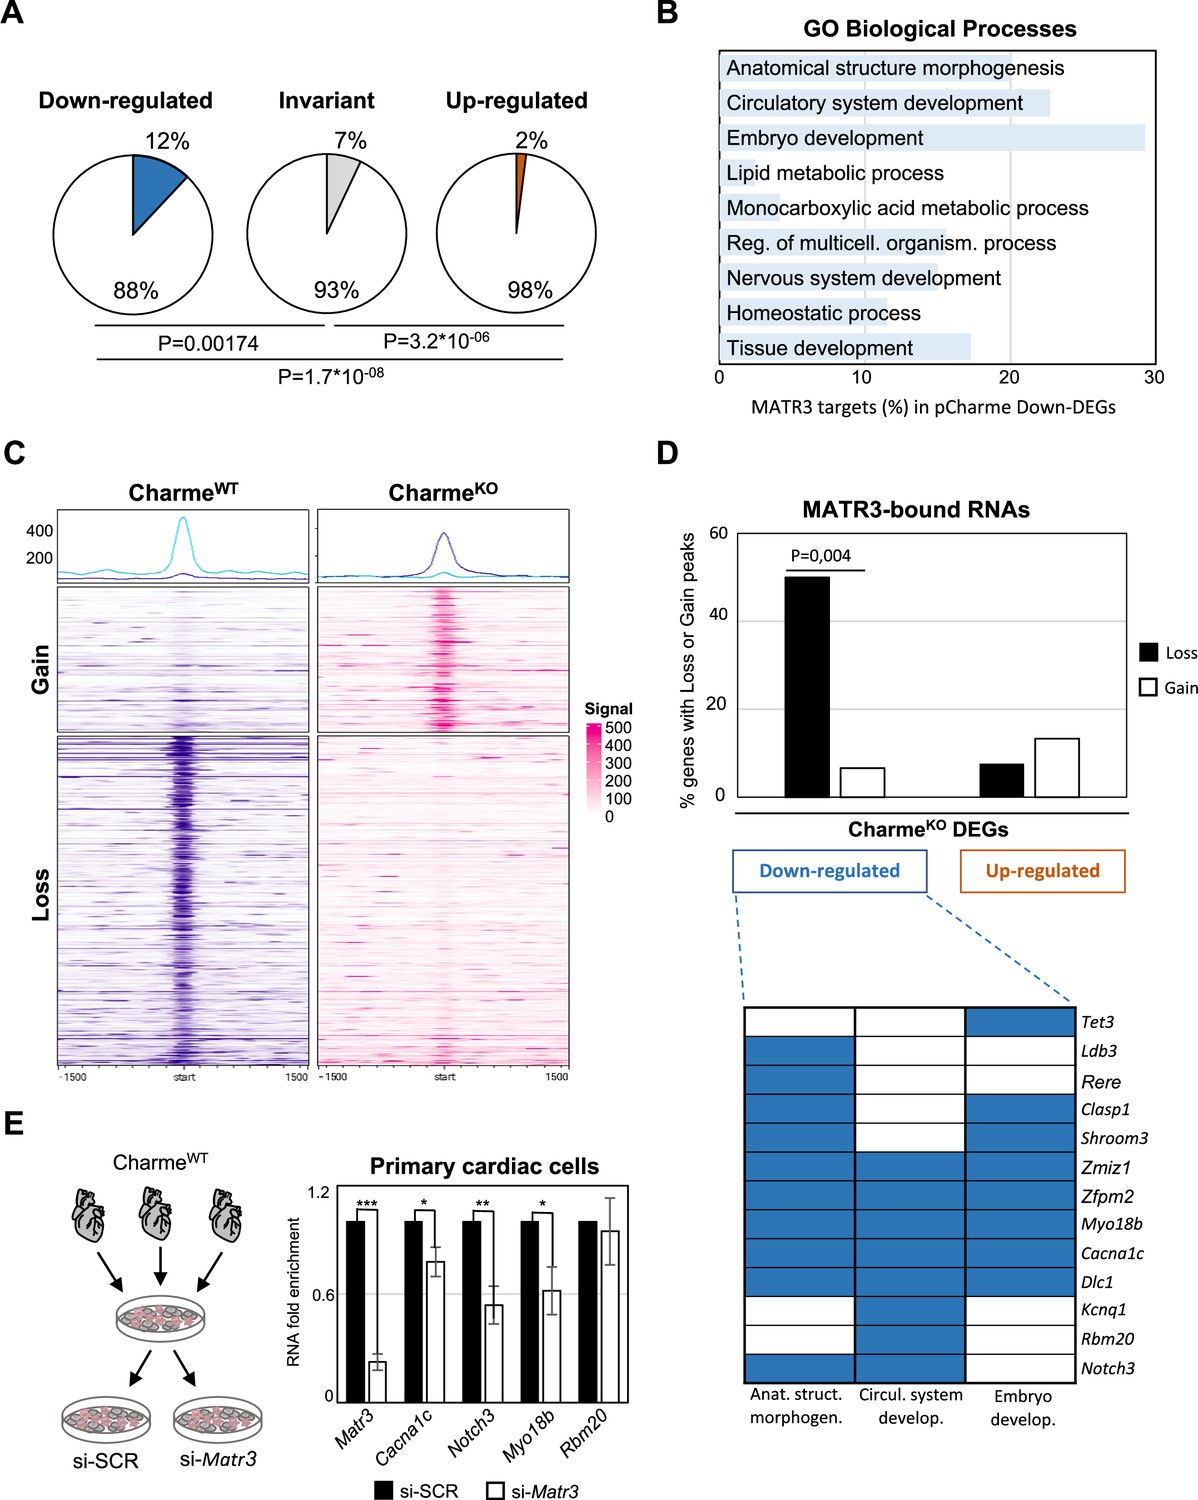
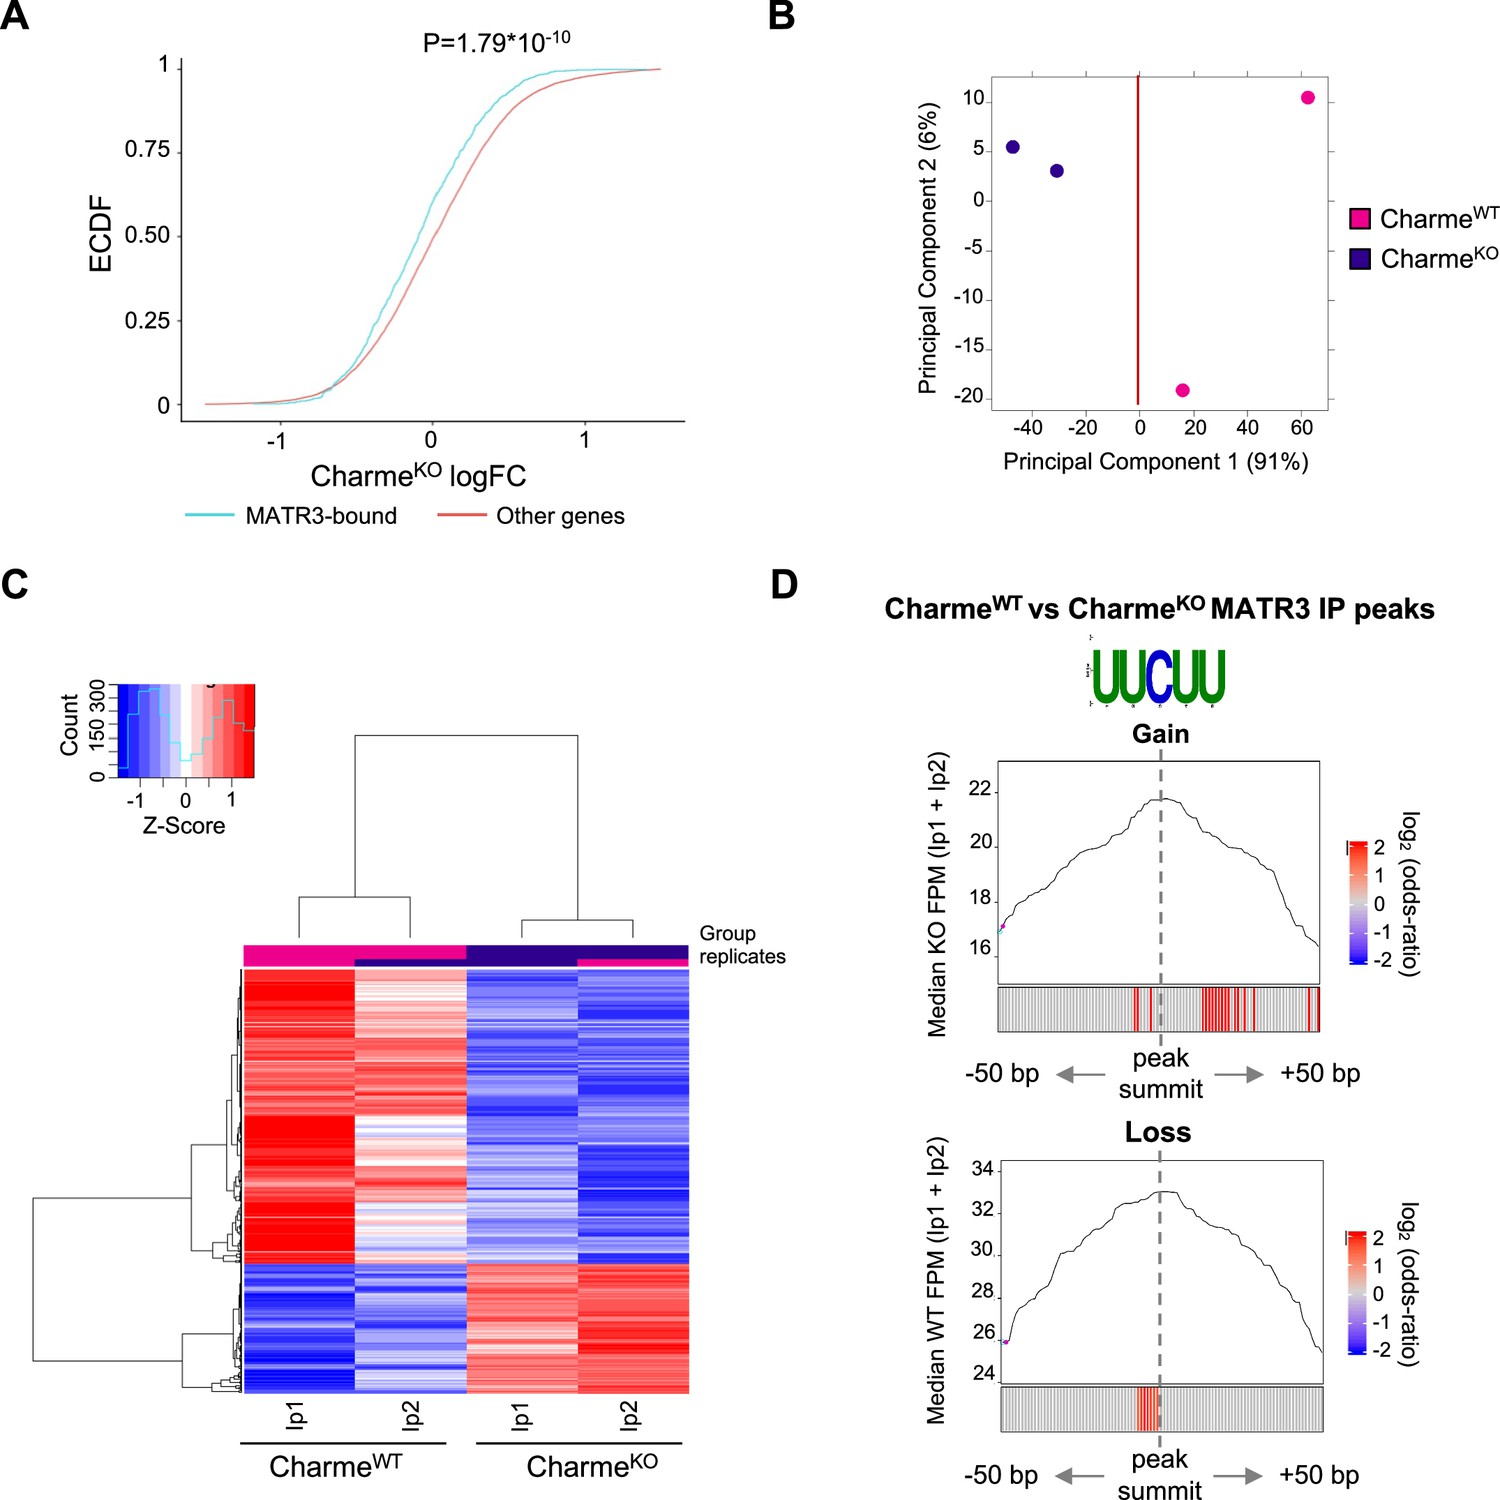
(A) Pie charts showing the percentage of MATR3 targets in CharmeKO downregulated, invariant, or upregulated differentially expressed genes (DEGs). Significance of enrichment or depletion was assessed with two-sided Fisher’s exact test, shown below. (B) MATR3 targets (%) in the GO categories enriching CharmeKO downregulated DEGs (Down-DEGs) (see also Figure 2A). (C) Profile heatmaps of differential MATR3 CLIP-seq peaks (CharmeWT vs. CharmeKO). Normalized mean read counts of both IP samples are shown only for significant (false discovery rate [FDR] < 0.05) ‘Gain’ and ‘Loss’ peaks. (D) Upper panel: histogram showing the distribution (%) of ‘Gain’ and ‘Loss’ MATR3 peaks in pCharme DEGs. Significance of enrichment was assessed with two-sided Fisher’s exact test. Lower panel: distribution of the subset (13 out of 20) of Down-DEGs with Loss peaks in the first three GO categories identified for downregulated genes (see also Figure 2A). (E) Left panel: schematic representation of primary cells extraction from CharmeWT hearts. Once isolated, cells were plated and transfected with the specific siRNA (si-Matr3) or control siRNA (si-SCR). See ‘Materials and methods’ for details. Right panel: RT-qPCR quantification of Matr3, Cacna1c, Notch3, Myo18b, and Rbm20 RNA levels in primary cardiac cells treated with si-SCR or si-Matr3. Data were normalized to Gapdh mRNA and represent mean ± SEM of (n=4) independent biological experiments. Data information: *p<0.05; **p<0.01; ***p<0.001, unpaired Student’s t-test.
Figure 5—figure supplement 1
Study of MATR3 binding properties from MATR3 CLIP-seq CharmeWT and CharmeKO datasets.
(A) Empirical cumulative distribution functions (ECDF) showing the RNA abundance of MATR3 targets in CharmeKO condition compared to the other expressed genes. Significance was determined using a two-sided Kolmogorov–Smirnov (KS) test. (B) Principal component analysis (PCA) plot of CharmeWT and CharmeKO MATR3 CLIP-seq peaks. Plot was obtained from DiffBind package. See ‘Materials and methods’ for details. (C) Heatmap visualization of CharmeWT and CharmeKO MATR3 CLIP-seq peaks. Plot was produced by DiffBind package. Z-score of normalized reads counts is shown. See ‘Materials and methods’ for details. (D) Positional enrichment analysis of MATR3 motif in differential MATR3 CLIP-seq peaks (CharmeWT vs. CharmeKO). For each analyzed position close to peak summit, line plot displays the median CLIP-seq signal (FPM, IP1 + IP2) while heatmap displays the log2 odds ratio of UUCUU motif enrichment. Significant enrichments (Bonferroni corrected p-value<0.05) are shown in red (seeee ‘Materials and methods’ for further details). CLIP-seq signal in CharmeKO and CharmeWT conditions is displayed for ‘Gain’ and ‘Loss’ peaks, respectively.
Figure 6
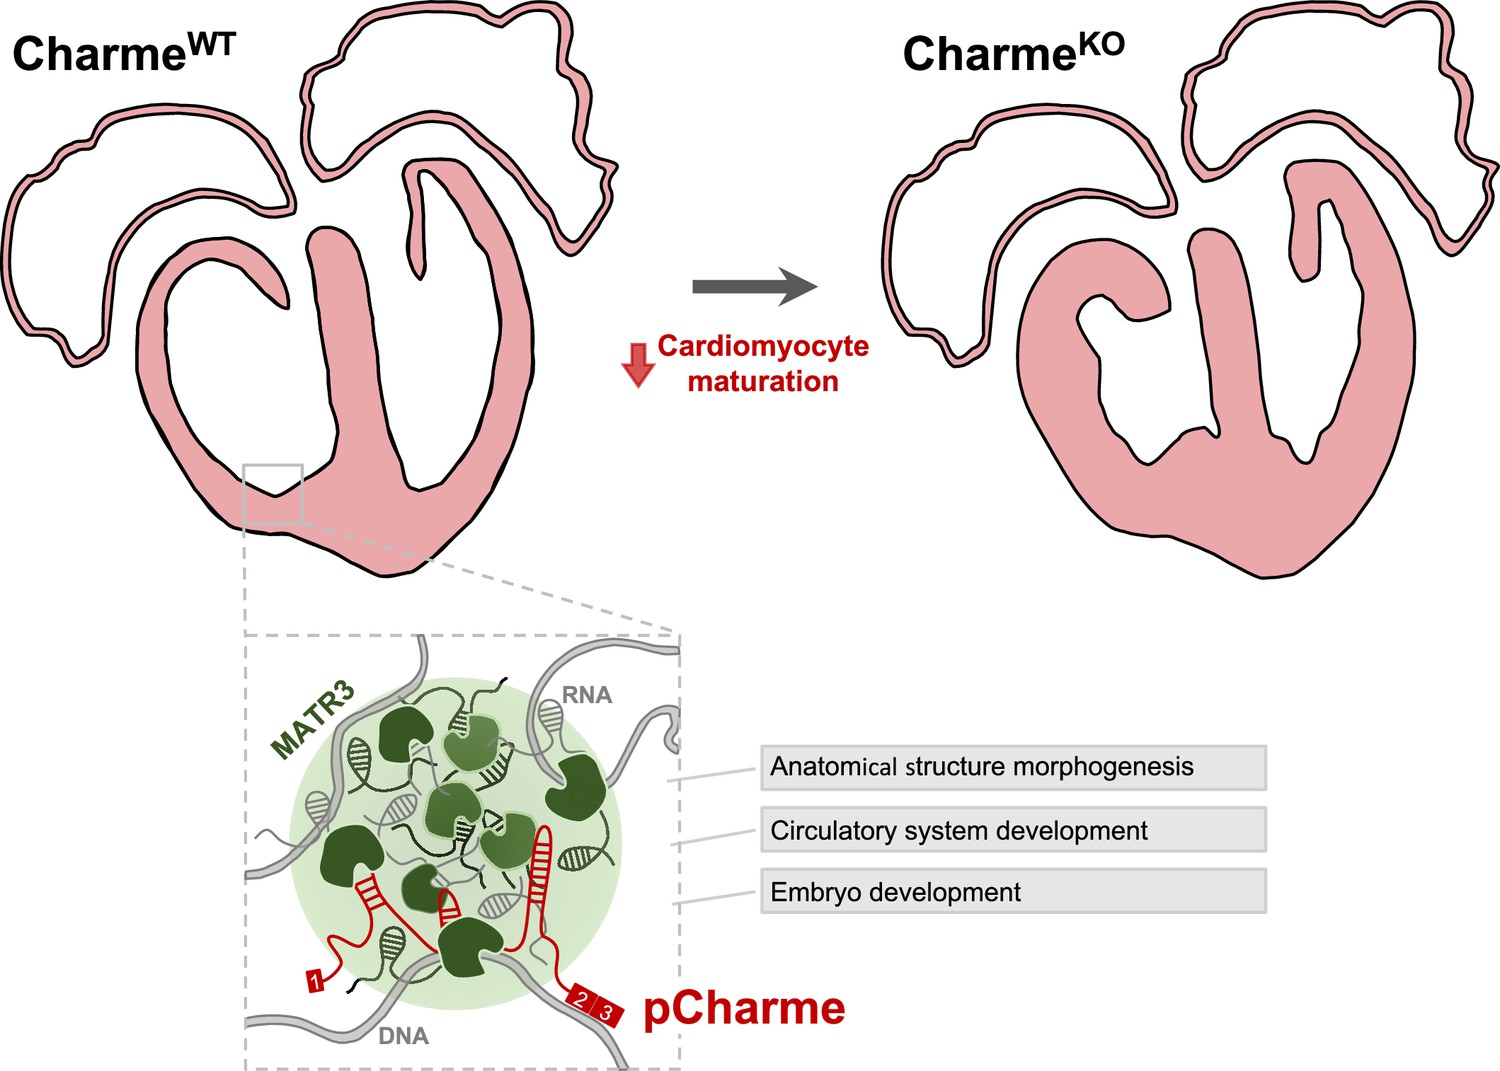
Proposed model for pCharme functions during heart development.
At developmental stages (CharmeWT), pCharme is required for the expression of genes involved in cardiomyocyte maturation. This activity is accompanied by the formation of nuclear condensates, through the interaction with the RNA-binding protein MATR3, which enrich transcripts involved in cardiac development. pCharme absence (CharmeKO) leads to the alteration of the transcriptional network of trabecular genes during development and to the remodeling of heart morphology.
Author response image 1
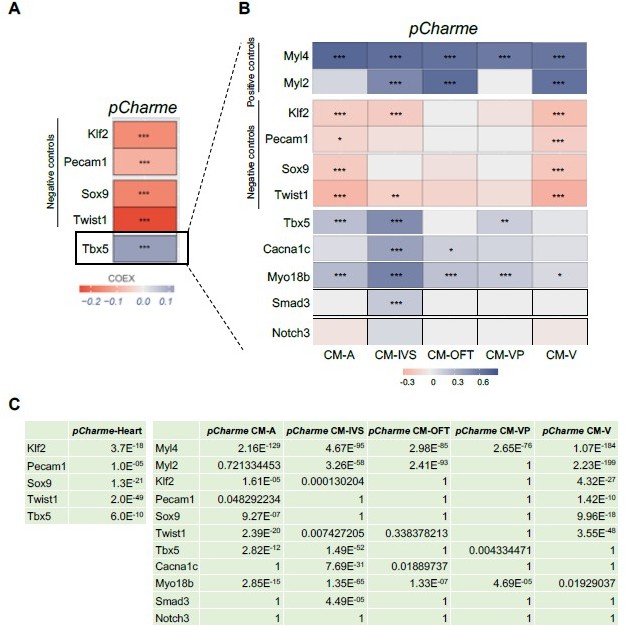
Correlation of Tbx5 and pCharme expression in cardiomyocytes.
(A) COTAN heatmap obtained using the whole scRNA-seq dataset showing Charme positive correlation with Tbx5, both expressed in cardiomyocytes, and its negative correlation with Klf2, Pecam1, Sox9 and Twist1, which are genes typically expressed in other cell populations. (B) COTAN heatmap for the contrasted subsetted data (see Materials and methods). The positive correlation between Tbx5 and Charme is particularly strong for CM-IVS, CM-A, and CM-P. In the other two cardiomyocyte clusters Tbx5 is very lowly expressed. (C) Adjusted p-values for the correlations plot in A (left) and B (right).
Author response image 2
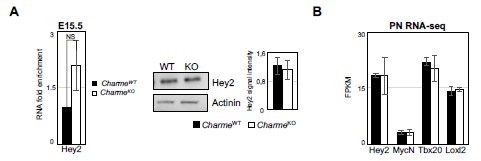
Expression analysis of compact layer marker genes.
(A) Left panel: RT-qPCR quantification of Hey2 RNA levels in E15. 5 CharmeWT vs CharmeKO cardiac extract. RT-qPCR data were normalized to GAPDH mRNA and represent means ± SEM of WT and KO (n=3) pools. Right panel: Representative image from western blot analysis and quantification for Hey2 in CharmeWT and CharmeKO E15.5.5 hearts extract. actinin was used as a loading control. Plot represent the quantification of Hey2 signal intensity relative to actinin. Data are mean ± SEM (n = 3). (B) Average expression from neonatal (PN) RNA-seq (FPKM) of compact tissue marker genes.
Author response image 3
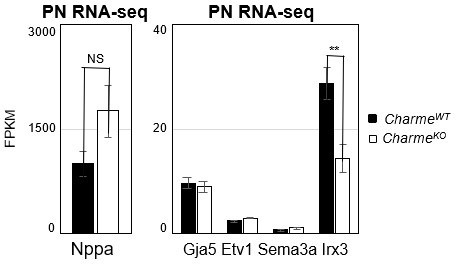
Expression analysis of cardiac trabeculae marker genes in neonatal hearts.
Average expression from neonatal (PN) RNA-seq (FPKM) in E15.5 CharmeWT vs CharmeKO cardiac extract of trabeculae marker genes.
Author response image 4
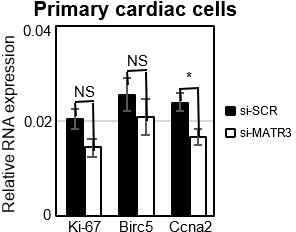
Expression analysis of proliferation marker genes in primary cardiac cells.
RT-qPCR quantification of cell cycle genes mRNA expression in primary cardiac cells treated with si-SCR or si-MATR3. Data were normalized to GAPDH mRNA and represent mean ± SEM of 4 independent experiments.
Author response image 5
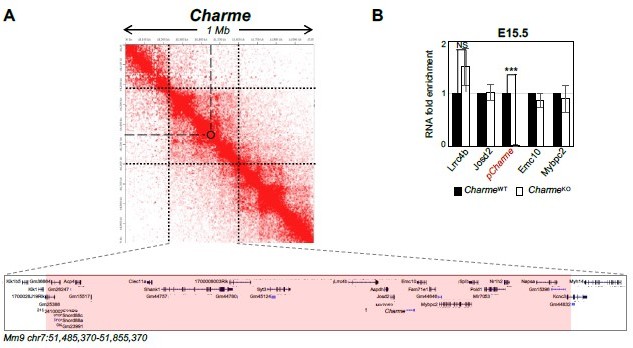
Expression analysis of Charme neighbouring genes.
(A) Contact map depicting Hi-C data of left ventricular mice heart retrived from GEO accession ID GSM2544836. Data related to 1 Mb region around Charme locus were visualized using Juicebox Web App (https://aidenlab.org/juicebox/). (B) RT-qPCR quantification of Charme and its neighbouring genes in CharmeWT vs CharmeKO E15.5.5 hearts. Data were normalized to GAPDH mRNA and represent means ± SEM of WT and KO (n=3) pools. Data information: *p < 0.05; **p < 0.01, ***p < 0.001 unpaired Student’s t test.
Author response image 6
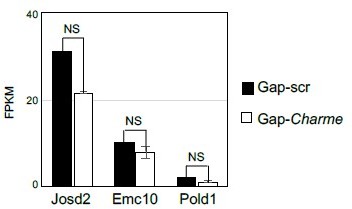
Quantification (FPKM) of Charme neighbouring genes expression from C2C12 RNA-seq data.
Average expression from RNA-seq (FPKM) quantification of Charme neighbouring genes in C2C12 differentiated myotubes treated with Gap-scr vs Gap-Charme. Values for Gap-Charme represent the average values of gene expression after treatment with two different gapmers (GAP-2 and GAP-2/3).
Author response image 7
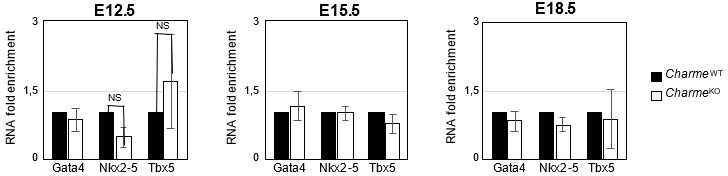
Expression analysis of Gata4, Nkx2-5 and Tbx5 transcripts at embryonal stages.
RT-qPCR quantification Gata4, Nkx2-5 and Tbx5 in CharmeWT and CharmeKO cardiac extract at E12.5, E15.5 and E18.5 days of embryonal development. Data were normalized to GAPDH mRNA and represent means ± SEM of WT and KO (n=3) pools.
Author response image 8
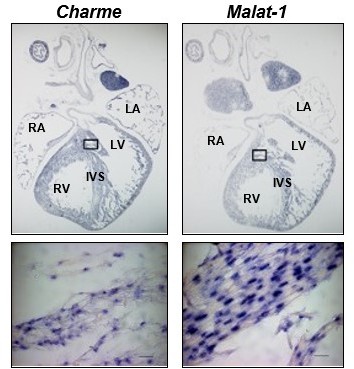
Charme and Malat-1 lncRNAs expression in neonatal hearts.
Charme (left) and Malat-1 (right) in situ hybridization performed on whole (PN) sections. Black squares outline the magnified areas. Magnification shows that the signal is restricted to the nucleus. Malat-1 staining is used as a nuclear control. Scale bars, 20 μm.
Additional files
-
Supplementary file 1
Charme Tss usage data collected from Zenbu genome browser.
- https://cdn.elifesciences.org/articles/81360/elife-81360-supp1-v2.xlsx
-
Supplementary file 2
RNA-seq in CharmeWT and CharmeKO neonatal hearts.
- https://cdn.elifesciences.org/articles/81360/elife-81360-supp2-v2.xls
-
Supplementary file 3
Echocardiography measurement for CharmeWT and CharmeKO animals.
- https://cdn.elifesciences.org/articles/81360/elife-81360-supp3-v2.xlsx
-
Supplementary file 4
MATR3 CLIP-seq in CharmeWT and CharmeKO fetal hearts.
- https://cdn.elifesciences.org/articles/81360/elife-81360-supp4-v2.xlsx
-
Supplementary file 5
List and sequences of the oligonucleotides, siRNAs, antibodies, and imaging probes used.
- https://cdn.elifesciences.org/articles/81360/elife-81360-supp5-v2.xlsx
-
MDAR checklist
- https://cdn.elifesciences.org/articles/81360/elife-81360-mdarchecklist1-v2.pdf
Download links
A two-part list of links to download the article, or parts of the article, in various formats.
Downloads (link to download the article as PDF)
Open citations (links to open the citations from this article in various online reference manager services)
Cite this article (links to download the citations from this article in formats compatible with various reference manager tools)
The long noncoding RNA Charme supervises cardiomyocyte maturation by controlling cell differentiation programs in the developing heart
eLife 12:e81360.
https://doi.org/10.7554/eLife.81360


