Antibodies to repeat-containing antigens in Plasmodium falciparum are exposure-dependent and short-lived in children in natural malaria infections
- University of California, San Francisco, United States
- Chan Zuckerberg Initiative, United States
- University of California, Berkeley, United States
- Infectious Diseases Research Collaboration, Uganda
- London School of Hygiene and Tropical Medicine, United Kingdom
- Chan Zuckerberg Biohub, United States
Figures
Figure 1 with 1 supplement
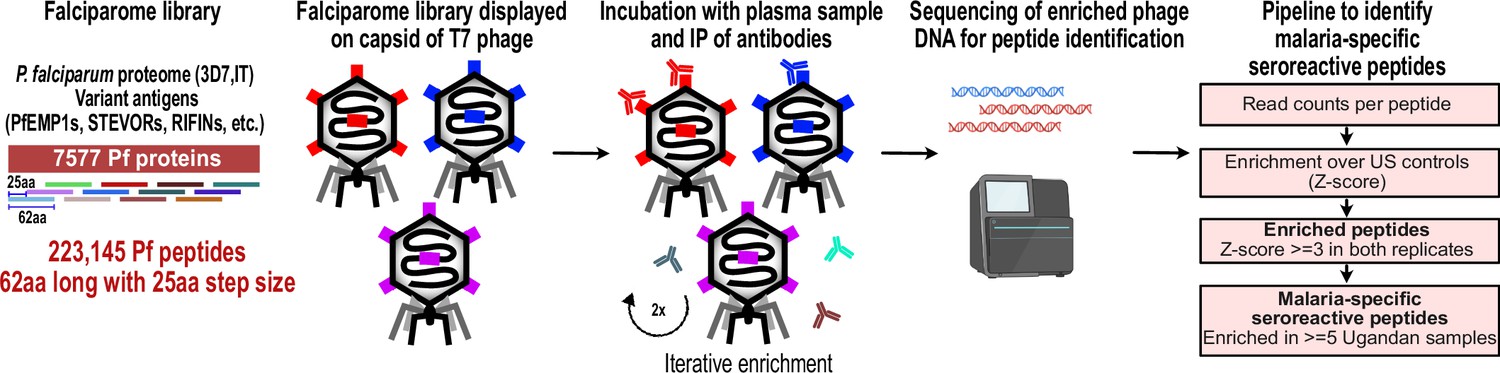
PhIP-seq overview and analysis pipeline.
Falciparome phage library displays the proteome of Plasmodium falciparum in 62-aa peptides with 25-aa step size on T7 phage and also includes variant sequences of many antigens, including major Variant Surface Antigens (VSA). PhIP-seq was performed with incubation of Falciparome library with human plasma, followed by IP of antibodies in the sample and enrichment of antibody binding phage. Two rounds of enrichment were performed and enriched phage were sequenced to obtain the identity of the encoded peptides. A filtering pipeline was then used to identify seroreactive peptides specific to the malaria cohort.
Figure 1—figure supplement 1
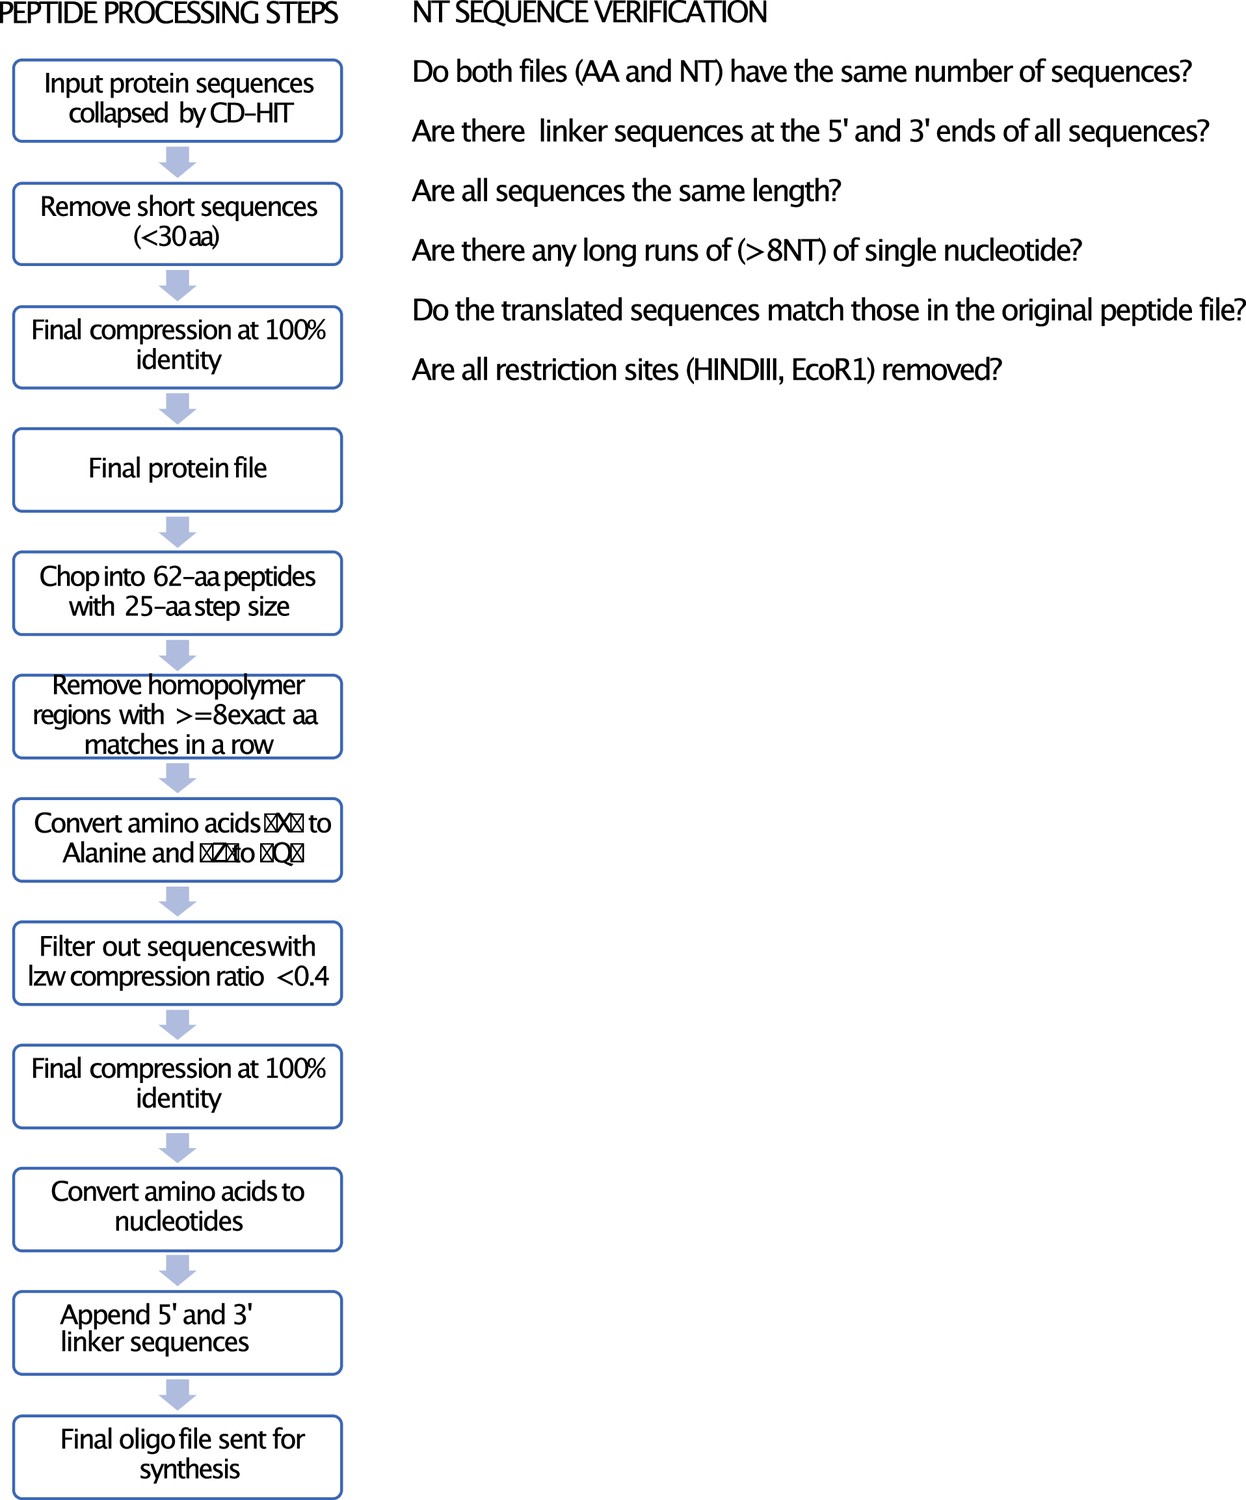
Pipeline for library construction.
Input sequences of different groups were filtered with CD-HIT to remove similar sequences with more than the indicated % identity in Table 2. The filtered sequences were then processed into peptides using the peptide processing pipeline and quality checks were performed as described in NT sequence verification.
Figure 2 with 6 supplements
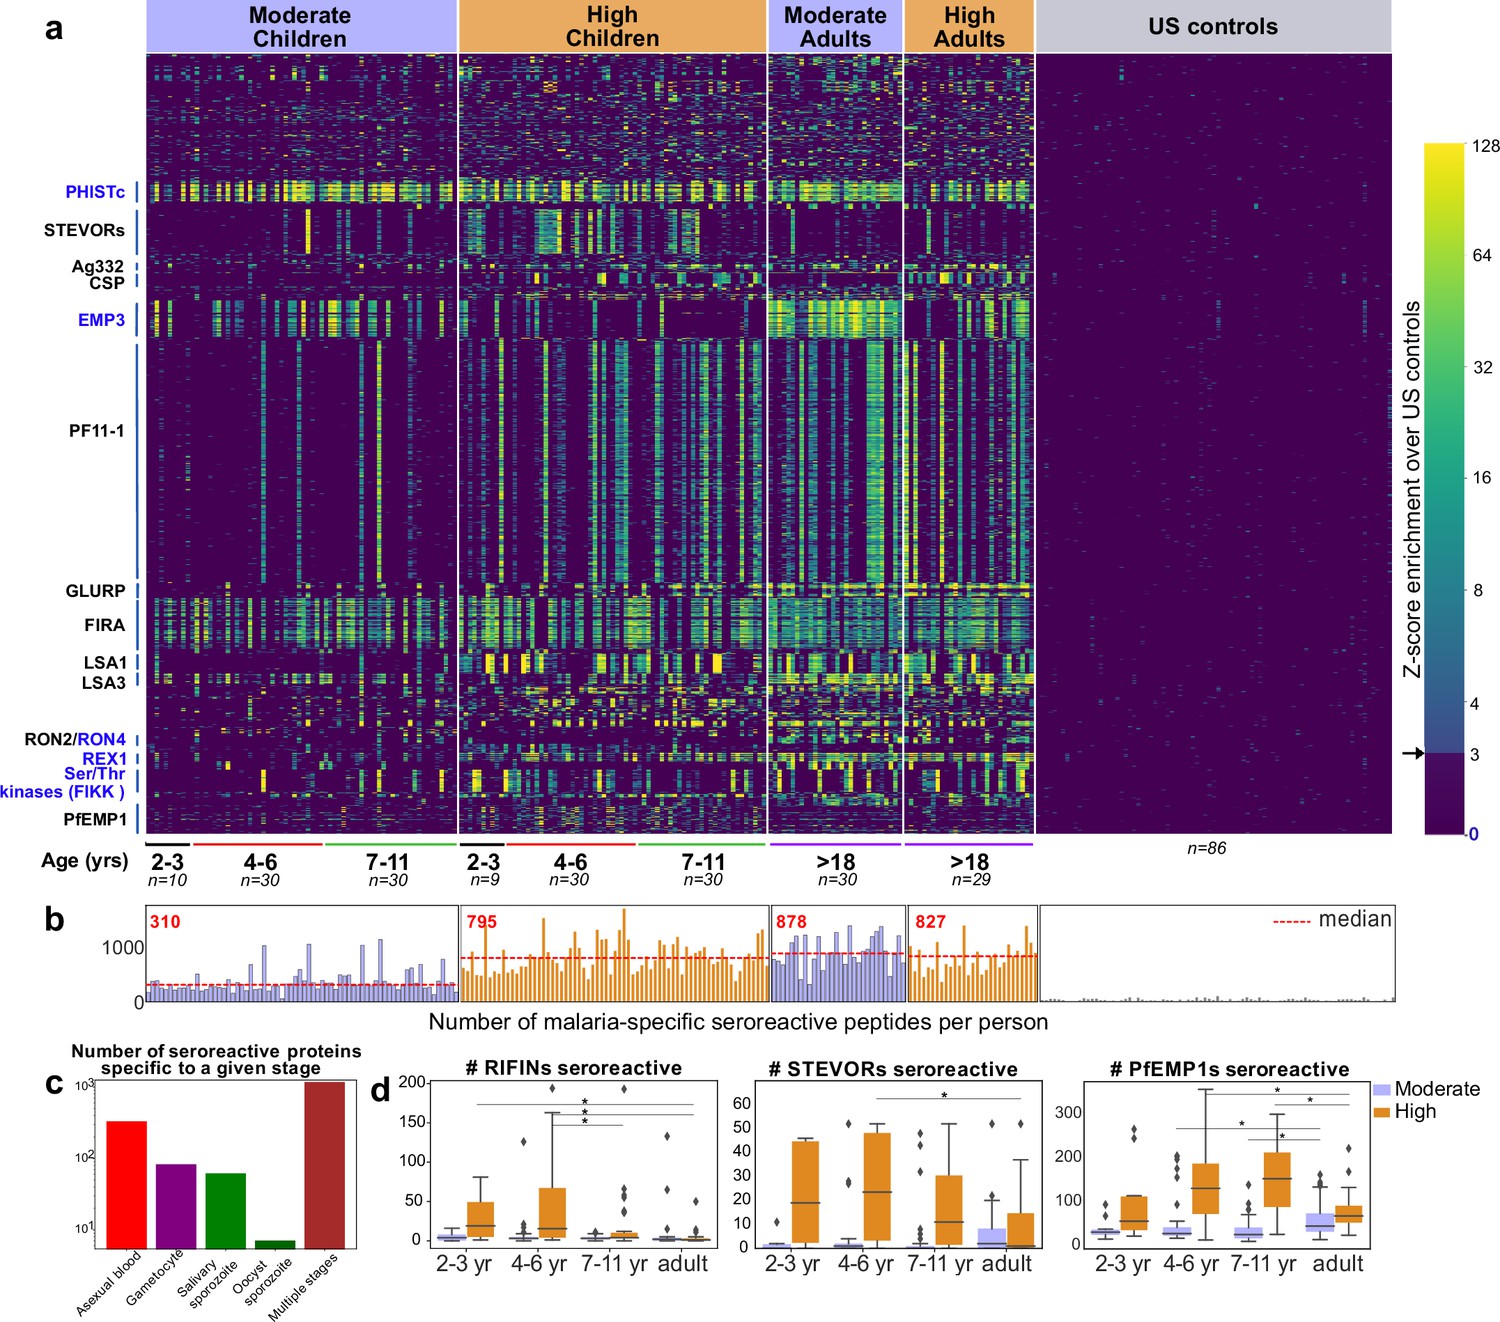
PhIP-seq with Falciparome captures known, novel antigens and relationships between age, exposure and breadth of seroreactive regions.
(a) Heatmap of Z-score enrichment over US controls for seroreactive peptides (rows) with >10% seropositivity across different age groups in the moderate and high exposure cohorts. Peptides are sorted by protein name and samples(columns) are ordered by increasing age in each group. Examples of well-characterized (black labels) as well as under-characterized/novel (blue labels) antigens in Plasmodium falciparum identified with this approach are indicated. (b) Breadth of antibody reactivity, shown as number of seroreactive peptides in each person. Dotted red line and red text indicate median breadth for each population group. Children from the moderate transmission setting had significantly lower breadth than children from the high transmission setting as well as all adults (KS test p-value <0.05). (c) Number of proteins identified as seroreactive in this study that are specific to different stages. Stage classification is based on proteomic datasets in PlasmoDB (spectral count ≥ 1 for at least 1 peptide in a protein in a given stage is counted as expression) and shows enrichment of proteins from all life stages of Plasmodium falciparum in the human host. (d) Breadth of VSA reactivity, shown as number of variant proteins of RIFINs, STEVORs, and PfEMP1s seroreactive per person. In the moderate transmission setting, children had a significantly lower breadth than adults for PfEMP1 and both age groups poorly recognized RIFINs and STEVORs. In contrast, in the high transmission setting, children had a significantly (* KS test <0.05) higher breadth than adults for all three families.
-
Figure 2—source data 1
GO analysis of top seroreactive proteins.
- https://cdn.elifesciences.org/articles/81401/elife-81401-fig2-data1-v2.xlsx
Figure 2—figure supplement 1
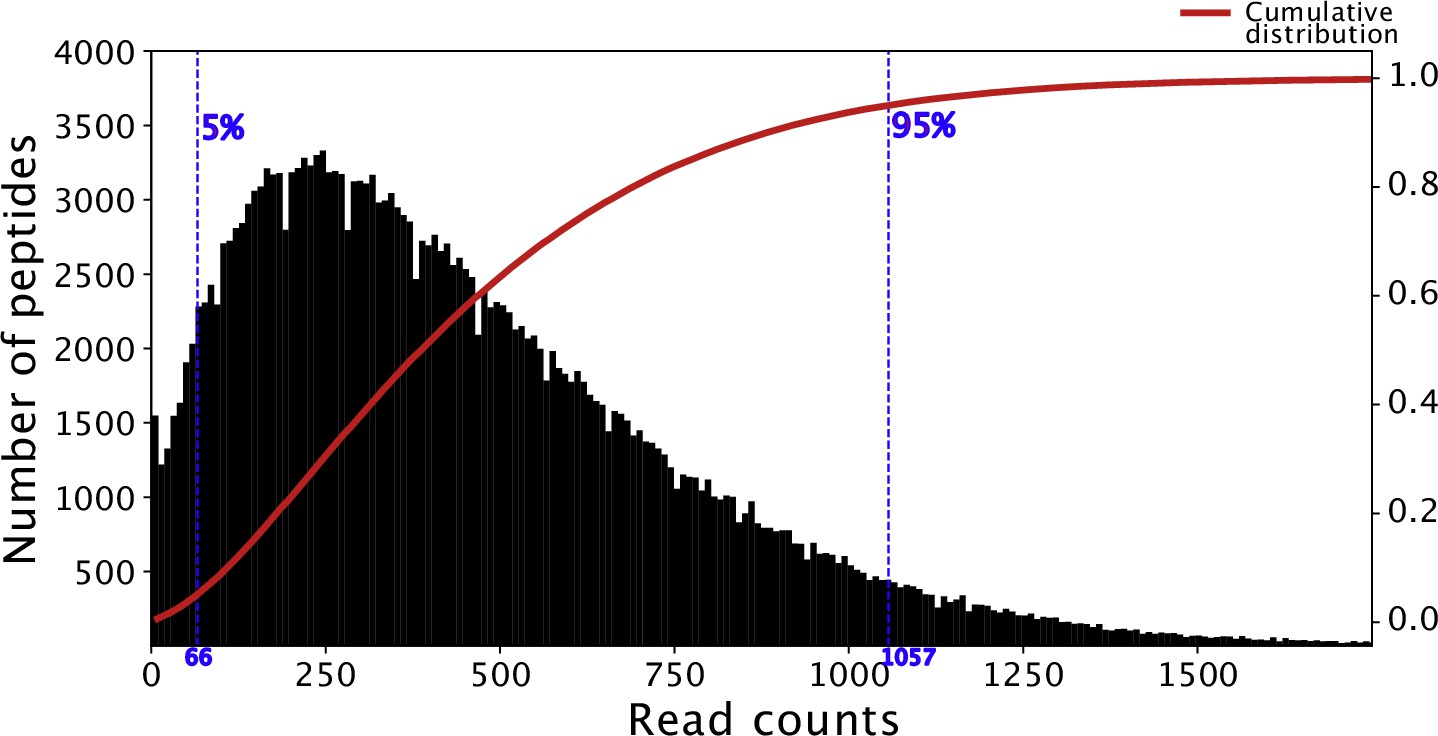
Histogram of read counts of Falciparome phage library.
Read counts corresponding to the 5th and 95th percentile in the distribution (indicated in blue) are within a 16-fold difference. Cumulative density plot of the distribution is shown in red.
Figure 2—figure supplement 2
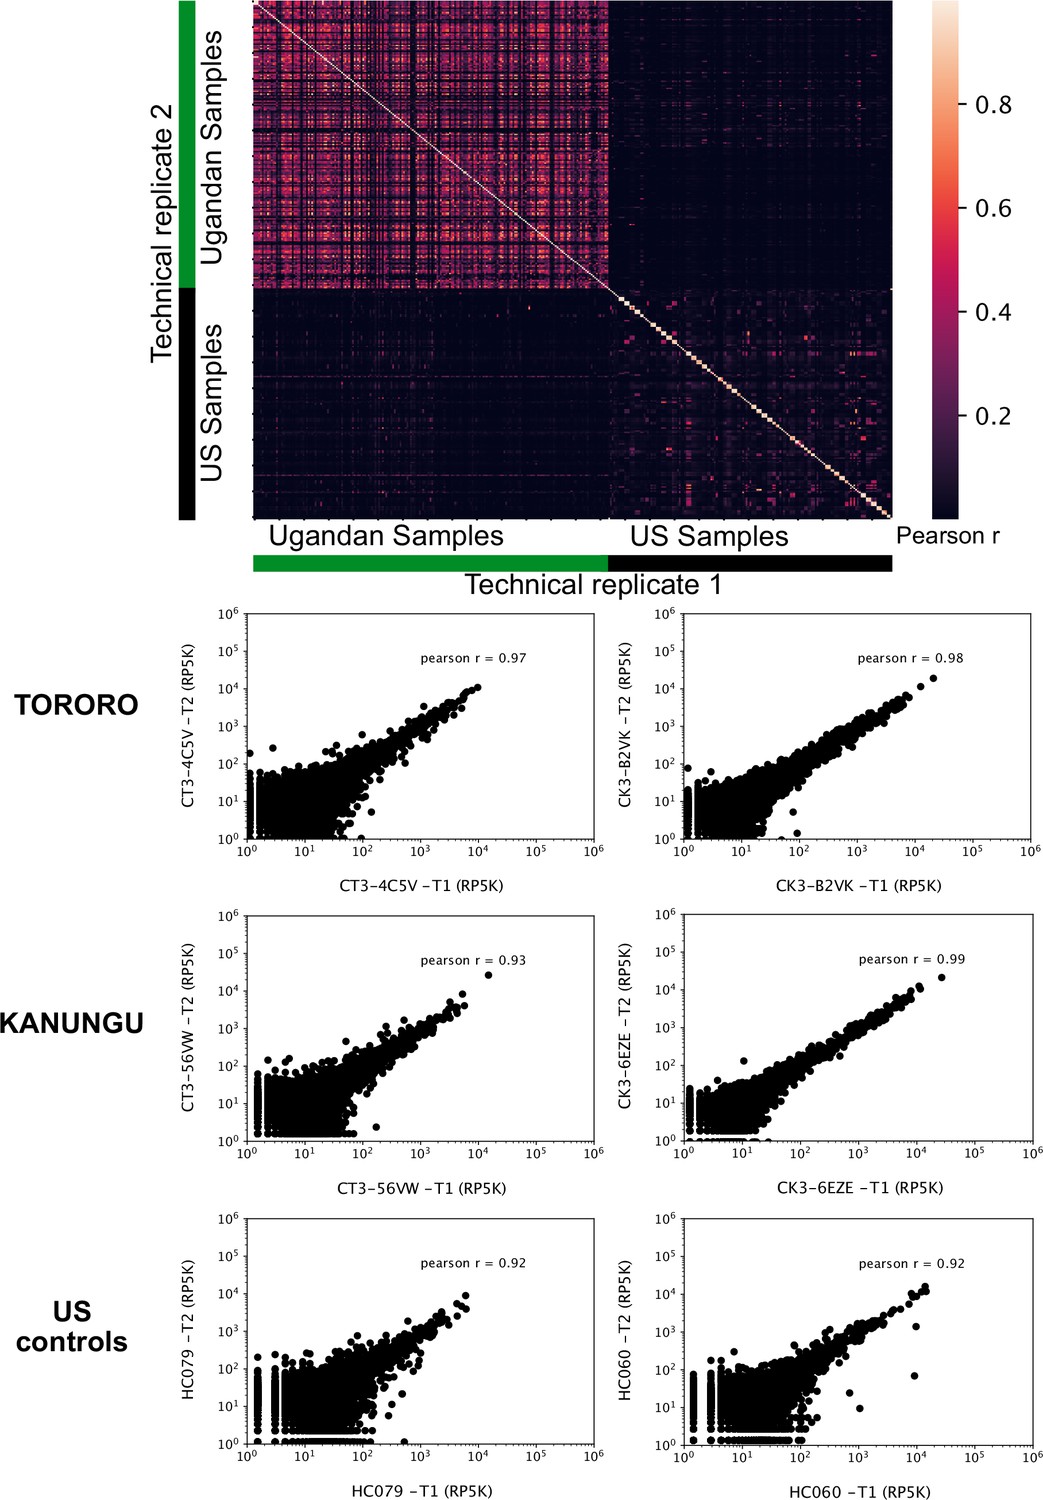
Technical replicates are well correlated.
Top - Pearson correlation matrix of depth-adjusted read counts across all samples. Technical replicates are placed symmetrically on rows and columns. Bottom three - Representative scatter plots of reads per 500,000 (RP5K) of technical replicates of samples from Tororo, Kanungu and US.
Figure 2—figure supplement 3
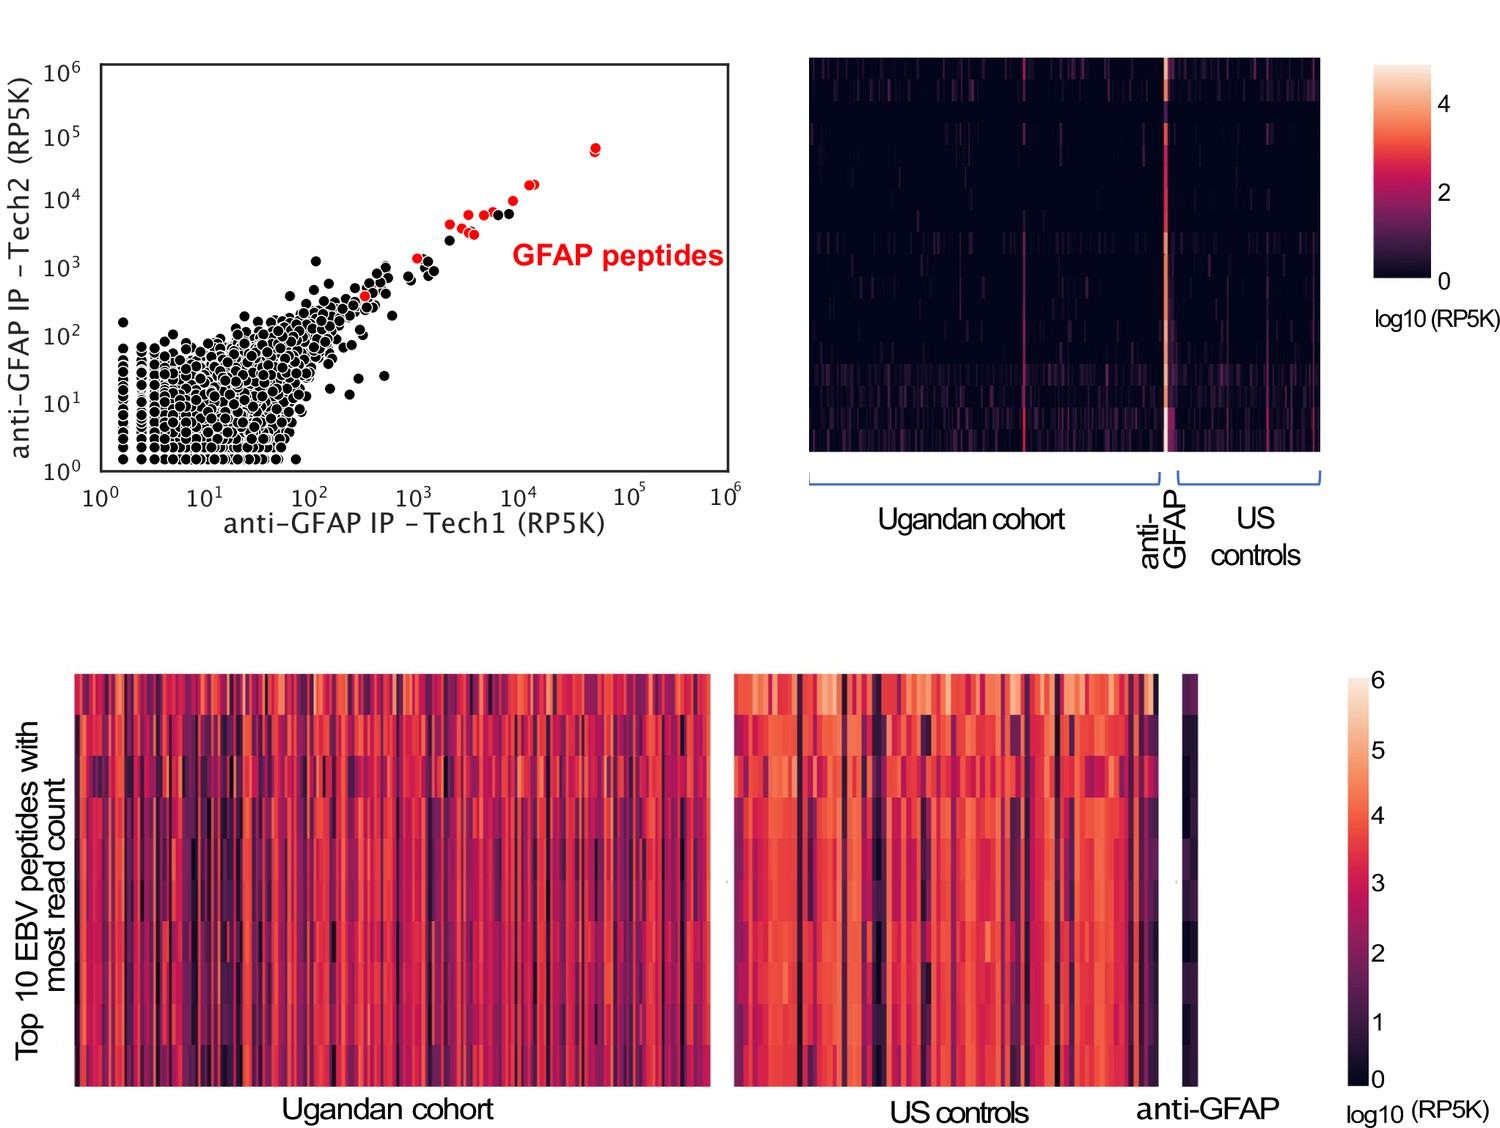
Target peptides are enriched in a sample-specific manner.
Top panel - PhIP-seq with polyclonal anti-GFAP enriches for GFAP peptides and enrichment is specific to IP with anti-GFAP, but is observed rarely in the Ugandan cohort and US controls. Left - Scatter plot of Reads Per 500,000 (RP5K) of technical replicates of an IP with anti-GFAP. GFAP peptides are in red. Right – Heat map of RP5K of GFAP peptides (rows) in different samples (columns). Bottom panel - Heat map of RP5K of top 10 Epstein-Barr virus (EBV) peptides (rows) with highest read counts in human samples. Enrichment is observed across Ugandan and US samples, but not in the IP with anti-GFAP.
Figure 2—figure supplement 4
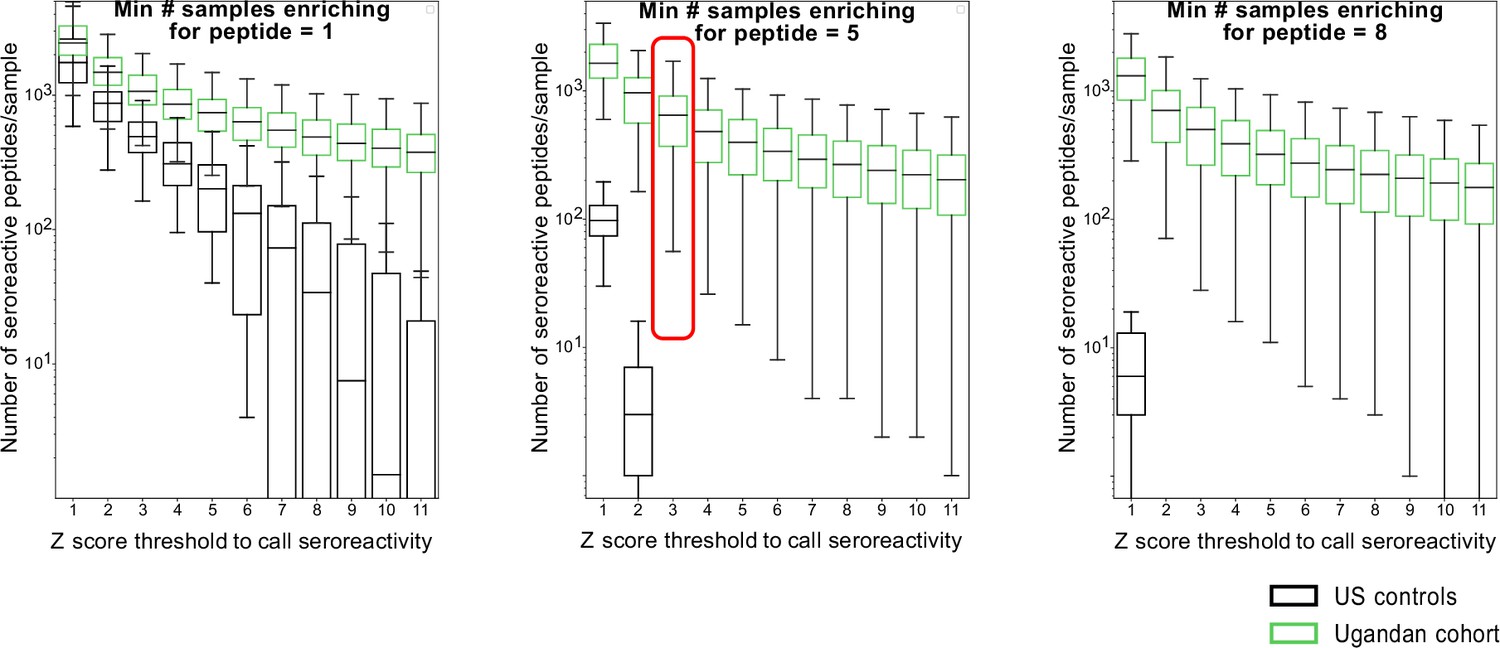
Moving threshold analysis to determine optimal thresholds for calling peptides as seroreactive based on minimum Z-score and enrichment in a minimum number of samples in a group.
Box plots of resultant number of seroreactive peptides for corresponding thresholds are shown for Ugandan samples and US controls. The final thresholds for calling seroreactivity were selected based on minimizing the number of peptides identified as seroreactive in the US controls and is indicated by the red box.
Figure 2—figure supplement 5
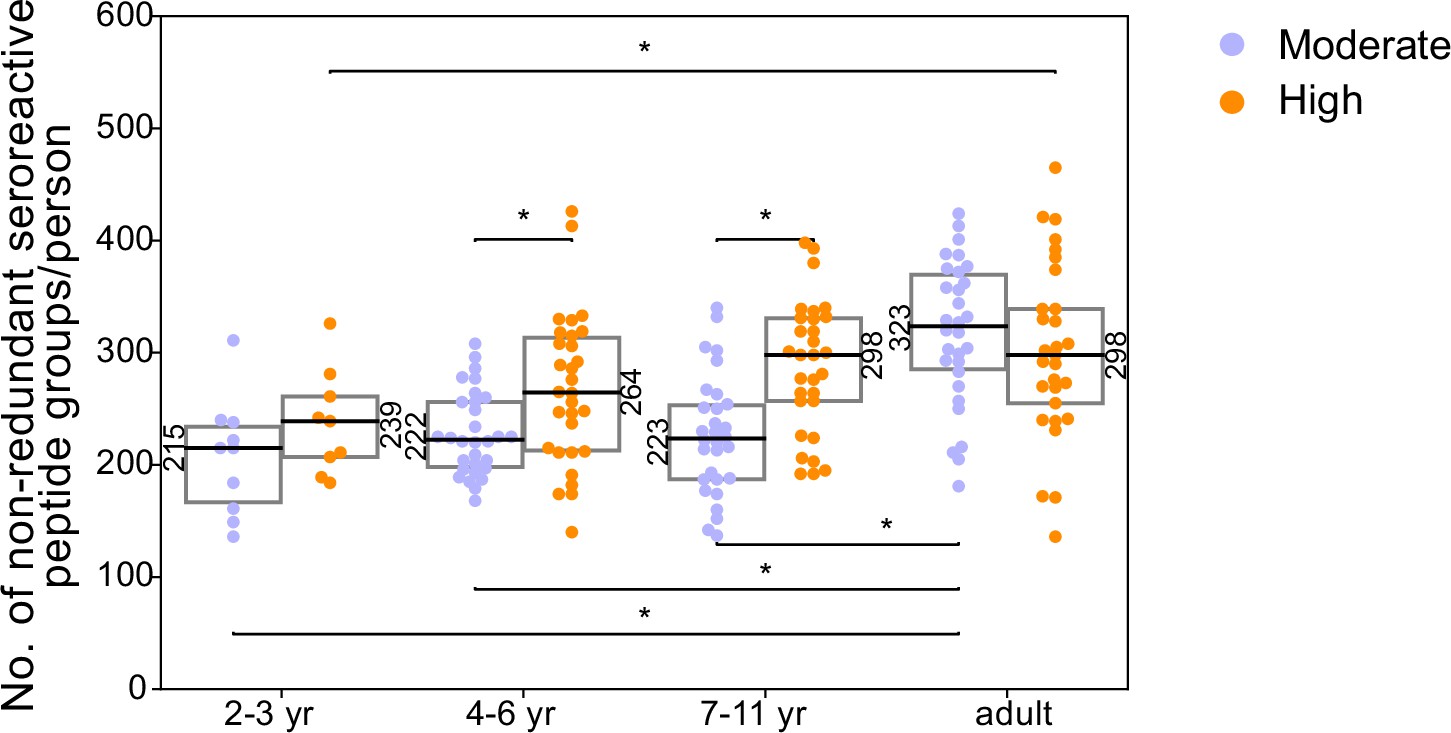
Breadth of non-redundant seroreactive peptide groups per person across age and exposure.
All seroreactive peptides in each person were collapsed based on sequence similarity (sharing of 7mer identical motifs). The resulting number of non-redundant groups was used as a measure of conservative non-shared breadth. Children from the moderate transmission setting had a significantly lower breadth than children from the high transmission setting and all adults.* indicates p-value <0.05 by KS-test. Median for each group is labeled on the side of the box.
Figure 2—figure supplement 6
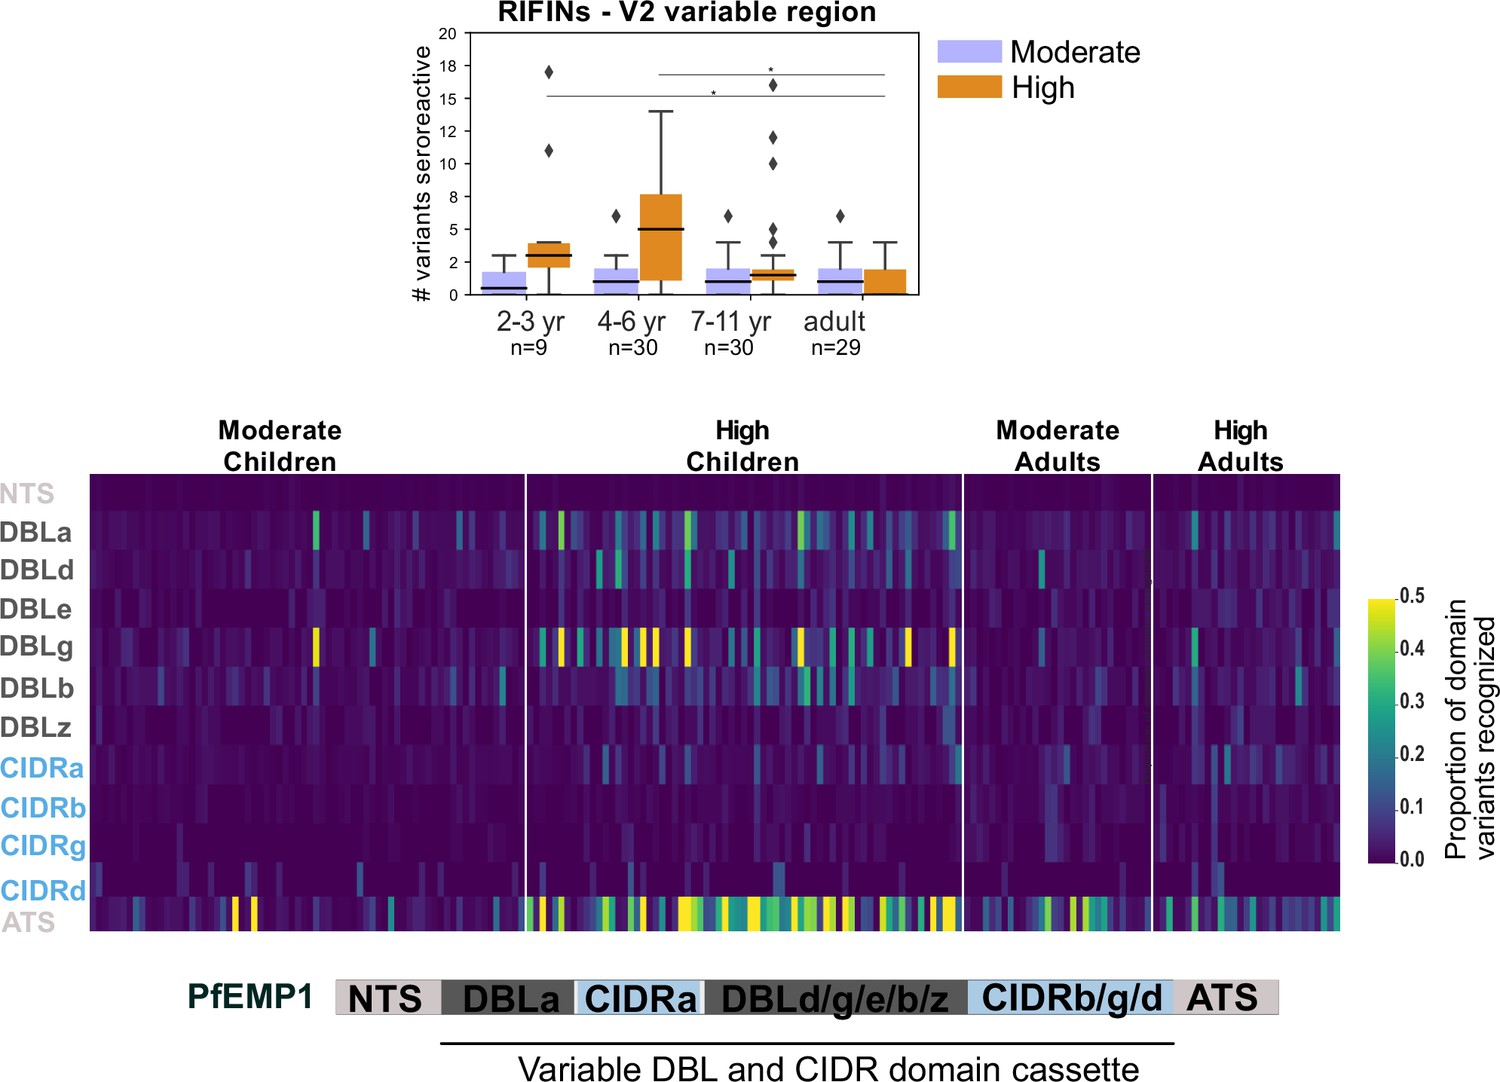
Breadth of seroreactivity in the variable regions of RIFIN and PfEMP1.
Top - Box plot of number of domain variants seroreactive in the variable region V2 of RIFINs. Significantly different groups (KS test <0.05) are marked with an *. Bottom - Heatmap of proportion of variants from the library that are seroreactive in a given person for each PfEMP1 domain. Each column is a person. Schematic of domain structure of PfEMP1 is shown below the heatmap.
Figure 3 with 1 supplement
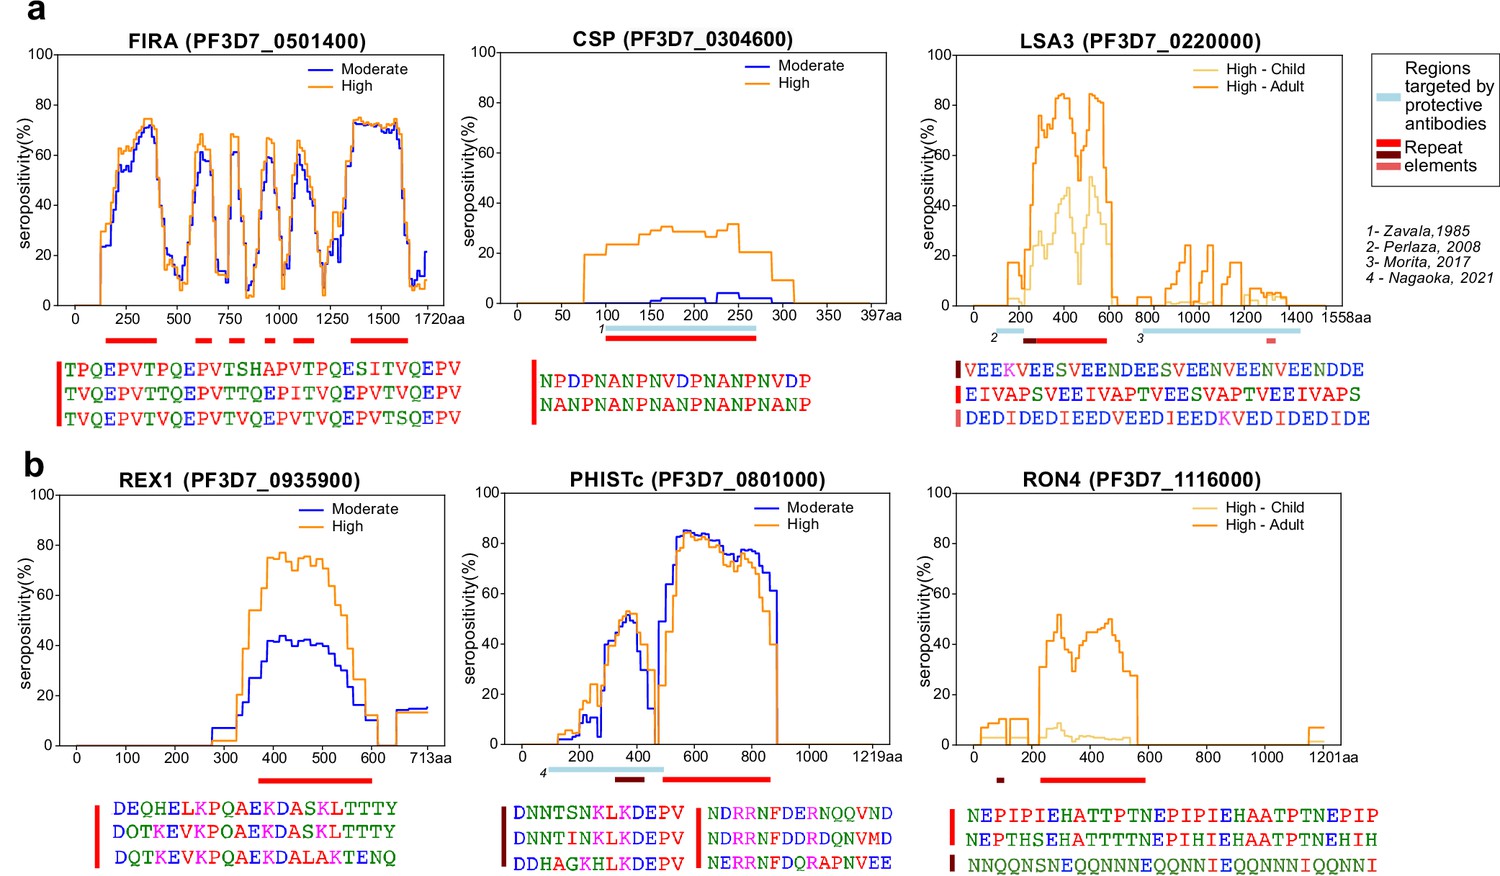
Tiled design of library facilitates high resolution characterization of seroreactive regions.
(a) Examples of previously well-characterized antigens and (b) novel/previously under-characterized antigens identified in this dataset. Average percentage of people seropositive at each residue (seropositivity) based on signal from peptides spanning it are shown for each protein for different groups in the cohort. The magnitude of exposure- and age-related differences in seropositivity varies by individual protein and even within different regions of specific proteins. Reddish bars underneath each protein represent repeat elements and blue bars represent examples of regions encompassing targets of protective antibodies described in previous studies. Snapshots of sequences of repeat elements present in a protein are represented beneath the protein.
Figure 3—figure supplement 1

Comparison of high-resolution localization of seroreactive regions identified in this study with regions identified through a peptide-array approach.
Location of seroreactive peptides identified in this dataset (red bar) and seroreactive 15-mer peptides identified using a high-density peptide array (black bar) in Jaenisch et.al. (peptides with p-value <0.05 in (-) samples [malaria low parasitemia samples from Burkina Faso] over C [control - European samples]) for 12 vaccine candidates in that study. Average seropositivity per residue observed for moderate and high transmission samples in our study is also plotted.
Figure 4 with 1 supplement
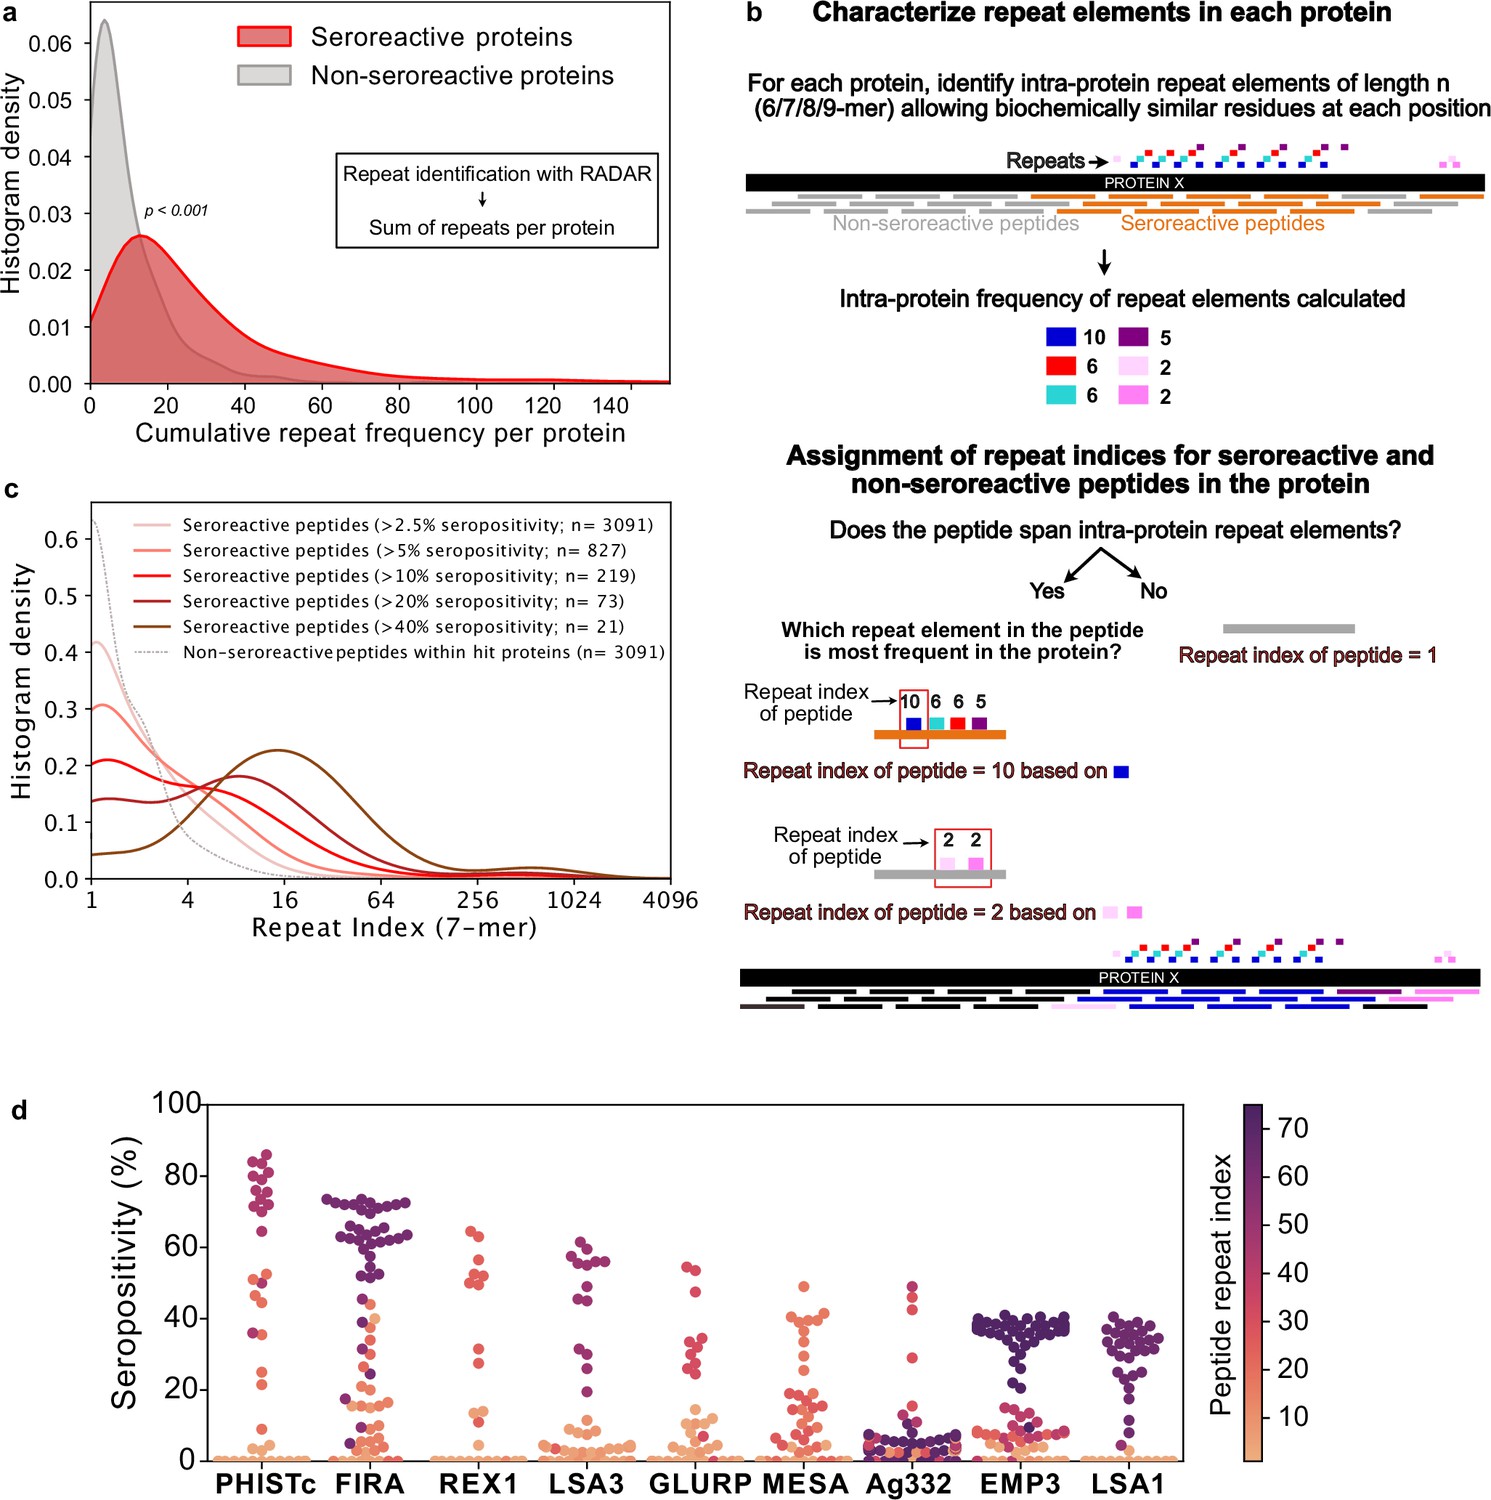
Repeat elements are more enriched in seroreactive peptides within seroreactive proteins than non-seroreactive peptides.
(a) Distribution of cumulative frequency of repeat elements per protein is significantly higher (KS test p-value <0.05) in the seroreactive protein set than a randomly sampled subset of non-seroreactive proteins (1000 iterations). (b) Pipeline to compute the representation of repeats in each peptide as repeat index. (c) Distribution of repeat indices is significantly higher (KS test p-value <0.05) in seroreactive peptides than a randomly sampled subset of non-seroreactive peptides within seroreactive proteins (1000 iterations). Distribution of repeat indices also significantly increases with increase in seropositivity (KS test p-value <0.05 between all successive distributions). (d) Seropositivity of all peptides (dots) colored by their repeat indices in the top 9 most seropositive repeat-containing proteins shows enrichment of repeat elements in peptides with high seropositivity.
Figure 4—figure supplement 1
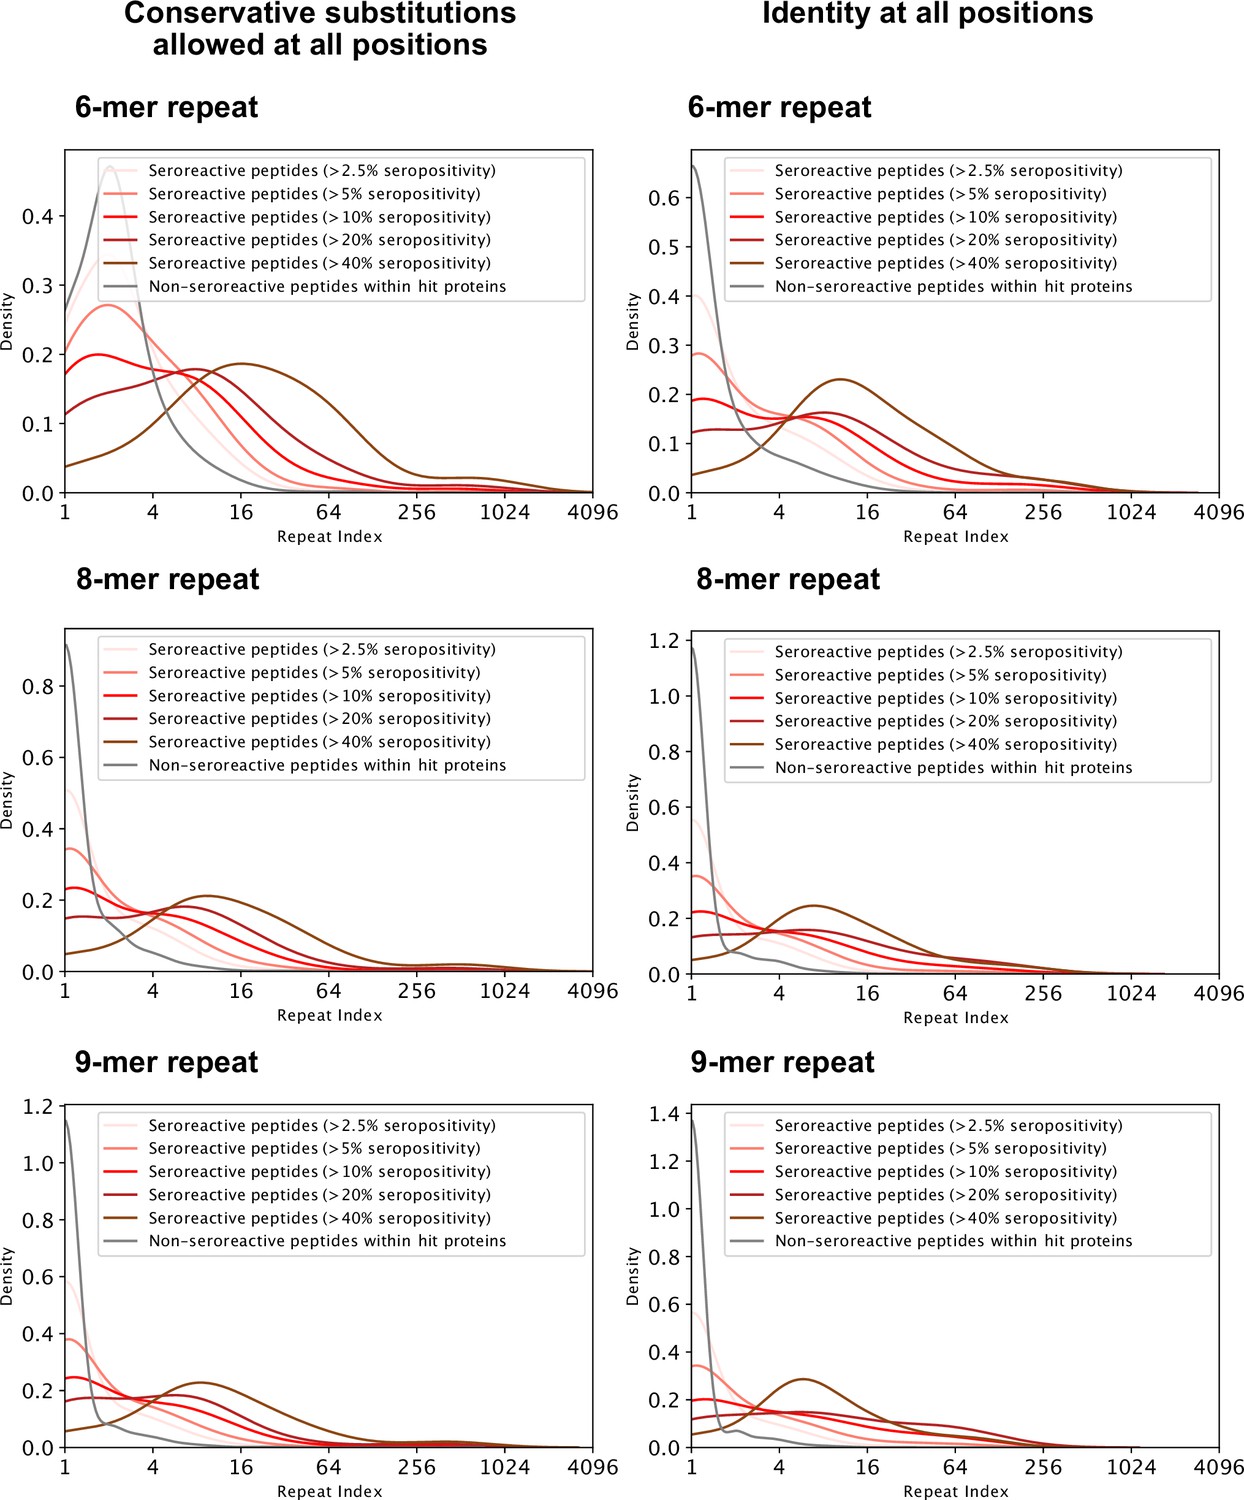
Distribution of repeat indices of seroreactive and non-seroreactive peptides within hit proteins for different lengths and degeneracy of the repeating motif.
Left three: Conservative substitutions ([GA],[ST],[DE],[NQ],[RHK],[LVI],[YFW]) are allowed at all positions in the motif. Right three: Identical residues at all positions in the motif. For all six methods of defining repeats, all seroreactive regions were significantly different from the non-seroreactive set (p = <0.01 based on 1000 random samplings of non-seroreactive set).
Figure 5 with 4 supplements
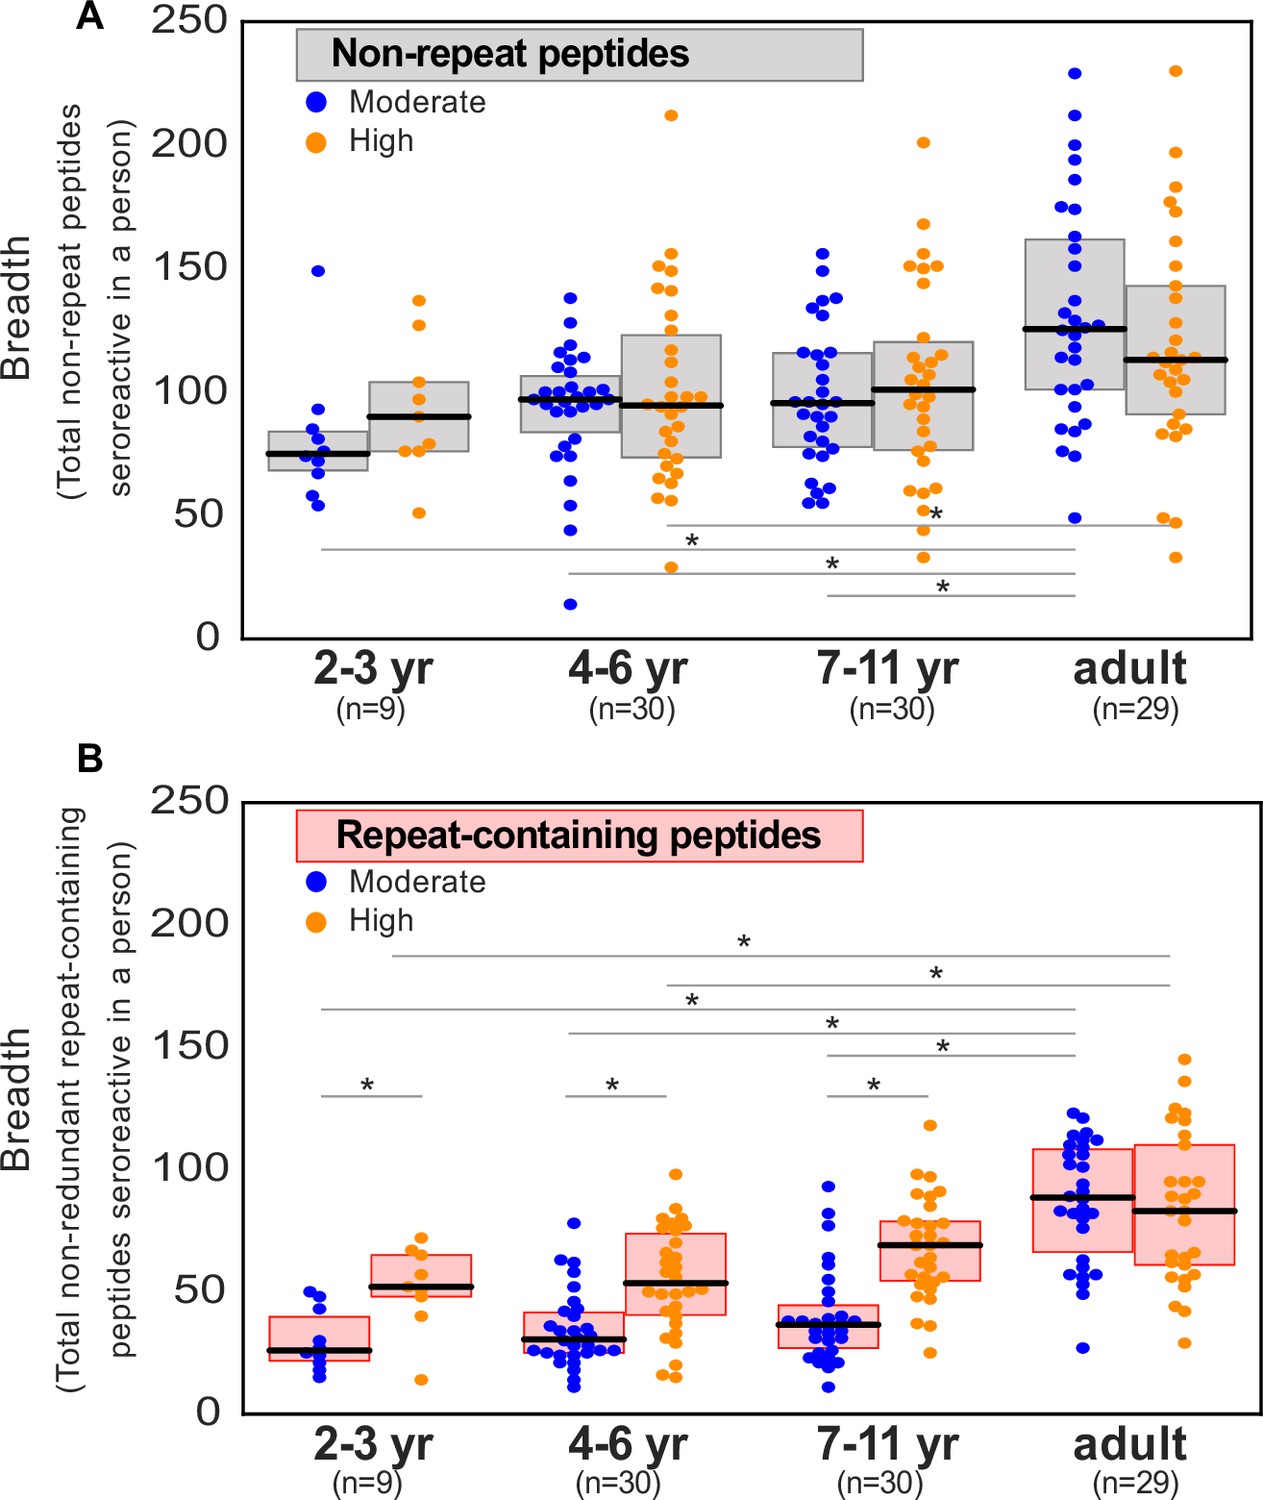
Breadth of seroreactive repeat-containing peptides, but not non-repeat peptides, increases with exposure in children.
(a) Breadth of seroreactive non-repeat peptides per person is not significantly different (KS-test p-value >0.05) between the two exposure settings within each age group. (b) Breadth of seroreactive repeat-containing peptides per person is significantly higher (KS-test p-value <0.05) in the high exposure setting than in the moderate exposure setting within the three groups in children, but not adults.
Figure 5—figure supplement 1
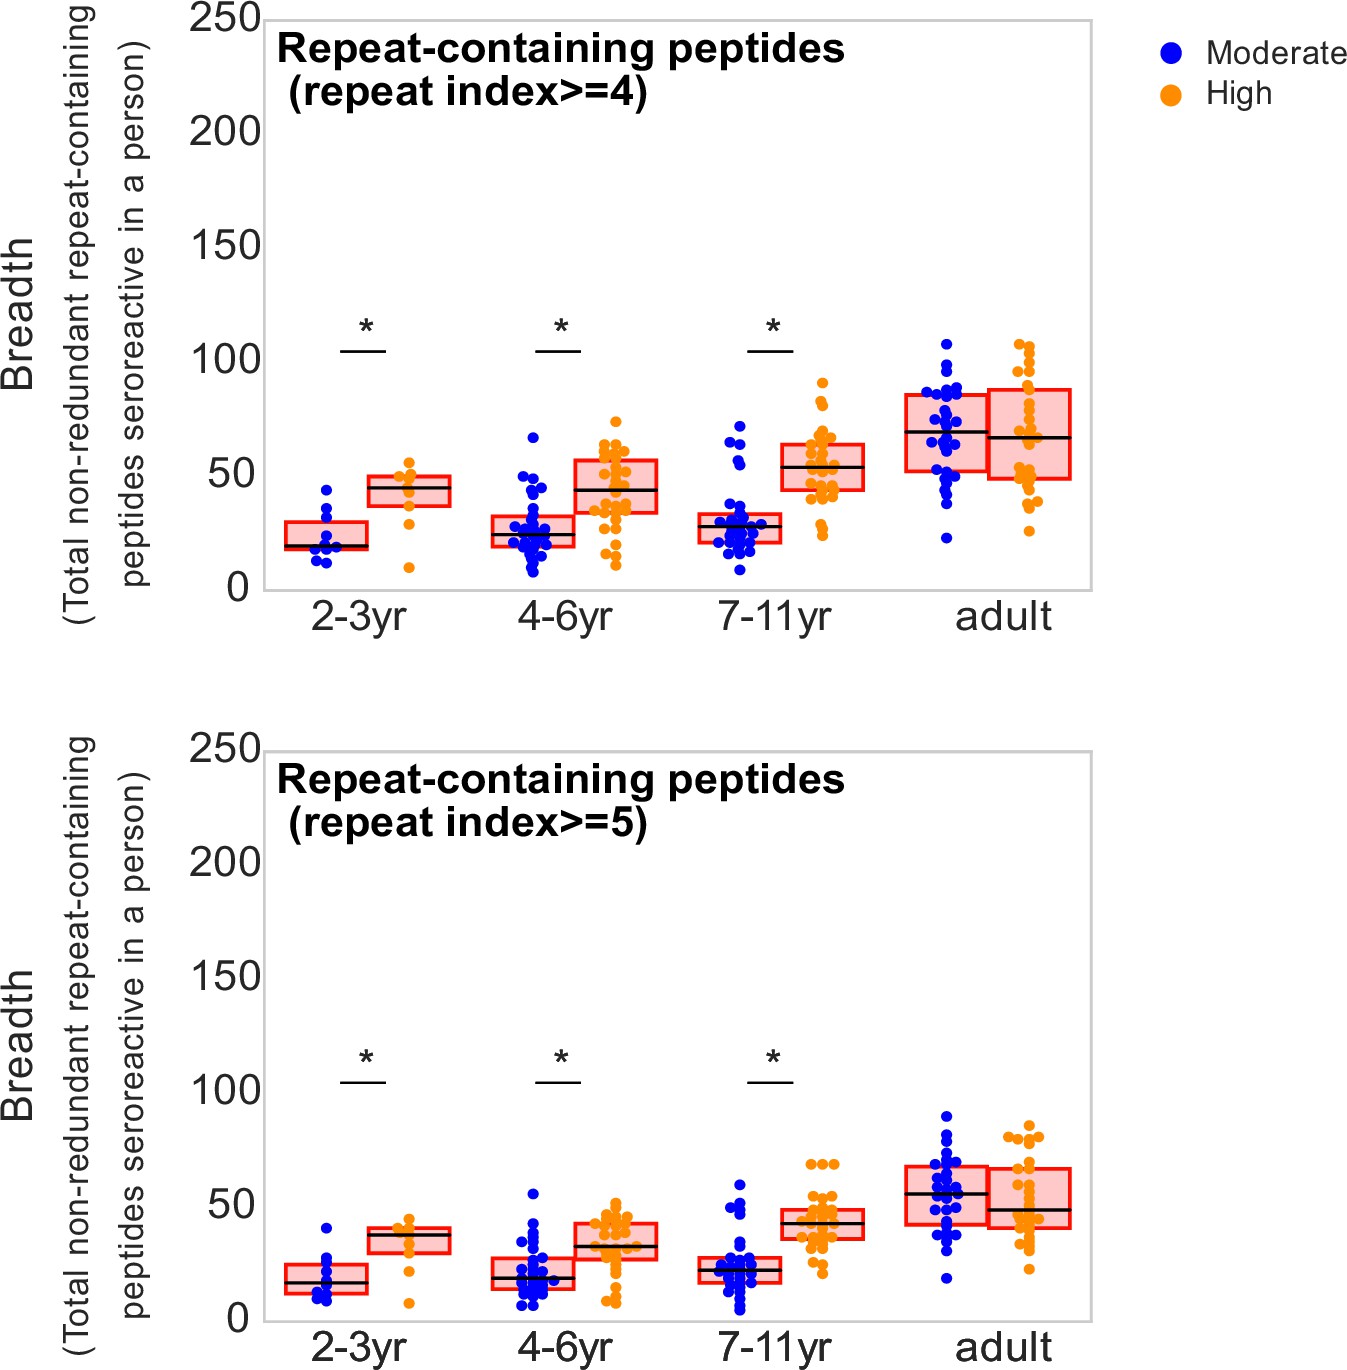
Breadth of repeat-containing peptides per person using different repeat index thresholds for categorizing repeat-containing peptides.
Age groups showing significant difference between the two transmission settings are marked by * based on a KS-test p-value <0.05.
Figure 5—figure supplement 2
Seropositivity of individual seroreactive repeat elements increases with exposure in children, but not adults.
Each dot represents a seroreactive repeat element and seropositivity for the repeat element in a given group was calculated as the percent of people in that group enriching for any seroreactive peptide with that repeat element.
Figure 5—figure supplement 3
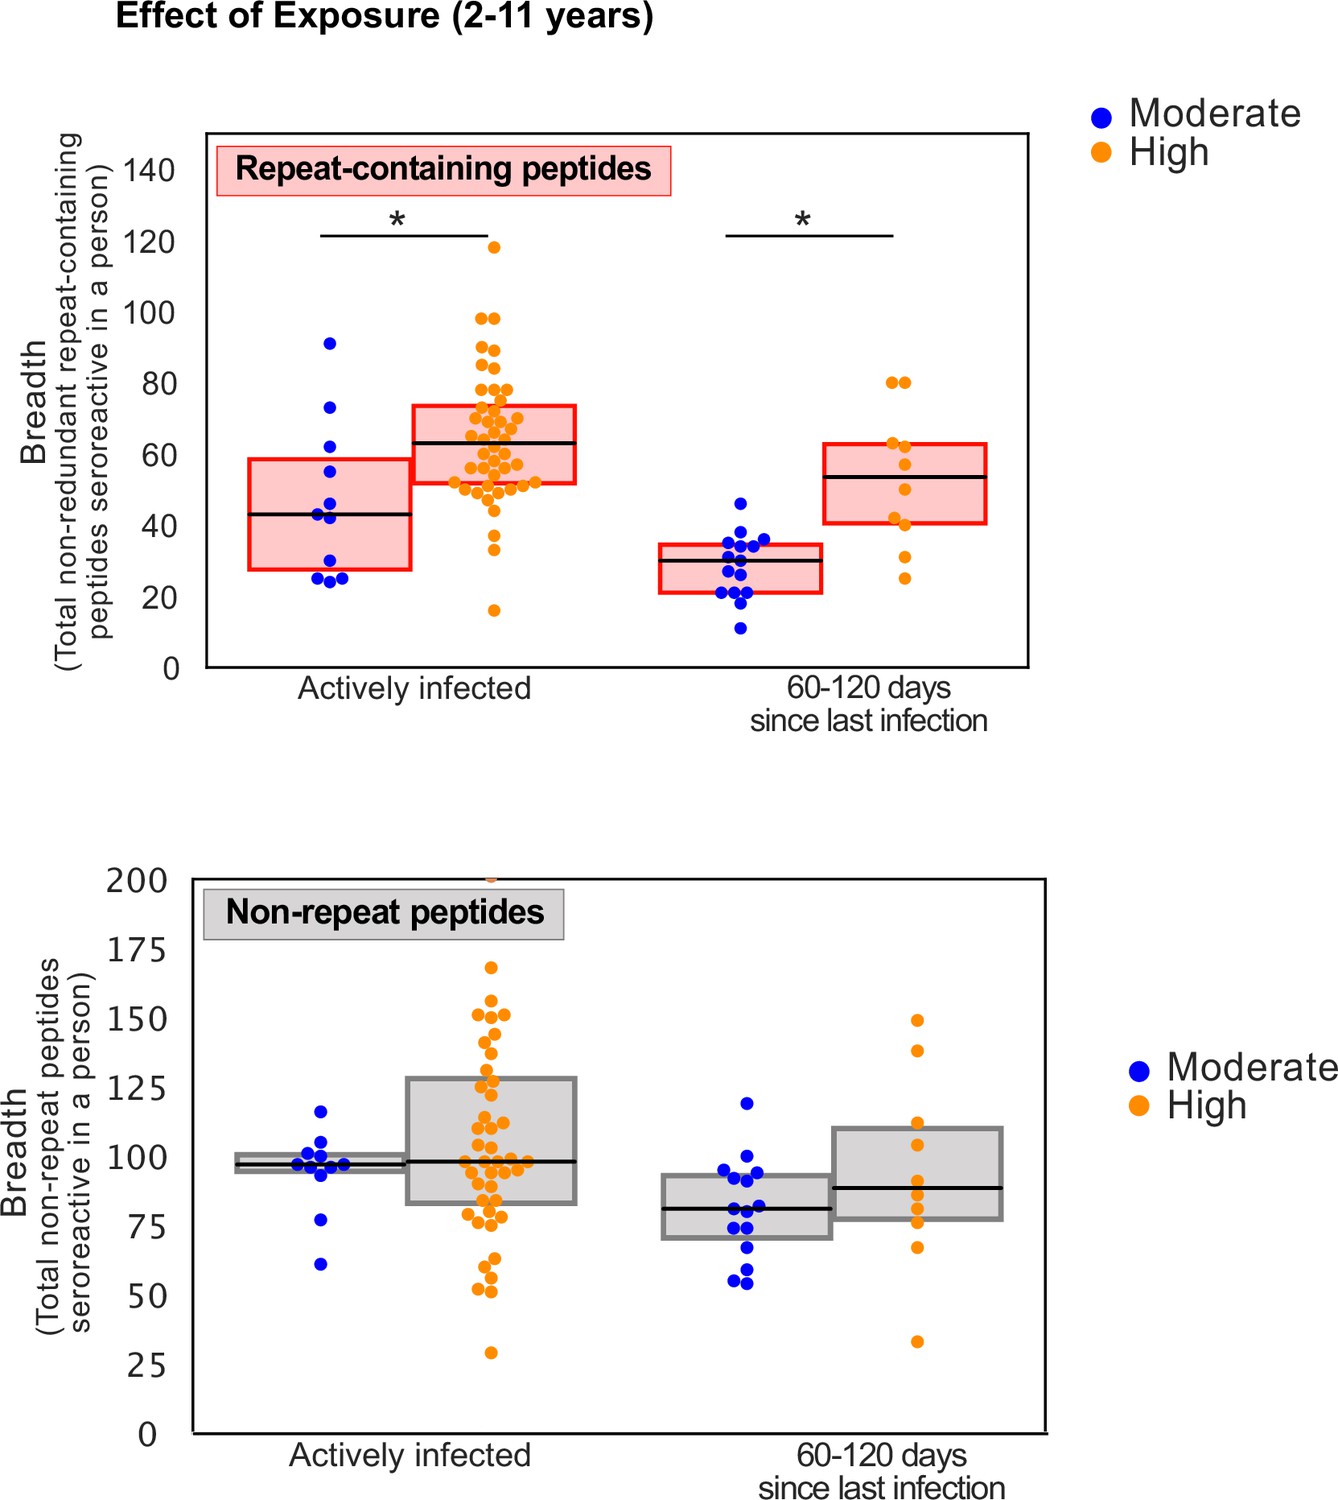
Controlling for time since infection status, breadth of seroreactive repeat-containing peptides, but not non-repeat peptides, still shows an increase with exposure in children.
Groups showing significant difference between the two transmission settings are marked by * based on a KS-test p-value <0.05.
Figure 5—figure supplement 4
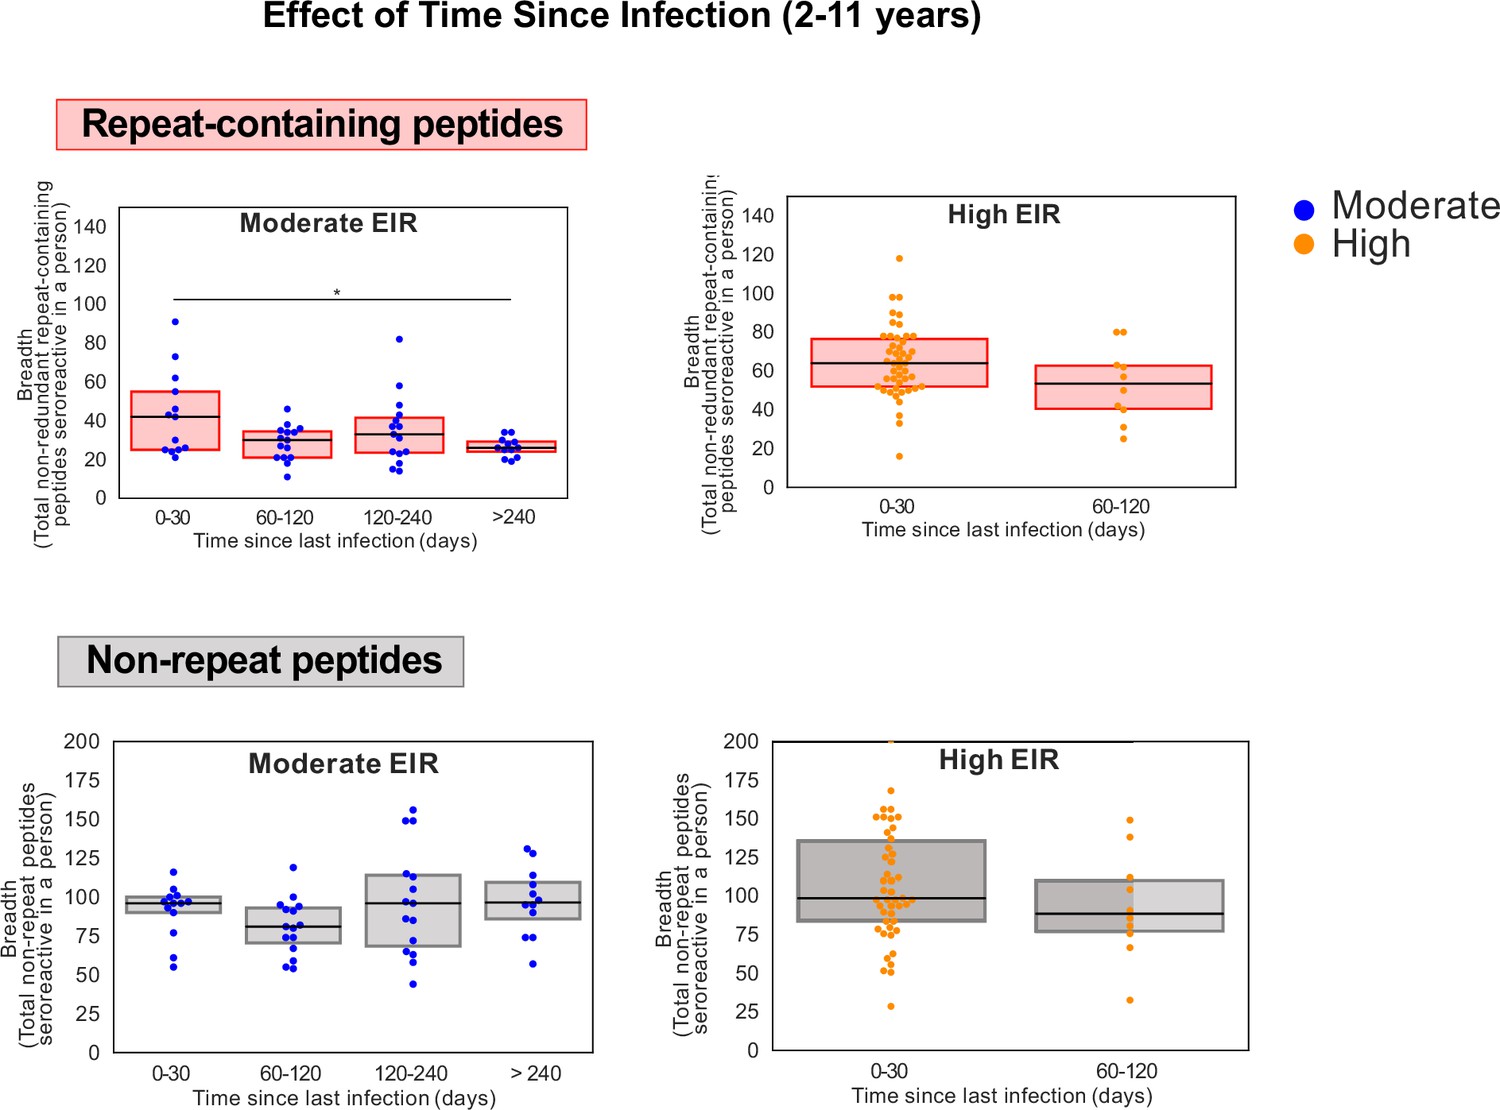
Breadth of seroreactive repeat-containing peptides, but not non-repeat peptides, wanes with increased time since infection in the moderate exposure setting in children.
Groups showing significant differences are marked by * based on a KS-test p-value <0.05.
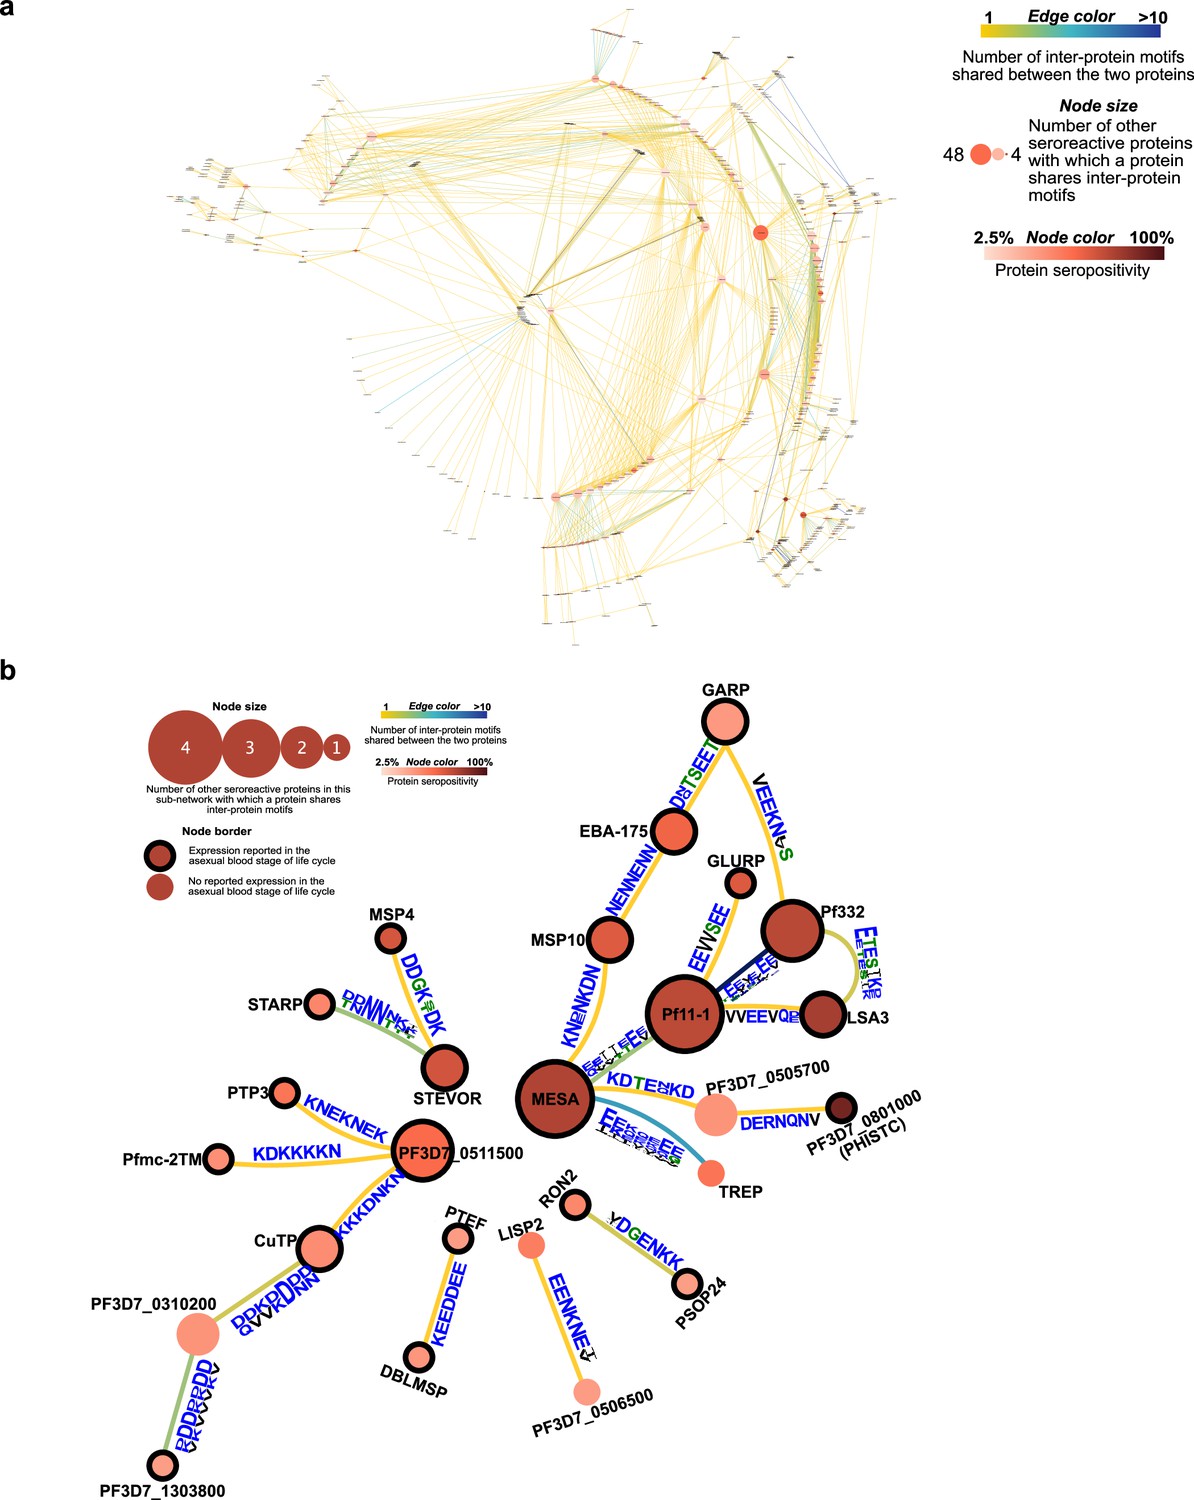
Figure 6 with 5 supplements
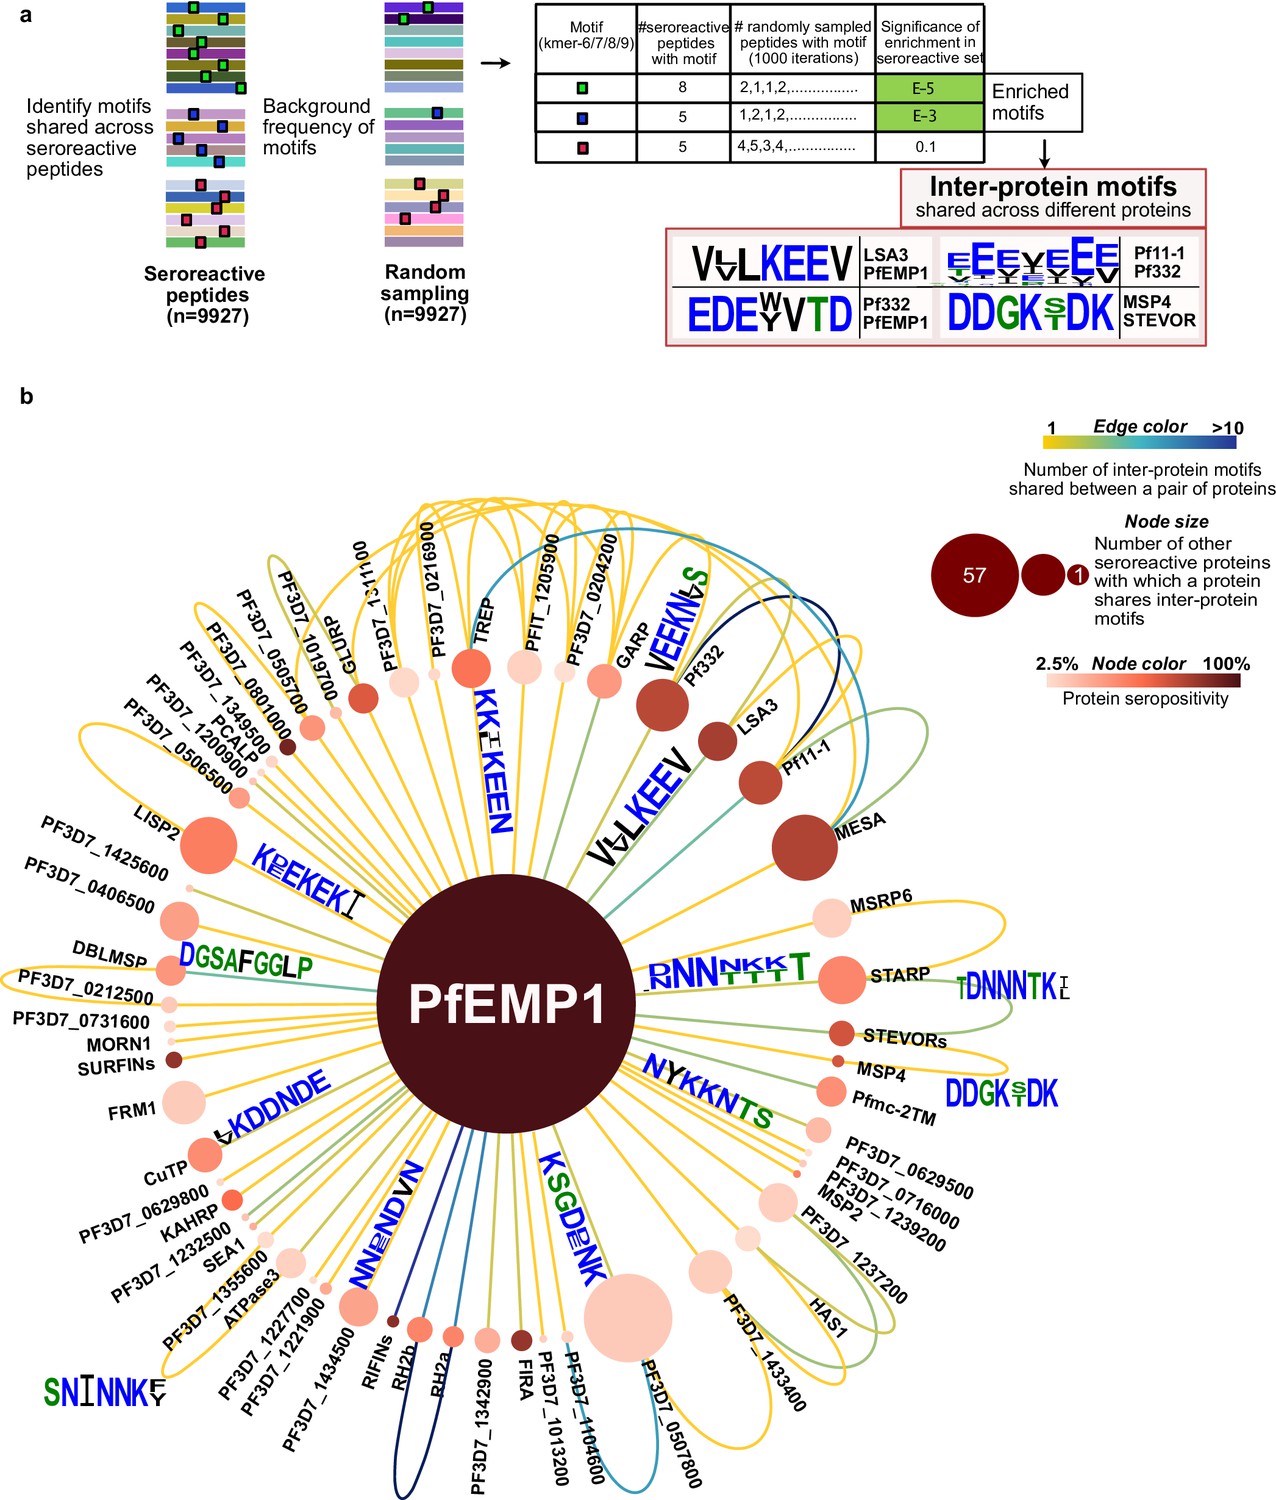
Extensive sharing of motifs observed among seroreactive proteins, with the most shared with PfEMP1 family.
(a) Pipeline to identify inter-protein motifs (6-9aa) significantly enriched (FDR <0.001) in seroreactive peptides from different seroreactive proteins (different colors) over background. Background for each motif was estimated based on the number of random peptides possessing the motif in 1000 random samplings of 9927 peptides. Examples of inter-protein motifs and seroreactive proteins sharing them are also shown. (b) Network of PfEMP1 sharing inter-protein motifs with other seroreactive proteins based on 7-aa motifs with up to two conservative substitutions. PfEMP1 shared inter-protein motifs with the greatest number of other seroreactive proteins.
Figure 6—figure supplement 1
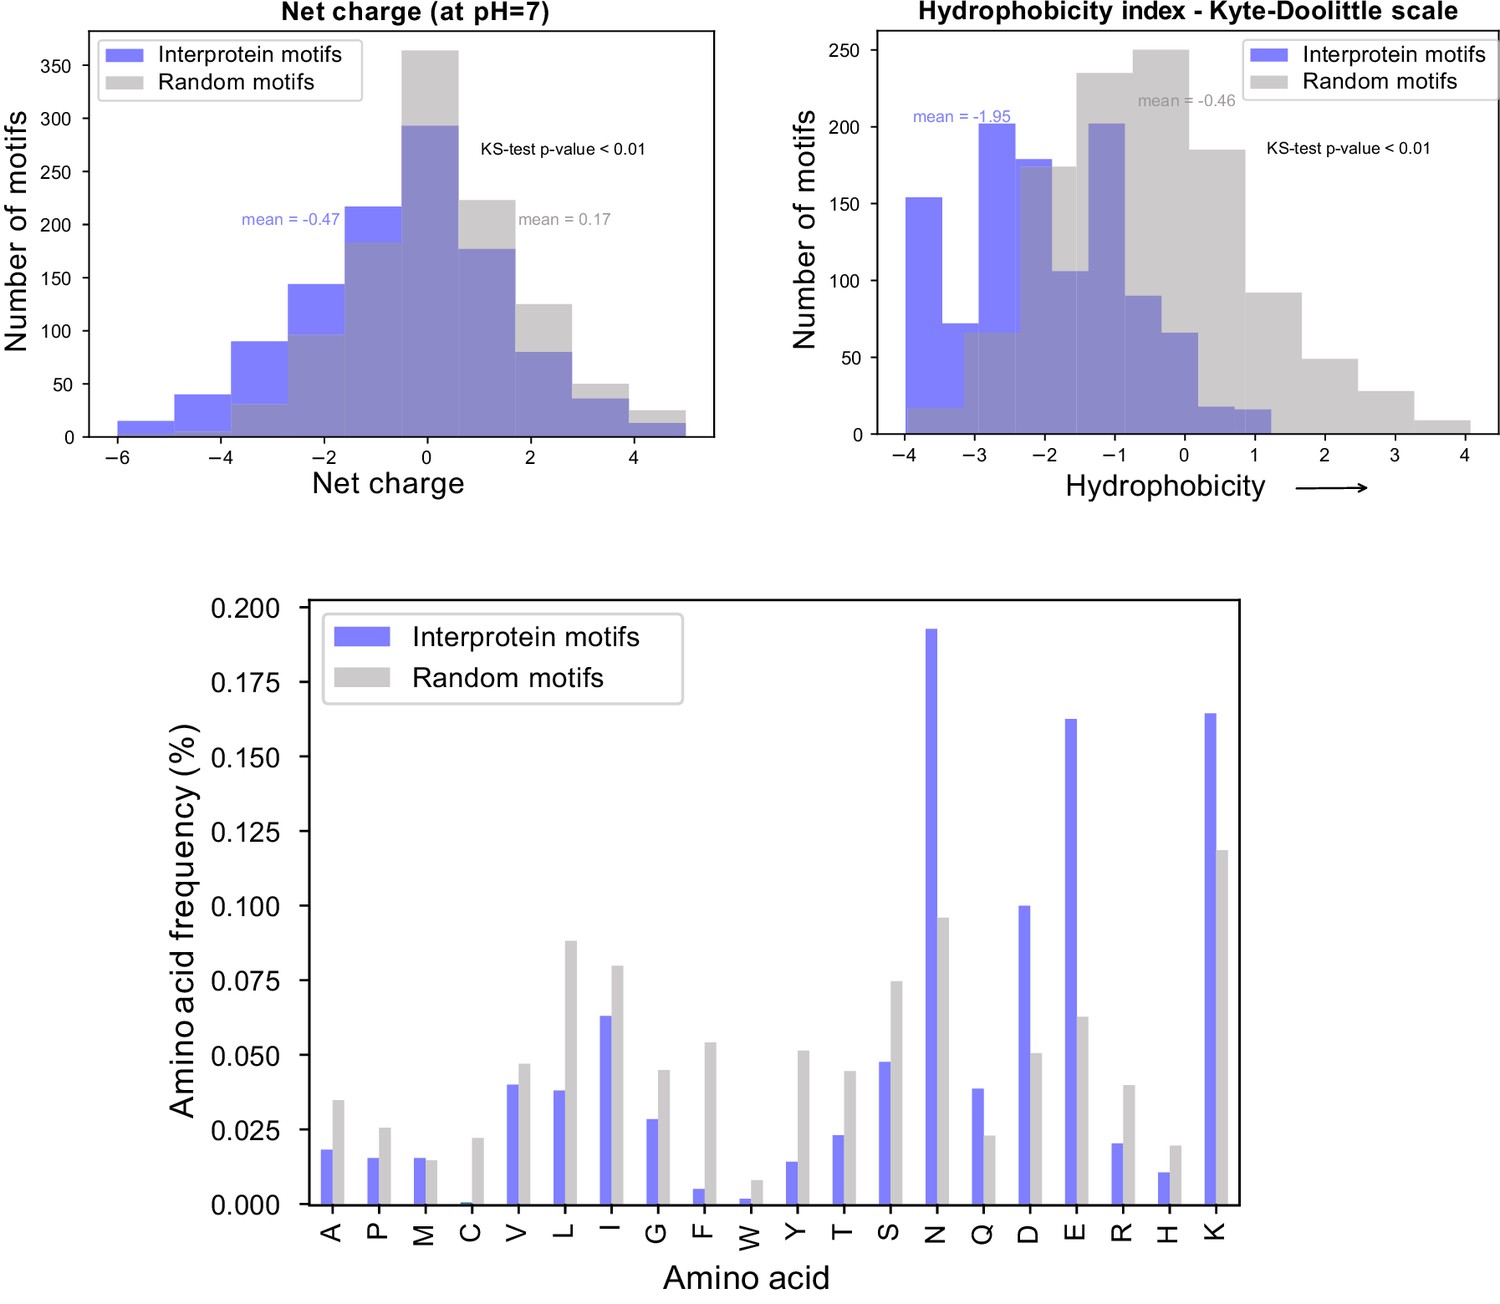
Biochemical characteristics of inter-protein motifs.
Top - Histogram of net charge and hydrophobicity index of the 911 inter-protein motifs (7-aa motifs with at least five identical residues and up to two conservative substitutions) in comparison to a random set of 911 kmers of the same length from Pf proteome. Bottom - Distribution of amino acid frequencies in inter-protein and random motifs. All except Methionine (M) are significantly different between the two groups.
Figure 6—figure supplement 2

Inter-protein motifs are associated with seroreactivity.
(a) Design of the tiled peptide library showing segments in Peptide 4 overlapping with neighboring peptides. Start and end amino acid positions of each peptide are marked at either ends. (b) Comparison of maximum seropositivity of overlapping peptides with and without inter-protein motifs. Each row in the heatmap pertains to a collection of overlapping peptides surrounding a consecutive set of seroreactive peptides with an inter-protein motif. (c) Same as in c, but for all 'enriched' motifs in seroreactive peptides.
Figure 6—figure supplement 3
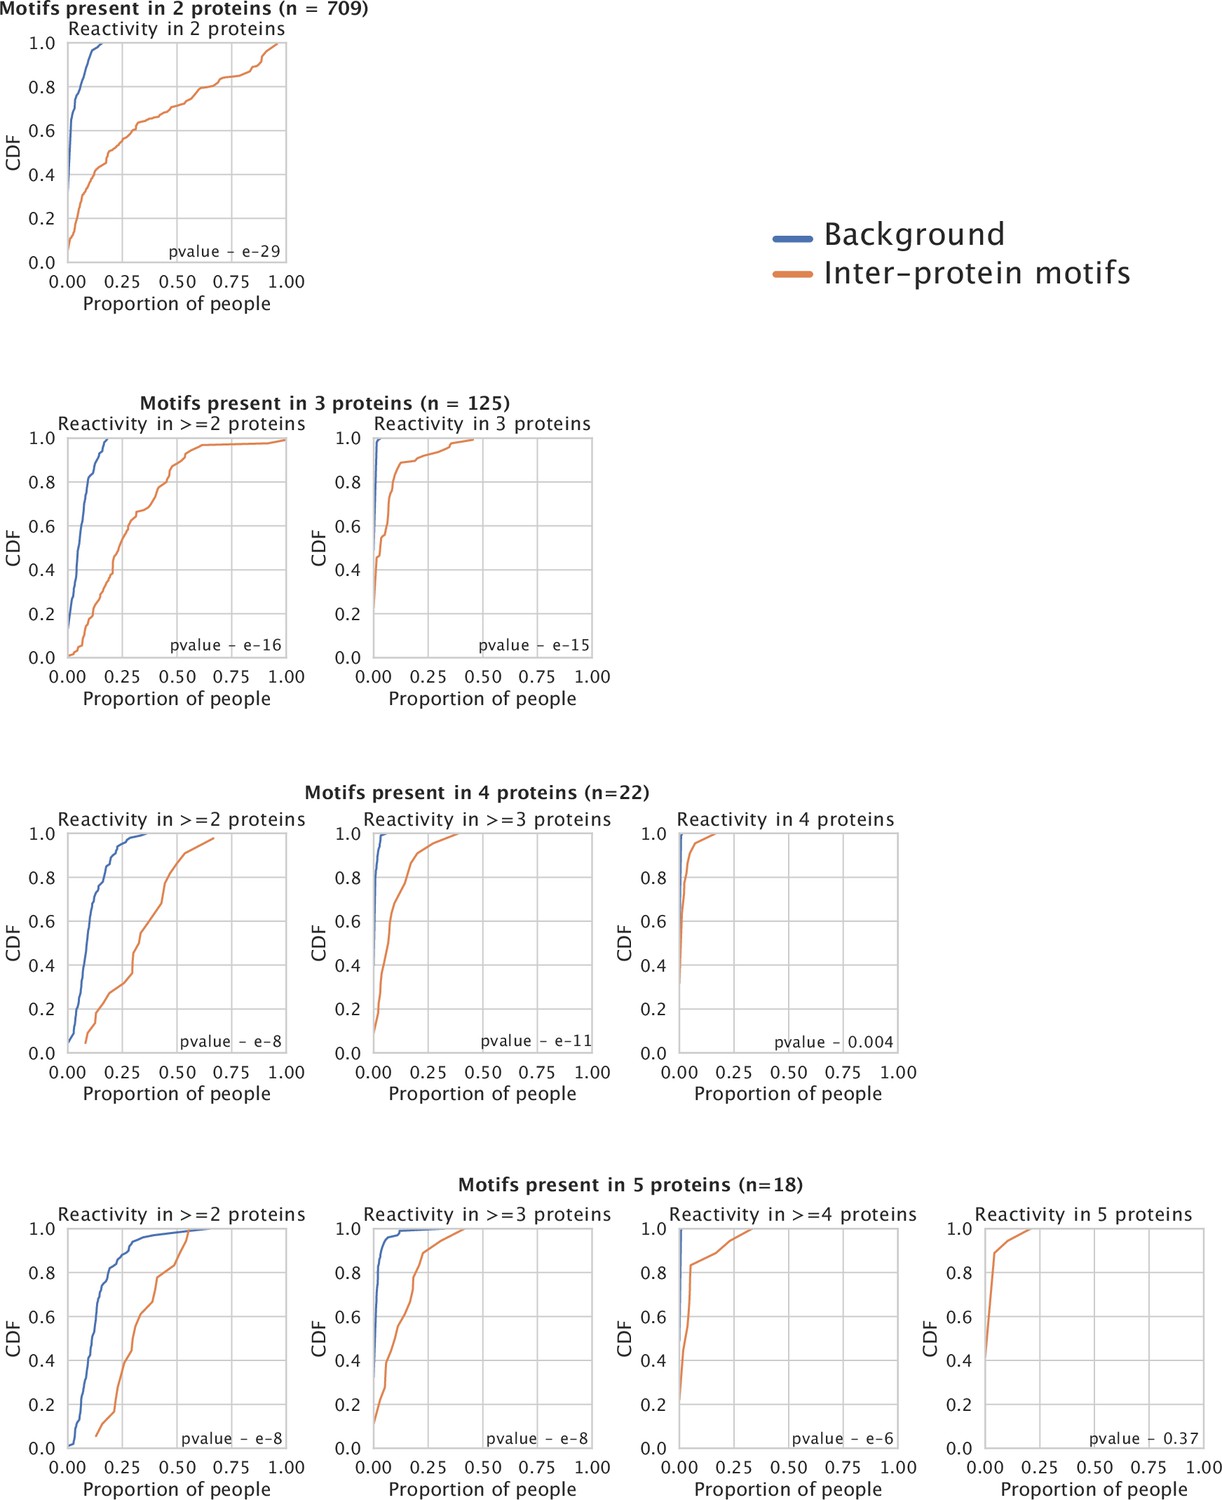
Co-occurrence of reactivity to peptides containing inter-protein motifs from different proteins within individuals.
Each plot in orange depicts the Cumulative Distribution Function (CDF) for the proportion of people showing reactivity in >y proteins for the set of inter-proten motifs shared among n proteins. The background distribution (blue) is based on a random sampling of peptides without inter-protein motifs from different proteins and reflects the level of sharing observed by chance.
Figure 6—figure supplement 4

Histogram of number of other seroreactive proteins with which a seroreactive protein shares inter-protein motifs.
Figure 6—figure supplement 5
Network of seroreactive proteins outside the PfEMP1 network.
(a) All seroreactive proteins except PfEMP1 (b) Proteins with >30% seropositivity.
Author response image 1

Tables
Table 1
Characteristics of the Ugandan cohorts.
| Region | Age group (yrs) | No. of people | Proportion positive for infection at the time of sample collection | Time since last infection (days) - median (IQR) | Incidence of symptomatic malaria per year - median (IQR) | Household annual EIR* (infective bites / person) - median (IQR) |
|---|---|---|---|---|---|---|
| Tororo | 2–3 | 10 | 0.5 | 18.5 (0,85) | 5.8 (2.9,7.7) | 56 (33,148) |
| 4–6 | 30 | 0.66 | 0 (0,45) | 3.6 (2.6,4.8) | 59 (38,84) | |
| 7–11 | 30 | 0.63 | 0 (0,45) | 2.3 (2,4.3) | 46 (30,110) | |
| >18 | 30 | 0.7 | 0 (0,45) | 1.2 (0.9,1.6) | 49 (35,94) | |
| Kanungu | 2–3 | 10 | 0.1 | 155 (61,190) | 1.7 (0.9,2) | 4.3 (4, 14) |
| 4–6 | 30 | 0.2 | 114 (43,289) | 1.5 (0.7, 2.3) | 7.3 (4.5, 15) | |
| 7–11 | 30 | 0.13 | 121 (41,263) | 1.5 (0.6, 2) | 5.2 (4, 7) | |
| >18 | 30 | 0.2 | 109 (38, 223) | 1.1 (0.8, 1.3) | 6.8 (4.8, 15.4) |
-
*
EIR – Entomological Inoculation Rate.
Table 2
Composition of Falciparome phage library.
| Input sequences before collapsing on similarity | Identity threshold for collapsing byCD-HIT | # Final collapsed Protein sequences | |
|---|---|---|---|
| P. falciparum reference proteome | 3D7, IT (10,771 total) | 99% | 6372 |
| P. falciparum variant sequences |
| 100% (90% for CSP) | 1205 |
| Other variants | P. reichnowi PfEMP1 (PFREICH) Anopheles - CE5 (5), SG6 (5) | ||
| Anopheles salivary proteins | 53 proteins from 19 Anopheles species as described in Figure 1 of Arcà et al., 2017 | 98% | 708 |
| Vaccine/Viral/Toxin sequences |
| 98% (90% for RotoAB) | 684 |
| Laboratory positive controls |
| 98% | 11 |
| TOTAL PROTEINS | 8,980 | ||
| TOTAL PEPTIDES | 238,068 |
Key resources table
| Reagent type (species) or resource | Designation | Source or reference | Identifiers | Additional information |
|---|---|---|---|---|
| Strain, strain background (E. coli) | BLT5403 | Novagen/EMD Millipore, T7 Select Kit | Cat# 70550–3 | |
| Strain, strain background (T7 Bacteriophage) | T7 vector arms, Packaging extract | Novagen/EMD Millipore, T7 Select Kit | Cat# 70550–3 | |
| Genetic reagent (T7 Bacteriophage library) | Falciparome | Made in this study | See Materials and Methods | |
| Biological sample (Humans) | Ugandan cohort plasma | Kamya et al., 2015, Rek et al., 2016; Yeka et al., 2015 | ||
| Biological sample (Humans) | US control plasma | New York Blood Center | ||
| Antibody | Anti-Glial Fibrillary Associated Protein (rabbit, polyclonal) | Agilent | Cat# Z033429-2 | 1 ug used |
| Peptide, recombinant protein | Protein A conjugated magnetic beads | Invitrogen/Thermo Fisher Sci | Cat# 10008D | |
| Peptide, recombinant protein | Protein G conjugated magnetic beads | Invitrogen/Thermo Fisher Sci | Cat# 10009D | |
| Peptide, recombinant protein | BSA Fraction V | Sigma-Aldrich | Cat# 10735094001 | |
| Peptide, recombinant protein | T4 ligase | New England Bio | Cat# M0202S | |
| Peptide, recombinant protein | Phusion DNA Polymerase | New England Bio | Cat# M0530L | |
| Commercial assay or kit | T7 Select 10-3b Cloning kit | EMD Millipore | Cat# 70550–3 | |
| Commercial assay or kit | Ampure XP Beads | Beckman Coulter | Cat# A63881 | |
| Software, algorithm | CD-HIT | Fu et al., 2012; Li and Godzik, 2006 | http://weizhongli-lab.org/cd-hit/ | |
| Software, algorithm | numpy | Open Source | https://doi.org/10.1109/MCSE.2011.37 | |
| Software, algorithm | scipy | Open Source | https://www.nature.com/articles/s41592-019-0686-2 | |
| Software, algorithm | Matplotlib | Open Source | https://ieeeexplore.ieee.org/document/4160265 | |
| Software, algorithm | Cutadapt | Martin, 2011 | https://cutadapt.readthedocs.io/en/stable/ | |
| Software, algorithm | Cytoscape | Shannon et al., 2003 | https://cytoscape.org |
Additional files
-
Supplementary file 1
List of 9927 seroreactive peptides identified in this dataset with their sequences.
- https://cdn.elifesciences.org/articles/81401/elife-81401-supp1-v2.xlsx
-
Supplementary file 2
Top 40 proteins with highest seropositivity and associated literature.
- https://cdn.elifesciences.org/articles/81401/elife-81401-supp2-v2.zip
-
Supplementary file 3
List of top 100 proteins with highest seropositivity used for GO analysis.
- https://cdn.elifesciences.org/articles/81401/elife-81401-supp3-v2.zip
-
Supplementary file 4
Seropositivity rate (proportion of people seropositive) for all 9927 seroreactive peptides across different groups in the two exposure settings.
- https://cdn.elifesciences.org/articles/81401/elife-81401-supp4-v2.xls
-
Supplementary file 5
Seropositivity rate (proportion of people seropositive) for top repeat elements across different groups in the two exposure settings.
- https://cdn.elifesciences.org/articles/81401/elife-81401-supp5-v2.xlsx
-
Supplementary file 6
List of inter-protein motifs and the proteins sharing them.
Motifs reported here are 7-mers with at least 5 identical amino acids and up to two conservative substitutions (and no wildcards).
- https://cdn.elifesciences.org/articles/81401/elife-81401-supp6-v2.xlsx
-
Supplementary file 7
Table describing the number of interprotein motifs obtained with varied parameters for calling the motifs.
- https://cdn.elifesciences.org/articles/81401/elife-81401-supp7-v2.xlsx
-
Supplementary file 8
Gene network file for interprotein motifs (7-mers with at least 5 identical amino acids and up to two conservative substitutions (and no wildcards)).
Can be visualized on Cytoscape.
- https://cdn.elifesciences.org/articles/81401/elife-81401-supp8-v2.zip
-
MDAR checklist
- https://cdn.elifesciences.org/articles/81401/elife-81401-mdarchecklist1-v2.pdf
Download links
A two-part list of links to download the article, or parts of the article, in various formats.
Downloads (link to download the article as PDF)
Open citations (links to open the citations from this article in various online reference manager services)
Cite this article (links to download the citations from this article in formats compatible with various reference manager tools)
Antibodies to repeat-containing antigens in Plasmodium falciparum are exposure-dependent and short-lived in children in natural malaria infections
eLife 12:e81401.
https://doi.org/10.7554/eLife.81401


