Candida albicans exhibits heterogeneous and adaptive cytoprotective responses to antifungal compounds
- Department of Anatomy and Cell Biology, Western University, Canada
- Department of Biology, Concordia University, Canada
- Department of Computer Science and Software Engineering, Concordia University, Canada
- Shmunis School of Biomedical and Cancer Research, The George S. Wise Faculty of Life Sciences, Tel Aviv University, Israel
- Department of Chemical and Systems Biology, Stanford University, United States
- Department of Biochemistry, Western University, Canada
Figures
Figure 1 with 2 supplements
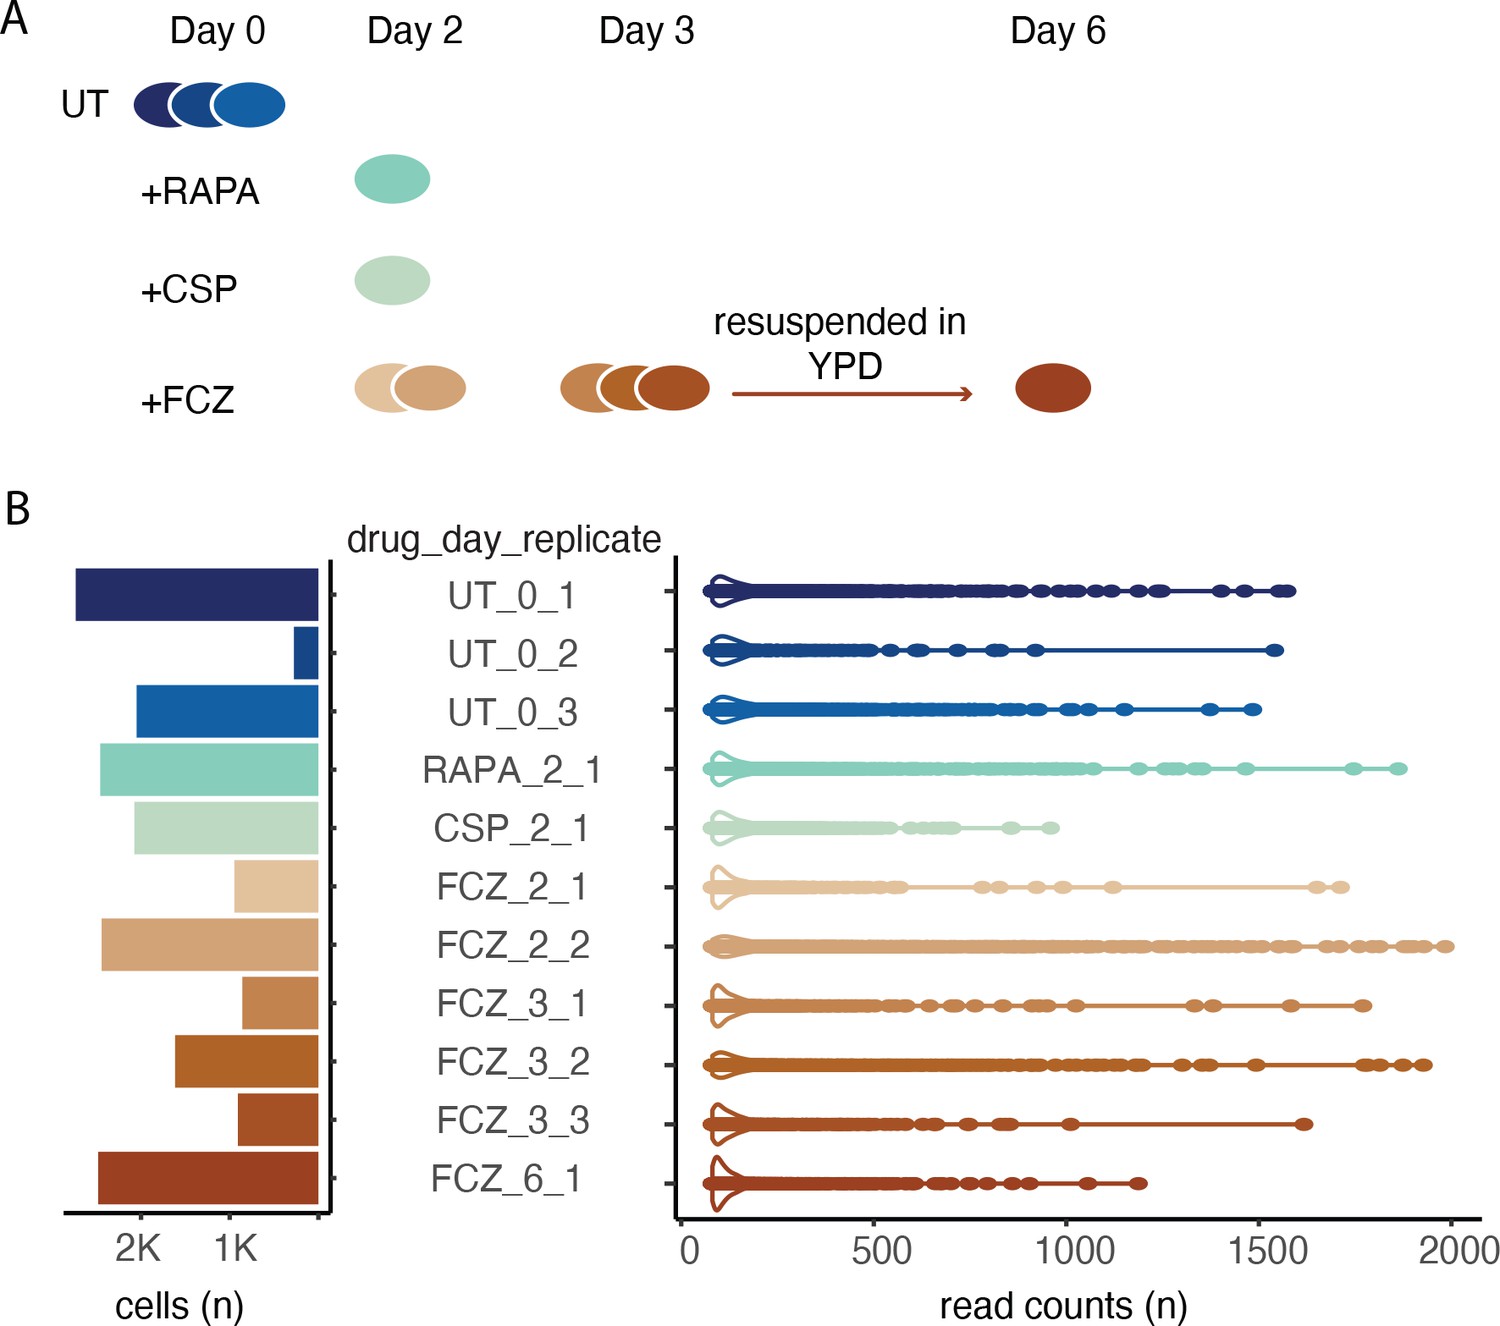
Experimental design and initial single-cell profiling.
(A) The time series experiment begins with three replicates of untreated (UT) cells followed by profiling of rapamycin (RAPA), caspofungin (CSP), and fluconazole (FCZ, 2 replicates at day 2, and 3 replicates at day 3). After 3 days in FCZ, cells were transferred to YPD; recovered cells were profiled at day 6 (i.e., 3 days after resuspension). (B) Bar plot (left) depicts the number of high-quality cells per sample. Violin plots (right) the distribution in the number of reads assigned to each cell.
Figure 1—figure supplement 1
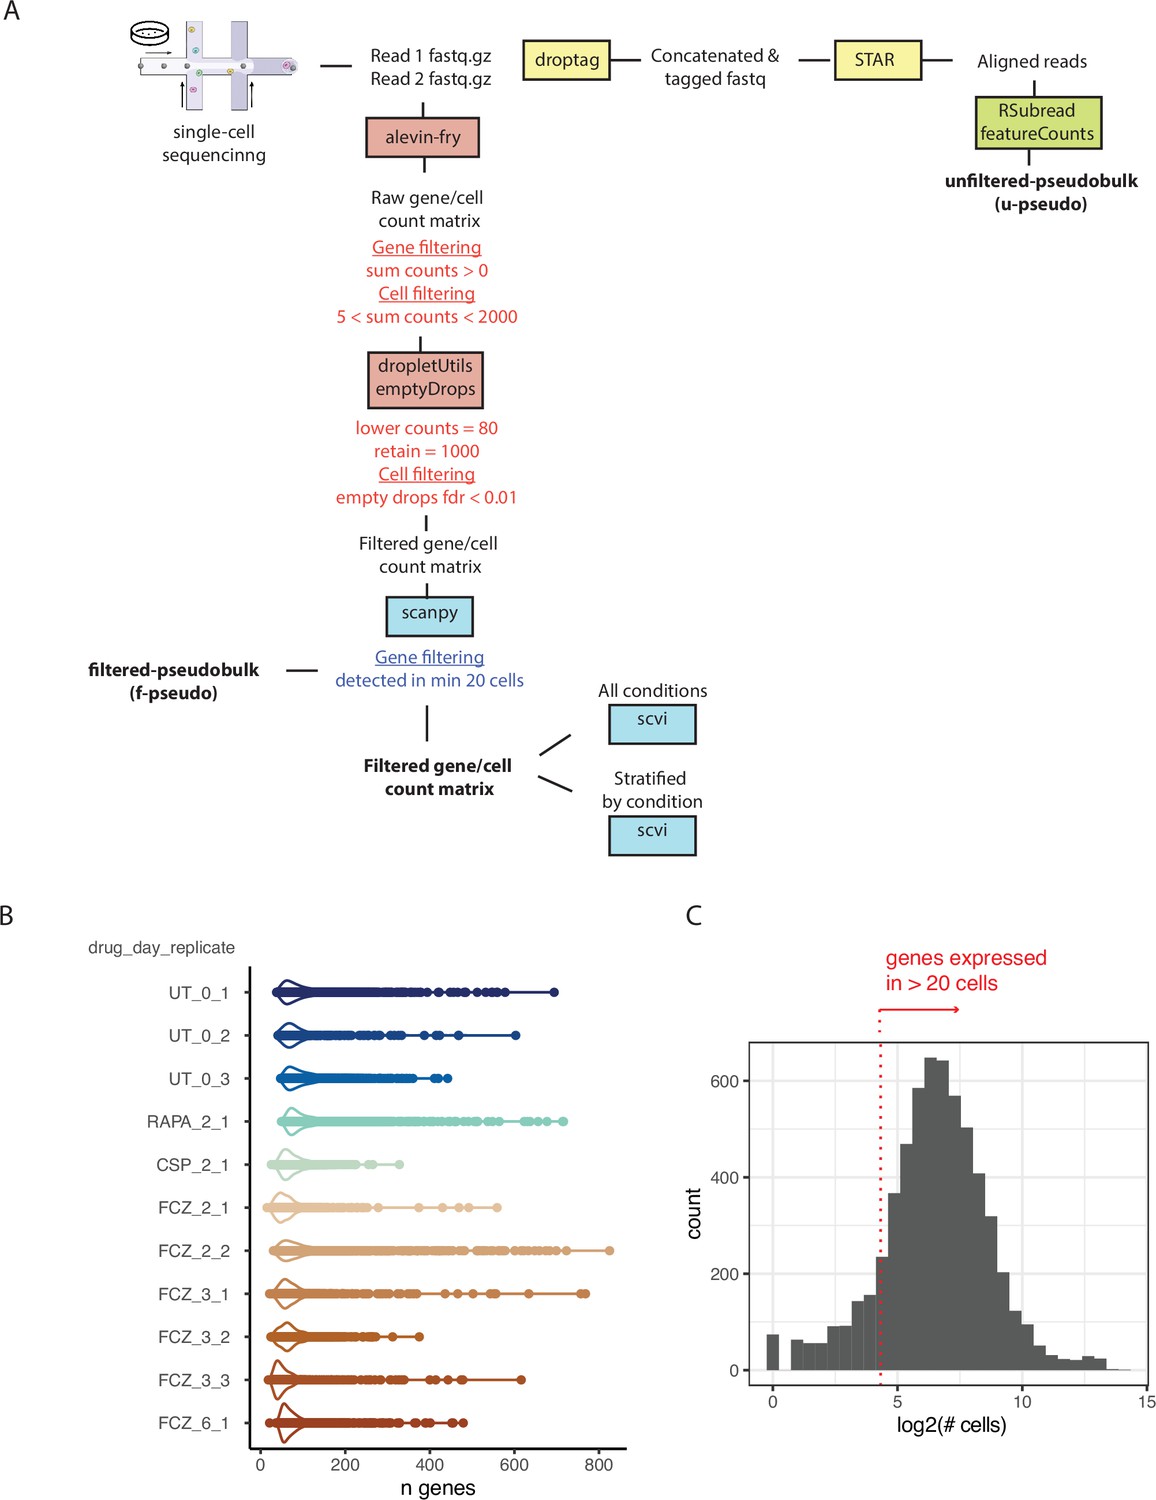
Schema for analysis stragegy and measures of gene experssion.
(A) The bioinformatics pipeline begins with the Read1 (left) and Read2 (right) fastq files (Materials and methods, ‘Quality control, basic processing, and normalization of the sc profiles’). Sc sequence data was processed using the Alevin-Fry (He et al., 2021) pipeline based on a reference index covering the spliced transcriptome. Cells were labeled as good quality if their profiles significantly deviated from the ambient RNA pool (FDR < 0.01) following the EmptyDrops approach (Lun et al., 2018). Pseudo-bulk profiles were obtained by either summing counts across selected cells and genes (filtered pseudo-bulk) or by mapping reads to the reference genome but ignoring cell barcodes (unfiltered pseudo-bulk) (Materials and methods, ‘Construction of pseudo-bulk profiles’). (B) Violin plots with data points describing the number of genes detected in each high-quality cell for each sample (drug_day_replicate). (C) Histogram depicting the number of cells in which a gene is expressed. We selected genes that were expressed in at least 20 cells across all samples (red dotted line).
Figure 1—figure supplement 2

Comparison of single cell and bulk expression profiles.
(A) The upper left and lower right coordinates show the distribution of gene counts in single-cell profiles of fluconazole (FCZ)-treated cells at day 2 (FCZ_2) and day 3 (FCZ_3) respectively. Counts for each high-quality cell in both day 2 and day 3 replicates were summed and normalized (filtered pseudo-bulk; counts per million [CPM]). The upper right and lower left quadrants report the Pearson correlation and scatterplot depicting how genes are expressed in the two filtered pseudo-bulk samples, respectively. (B) The density plots compare the normalized counts in the bulk profile of FCZ-treated cells at day 2 for genes that were consistently detected in every FCZ (unfiltered) pseudo-bulk (red) versus genes that were not consistently identified (blue). Unfiltered pseudo-bulk samples were obtained by aligning single-end reads while ignoring its paired-read that contains the cell barcode (A). (C) The diagonal of the matrix shows the distribution of normalized gene counts, measured as the log2(CPM + 1) in each FCZ-treated sample (bulk or (*) unfiltered pseudo-bulk). The values above the diagonal report the Pearson correlations between pairs of samples, and the scatterplots below the diagonal depict normalized log2(CPM + 1) expression of genes in each pair of samples (bulk or (*) unfiltered pseudo-bulk).
Figure 2 with 1 supplement
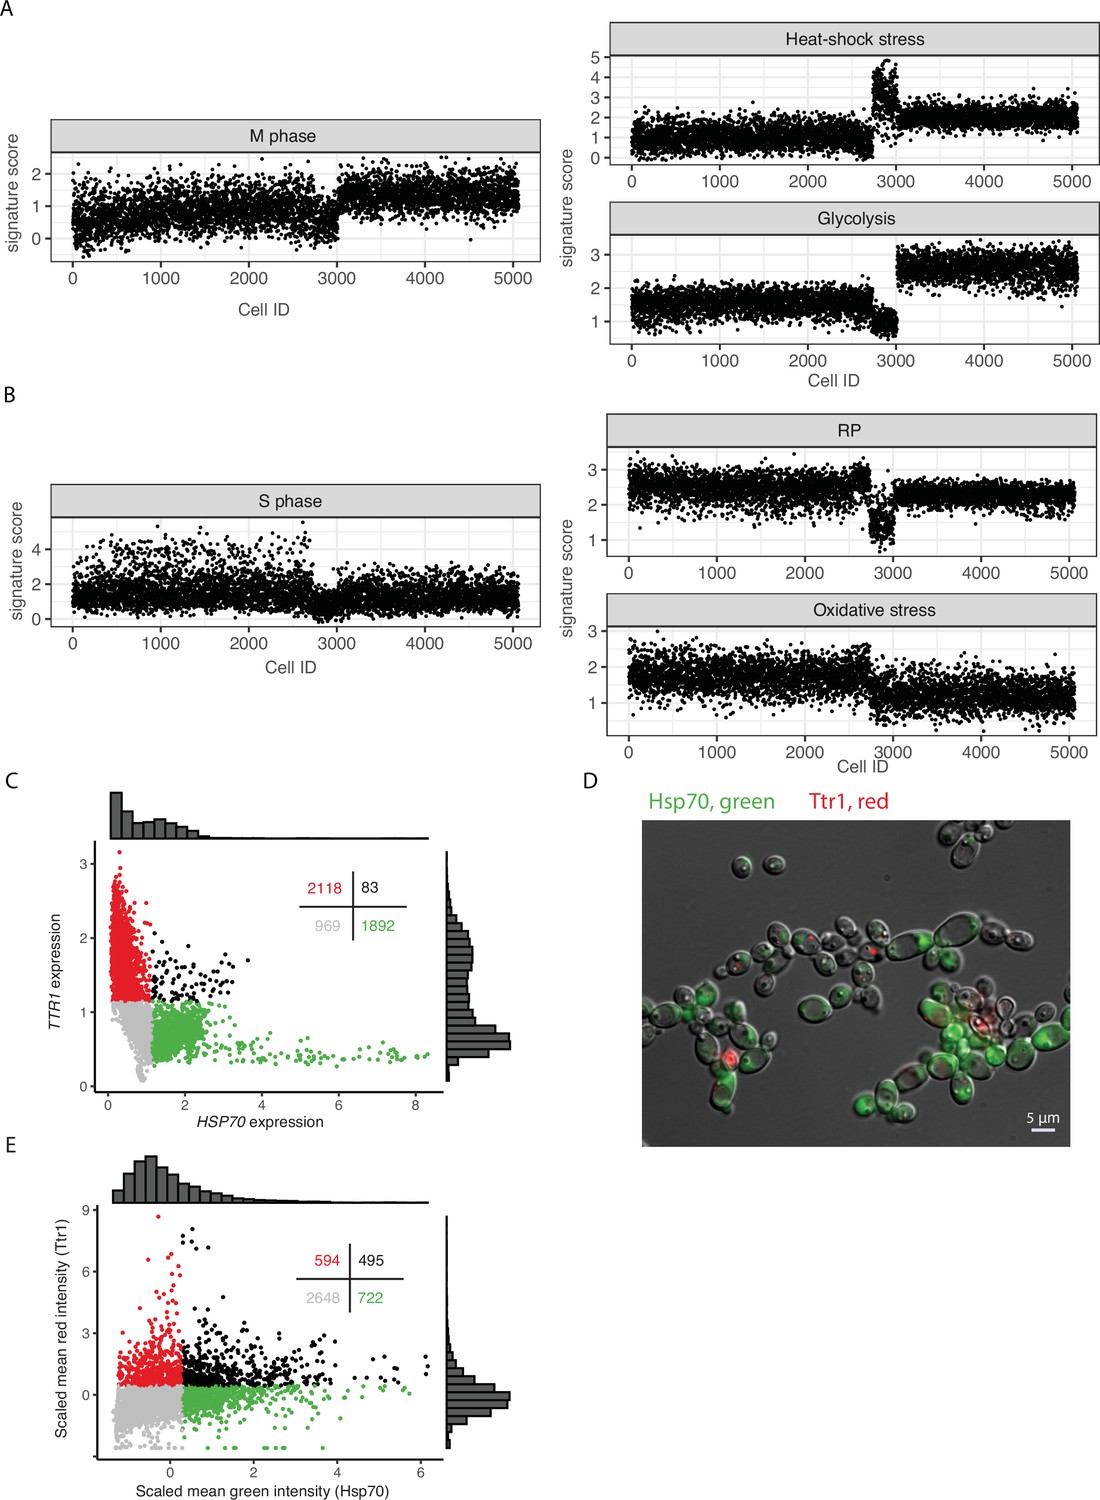
Cell-to-cell heterogeneity in untreated (UT) cell populations.
(A, B) Expression levels (VISION scores) of curated signatures for individual UT cells. Cell order is the same in all graphs. (C) Scatterplot of cells (dots) based on expression level after imputation. Colors indicate: red, TTR1 expression >1.2 and HSP70 expression <1.2; green, TTR1 expression <1.2 and HSP70 expression >1.2; black, both TTR1 and HSP70 expression >1.2; and gray, expression of both genes was <1.2. Distributions of expression are illustrated in histograms above and to the right and the number of cells in each group is provided in the top right of the figure. (D) Representative fluorescence micrographic image of RFP-tagged TTR1(red) and GFP-tagged HSP70 (green) in a population of isogenic cells showing the mutually exclusive nature of their expression in individual cells. (E) Plot of the mean intensities captured in microscopy images of RFP-tagged TTR1 (red) and GFP-tagged HSP70 (green).
-
Figure 2—source data 1
Gene signatures related to microbial phenotypic diversity and drug tolerance curated from the literature.
The most variable signatures identified in each analysis are highlighted – dark colors: final selection; light colors: signatures passed the threshold but not selected after filtration (redundancy; non-concordant gene expression; number of most variable genes ≤1).
- https://cdn.elifesciences.org/articles/81406/elife-81406-fig2-data1-v2.xlsx
-
Figure 2—source data 2
GFP and RFP oligo primers.
- https://cdn.elifesciences.org/articles/81406/elife-81406-fig2-data2-v2.xlsx
Figure 2—figure supplement 1
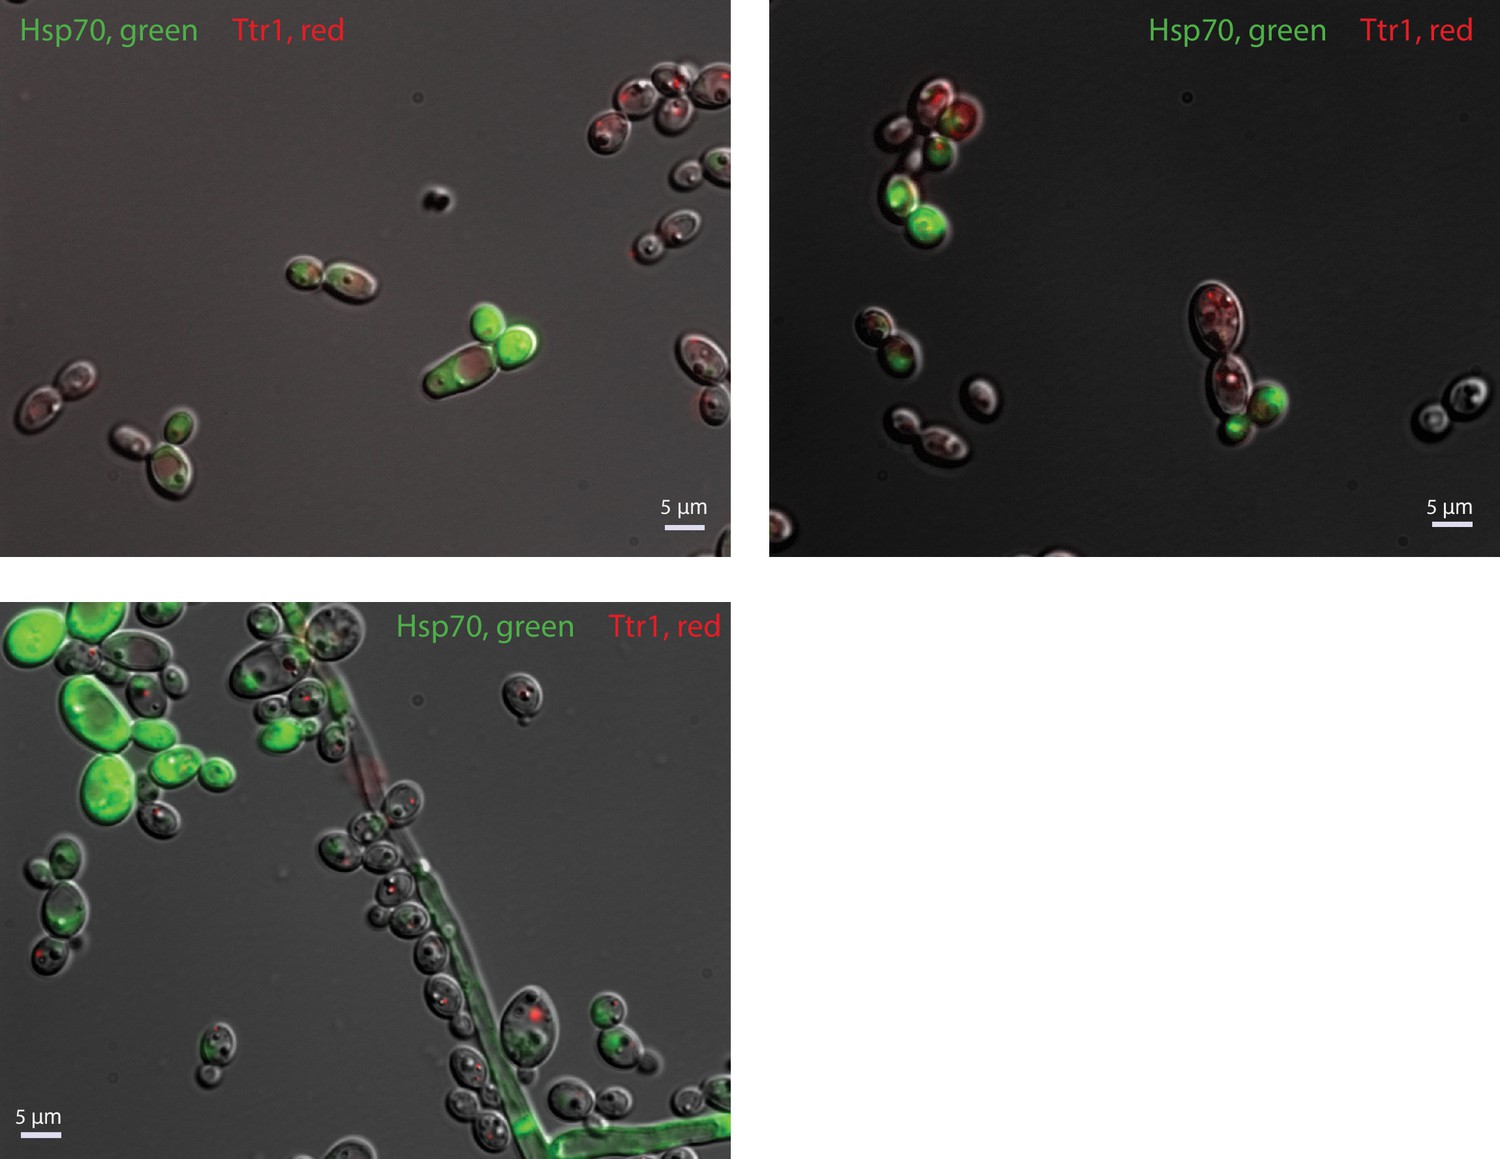
Examples of microscopy images of C. albicans cells harboring both a GFP-tagged heat-shock protein 70 (HSP70) and an RFP-tagged TTR1.
Note the mutually exclusive expression: cells usually express either HSP70 or TTR1, but not both.
Figure 3 with 2 supplements
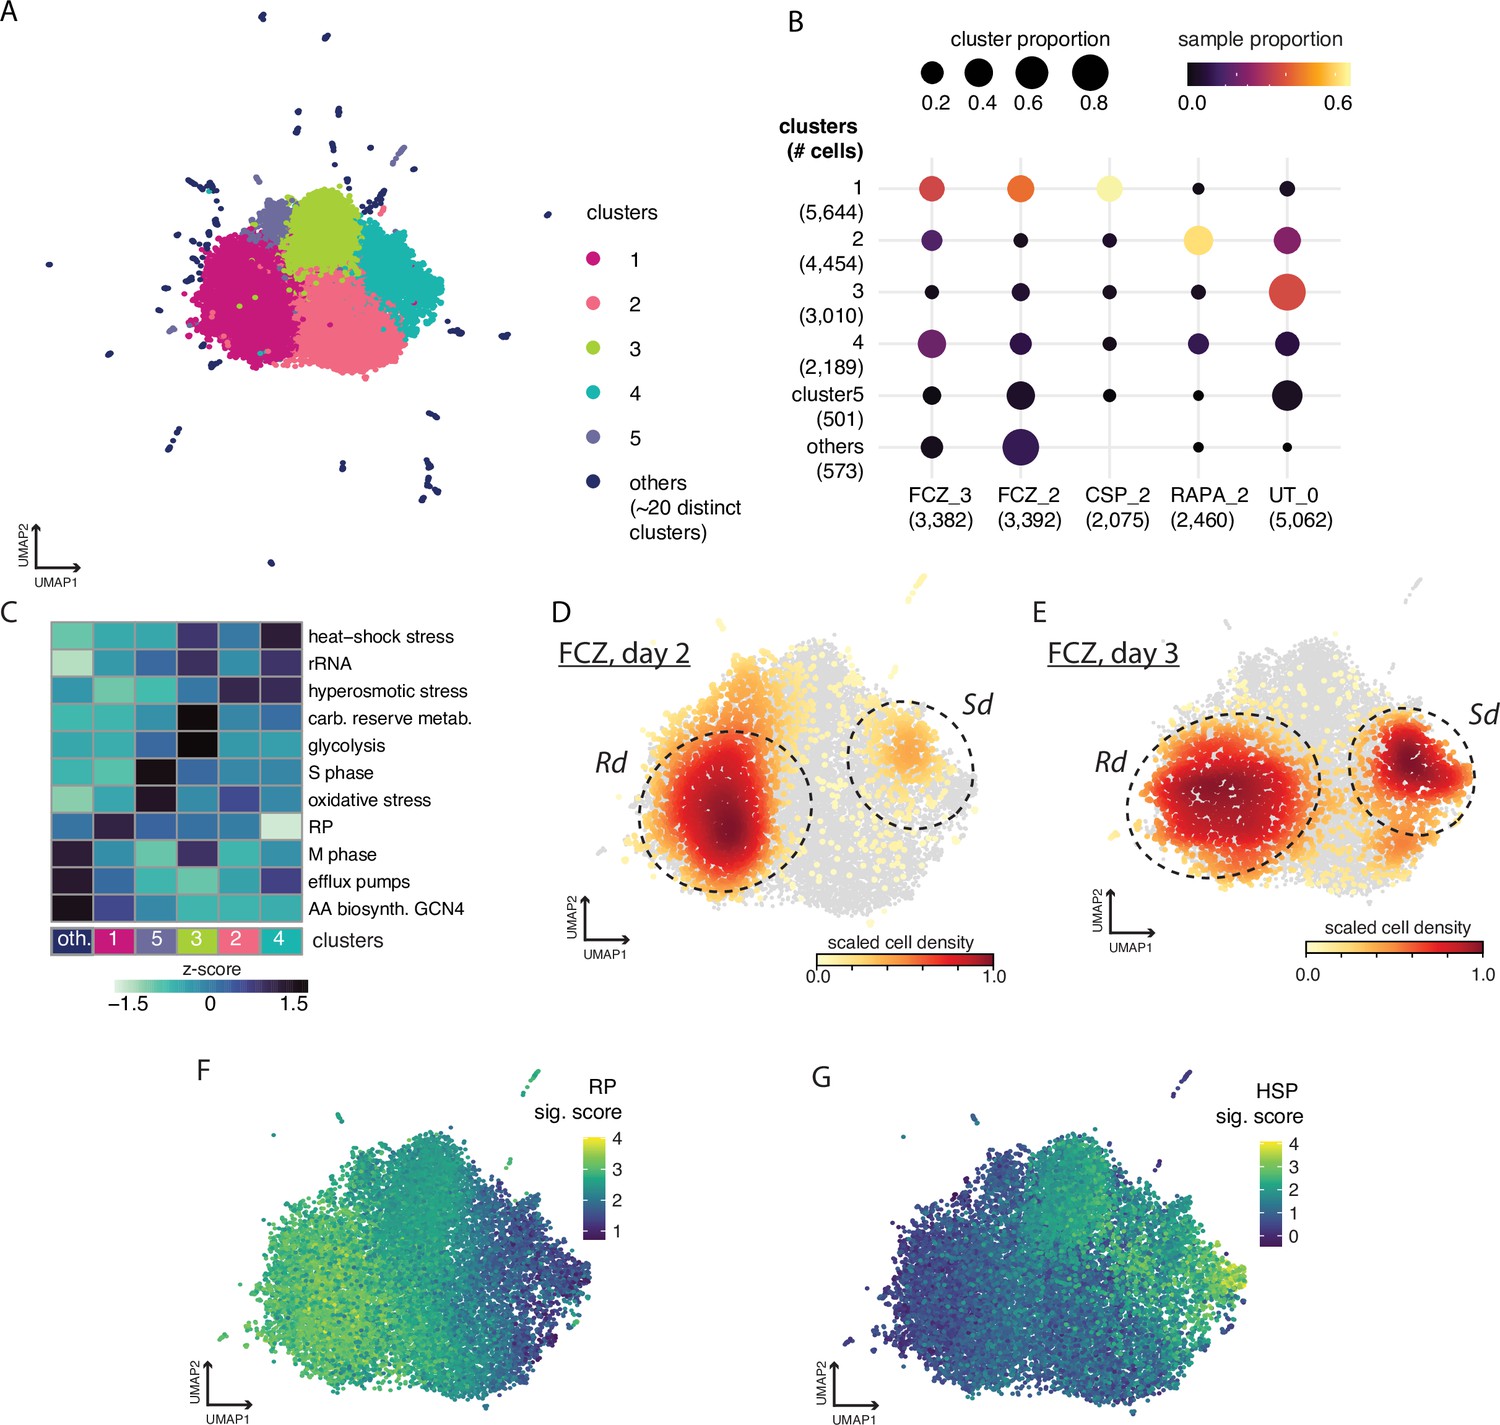
Cell profiles after challenges with different antifungal compounds.
(A) Uniform Manifold Approximation and Projection (UMAP) embedding of all cells including untreated (UT) cells and cells treated with fluconazole (FCZ) (days 2 and 3), rapamycin (RAPA) (day 2), and caspofungin (CSP) (day 2). Leiden clustering identified five main clusters and ~20 sparsely populated ‘comets’. (B) Dotplot describing relative size of cluster populations. Rows correspond to clusters and columns correspond to drug_day conditions. Dot diameter is proportional to the fraction of cells from each condition for a given cluster. The dot color is proportional to the fraction of cells from each cluster for a given condition as shown in the color bar. Numbers in parentheses indicate the total cell count in clusters and drug_day conditions. (C) A heatmap depicting the level of activation (VISION z-scores) of different signatures. (D–G) The UMAP embedding from panel (A) but where color depicts: (D) density of FCZ at day 2 cells, (E) density of FCZ at day 3 cells. (F,G) Signature scores for expression of (F) ribosomal protein (RP), (G) and heat-shock stress (HSP) signatures.
-
Figure 3—source data 1
Differentially expressed genes in fluconazole (FCZ)-treated cells classified in the Ribo-dominant (Rd) cluster 1 (pseudo-bulk samples) compared to FCZ-treated cells in the Stress-dominant (Sd) cluster 4 (pseudo-bulk samples).
baseMean = the average of the normalized counts taken over all pseudo-bulk samples; log2FoldChange = log2 fold change between the groups; lfcSE = standard error of the log2FoldChange estimate; stat = Wald statistic; pvalue = Wald test p-value; padj = Benjamini-Hochberg adjusted p-value.
- https://cdn.elifesciences.org/articles/81406/elife-81406-fig3-data1-v2.xlsx
-
Figure 3—source data 2
Gene ontology terms enriched in genes differentially expressed between fluconazole (FCZ)-treated cells classified in the Ribo-dominant (Rd) cluster 1 (pseudo-bulk samples) compared to FCZ-treated cells in the Stress-dominant (Sd) cluster 4 (pseudo-bulk samples) listed in Figure 3—figure supplement 2B.
- https://cdn.elifesciences.org/articles/81406/elife-81406-fig3-data2-v2.xlsx
Figure 3—figure supplement 1
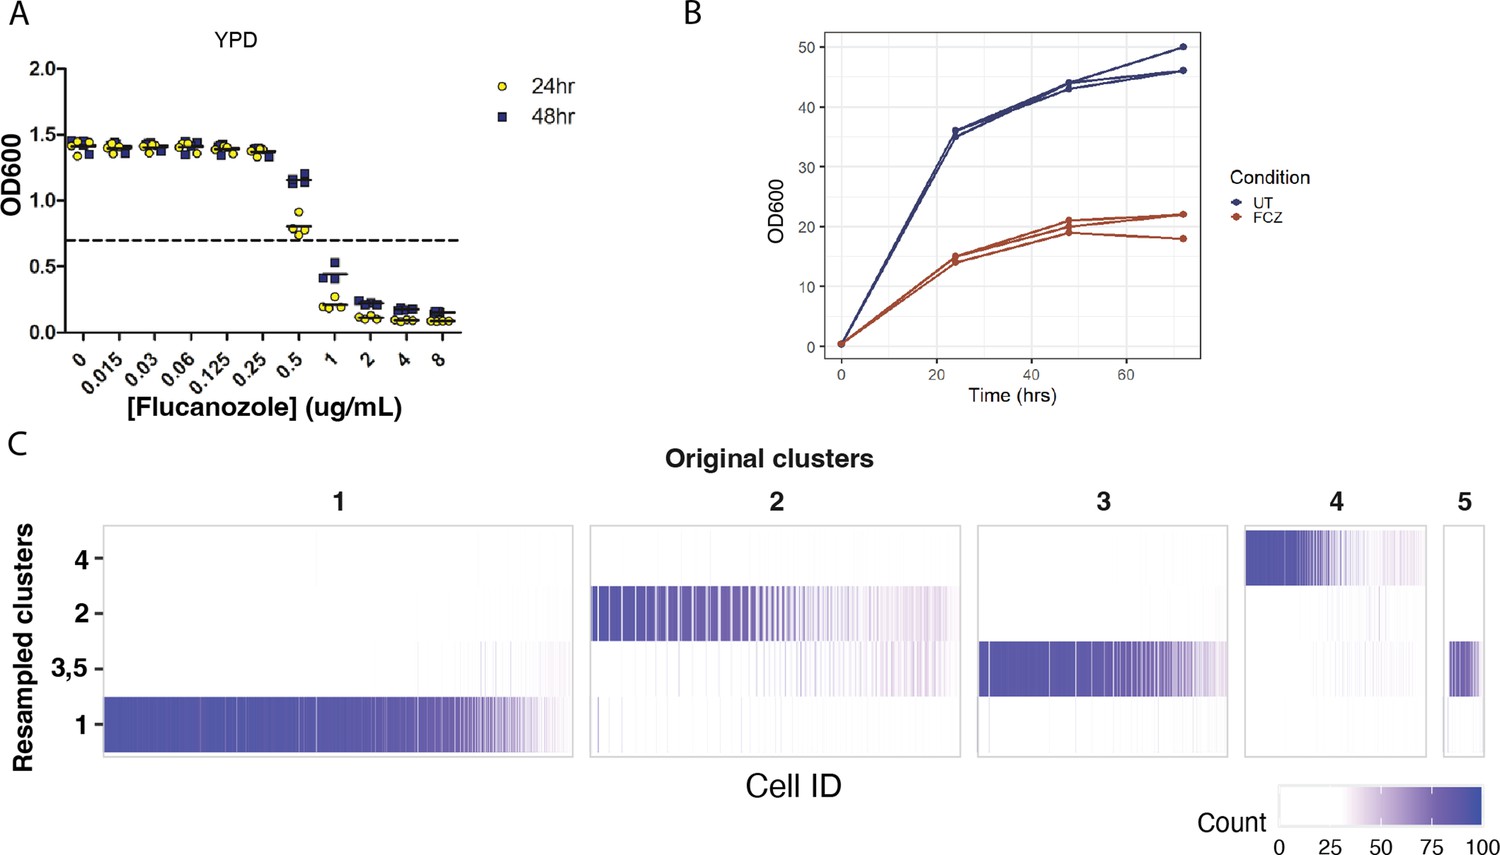
Differential growth characteristics of strain SC5314 in response to FCZ.
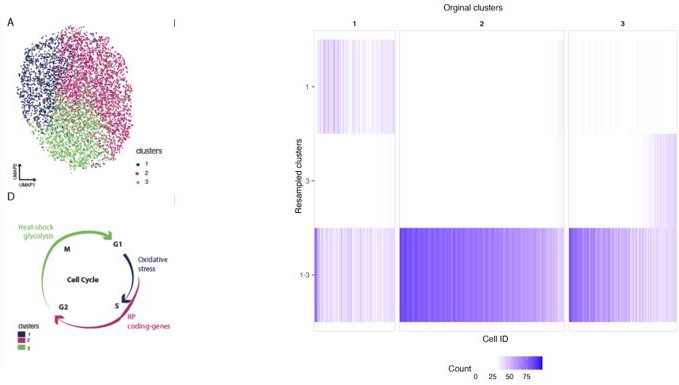
(A) Minimum inhibitory concentration (MIC) of fluconazole (FCZ) determined for strain SC5314. Optical density of cultures grown in liquid YPD for 24 and 48 hr at 30°C in the presence of indicated concentrations of FCZ. Dotted line indicates the threshold for 50% reduction in growth relative to the no-drug control at 24 hr (MIC50). Data represents four technical replicates; means are depicted as solid lines. (B) Growth curves for three biological replicates of untreated (UT) cells and of FCZ-treated cells. (C) To assess cluster stability, unsupervised clustering was performed 100 times, each time choosing a random subset of 95% of the cells. The heatmap represents the number of times each cell (x-axis) was assigned to each of the main five clusters from Figure 3C. We can see that cells that were originally classified as cluster 3 or 5 were often placed in the same cluster, suggesting these two clusters may be collapsed together. The remaining clusters (1, 2, 4) are all highly stable, meaning that there is strong evidence of differences in the underlying transcriptional profiles of cells in these clusters.
Figure 3—figure supplement 2
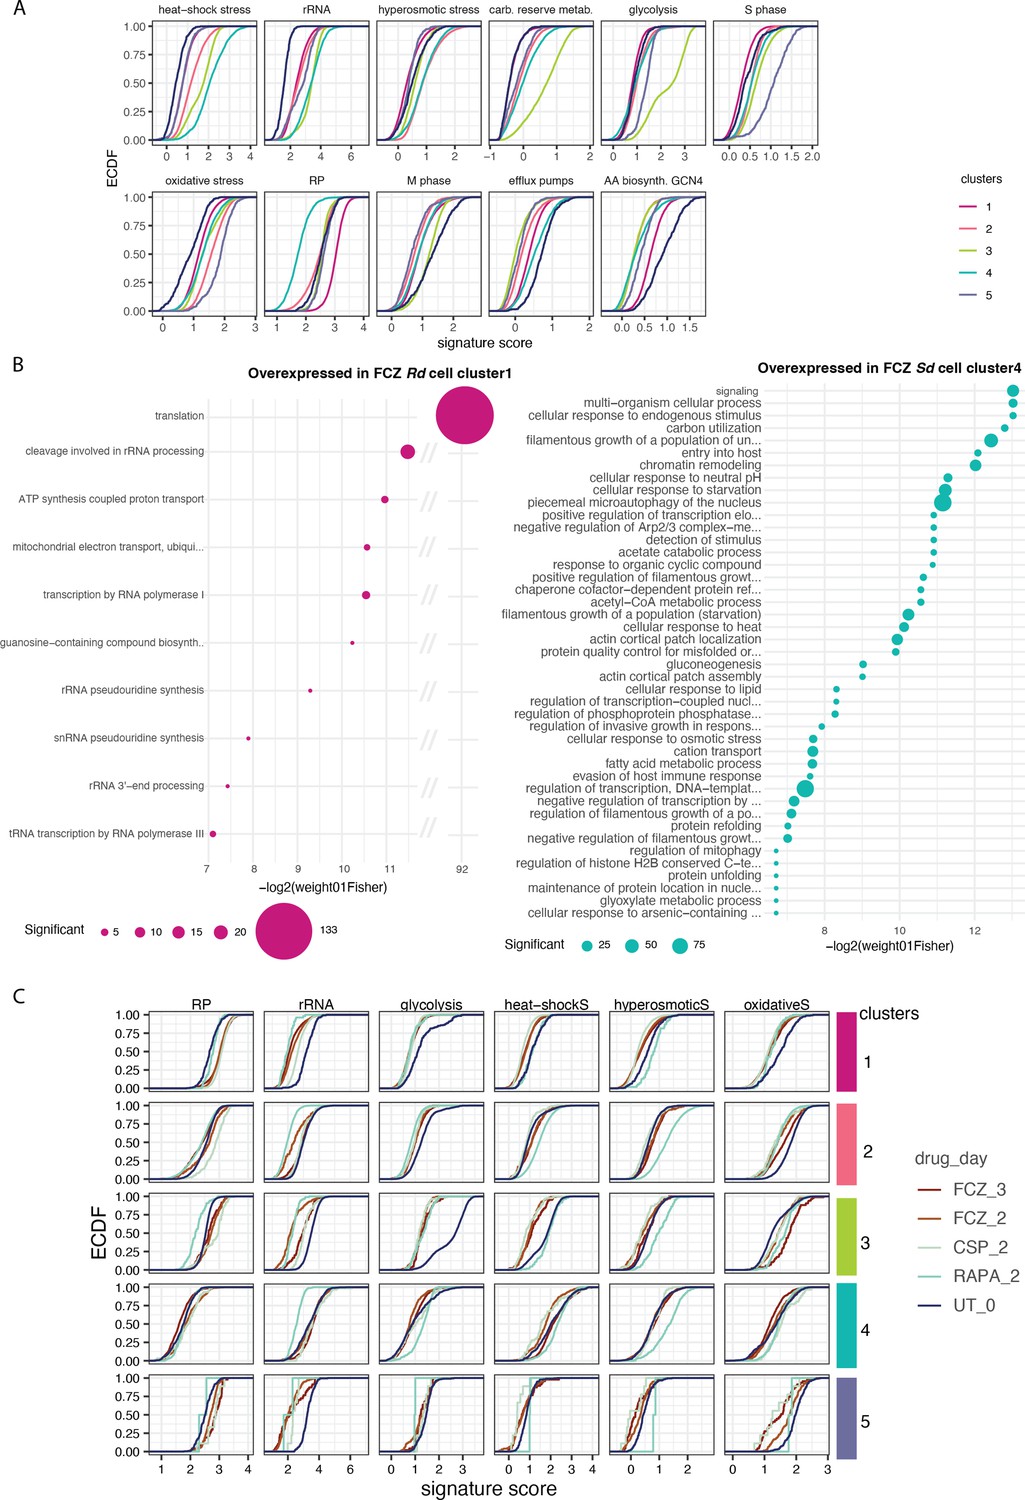
Pathway analysis between the Rd and Sd cell clusters.
(A) Empirical cumulative distribution function (ECDF) of signature scores for each cell in the distinct clusters (color) presented in Figure 3B. The y-axis provides the proportion of cells in each cluster whose score falls below a certain value (x-axis). (B) Gene ontology (GO) enrichment for genes identified as differentially expressed in fluconazole (FCZ) Ribo-dominant (Rd) cell cluster 1 compared to FCZ Stress-dominant (Sd) cell cluster 4 using pseudo-bulk differential expression analysis (N=223 and 463 genes overexpressed in Rd [left] and Sd [right] cells, respectively; FDR <0.1). The size of the dot is proportional to the number of genes in the list which overlap with the corresponding GO term. (C) Empirical cumulative distribution function (ECDF) of signature scores for each distinct cluster (color) across the processes of Figure 3C.
Figure 4
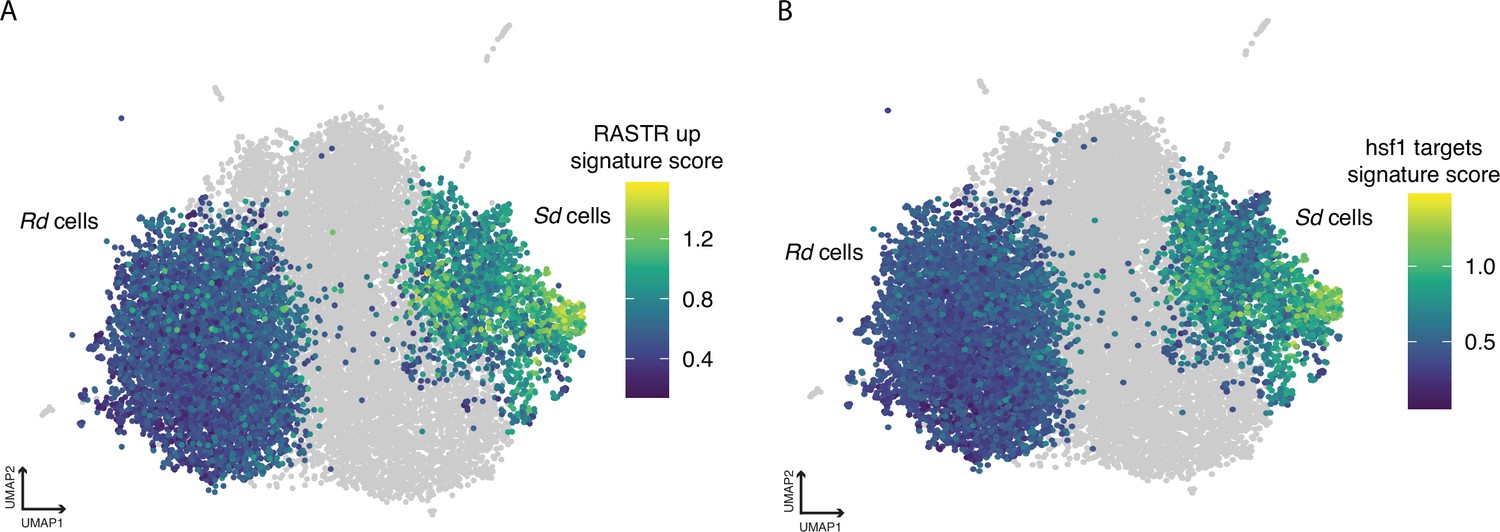
The Uniform Manifold Approximation and Projection (UMAP) embedding from Figure 3A, which contains fluconazole (FCZ) day 2 and day 3 cells.
Here, each Ribo-dominant (Rd) and Stress-dominant (Sd) cell is colored by its signature score for: (A) C. albicans orthologs of genes upregulated in ribosome assembly stress response (RASTR) and (B) constitutive targets of Hsf1.
Figure 5
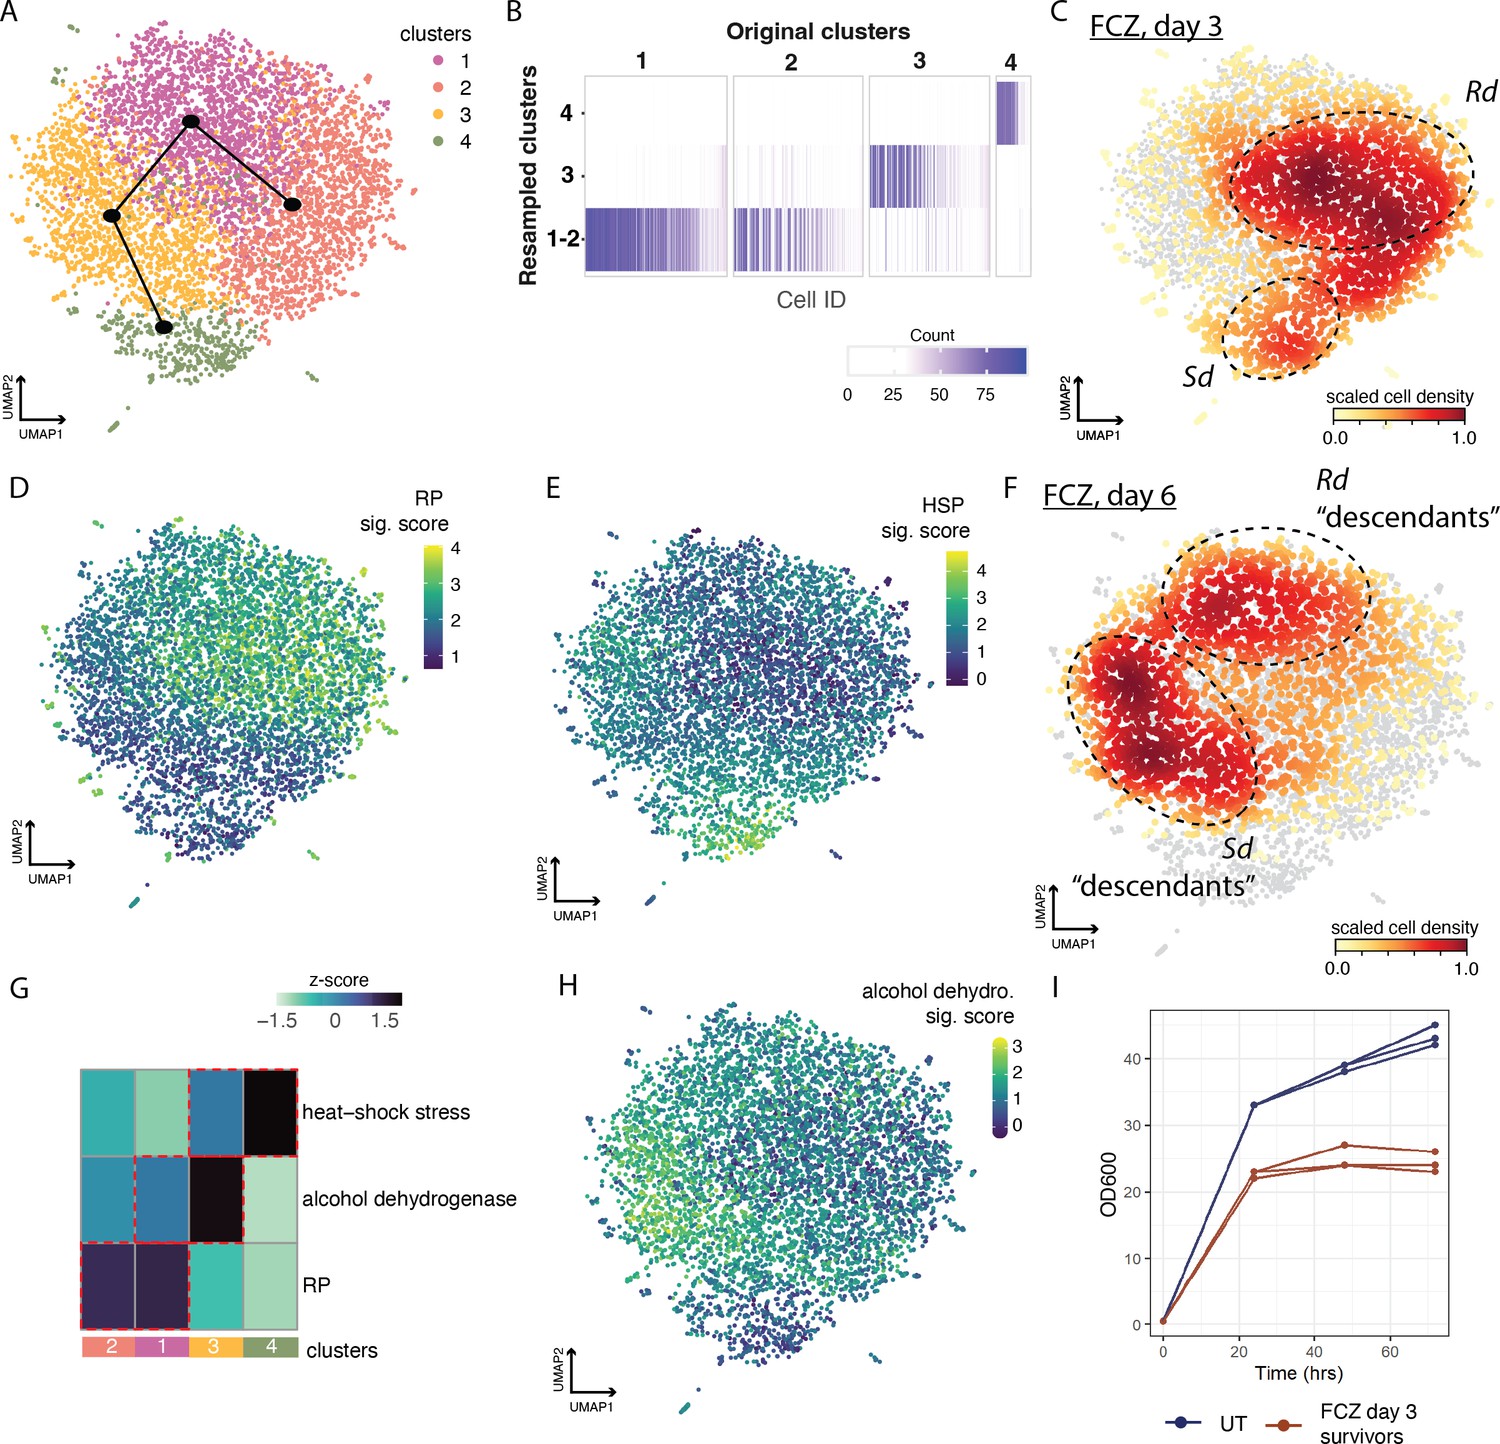
Both the Rd and Sd states persist at six days post-fluconazol treatment.
(A) Uniform Manifold Approximation and Projection (UMAP) embedding of fluconazole (FCZ)-treated cells at days 3 and 6 (after resuspension in fresh media at day 3). Leiden clustering identified four clusters. Clusters are related along the trajectory (black) from slingshot analysis. The topology suggests that FCZ Ribo-dominant (Rd) cells at day 6 evolve from FCZ Rd cells at day 3. This relationship is also true for FCZ Stress-dominant (Sd) cells. (B) The heatmap depicts cluster stability analysis for the four clusters. Purple ticks depict the number of times each cell was assigned to each of the four clusters. Cluster stability analysis failed to strongly separate clusters 1 and 2. However, both of these clusters correspond to Rd cells. (C–F, H) The UMAP embedding of cells from (A) was annotated with color bars in C–F, H to depict: (C, F) density of cells from day 3 in FCZ and (F) from day 6 (after 3 days in YPD alone); or (D, E, H) signature scores for the (D) ribosomal protein (RP), (E) heat-shock stress, and (H) alcohol dehydrogenase gene signatures. (G) A heatmap depicting the average level of activation (VISION z-scores, color bar) of different signatures across clusters presented in (A), analogous in methodology to Figure 2C. (I) Growth curves for untreated (UT) and FCZ day 3 survivor resuspended in fresh media as measured by OD600 across days.
Appendix 1—figure 1
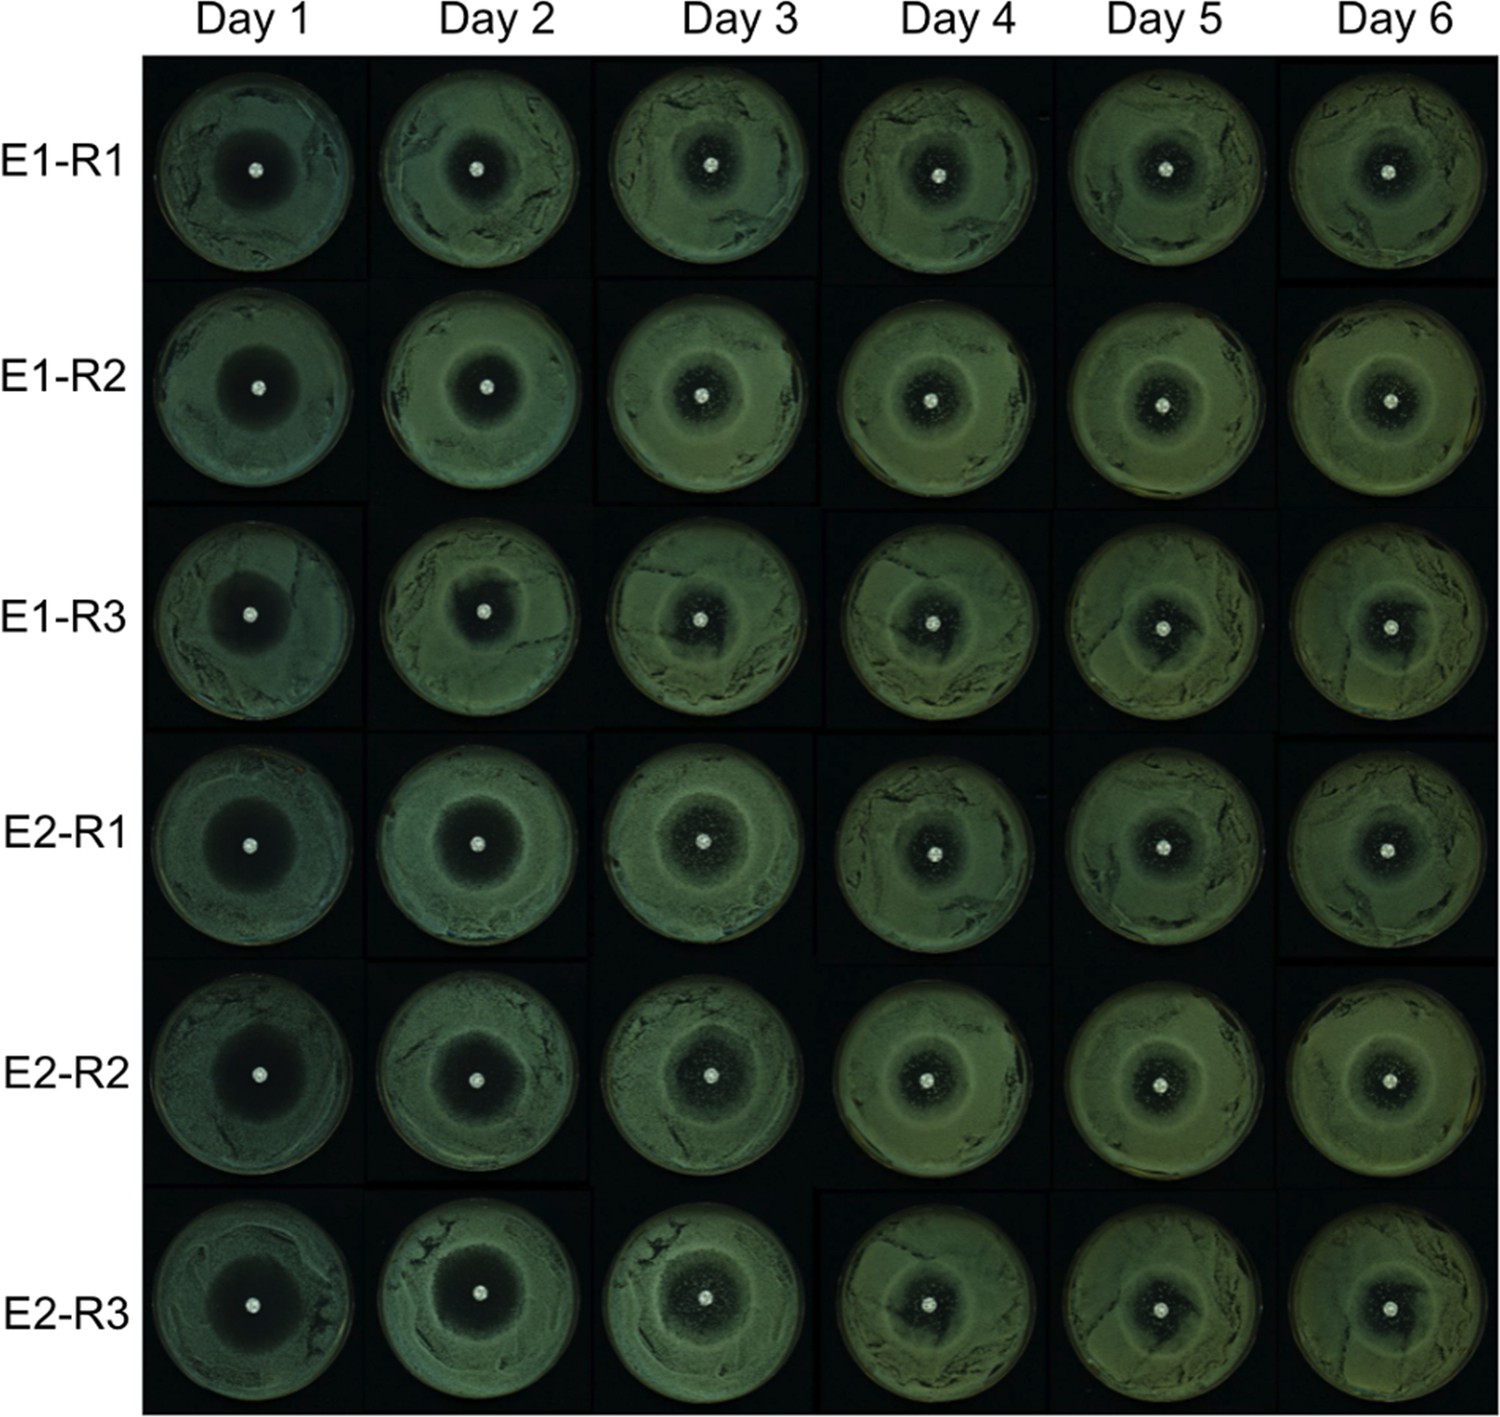
Fluconazole (FCZ) disk assay results across 6 days.
Two cultures (biological replicates E1 and E2) of C. albicans SC5314 were grown in YPD and spread on three plates (technical replicates R1, R2, and R3). The bright white spot at the center of the plate is the FCZ diffusion disk.
Appendix 1—figure 2
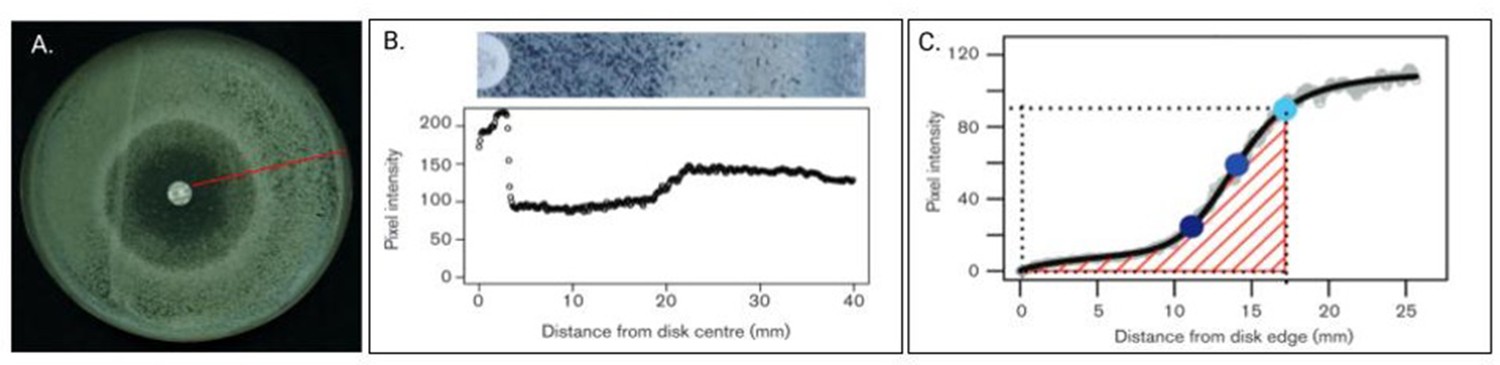
Diffusion disk assay experiments with fluconazole.
(A) A C. albicans culture with fluconazole (FCZ) disk in the middle of plate. The red radial line represents 1 of 72 measurements taken every 5°. (B) Top is a blown-up and restricted image of the red line from (A) and bottom represents the pixel intensities from 0 (edge of disk) to 40 (edge of plate). (C) Gray curves are from the 72 measured radial lines. Black represents the average of these 72 measurements per mm from disk edge (x-axis). Light blue dot is the RAD20, defined as the point where there is a 20% reduction in growth. Middle blue dot is the RAD50 and dark blue represents the RAD80. The FoG20 is defined as the fraction of the area under the black line from 0 to the RAD20 (i.e., the amount of growth observed) divided by the total potential growth (delimited by dotted line). The FoG50 and FoG80 are defined analogously (adapted from Gerstein et al., 2016).
Appendix 2—figure 1
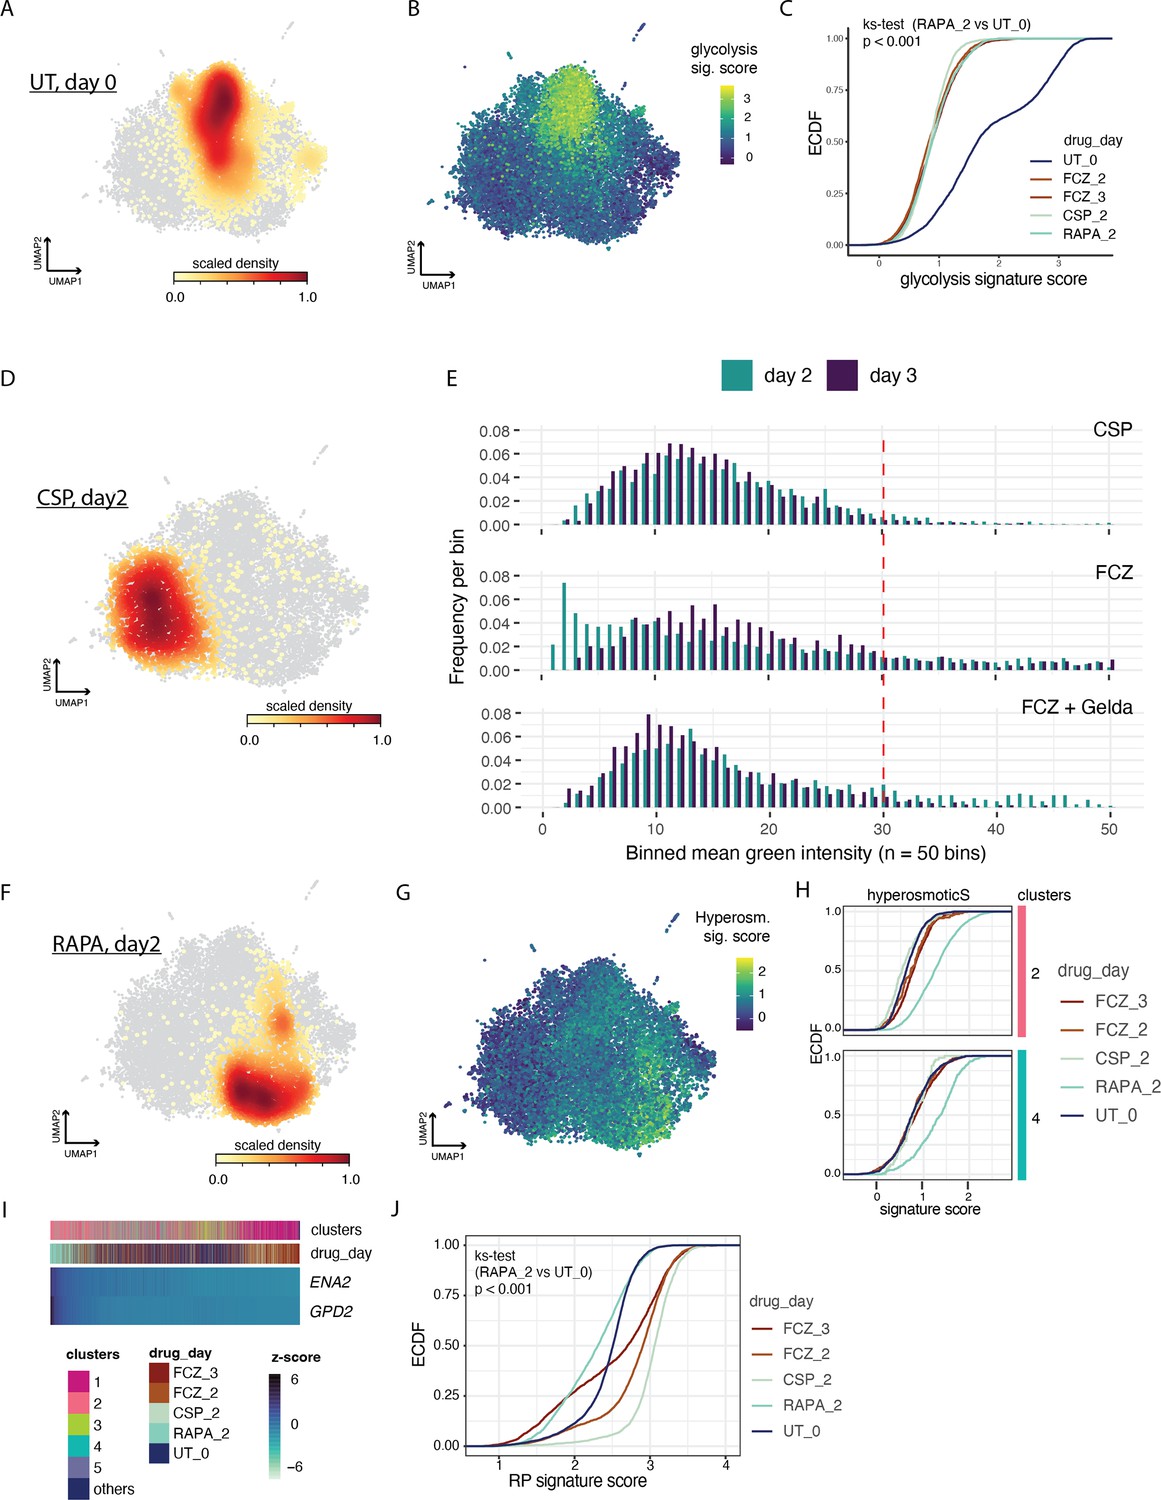
Single cell analysies of additional anti-fungal drugs.
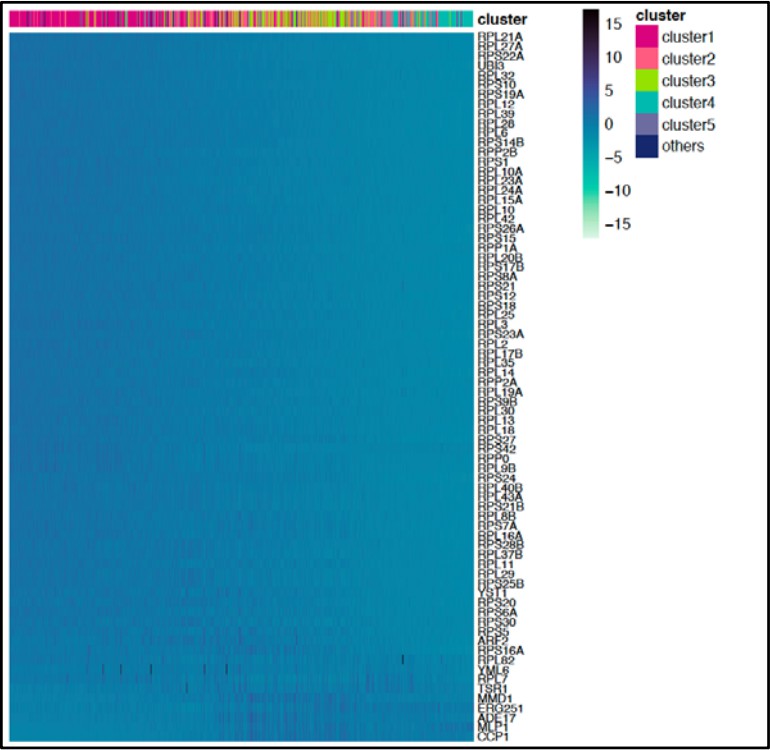
(A, B, D–F) Uniform Manifold Approximation and Projection (UMAP) embedding from Figure 3A. Color bar depicts: (A) density of untreated (UT) cells, (B) expression score for the glycolysis signature. (C) Empirical cumulative distribution (ECDF) of the glycolysis signature scores for each cell in the different conditions (drug_day, color); Kolmogorov-Smirnoff test, p < 0.001. (D) Density of caspofungin (CSP) cells at day 2. (E) Histograms depicting expression of heat-shock protein 70 (HSP70) in (i) CSP or (ii) fluconazole (FCZ)-treated cells after 2 days (green) 29 and 3 days (blue) exposure. (F) Density of rapamycin (RAPA) cells after 2 days of exposure. Cells with high expression of HSP70 fall to the right of the dashed red line. There is a statistically significant depletion of cells highly expressing HSP70 (a marker of Sd; KM test, p < 0.01). (G) Score for the hyperosmotic stress signature mapped onto the UMAP embedding from Figure 3A. (H) ECDF of the hyperosmotic stress (hyperosmosticS) signature score for each cell in clusters 2 (top) and 4 (bottom) for the different conditions (drug_day, color). (I) The heatmap depicts genes (rows) in the hyperosmotic stress signature with significant variability and consistent expression across cells (columns). We used MAGIC to impute expression levels (z-score, color bar). Cells are linearly ordered by the overall magnitude of gene expression (mean gene rank). ‘Clusters’ (top) indicates the Leiden cluster of origin for each cell and ‘drug_day’ indicates the condition for each cell. (J) ECDF of signature scores for each cell under the different conditions (color) (ks-test, Kolmogorov-Smirnoff test).
Appendix 2—figure 2
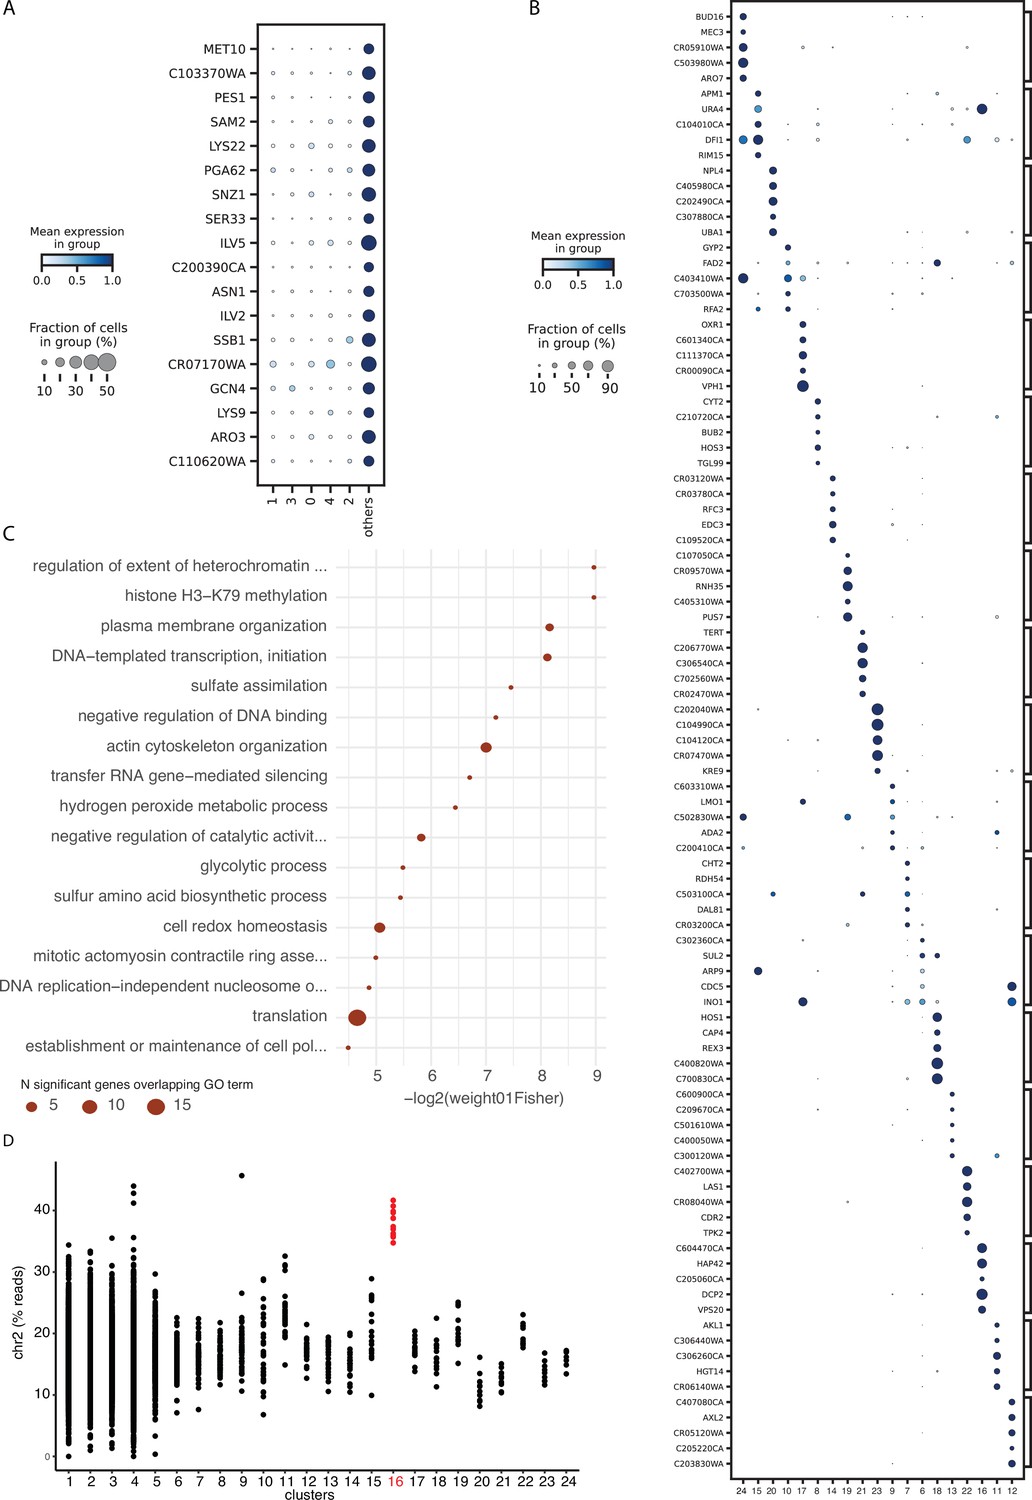
Differentially expressed genes and pathways associated with comets.
(A) Genes overexpressed in the collection of 19 comets compared to other cells in main clusters (Bayes factor > 2.5 and proportion of non-zero value > 0.2). Color bar indicates the mean expression across the cells in each cluster. The size of the dot indicates the proportion of cells which express that gene within each cluster. (B) Similar plot than (A) for genes differentially expressed in each comet cluster compared to others (Bayes factor > 3 and proportion of non-zero value > 0.2). (C) Gene ontology (GO) enrichment for genes identified as differentially expressed in comets compared to other clusters using pseudo-bulk differential expression analysis (60 genes; FDR < 0.1 ; Appendix 2—figure 2—source data 1, 2).The size of the dot is proportional to the number of genes in the list which overlap with the corresponding GO term. (D) Percent of reads assigned to genes in chromosome 2 for each cell classified in the 24 distinct clusters.
-
Appendix 2—figure 2—source data 1
Differentially expressed genes in cells classified in the comet clusters (pseudo-bulk samples) compared to other fluconazole (FCZ)-treated cells (pseudo-bulk samples).
baseMean = the average of the normalized counts taken over all pseudo-bulk samples; log2FoldChange = log2 fold change between the groups; lfcSE = standard error of the log2FoldChange estimate; stat = Wald statistic; pvalue = Wald test p-value; padj = Benjamini-Hochberg adjusted p-value.
- https://cdn.elifesciences.org/articles/81406/elife-81406-app2-fig2-data1-v2.xlsx
-
Appendix 2—figure 2—source data 2
Gene ontology terms enriched in genes differentially expressed between comets (pseudo-bulk) and other fluconazole (FCZ)-treated cells (pseudo-bulk) listed in Figure 3—table supplement 1A.
- https://cdn.elifesciences.org/articles/81406/elife-81406-app2-fig2-data2-v2.xlsx
Author response image 1
The heatmap depicts the expression of the most variable IFH1 targets (rows) across cells (columns).
We used MAGIC to impute expression levels (z-score, color bar). Cells are linearly ordered by the overall magnitude of gene expression (mean gene rank). “Clusters” (top) indicate in which cluster the cell is assigned. Recall that cluster 1 (red) corresponds to α/Rd and cluster 4 (turquoise) corresponds to β/Sd. Cluster 3 corresponds to untreated cells.
Author response image 2
Tables
Table 1
(A) Orthologous genes in C. albicans associated with ribosome assembly stress response (RASTR) in S. cerevisiae.
(B) Constitutive Hsf1 target genes.
| RASTR signature (Albert et al., 2019) | ||
|---|---|---|
| DOWN | Ribosome processing | ASC1, RPL10, RPL10A, RPL11, RPL12, RPL13, RPL14, RPL16A, RPL17B, RPL18, RPL19A, RPL2, RPL20B, RPL21A, RPL23A, RPL24A, RPL25, RPL27A, RPL28, RPL30, RPL32, RPL35, RPL37B, RPL38, RPL39, RPL42, RPL5, RPL6, RPL8B, RPL9B, RPP0, RPP1B, RPS1, RPS10, RPS12, RPS13, RPS14B, RPS15, RPS16A, RPS17B, RPS18, RPS19A, RPS20, RPS21, RPS21B, RPS22A, RPS23A, RPS25B, RPS26A, RPS27, RPS27A, RPS3, RPS5, RPS6A, RPS7A, RPS8A, RPS9B, UBI3, YST1 |
| UP | Protein folding, response to heat, proteolysis | UBI4, RPN4, PIN3, STF2, KAR2, MSI3, HSP60, HSP90, HSP70, SIS1, SSA2, HSP104, HSP78, STI1 |
| Glucose and pyruvate metabolic process | CYP1, PMA1, GLK1, TDH3, CDC19, PGK1 | |
| Unknown function | MBF1, KRE30, YDJ1, YBN5, ACT1, UBC4 | |
| Hsf1 constitutive targets (Leach et al., 2016) | ||
| ACE2, ADAEC, AHA1, ALO1, ALS1, ALS3, ALS4, ASR1, BOI2, BUL1, CCP1, CDC37, CDC48, CPR6, CRD2, CTF1, CYC1, CYP1, ERG2, GAP1, GIT3, GLX3, GOR1, GPX2, GPX3, GRP2, HCH1, HSF1, HSP104, HSP21, HSP60, HSP70, HSP78, HSP90, IFA14, ITR1, KAR2, MDJ1, MGE1, MIA40, MNN24, MSI3, PDC11, PGA56, PGA62, POR1, ROB1, RPM2, RPN4, RPS27A, SBA1, SBP1, SGT2, SIS1, SOK1, SSA2, SSC1, STI1, TRX1, TSA1, TSA1B, YDJ1, YWP1, ZCF35, ZPR1, ZWF1 | ||
Appendix 1—table 1
Two biological (independent) C. albicans SC534 cultures and three technical replicates were subjected to fluconazole (FCZ) diffusion disk assay (DDA) experiments and averaged.
The table represents the output from diskimageR over 6 days of imaging. The increase in tolerance, which is measured by the fraction of growth (FoG), from day 1 to day 2 is significant as is the increase from day 2 to day 3 (both p<0.001, Kruskal-Wallis χ 2). There is a slight but statistically reduction in the RAD20, suggesting that there has been a small increase in resistance (p<0.05, Kruskal-Wallis χ2). However, we can see that the vast majority of the culture is not resistant.
| Day | FoG | RAD20 |
|---|---|---|
| 1 | 0.14 | 16.33 |
| 2 | 0.21 | 14.17 |
| 3 | 0.37 | 12.67 |
| 4 | 0.37 | 13.00 |
| 5 | 0.38 | 12.83 |
| 6 | 0.4 | 13.00 |
Additional files
-
MDAR checklist
- https://cdn.elifesciences.org/articles/81406/elife-81406-mdarchecklist1-v2.docx
-
Appendix 2—figure 2—source data 1
Differentially expressed genes in cells classified in the comet clusters (pseudo-bulk samples) compared to other fluconazole (FCZ)-treated cells (pseudo-bulk samples).
baseMean = the average of the normalized counts taken over all pseudo-bulk samples; log2FoldChange = log2 fold change between the groups; lfcSE = standard error of the log2FoldChange estimate; stat = Wald statistic; pvalue = Wald test p-value; padj = Benjamini-Hochberg adjusted p-value.
- https://cdn.elifesciences.org/articles/81406/elife-81406-app2-fig2-data1-v2.xlsx
-
Appendix 2—figure 2—source data 2
Gene ontology terms enriched in genes differentially expressed between comets (pseudo-bulk) and other fluconazole (FCZ)-treated cells (pseudo-bulk) listed in Figure 3—table supplement 1A.
- https://cdn.elifesciences.org/articles/81406/elife-81406-app2-fig2-data2-v2.xlsx
Download links
A two-part list of links to download the article, or parts of the article, in various formats.
Downloads (link to download the article as PDF)
Open citations (links to open the citations from this article in various online reference manager services)
Cite this article (links to download the citations from this article in formats compatible with various reference manager tools)
Candida albicans exhibits heterogeneous and adaptive cytoprotective responses to antifungal compounds
eLife 12:e81406.
https://doi.org/10.7554/eLife.81406


