Deep proteome profiling reveals signatures of age and sex differences in paw skin and sciatic nerve of naïve mice
- Systems Biology of Pain, Division of Pharmacology & Toxicology, Department of Pharmaceutical Sciences, Faculty of Life Sciences, University of Vienna, Austria
Figures
Figure 1 with 1 supplement
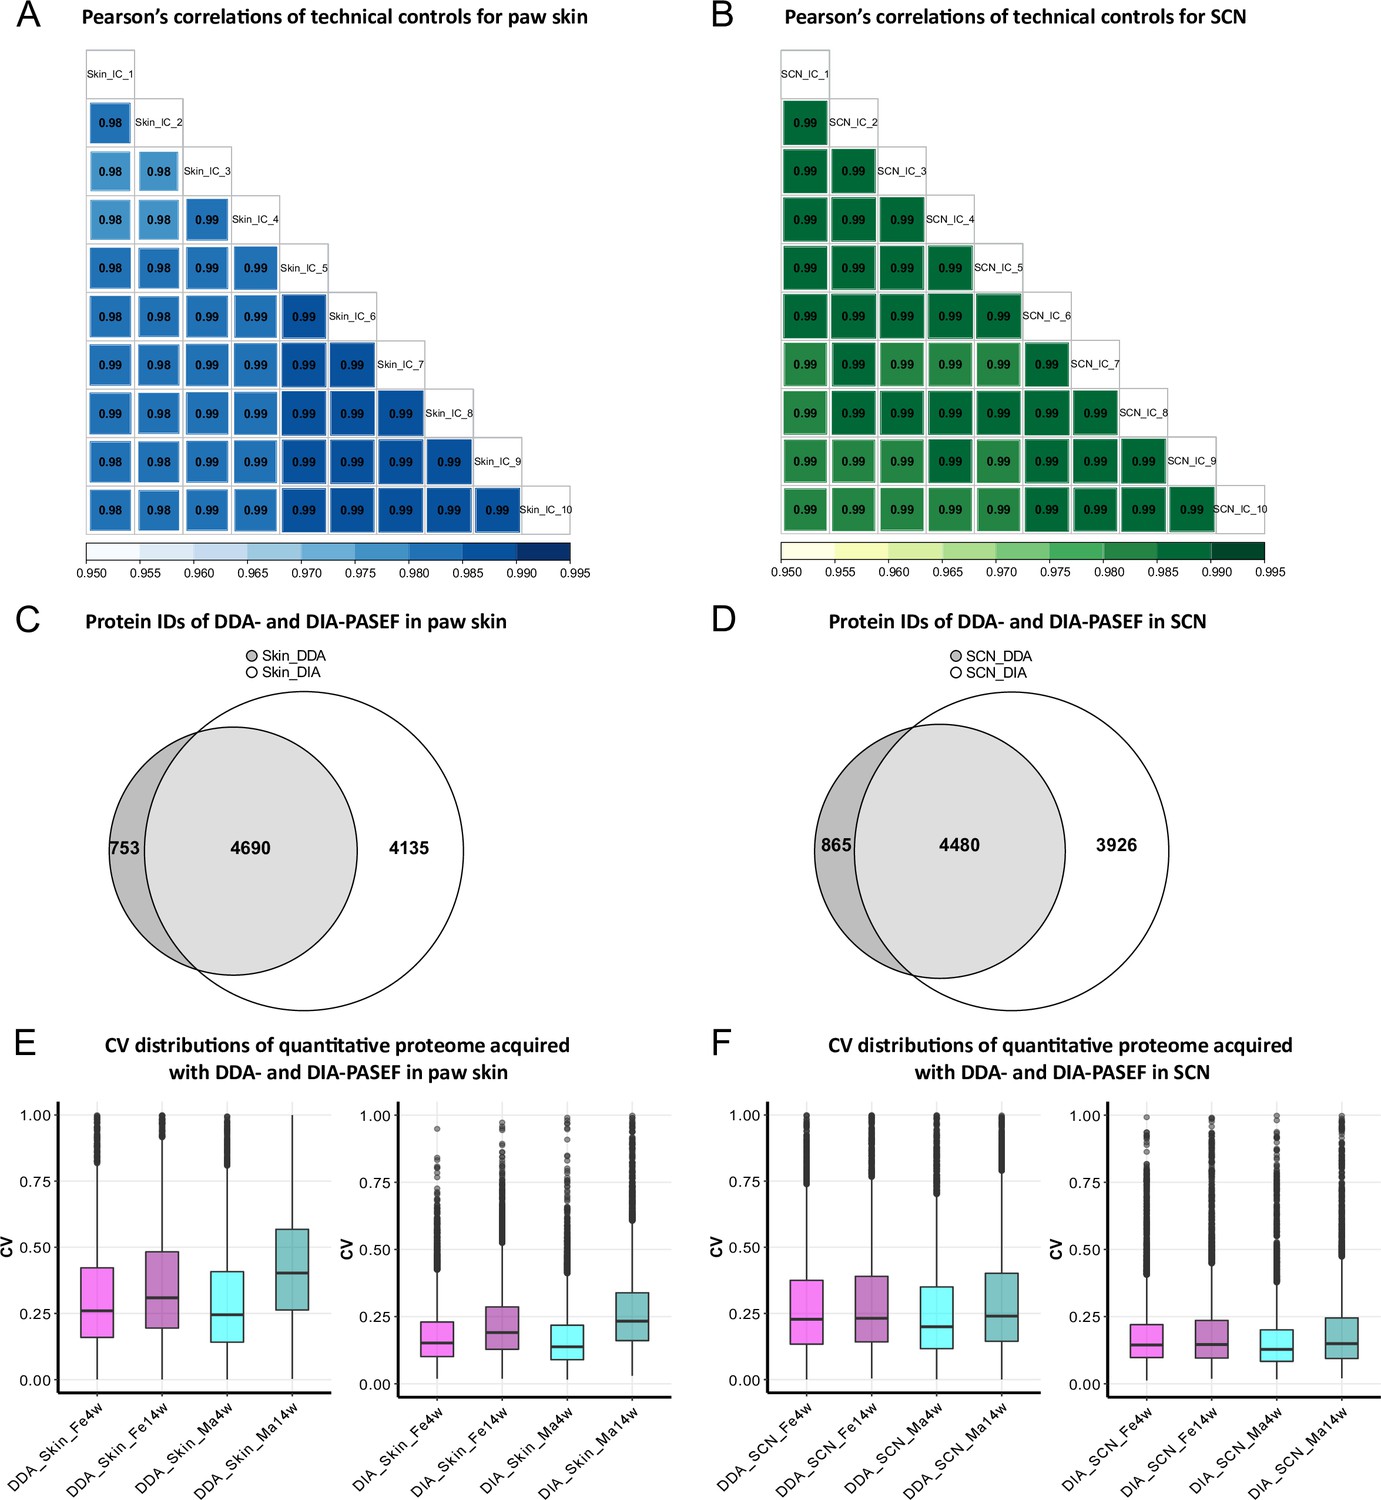
Data-independent acquisition paired with parallel accumulation serial fragmentation (DIA-PASEF) acquisition followed by DIA-NN analysis outperforms data-dependent acquisition paired with PASEF (DDA-PASEF) acquisition in deep proteome profiling of paw skin and sciatic nerve (SCN) of naïve mice.
(A, B) Pearson’s correlations of technical controls of paw skin (blue) and SCN (green) acquired over 20 days on a timsTOF Pro. (C, D) Comparisons of identified protein groups (protein IDs) using DDA- and DIA-PASEF workflows in paw skin (C) and SCN (D). (E, F) Coefficient of variation (CV) distributions of quantitative proteomes using DDA- and DIA-PASEF in paw skin (E) and SCN (F) of 4-week and 14-week-old males (cyan) and females (magenta).
-
Figure 1—source data 1
Quantitative proteome and differentially expressed protein (DEP) lists of paw skin.
DEPs from age- and sex-dependent comparisons are listed in separated sheets.
- https://cdn.elifesciences.org/articles/81431/elife-81431-fig1-data1-v1.xlsx
-
Figure 1—source data 2
Quantitative proteome and differentially expressed protein (DEP) lists of sciatic nerve (SCN).
DEPs from age- and sex-dependent comparisons are listed in separated sheets.
- https://cdn.elifesciences.org/articles/81431/elife-81431-fig1-data2-v1.xlsx
Figure 1—figure supplement 1
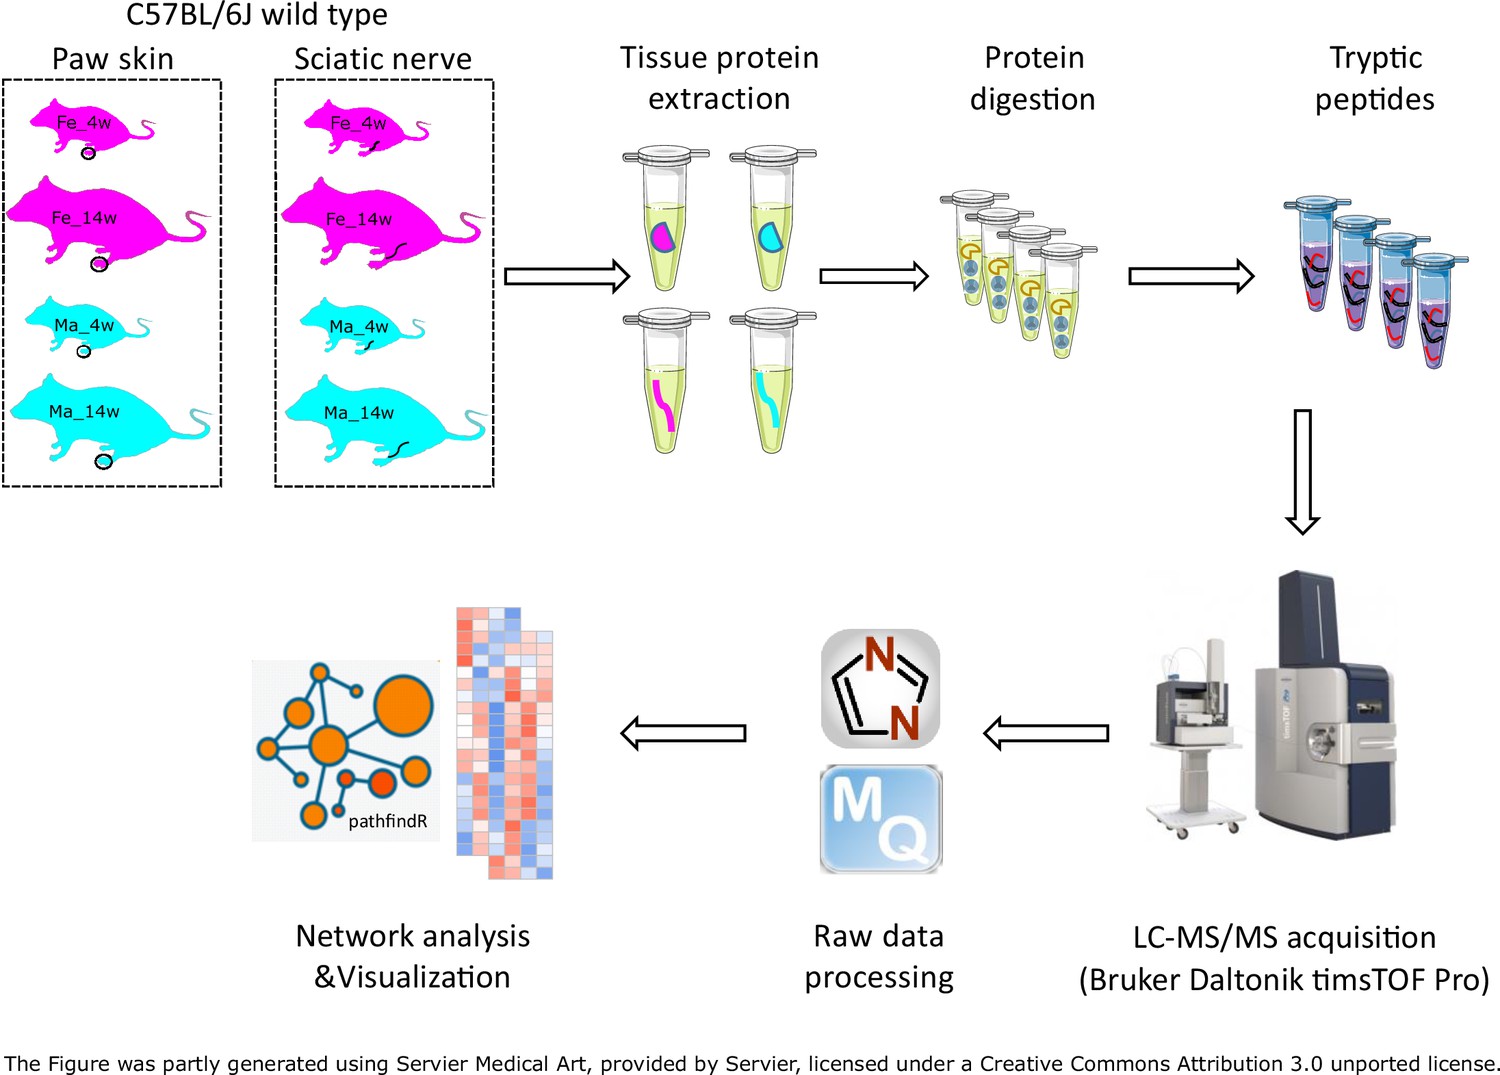
Experimental workflow of proteome profiling in mouse paw skin and sciatic nerves.
Figure 2 with 1 supplement
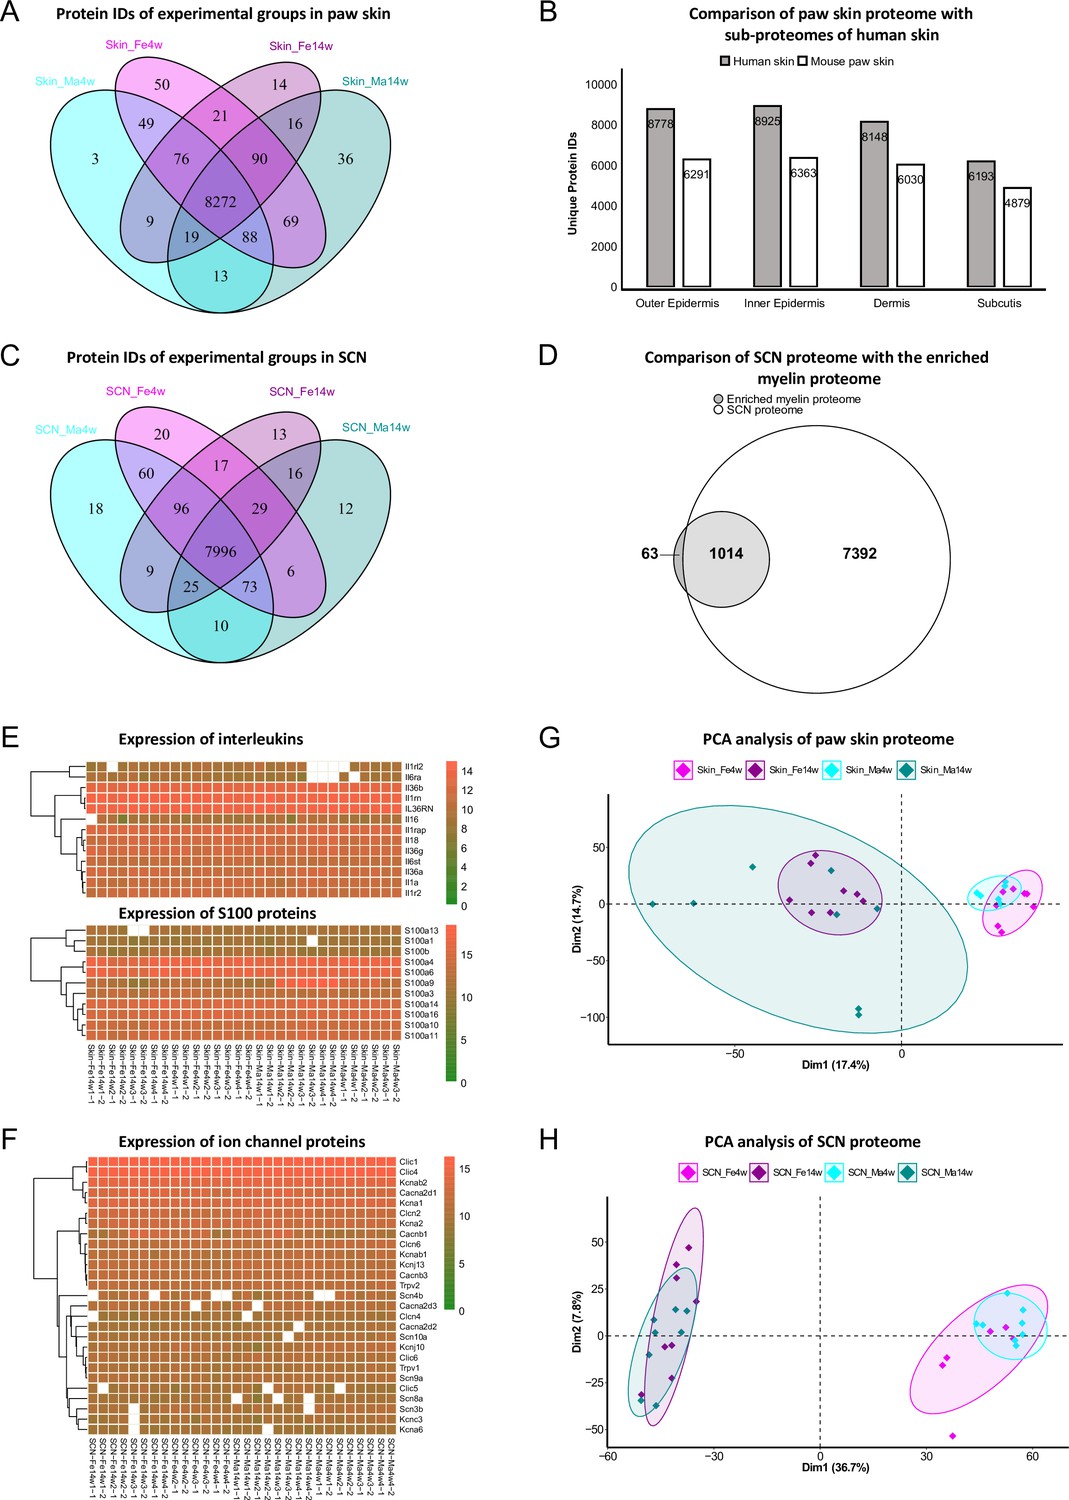
Age and sex differences in proteomes of paw skin and sciatic nerve (SCN).
(A) Venn diagram shows unique and shared protein IDs across age and sex groups of paw skin. (B) Comparison of the quantified paw skin proteome with previously reported sub-proteomes of human skin (Dyring-Andersen et al., 2020) indicates high coverage in our proteome data. (C) Venn diagram shows unique and shared protein IDs across age and sex groups of SCN. (D) Our SCN proteome dataset harbors 1014 myelin proteins, i.e. 94% of the previously reported myelin proteome (Siems et al., 2020). (E) Heatmaps show the expression of interleukin and S100 protein families across all paw skin samples. (F) Heatmap shows the expression of ion channel proteins quantified across all SCN samples. Color legends are coded based on log2-transformed protein intensities. (G, H) Principal component analysis (PCA) reveals age as a prominent variable in paw skin and SCN tissues.
-
Figure 2—source data 1
List of myelin proteins (Siems et al., 2020) not quantified in the sciatic nerve (SCN) proteome.
- https://cdn.elifesciences.org/articles/81431/elife-81431-fig2-data1-v1.xlsx
Figure 2—figure supplement 1
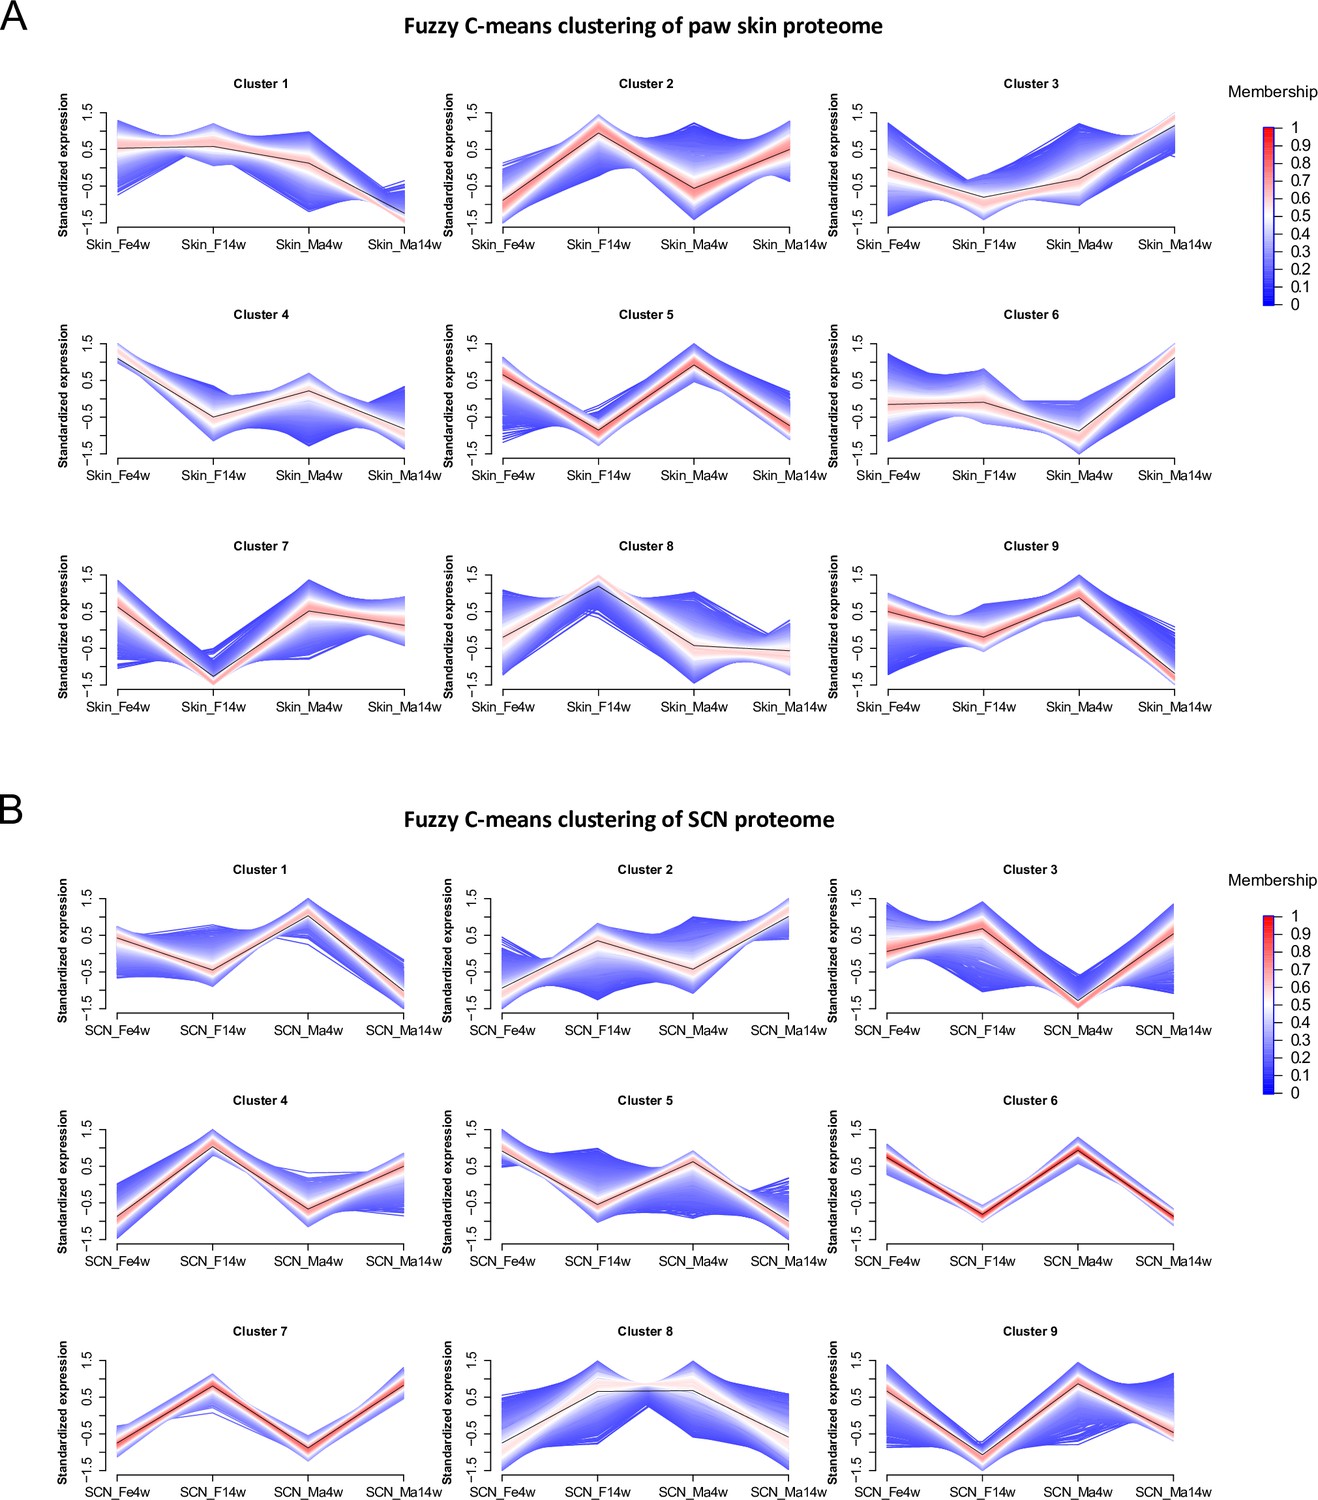
Fuzzy C-means clustering analysis of the paw skin (A) and sciatic nerve (SCN) (B) proteome.
The R package ‘Mfuzz’ (https://www.bioconductor.org/packages/release/bioc/html/Mfuzz.html) was used for analysis with nine clusters specified for calculation. Y-axis shows the standardized log2-transformed intensity. The color-coded membership value indicates how well one protein is represented by a certain cluster.
Figure 3 with 1 supplement
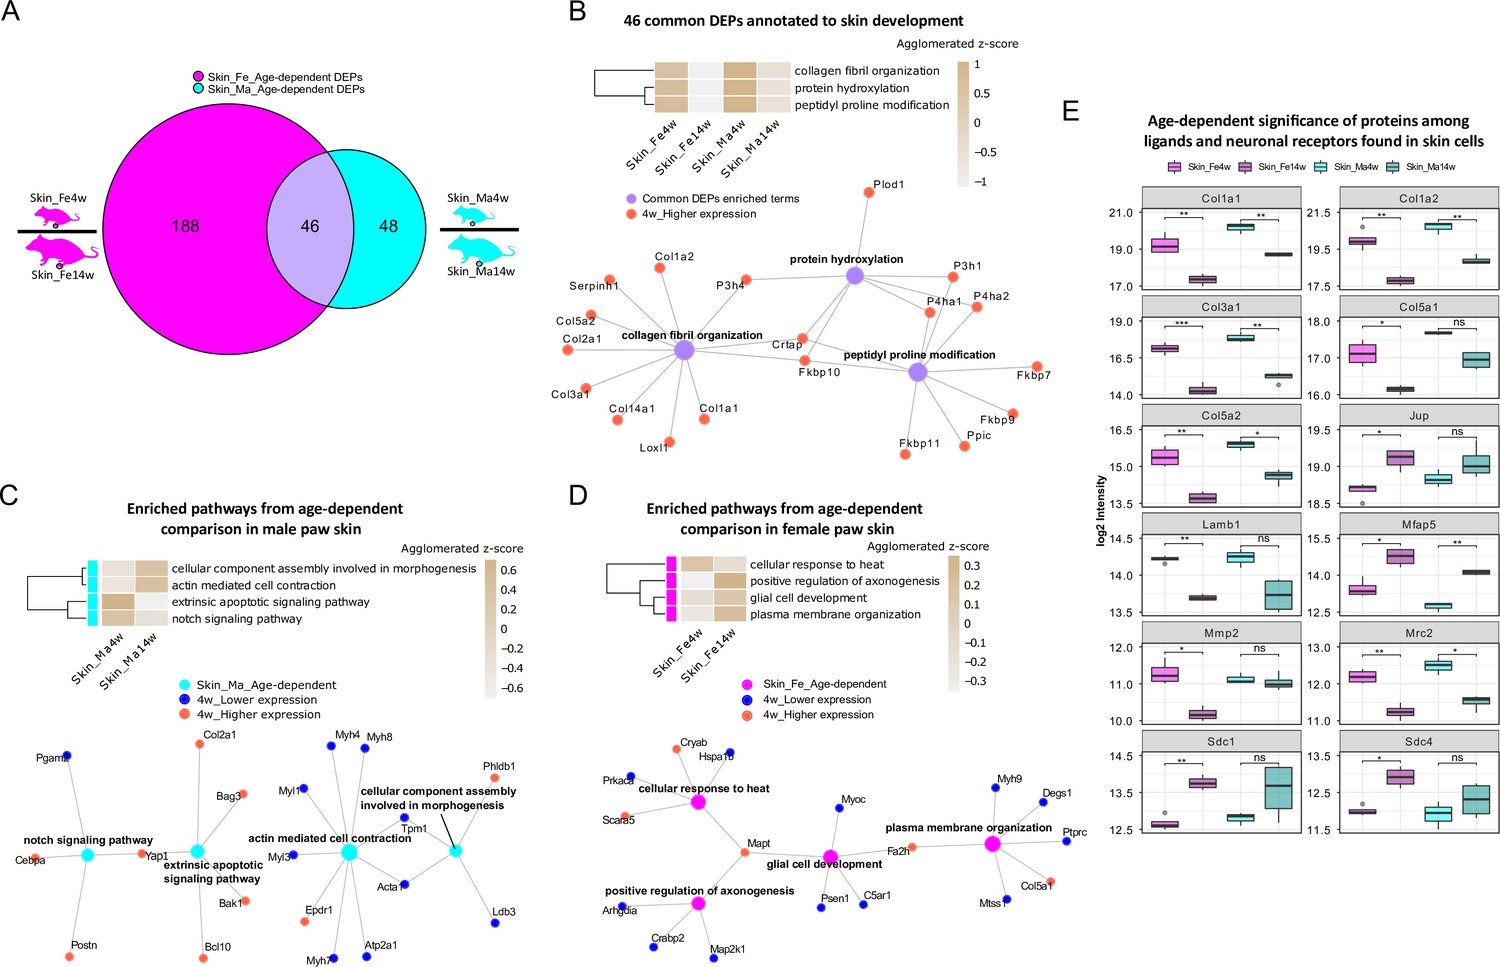
Differential expression analysis of paw skin samples reveals diverse age-dependent biological pathways in male and female mice.
(A) Venn diagram illustrates unique and shared differentially expressed proteins (DEPs; criteria: q-value ≤ 0.05, absolute log2 fold change [FC] ≥ 0.585, i.e., an absolute FC of 1.5) from age-dependent comparisons in female (magenta) and male (cyan) paw skin. (B) 46 common DEPs (A) are annotated to pathways related to skin development. The agglomerated z-score of each pathway is visualized in the heatmap. Common DEPs are annotated to three interconnected pathways. All proteins annotated here were highly expressed in 4-week paw skin (red filled circle). (C, D) Enriched interconnected pathways from age-dependent comparison in male (cyan) and female (magenta) mice. Red: higher expression at 4 weeks; blue: lower expression at 4 weeks. (E) Ligands and neuronal receptors found in skin cells (Wangzhou et al., 2021) are significantly regulated by age. Significance levels are indicated as ns, q-value > 0.05, *q-value ≤ 0.05, **q-value ≤ 0.01, ***q-value ≤ 0.001, and ****q-value ≤ 0.0001.
-
Figure 3—source data 1
List of ligands and neuronal receptors found in skin cell types (Wangzhou et al., 2021), which we quantified in the paw skin proteome.
- https://cdn.elifesciences.org/articles/81431/elife-81431-fig3-data1-v1.xlsx
Figure 3—figure supplement 1
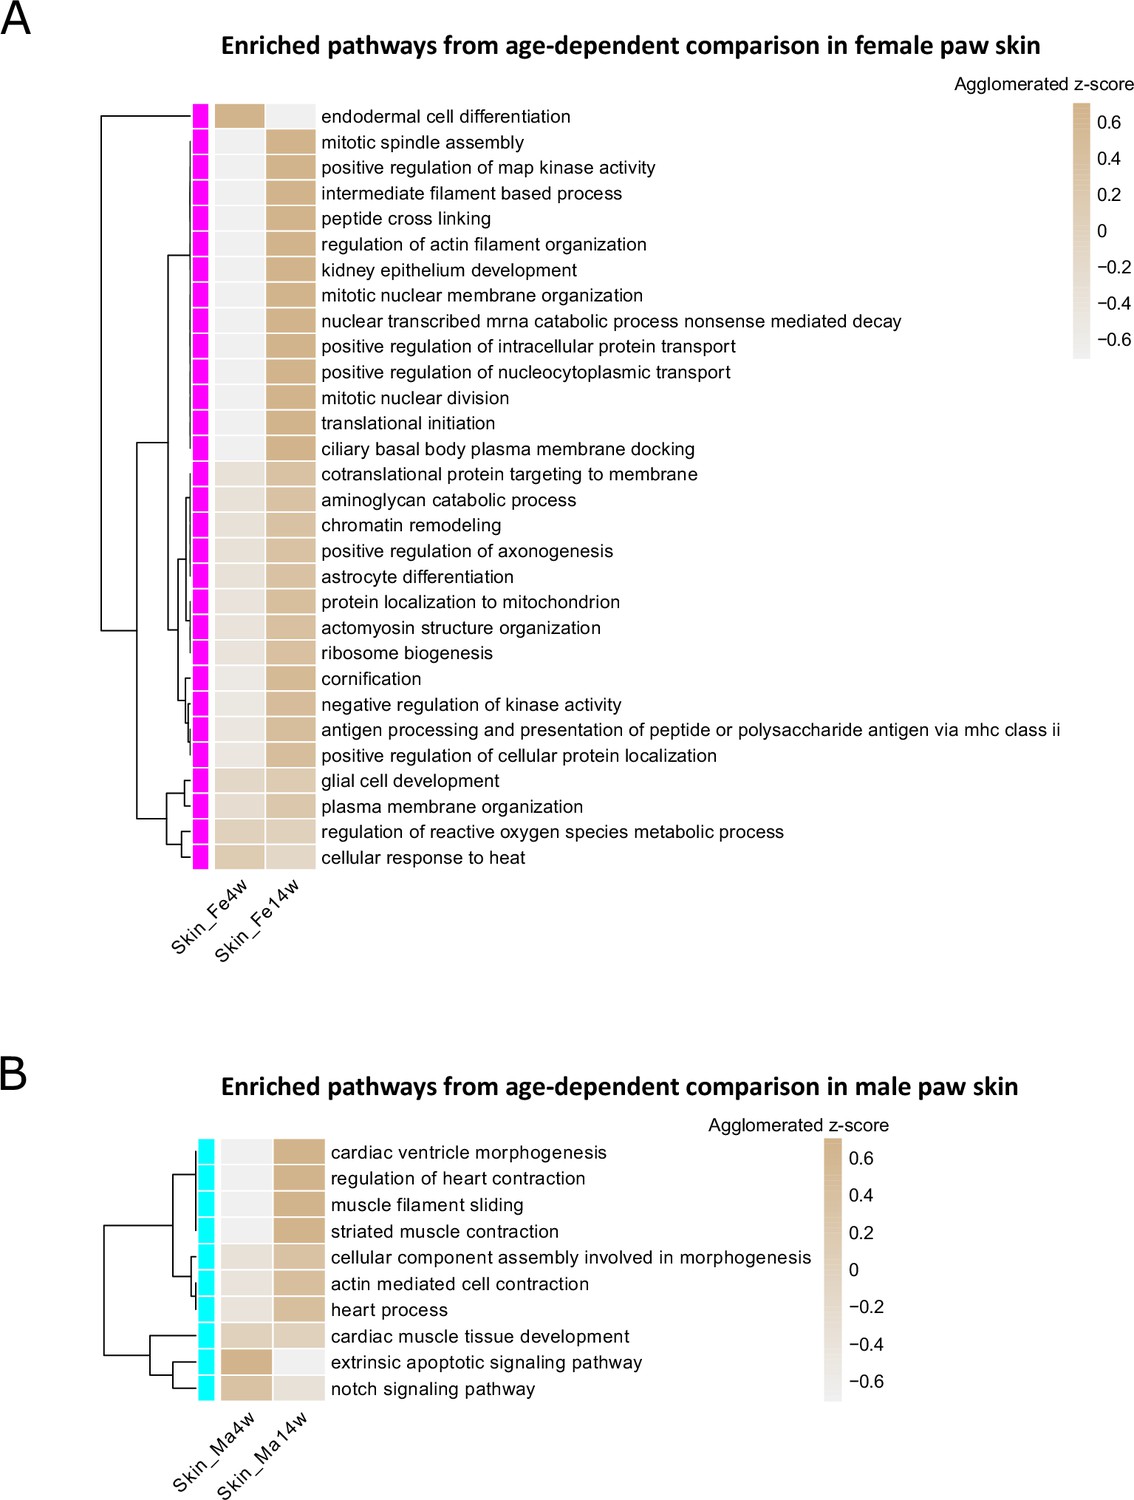
Gene Ontology Biological Process (GO-BP) analysis of differentially expressed proteins (DEPs) from age-dependent comparisons in female (A) and male (B) paw skin.
Figure 4 with 1 supplement
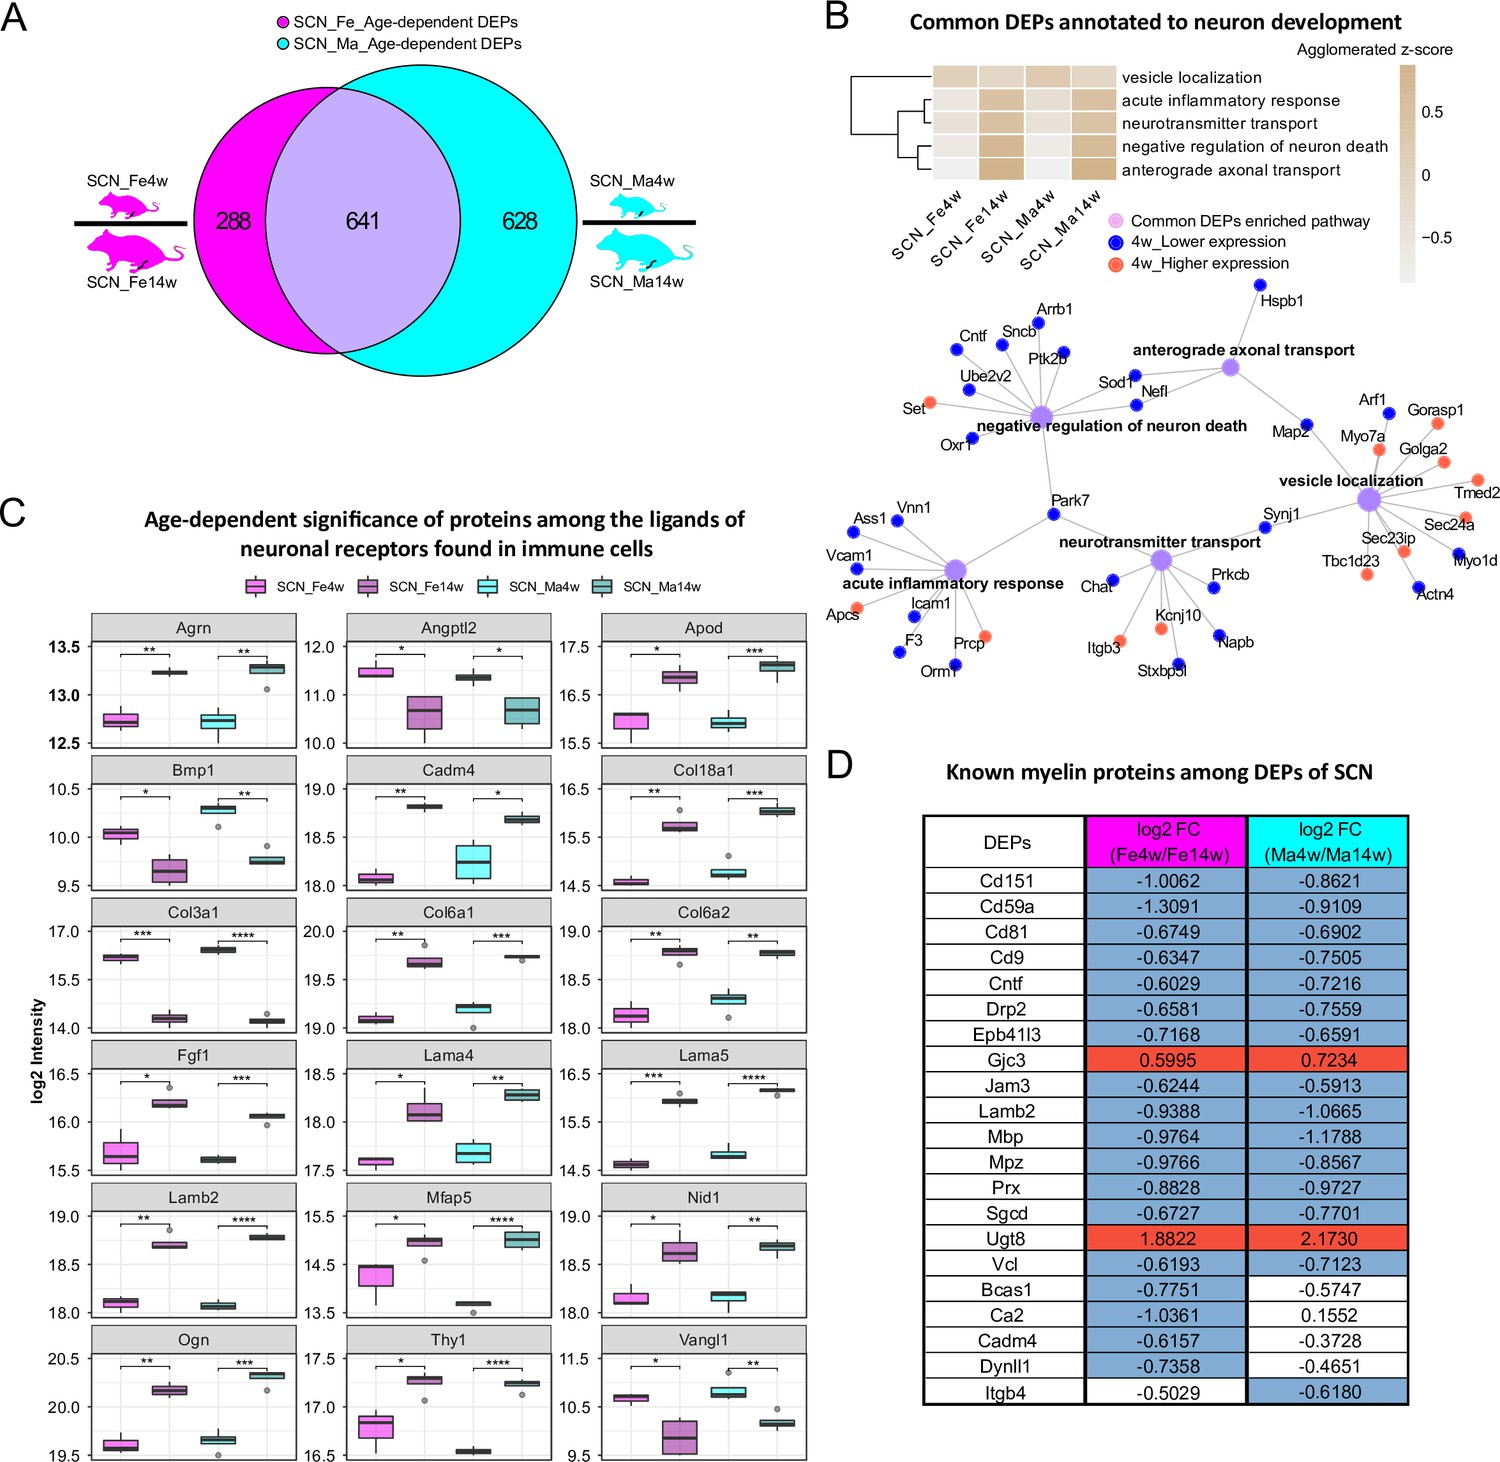
Age-dependent differential expression analysis in sciatic nerve (SCN) samples.
(A) Venn diagram illustrates unique and shared differentially expressed proteins (DEPs) (criteria: q-value ≤ 0.05, absolute log2 fold change [FC] ≥ 0.585, i.e., an absolute FC of 1.5) from age-dependent comparisons in female (magenta) and male (cyan) SCN. (B) Common DEPs are annotated to pathways related to neuronal function and inflammation. The agglomerated z-score of each pathway is visualized in the heatmap. Red: proteins more abundant at 4 weeks; blue: proteins less expressed at 4 weeks. (C) Eighteen ligands of neuronal receptors found in immune cells (Wangzhou et al., 2021) are significantly regulated by age. Significance levels are indicated as: ns, q-value > 0.05, *q-value ≤ 0.05, **q-value ≤ 0.01, ***q-value ≤ 0.001, and ****q-value ≤ 0.0001. (D) Log2 FC of previously reported myelin proteins (Siems et al., 2020) in our age-dependent SCN datasets. Red: higher expression at 4 weeks; blue: lower expression at 4 weeks; white: not significantly regulated.
-
Figure 4—source data 1
Synaptic proteins among differentially expressed proteins (DEPs) from age-dependent comparisons in sciatic nerve (SCN).
- https://cdn.elifesciences.org/articles/81431/elife-81431-fig4-data1-v1.xlsx
-
Figure 4—source data 2
Ligand list of neuronal receptors found in immune cells (Wangzhou et al., 2021), which we quantified in the sciatic nerve (SCN) proteome.
- https://cdn.elifesciences.org/articles/81431/elife-81431-fig4-data2-v1.xlsx
-
Figure 4—source data 3
Neuronal ligands of glial receptors (Wangzhou et al., 2021), which we quantified in the sciatic nerve (SCN) proteome.
- https://cdn.elifesciences.org/articles/81431/elife-81431-fig4-data3-v1.xlsx
-
Figure 4—source data 4
Glial ligands of neuronal receptors (Wangzhou et al., 2021), which we quantified in the sciatic nerve (SCN) proteome.
- https://cdn.elifesciences.org/articles/81431/elife-81431-fig4-data4-v1.xlsx
Figure 4—figure supplement 1
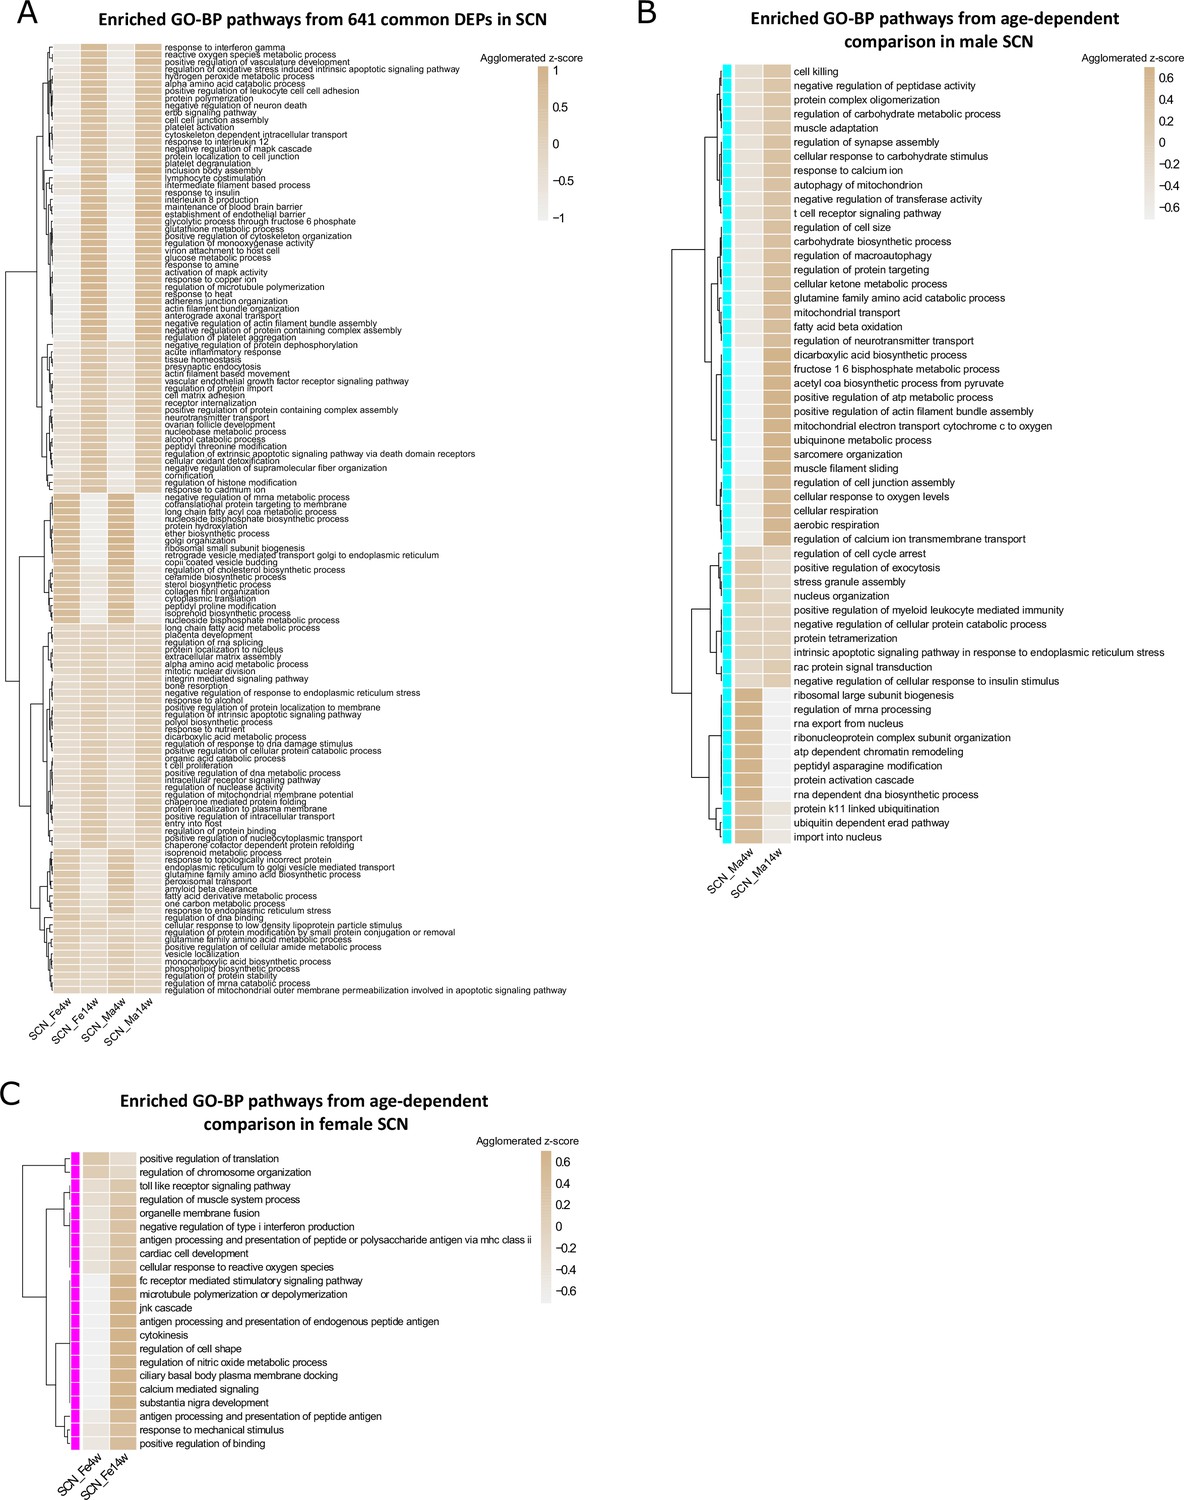
Enriched Gene Ontology Biological Process (GO-BP) terms and their activity scores in age-dependent comparisons using common differentially expressed proteins (DEPs) (A) and DEPs enriched in male sciatic nerve (SCN) (B) and female SCN (C), respectively.
Figure 5 with 1 supplement
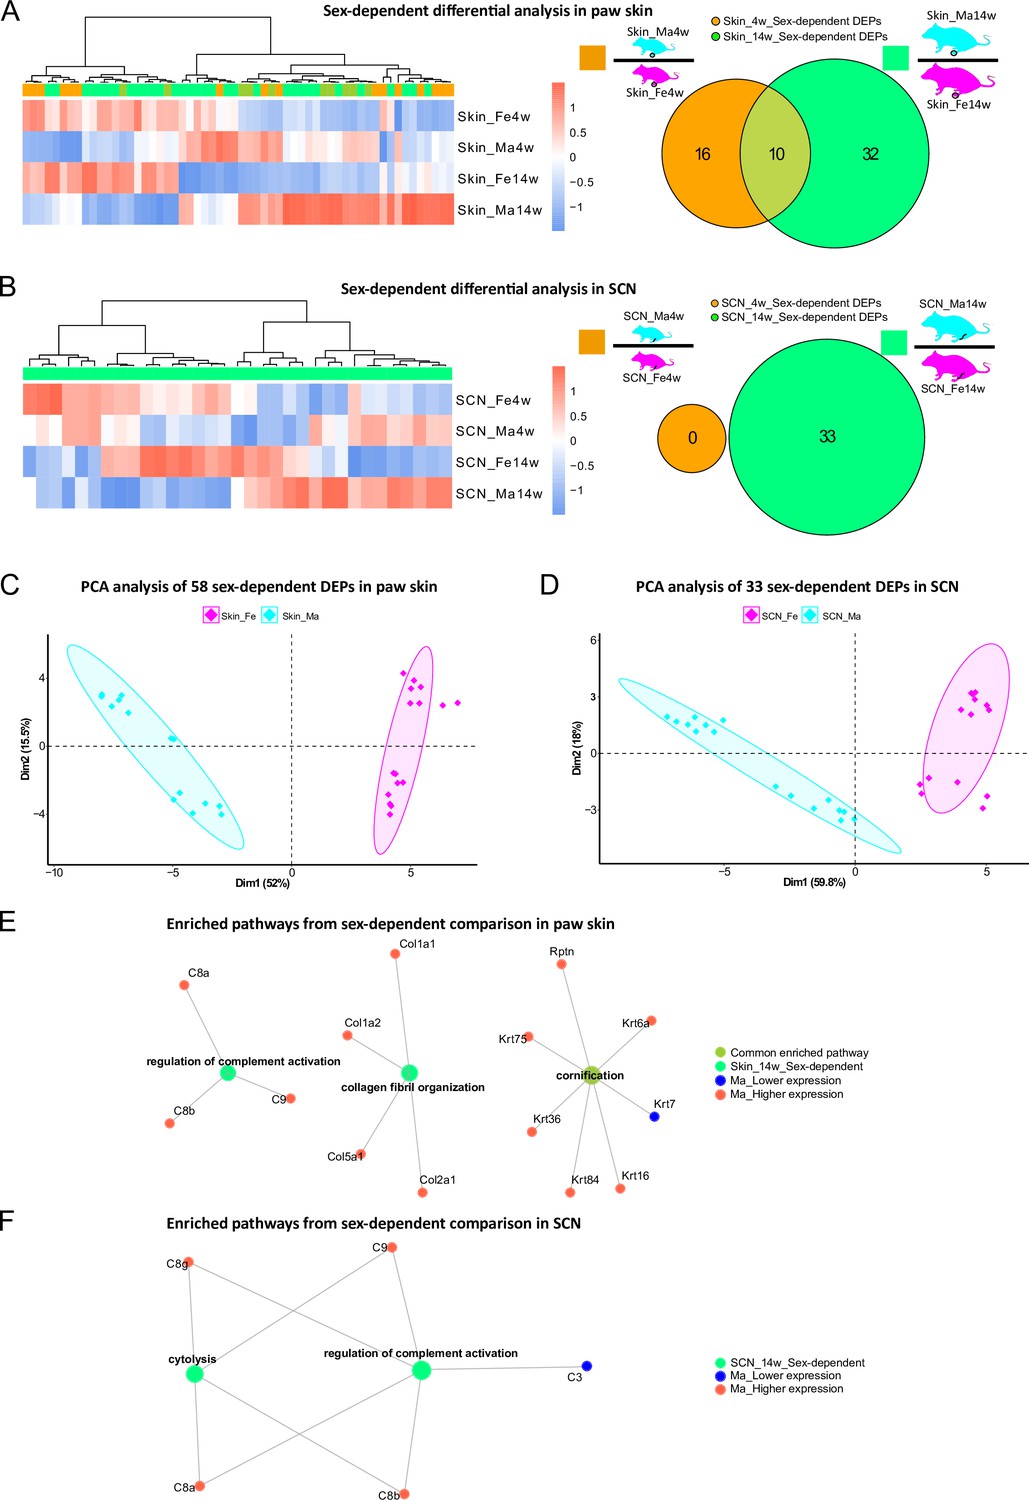
Differential expression analysis indicates protein signatures of sexual dimorphism in paw skin and sciatic nerve (SCN).
(A, B) Differentially expressed proteins (DEPs) of sex-dependent comparisons at 4 weeks and 14 weeks in paw skin (A) and SCN (B). Heatmaps show the normalized protein expression (averaged intensity) across age and sex groups. Venn diagram depicts sex-dependent DEPs at 4 weeks (orange; note that none were found in SCN) and 14 weeks (green). (C, D) Principal component analysis (PCA) using DEPs of sex-dependent comparisons (in contrast to PCA on all identified proteins illustrated in Figure 2G and H) reveals sex as an effective discriminator in paw skin and SCN tissues; females (magenta) and males (cyan). (E, F) Visualization of enriched pathways using sex-dependent DEPs at 4 weeks and 14 weeks. Red: higher expression in males; blue: lower expression in males; green: pathways enriched at 14 weeks in a sex-dependent manner.
-
Figure 5—source data 1
Sex-associated transcripts of human tibial nerves (Ray et al., 2019), which we quantified in the sciatic nerve (SCN) proteome.
- https://cdn.elifesciences.org/articles/81431/elife-81431-fig5-data1-v1.xlsx
-
Figure 5—source data 2
Sex-associated transcripts of mouse hind paws (Mecklenburg et al., 2020), which we quantified in the paw skin proteome.
- https://cdn.elifesciences.org/articles/81431/elife-81431-fig5-data2-v1.xlsx
Figure 5—figure supplement 1
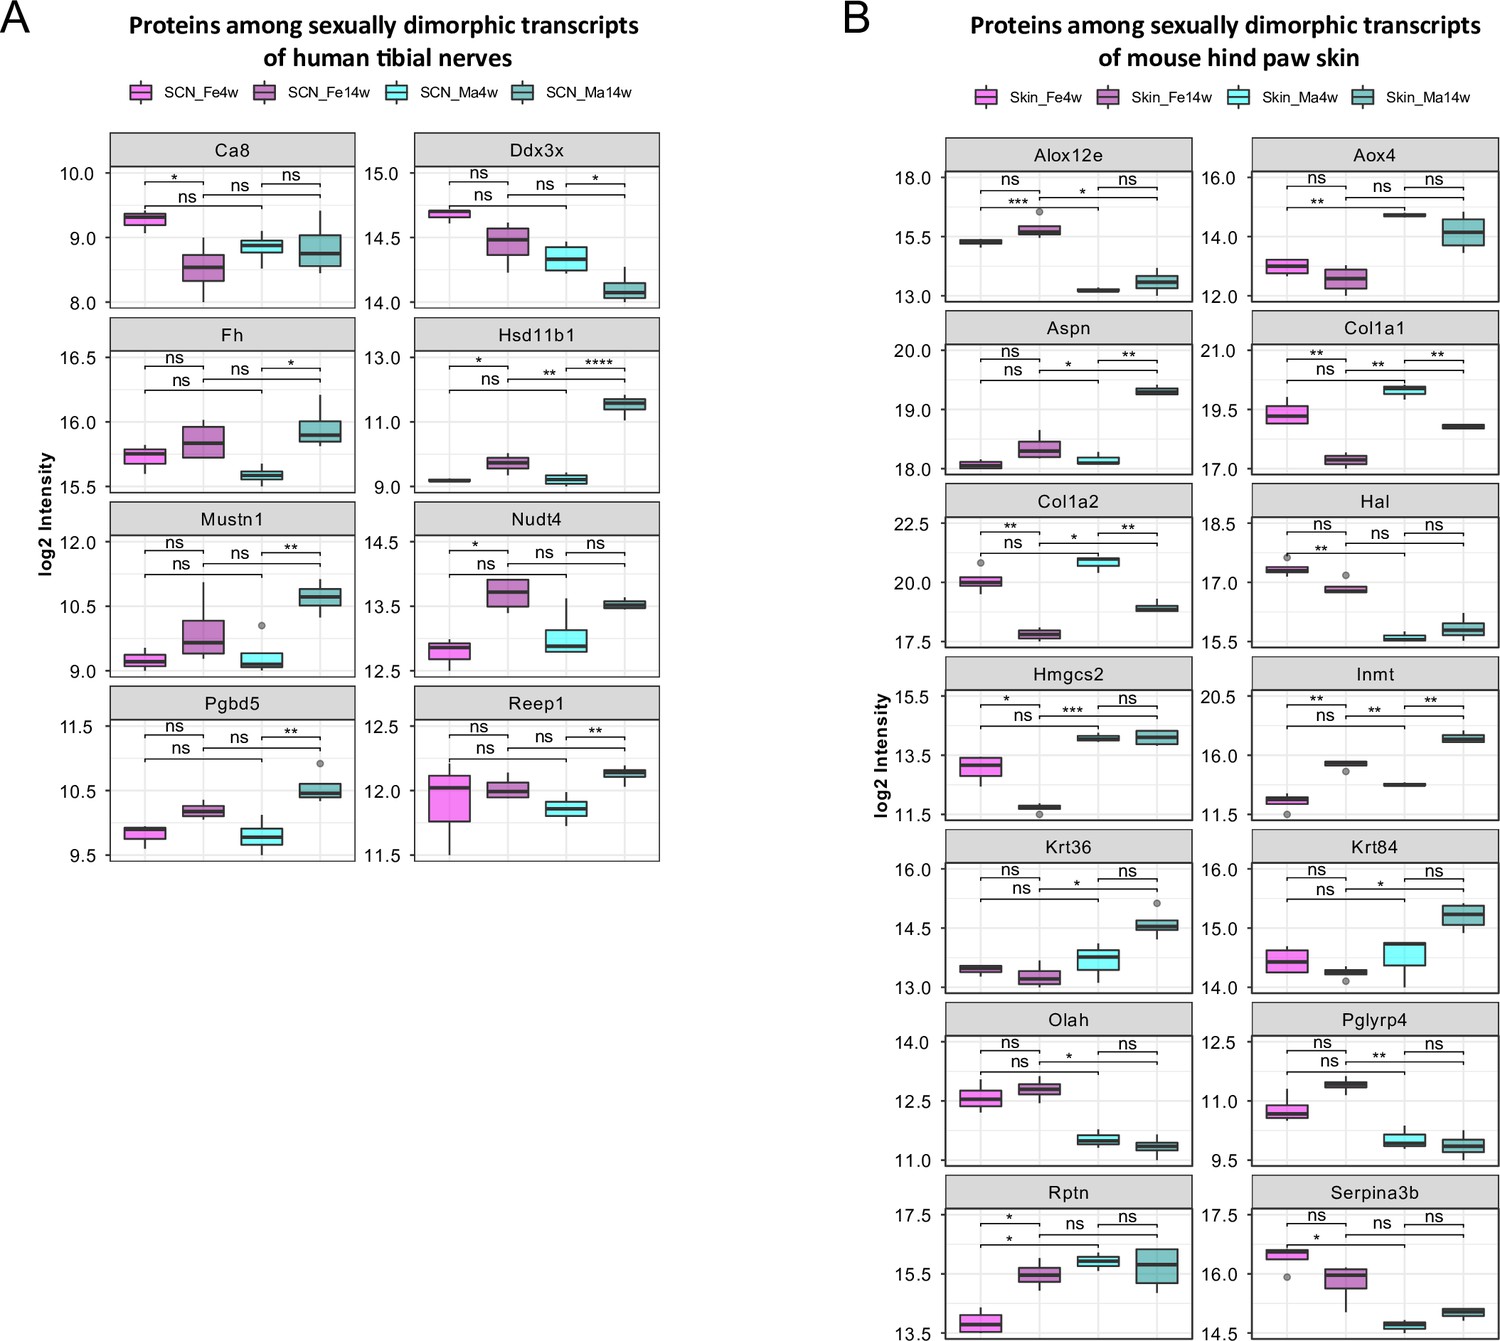
Sexual dimorphism in SCN and paw skin.
(A) Sex-dependent significance in the sciatic nerve (SCN) dataset of proteins previously reported to be sexually dimorphic in the transcriptome of human tibial nerves (Ray et al., 2019). (B) Sex-dependent significance in the paw skin dataset of proteins previously reported to be sexually dimorphic in the transcriptome of mouse hind paws (Mecklenburg et al., 2020). Significance levels are indicated as ns, q-value > 0.05, *q-value ≤ 0.05, **q-value ≤ 0.01, ***q ≤ 0.001, and ****q-value ≤ 0.0001.
Figure 6

Multiple proteins associated with skin diseases and pain exhibit age and sex dependence.
(A) Venn diagram indicates the number of quantified protein IDs in paw skin (white) associated with various human skin diseases (light gray) upon comparison with a skin disease database (dark gray, https://biohub.skinsciencefoundation.org/). (B) Examples of fuzzy C-means clustering analysis of the 329 protein IDs associated with human skin diseases illustrate their relative expression in experimental groups (other clusters are detailed in Figure 6—source data 2). (C) Significantly expressed protein IDs associated with human skin diseases show age and/or sex dependency. Proteins marked with ‘#’ represent examples related to hand–foot psoriasis, palmoplantar pustulosis, and vesicular hand eczema. (D) Venn diagram indicates the number of quantified protein IDs in sciatic nerve (SCN) (white) associated with pain (light gray) upon comparison with known pain genes (dark gray). Pain-related genes were downloaded from publicly available pain gene databases: https://www.painresearchforum.org/, https://humanpaingeneticsdb.ca/hpgdb/, and http://paingeneticslab.ca/4105/06_02_pain_genetics_database.asp. (E) Examples of fuzzy C-means clustering analysis of the 245 protein IDs associated with pain illustrate their relative expression in experimental groups (other clusters are detailed in Figure 6—source data 2). (F) Significantly expressed protein IDs associated with pain show age and/or sex dependency. Significance levels in (C) and (F) are indicated as ns, q-value > 0.05, *q-value ≤ 0.05, **q-value ≤ 0.01, ***q-value ≤ 0.001, and ****q-value ≤ 0.0001.
-
Figure 6—source data 1
Gene candidates of various human skin diseases (https://biohub.skinsciencefoundation.org/), which we quantified in the paw skin proteome.
- https://cdn.elifesciences.org/articles/81431/elife-81431-fig6-data1-v1.xlsx
-
Figure 6—source data 2
Fuzzy C-means clustering membership of 329 and 245 pathology-related proteins quantified in the paw skin and sciatic nerve (SCN) proteome.
- https://cdn.elifesciences.org/articles/81431/elife-81431-fig6-data2-v1.xlsx
-
Figure 6—source data 3
Differentially expressed genes (DEGs) of hand–foot psoriasis, palmoplantar pustulosis, and vesicular hand eczema quantified in the paw skin proteome.
- https://cdn.elifesciences.org/articles/81431/elife-81431-fig6-data3-v1.xlsx
-
Figure 6—source data 4
Pain-related genes (https://www.painresearchforum.org/, http://paingeneticslab.ca/4105/06_02_pain_genetics_database.asp, and https://humanpaingeneticsdb.ca/hpgdb/), which we quantified in the sciatic nerve (SCN) proteome.
- https://cdn.elifesciences.org/articles/81431/elife-81431-fig6-data4-v1.xlsx
-
Figure 6—source data 5
Differentially expressed proteins (DEPs) upon sciatic nerve (SCN) injury (spared nerve injury [SNI] model of neuropathic pain in mice) (Barry et al., 2018) quantified in the SCN proteome.
- https://cdn.elifesciences.org/articles/81431/elife-81431-fig6-data5-v1.xlsx
Author response image 1

Tables
Key resources table
| Reagent type (species) or resource | Designation | Source or reference | Identifiers | Additional information |
|---|---|---|---|---|
| Strain, strain background (mouse) | C57BL/6J | In-house bred | Wild type, female and male, 3-4 and 1415 weeks old | |
| Chemical compound, drug | Acetonitrile | Fisher Scientific | 10001334 | |
| Chemical compound, drug | Formic acid | Fisher Scientific | 15658430 | |
| Chemical compound, drug | 10× PBS | Fisher Scientific | 11594516 | |
| Chemical compound, drug | Tris 1 M | Accugene/Avantor | 733-1653 | |
| Chemical compound, drug | Glycerol | Fisher Scientific | 10021083 | |
| Chemical compound, drug | Dithiothreitol 1 M | Sigma-Aldrich | 43816 | |
| Chemical compound, drug | Acetone | Sigma-Aldrich | 1000201000 | |
| Chemical compound, drug | Ethanol | Sigma-Aldrich | 1117272500 | |
| Chemical compound, drug | Iodoacetamide | Sigma-Aldrich | I1149 | |
| Chemical compound, drug | Ammonium bicarbonate | Sigma-Aldrich | 09830-500G | |
| Chemical compound, drug | Water MS grade | Sigma-Aldrich | 1.15333.1000 | |
| Chemical compound, drug | Trypsin/Lys-C | Promega | V5073 | |
| Chemical compound, drug | Trypsin | Serva | 37283.01 | |
| Chemical compound, drug | Sera-Mag SpeedBead beads | Cytiva | 65152105050250, 45152105050250 | 1:1 mix |
| Other | cOmplete Protease Inhibitor Cocktail | Roche/Merck | 58929700001 | Mix of protease inhibitors |
| Other | Protein LoBind tube | Eppendorf | 0030108116 | Reagent tube |
| Other | Aurora Series UHPLC column | IonOpticks | AUR2-25075C18A-CSI | 25 cm × 75 µm column |
| Other | Biopsy punch 4 mm | Kai Medical | 48401 | Skin biopsy punch |
| Software, algorithm | MaxQuant | Max Planck Institute of Biochemistry | Version 1.6.17.0 | |
| Software, algorithm | DIA-NN | https://github.com/vdemichev/DiaNN | RRID:SCR_022865 | Version 1.8.0 |
| Software, algorithm | R | https://www.r-project.org/ | Version 4.1.1 | |
| Software, algorithm | Mouse proteome database | UniProt | UP000000589 | Downloaded on 2021-07-08, 17070 entries |
Additional files
Download links
A two-part list of links to download the article, or parts of the article, in various formats.
Downloads (link to download the article as PDF)
Open citations (links to open the citations from this article in various online reference manager services)
Cite this article (links to download the citations from this article in formats compatible with various reference manager tools)
Deep proteome profiling reveals signatures of age and sex differences in paw skin and sciatic nerve of naïve mice
eLife 11:e81431.
https://doi.org/10.7554/eLife.81431


