Renal interstitial cells promote nephron regeneration by secreting prostaglandin E2
- Department of Nephrology, the Key Laboratory for the Prevention and Treatment of Chronic Kidney Disease of Chongqing, Chongqing Clinical Research Center of Kidney and Urology Diseases, Xinqiao Hospital, Army Medical University, China
- Department of Respiratory Medicine, Xinqiao Hospital, Army Medical University, China
- Shanghai Key Laboratory of Regulatory Biology, Shanghai Frontiers Science Center of Genome Editing and Cell Therapy, East China Normal University, School of Life Sciences, China
Figures
Figure 1 with 1 supplement
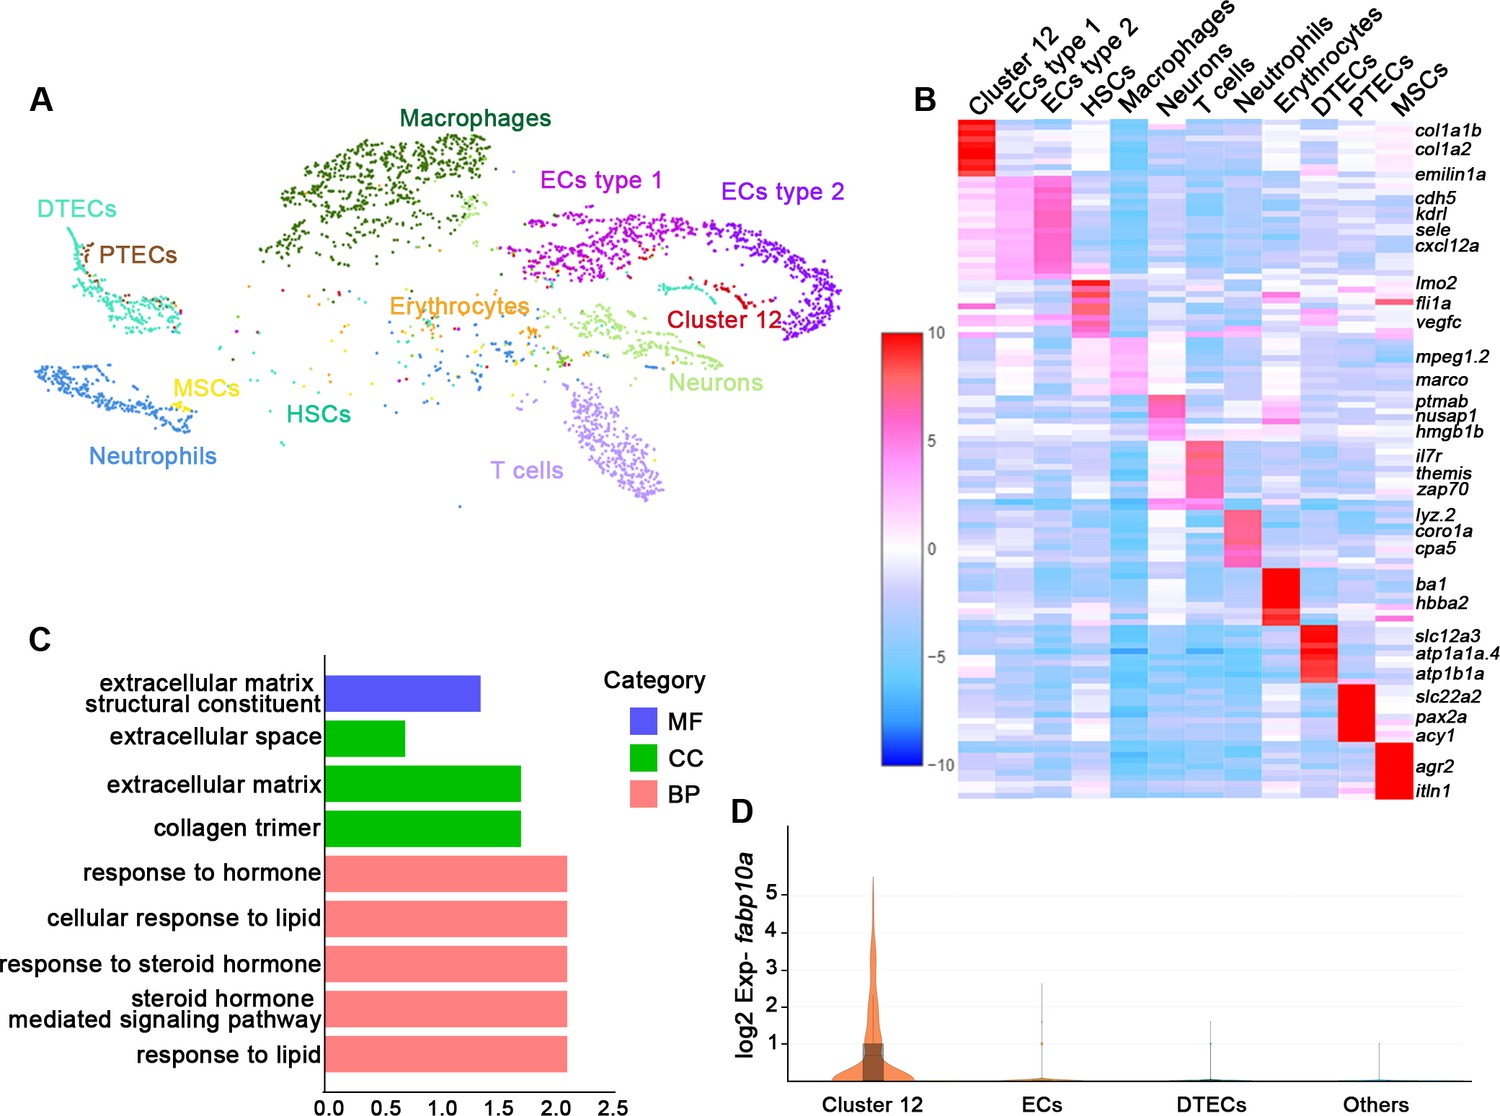
Single messenger RNA sequencing of kidney cells.
(A) A tSNE plot showing clustering of all kidney cells after alignment using the Seurat package. Cells clustered with resolution 0.6. (B) Heat map showing relative log-expression of the top 2 or 3 marker genes for each cell cluster in A. (C) GO analysis of differentially expressed genes of cluster 12. A false discovery rate <0.05 was considered to indicate significant enrichment. BP, biological process; CC, cellular component; MF, molecular function. (D) Expression analysis of fabp10a in all clusters, showing that fabp10a was specifically expressed in cluster 12. DTECs, distal tubule epithelial cells; PTECs, proximal tubule epithelial cells; ECs, endothelial cells; HSCs, hematopoietic stem cells; MSCs, mucin-secreting cells; Exp, expression.
-
Figure 1—source data 1
Gene expression of each identified cell population in zebrafish kidney single-cell RNA sequencing data.
- https://cdn.elifesciences.org/articles/81438/elife-81438-fig1-data1-v2.xlsx
Figure 1—figure supplement 1
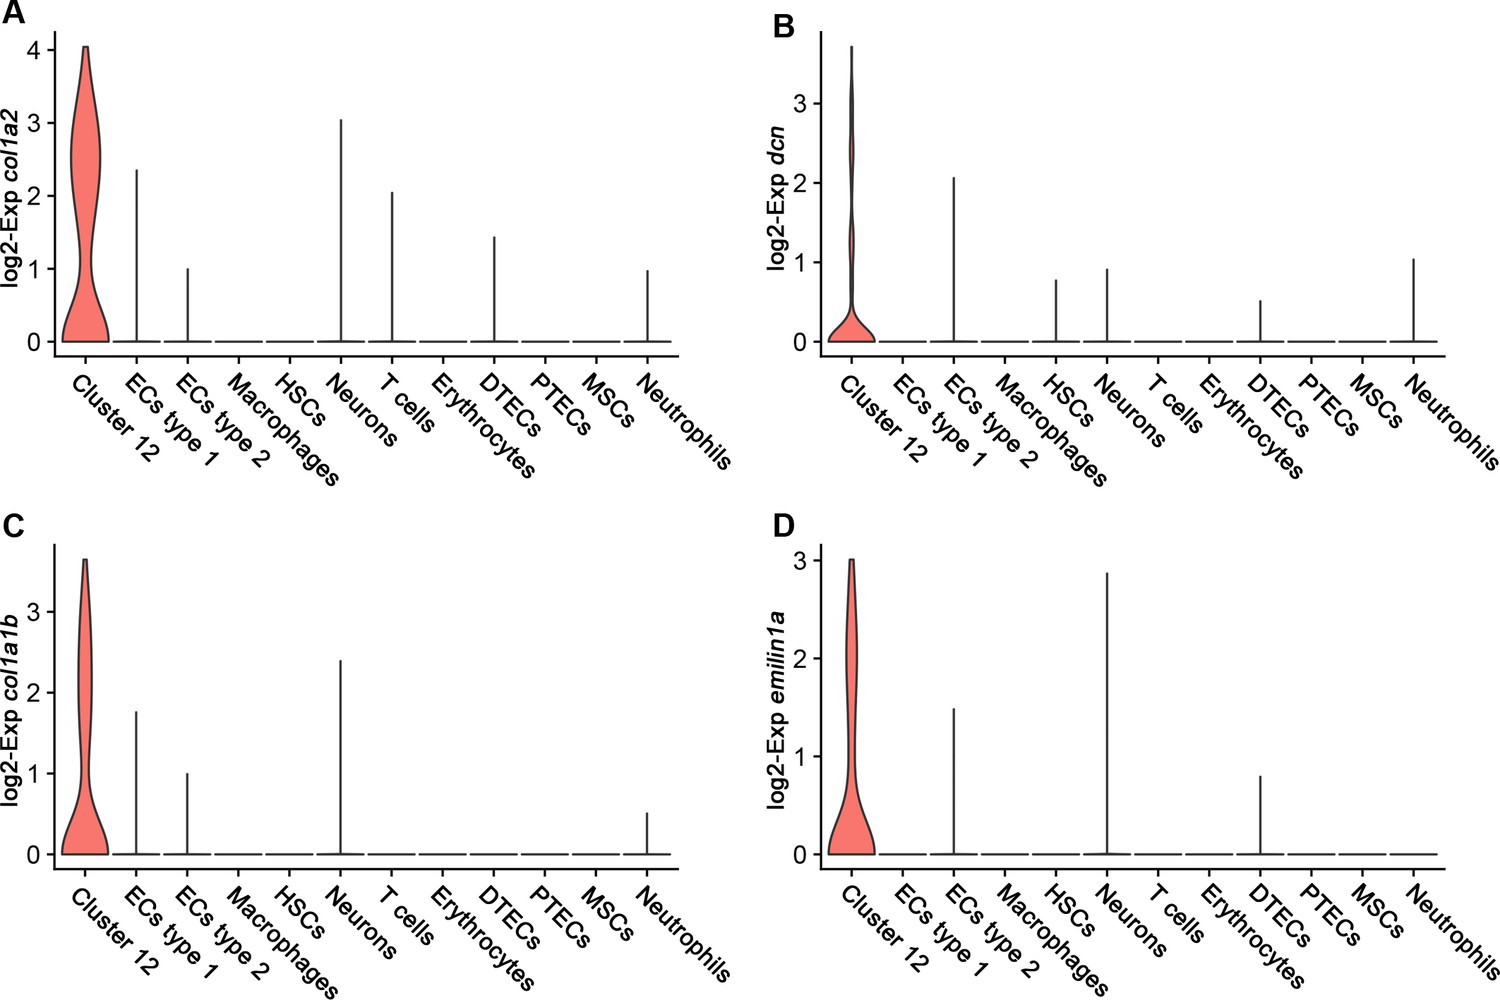
Expression analysis of interstitial cell marker genes in all kidney cell clusters.
Expression analysis of col1a2 (A), dnc (B), col1a1b (C), and emilin1a (D). DTECs, distal tubule epithelial cells; PTECs, proximal tubule epithelial cells; ECs, endothelial cells; HSCs, hematopoietic stem cells; MSCs, mucin-secreting cells; Exp, expression.
Figure 2 with 1 supplement
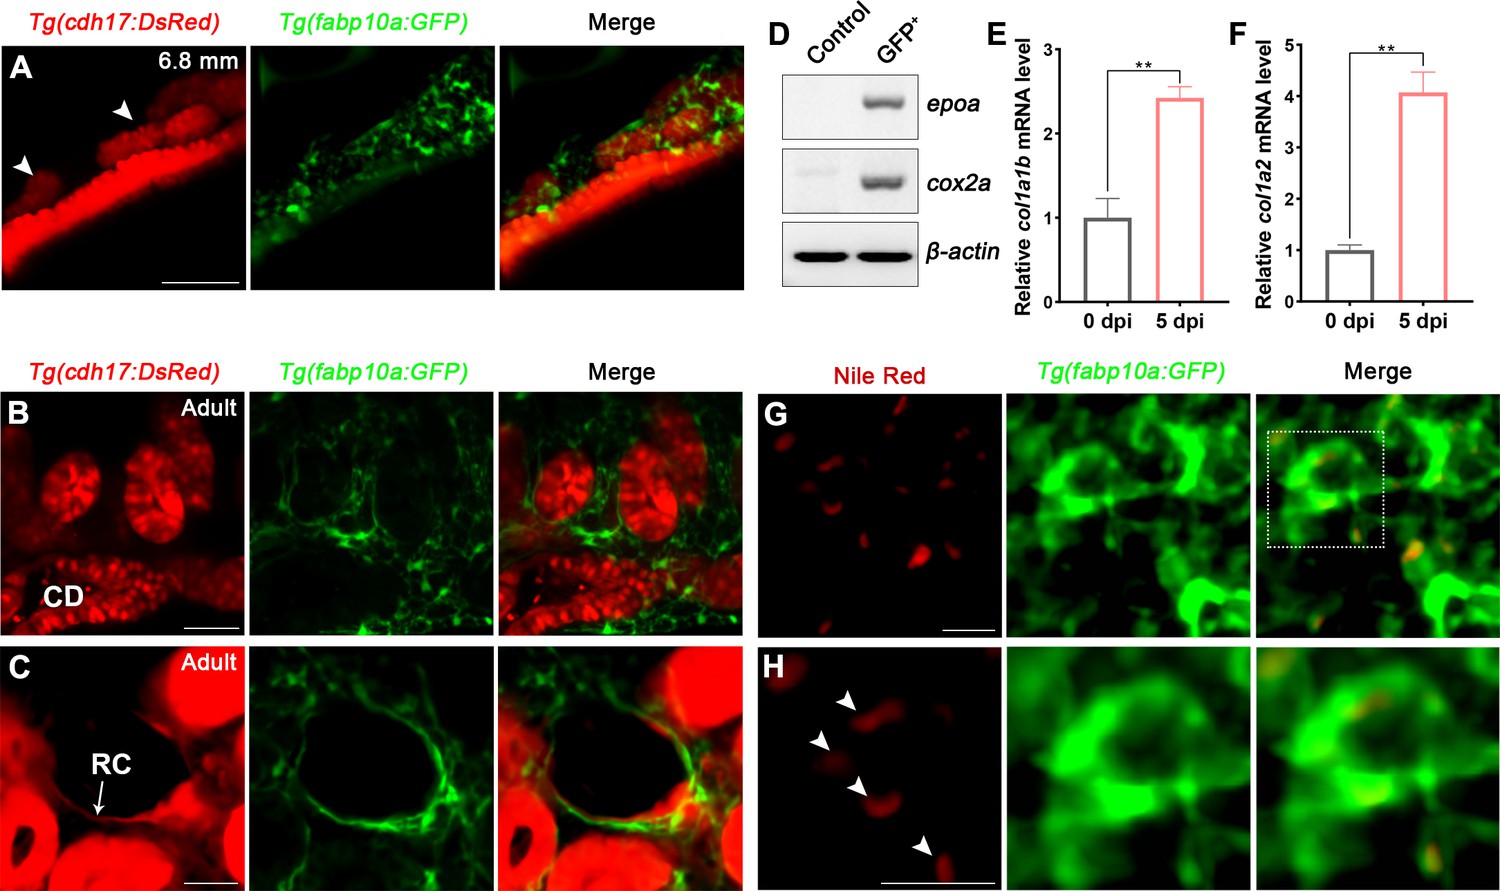
Renal interstitial cells (RICs) are specifically labeled by fabp10a:GFP in transgenic zebrafish.
(A) Localization of Tg(fabp10a:GFP) labeled-RICs in 6.8 mm stage juvenile zebrafish. Tg(cdh17:DsRed) labeled renal tubules (arrowheads, new mesonephric branches; n = 6). (B, C) In adult zebrafish kidney, Tg(fabp10a:GFP) marks RICs (n = 3), while Tg(cdh17:DsRed) labels CD and also renal capsule (RC). Tg(fabp10a:GFP) cells form a network to tightly wrap kidney tubules (B) and capsules (C). CD, collecting duct; RC, renal capsule. (D) RT-PCR analysis of the expression of epoa and cox2a. β-actin was used as a sample control. GFP+ indicates cells with only GFP fluorescence; control indicates all cells except GFP+/DsRed- cells. (E, F) col1a1b and col1a2 mRNA levels in Tg(fabp10a:GFP)-labeled GFP+/DsRed- cells were quantified by qPCR. Both were significantly increased at 5 dpi (n = 3). Both genes were normalized to the mean expression level at 0 dpi, which was set to 1. **p<0.01 by one-way ANOVA. (G) Nile red staining section of Tg(fabp10a:GFP) zebrafish kidney showing that Tg(fabp10a:GFP)-labeled cells contained plentiful lipid droplets. (H) Higher-magnification image of the boxed area showed in (G) (arrowheads, lipid droplets). n = 3. Scale bar in (A–C), 100 μm; (G, H), 20 μm.
-
Figure 2—source data 1
Original gel files of Figure 2D and Figure 2—figure supplement 1B.
- https://cdn.elifesciences.org/articles/81438/elife-81438-fig2-data1-v2.zip
-
Figure 2—source data 2
Numerical data for Figure 2E and F.
- https://cdn.elifesciences.org/articles/81438/elife-81438-fig2-data2-v2.xlsx
Figure 2—figure supplement 1
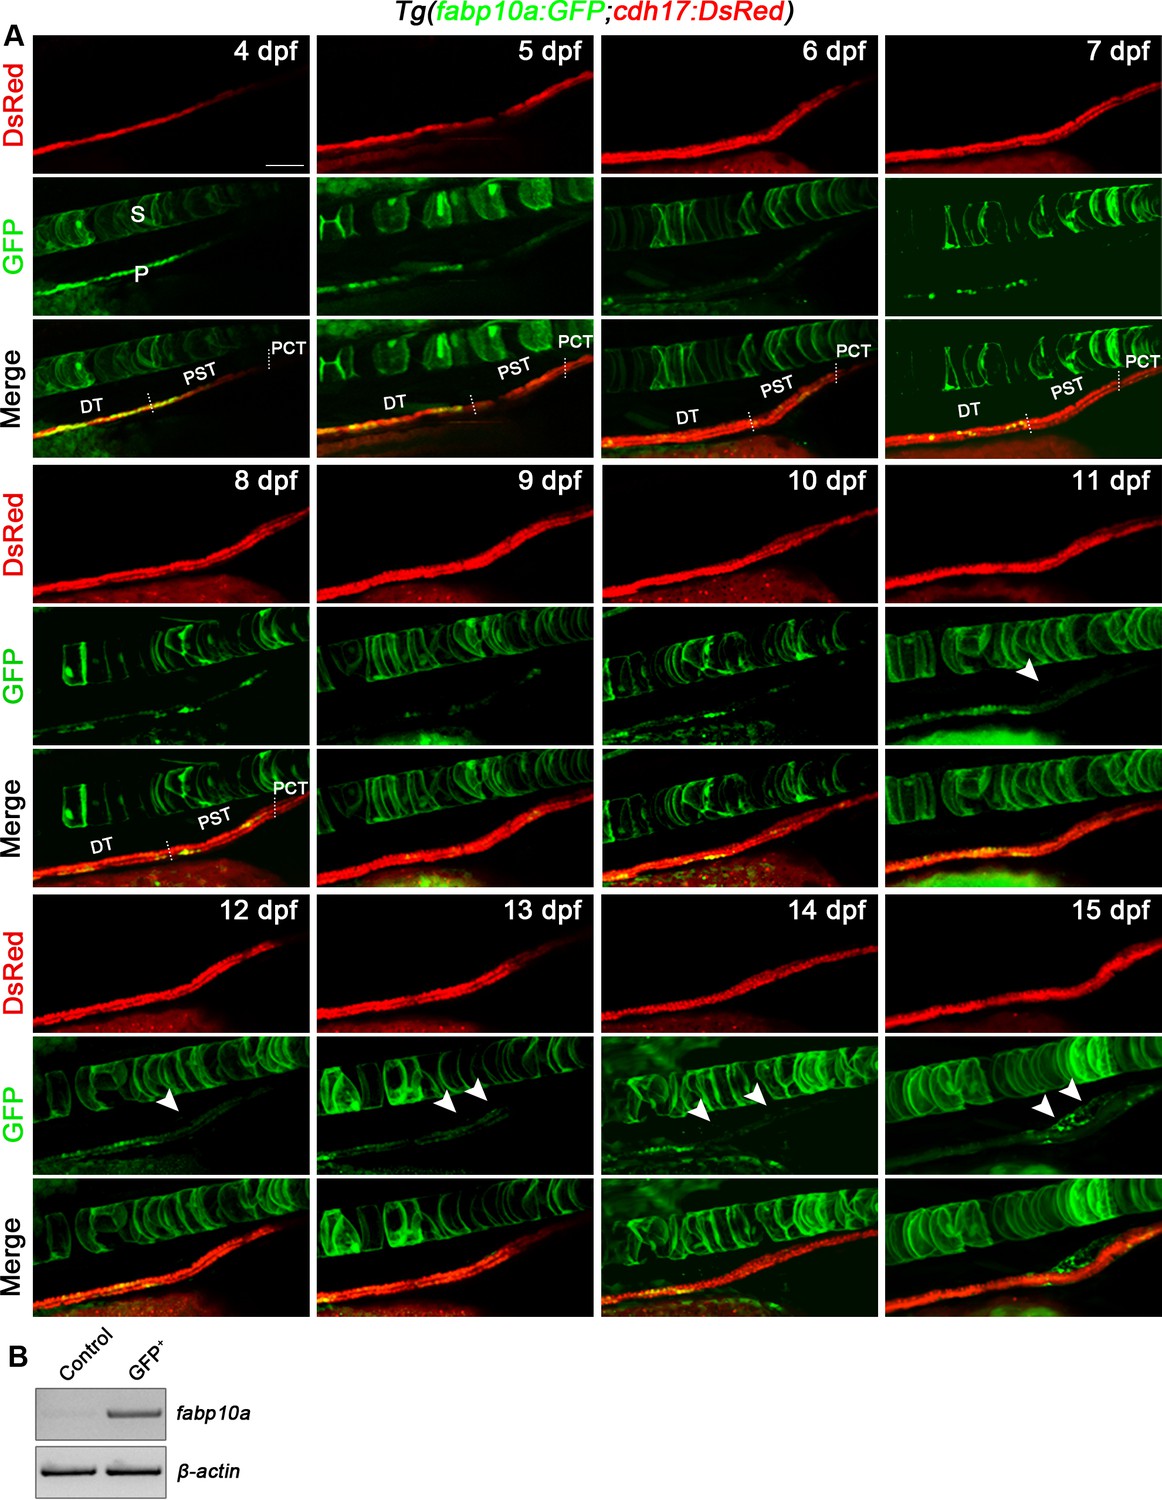
Renal interstitial cells (RICs) can be labeled by Tg(fabp10a:GFP) line.
(A) The development process of Tg(fabp10a:GFP;cdh17:DsRed) zebrafish from 4 dpf to 15 dpf. Tg(fabp10a:GFP) labeled PST and DT in early stages (4–14 dpf) and RICs (arrowheads) at 15 dpf (n = 5). The spinal cord is also labeled by fabp10a:GFP cells. (B) RT-PCR analysis indicated the expression of fabp10a in Tg(fabp10a:GFP) labeled-kidney cells. β-actin was used as a sample control. GFP + indicates kidney cells with only GFP fluorescence; control indicates all kidney cells except GFP + /DsRed- cells. P, pronephros; S, spine; PCT, the proximal convoluted tubule; PST, proximal straight tubule; DT, distal tubule. Scale bar, 100 μm.
Figure 3 with 3 supplements

Renal interstitial cells (RICs) promote nephron regeneration by secreting PGE2.
(A) cox2a mRNA levels were evaluated by RT-PCR at 0, 1, 3, 5, 7, and 9 dpi. β-actin was used as a sample control. The expression of cox2a was upregulated after acute kidney injury (AKI) and reached its peak level at 5 dpi (n = 3). (B) Immunofluorescence staining of Cox2a in Tg(fabp10a:GFP;lhx1a:DsRed) zebrafish kidneys at 7 dpi. RICs around lhx1a+ cell aggregates highly expressed Cox2a (arrows; DT, distal tubule, red outline; lhx1a+ cell aggregates, white outline; n = 4) Scale bar, 50 μm. (C) PGE2 levels were assessed at 0, 1, 3, 5, 7, and 9 dpi using PGE2 ELISA kits. PGE2 levels increased after AKI and reached their peak at 5 dpi (n = 3). Data were analyzed by ANOVA, *p<0.05, **p<0.01, ***p<0.001 vs 0 dpi. (D) lhx1a mRNA levels were evaluated by RT-PCR at 7 dpi. (E) The lhx1a mRNA levels in cox2a-/- and WT zebrafish kidneys were assessed by RT-PCR at 7 dpi. (F) The lhx1a mRNA levels were determined by RT-PCR at 7 dpi after injection of EP2 inhibitor TG4-155 or EP4 inhibitor GW627368X (GW). β-actin was used as a sample control in (D–F). (G–O) lhx1a WISH showing the trunk kidney region at 7 dpi (n = 5–7). (G) lhx1a + cell aggregates could not be detected in un-injured (Un-Inj) kidneys. (H) Injury induced the formation of lhx1a+ cell aggregates. Indo (I), NS-398 (J), or Cox2a deficiency (K) inhibited the formation of lhx1a+ cell aggregates. dmPGE2 could rescue the effect of Cox2a deficiency (L). GW627368X inhibited the formation of lhx1a+ cell aggregates (M), and dmPGE2 could not rescue the defect (N). dmPGE2 could promote the formation of lhx1a+ cell aggregates (O). (P) lhx1a+ cell aggregates in uninjured and injured kidneys that were treated with DMSO, COX inhibitors or dmPGE2 were calculated using ImageJ. n = 5–7 in each condition. Data were analyzed by ANOVA, *p<0.05, **p<0.01, ***p<0.001.
-
Figure 3—source data 1
Differential analysis of gene expression in zebrafish nephron regeneration transcriptome.
- https://cdn.elifesciences.org/articles/81438/elife-81438-fig3-data1-v2.xls
-
Figure 3—source data 2
Original gel files of Figure 3A, D and F.
- https://cdn.elifesciences.org/articles/81438/elife-81438-fig3-data2-v2.zip
-
Figure 3—source data 3
Numerical data for Figure 3C and P and Figure 3—figure supplement 1D–F.
- https://cdn.elifesciences.org/articles/81438/elife-81438-fig3-data3-v2.xlsx
Figure 3—figure supplement 1
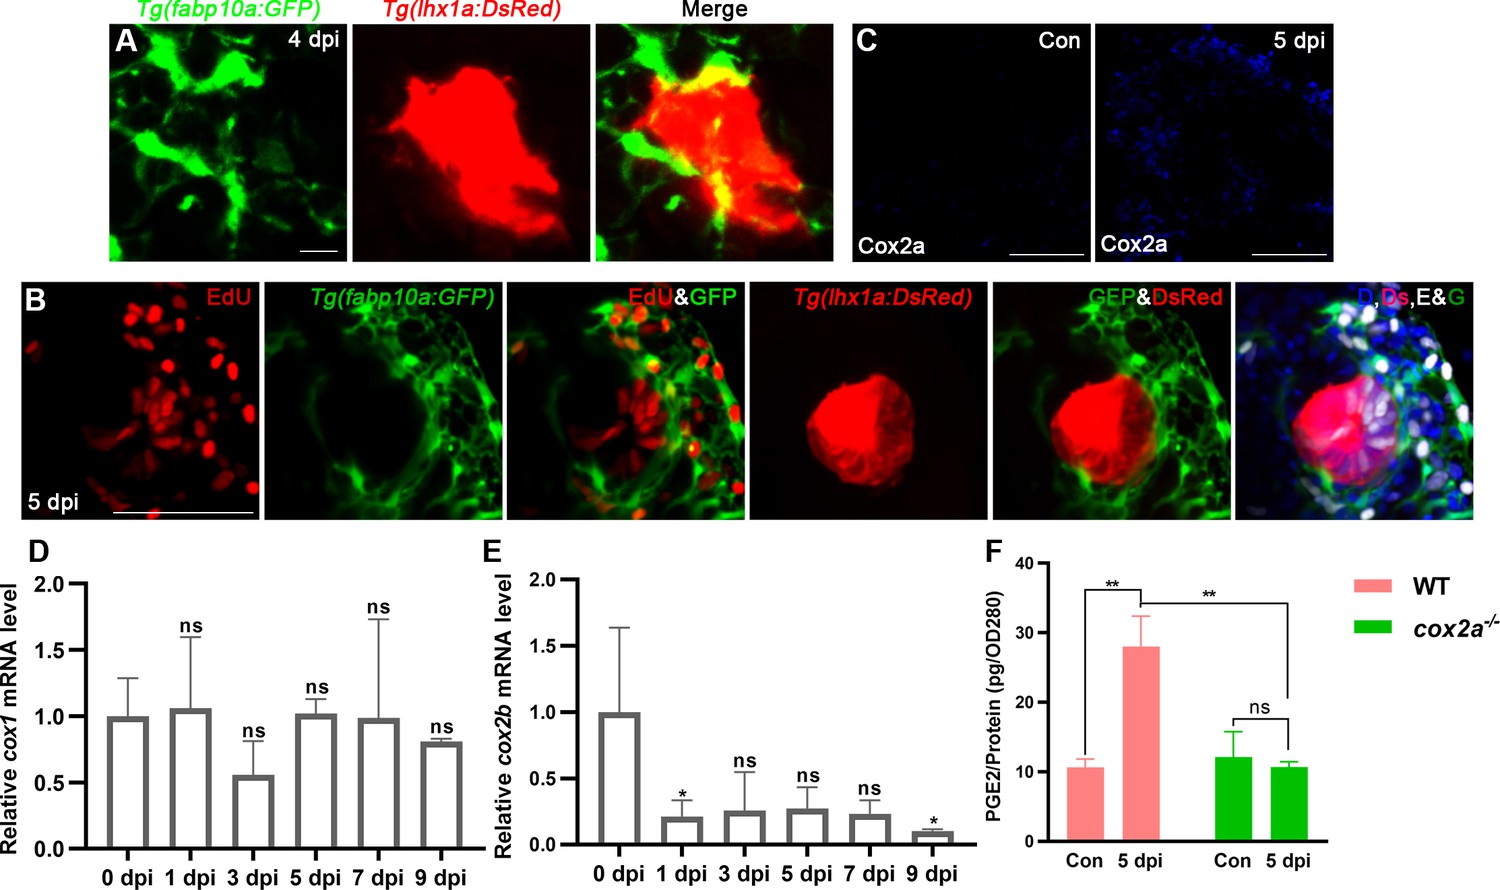
Kidney injury promotes renal interstitial cells (RICs) to synthesize and secrete PGE2.
(A) Confocal stack projection of Tg(fabp10a:GFP;lhx1a:DsRed) transgenic kidney tissue at 4 dpi. RICs were wrapped around and closely interacted with the lhx1a+ cell aggregate (n = 4). Scale bar, 10 μm. (B) Proliferation assay of RICs which wrapped around lhx1a+ cell aggregates at 5 dpi. D, DAPI; Ds, DsRed; E, EdU; G, GFP in the merged image (n = 6). Scale bar, 100 μm. (C) Immunofluorescent staining of Cox2a in kidneys at 0 dpi (Con, control) and 5 dpi. Cox2a was increased at 5 dpi (n = 4). Scale bar, 100 μm. (D, E) qPCR relative quantification of cox1a and cox2 mRNA in kidney tissue harvested at 0, 1, 3, 5, 7, and 9 dpi (n = 3). (F) PGE2 levels of WT and cox2a-/- kidneys were assessed at 0 and 5 dpi using PGE2 ELISA kit (n = 3). Data were analyzed by ANOVA, *p<0.05, **p<0.01, ***p<0.001; ns, no significant difference.
Figure 3—figure supplement 2
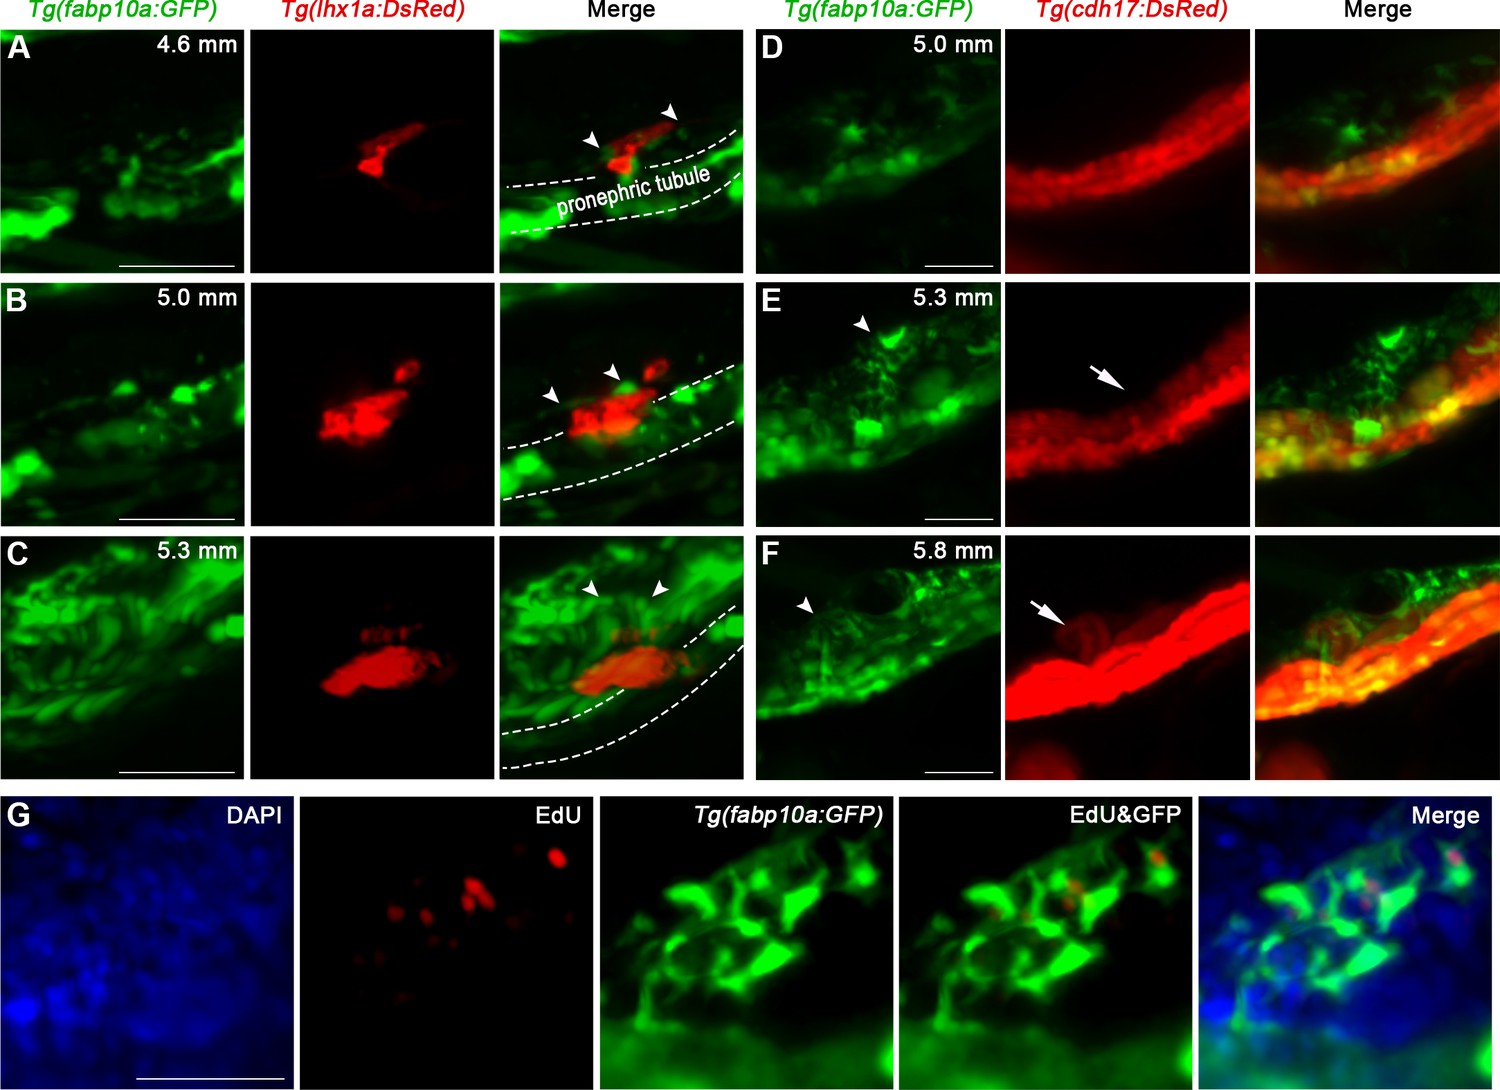
The interaction between renal interstitial cells (RICs) and renal progenitor cells (RPCs).
(A–C) Time-lapse fluorescence microscopy imaging of Tg(fabp10a:GFP;lhx1a:DsRed) juvenile zebrafish revealed the interaction between RICs (arrowheads) and RPC aggregate at 4.6 mm (A), 5.0 mm (B), and 5.3 mm (C) stage. (D, E) Time-lapse microscopy of Tg(fabp10a:GFP;cdh17:DsRed) juvenile zebrafish revealed the behavior of RICs during mesonephros development (n = 4). (D) The RICs occurred upon the pronephric tubule at 5.0 mm stage (n = 4). (E) Mesonephric branch (arrow) occurred upon the pronephric tubule and was wrapped by RICs (arrowheads) at 5.3 mm stage (n = 4). (F) The mesonephric tubule elongated into nascent nephron (arrow) and RICs (arrowheads) formed a network that completely wrapped up the tubule at 5.8 mm stage (n = 4). (G) EdU assay of RICs showed that the RICs were proliferating during mesonephros development (n = 5). Scale bar in (A–C) 50 μm; (D–F) 100 μm; and (G) 50 μm.
Figure 3—video 1
3D video of renal interstitial cells (RICs) wrapping renal progenitor cell (RPC) aggregate corresponds to Figure 3—figure supplement 2F.
Scale bar, 50 μm.
Figure 4 with 3 supplements

PGE2–EP4 signaling promotes the proliferation of renal progenitor cells (RPCs) during nephron regeneration.
Tg(lhx1a:DsRed) fish were injected with EdU to label proliferating nuclei at 5 dpi and kidneys were harvested 3 hr later. (A, B) Gentamicin induced lhx1a+ cell aggregates with proliferating EdU+ nuclei. (C, D) The proliferation of lhx1a+ cell aggregates in cox2a-/- was significantly less than that in WT. (E, F) Intraperitoneal injection of dmPGE2 could promote the proliferation of lhx1a+ cells in cox2a-/-. (G, H) GW627368X inhibited the proliferation of lhx1a+ cells. (I, J) Injection of dmPGE2 could not rescue the GW627368X treatment. n = 5–7 in each condition. Scale bar in (A, C, E, G, I), 50 μm; (B, D, F, H, J), 100 μm. The images on the right showed a higher-magnification image (arrowheads). (K) Proliferation ratio of lhx1a+ RPCs in (A–J) was calculated using ImageJ. n = 5–7 in each condition. Data were analyzed by ANOVA, ***p<0.001; ns, no significant difference.
-
Figure 4—source data 1
Numerical data for Figure 4K, Figure 4—figure supplement 1A, and Figure 4—figure supplement 3A.
- https://cdn.elifesciences.org/articles/81438/elife-81438-fig4-data1-v2.xlsx
Figure 4—figure supplement 1
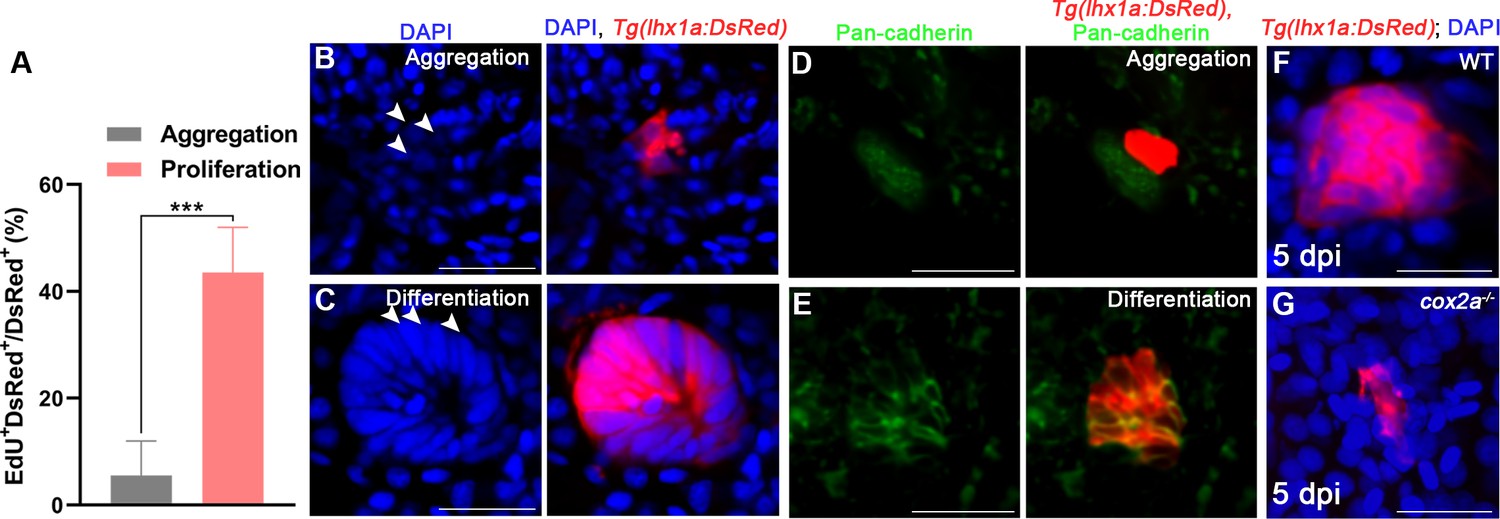
The proliferation and differentiation of renal progenitor cells (RPCs) during regeneration.
(A) Proliferation ratio of lhx1a+ RPCs in cell aggregates during RPC aggregation or proliferation was calculated using ImageJ. n = 5–7 in each condition. (B, C) Morphology of RPCs during aggregation (B) or differentiation (C) (arrowheads, RPC; n = 3). (D, E) Immunofluorescence staining of Pan-cadherin in Tg(lhx1a:DsRed) zebrafish kidneys showed that Pan-cadherin was hardly detected in lhx1a+ cell aggregates during RPC aggregation (D), whereas the amount of Pan-cadherin could be detected in lhx1a+ cell aggregates during RPCs differentiation (E). n = 3. (F, G) Morphology of RPCs in WT (G) or cox2a-/- (H) kidneys at 5 dpi (n = 3). Scale bar in (B, C, F, G), 50 μm; (D, E), 100 μm.
Figure 4—figure supplement 2
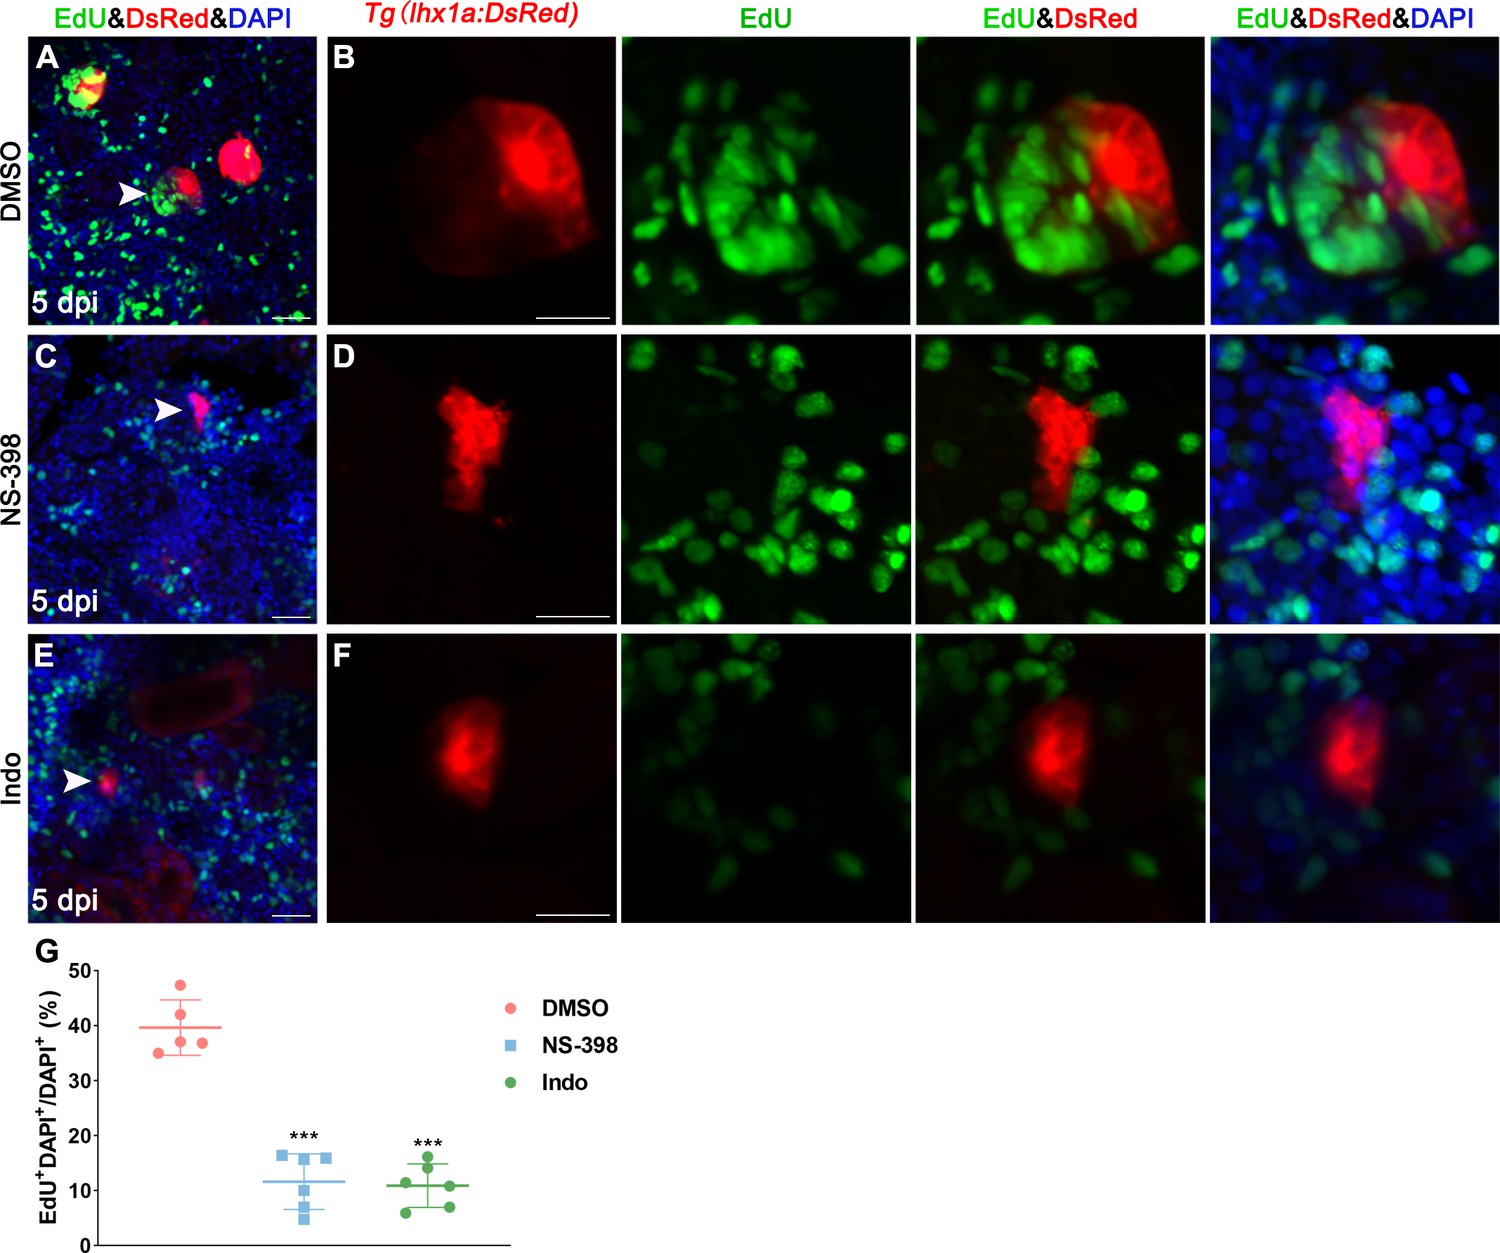
PGE2–EP4 signaling promotes the proliferation of renal progenitor cells (RPCs).
Tg(lhx1a:DsRed) fish were injected with EdU to label proliferating nuclei at 5 dpi and 3 hr after the injection, the kidneys were harvested. (A, B) Gentamicin induced lhx1a+ cell aggregates with proliferating EdU+ nuclei. NS-398. (C, D) inhibited the proliferation of lhx1a+ cell aggregates. Indo (E, F) inhibited the proliferation of lhx1a+ cell aggregates. Scale bar, 50 μm. The images on the right showed a higher-magnification image (arrowheads). (G) Proliferation ratio of lhx1a+ RPCs was calculated using ImageJ. n = 5–7 in each condition. Data were analyzed by ANOVA, ***p<0.001.
Figure 4—figure supplement 3
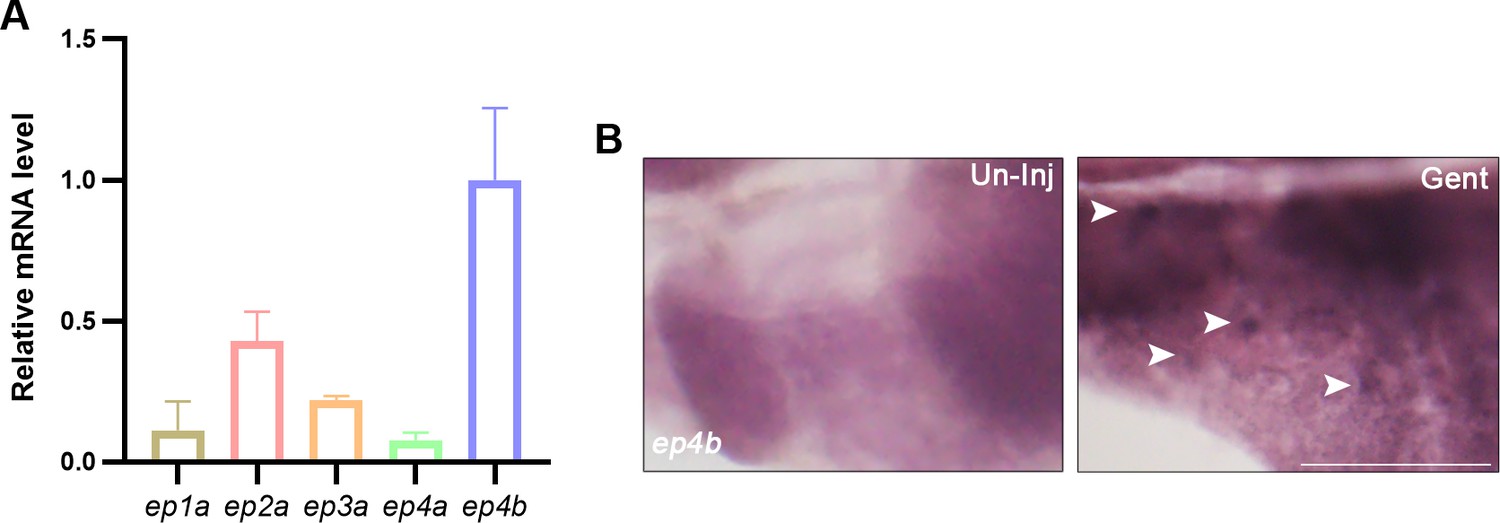
PGE2 receptors expression in lhx1a+ renal progenitor cell (RPC) aggregates.
(A) qPCR relative quantification of PGE2 receptors mRNA in lhx1a+ RPCs. Results for each gene are normalized to ep4b. (B) ep4b whole-mount in situ hybridization (WISH) showing the uninjured or injured zebrafish kidney region. ep4b-labeled cell aggregates at 7 dpi (n = 3). Scale bar, 500 μm.
Figure 5 with 1 supplement
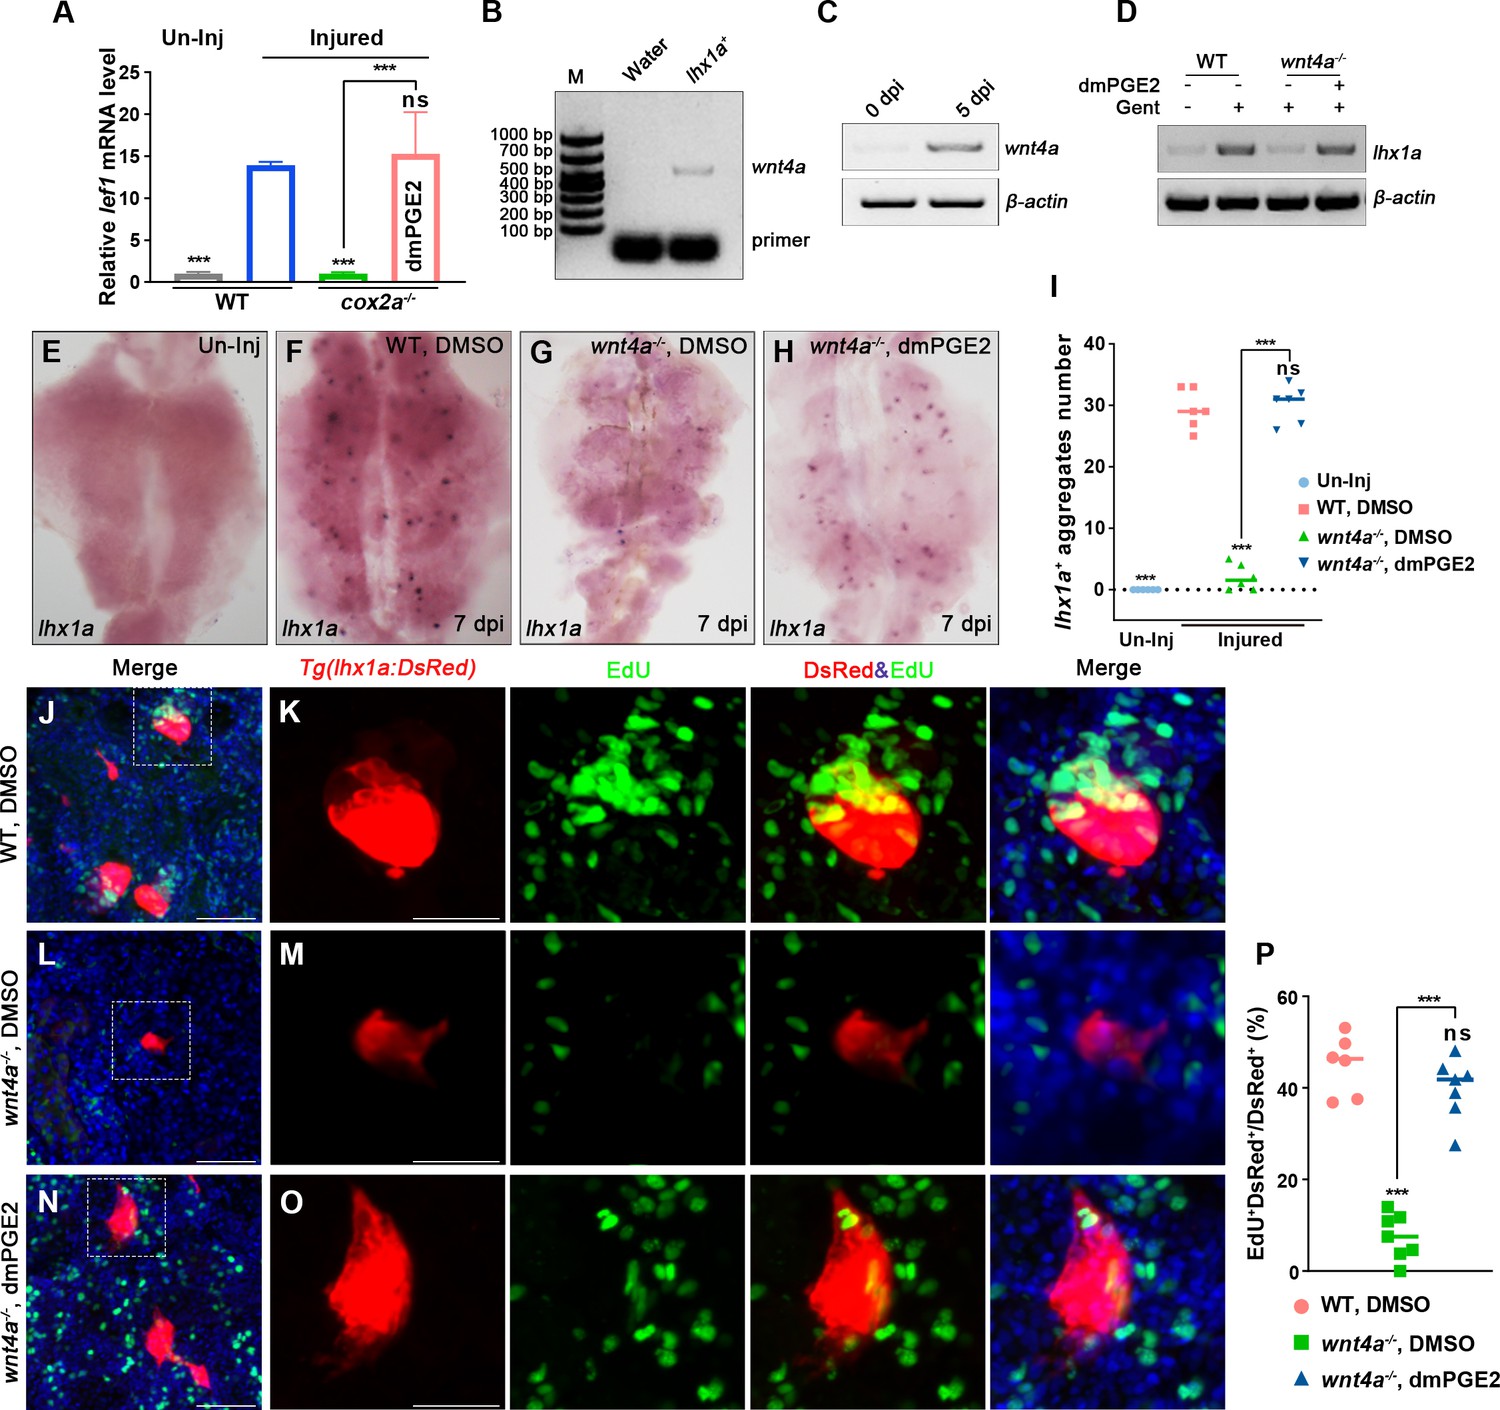
PGE2–EP4 signaling promotes nephron regeneration through PGE2/Wnt interaction.
(A) qPCR relative quantification of lef1 mRNA in kidney tissue of WT and cox2a-/- harvested at 7 dpi. Gene was normalized to the mean expression level in uninjured (Un-Inj) kidneys, which was set to 1. **p<0.01, ***p<0.001; ns, no significant difference (n = 3). (B) FACS-related RT-PCR analysis of wnt4a expression in Tg(lhx1a:DsRed) labeled RPCs at 5 dpi, and wnt4a was expressed in these cells. (C) The wnt4a mRNA levels were assessed by RT-PCR in uninjured or injured kidneys. (D) lhx1a mRNA levels were evaluated by RT-PCR in wnt4a-/- and WT zebrafish kidneys at 7 dpi. β-actin was used as a sample control. (E–H) lhx1a whole-mount in situ hybridization (WISH) showing the trunk kidney region at 7 dpi. (G) the number of lhx1a+ cell aggregates in wnt4a-/- was less than that in WT. (H) Injection of dmPGE2 could rescue the influence of Wnt4a deficiency. (I) lhx1a+ cell aggregates of whole kidney were calculated using ImageJ. n = 5–7 fish for each condition. Data were analyzed by ANOVA, ***p<0.001; ns, no significant difference. (J, K) Gentamicin induced lhx1a+ new nephrons with proliferating EdU+ nuclei at 5 dpi (n = 5). (L, M) The proliferation of lhx1a+ cells in wnt4a-/- was significantly less than that in WT (n = 6). (N, O) dmPGE2 could rescue the effect of Wnt4a deficiency and recover the proliferation of lhx1a+ cells in wnt4a-/- (n = 6). (K, M, O) show the higher-magnification images of the boxed areas showed in (J, L, N). Scale bar in (J–O), 100 μm. (G) Proliferation ratio of lhx1a+ RPCs in (J–O) was calculated using ImageJ. n = 5–7 in each condition. Data were analyzed by ANOVA, ***p<0.001; ns, no significant difference.
-
Figure 5—source data 1
Original gel files of Figure 5B–D.
- https://cdn.elifesciences.org/articles/81438/elife-81438-fig5-data1-v2.zip
-
Figure 5—source data 2
Numerical data for Figure 5A, I, and P and Figure 5—figure supplement 1A.
- https://cdn.elifesciences.org/articles/81438/elife-81438-fig5-data2-v2.xlsx
Figure 5—figure supplement 1

PGE2 affects Wnt activity during nephron regeneration.
(A) qPCR relative quantification of lef1 mRNA in kidney tissue harvested at 7 dpi with different treatments (n = 3). Data were analyzed by ANOVA, ***p<0.001; ns, no significant difference.
Figure 6 with 3 supplements

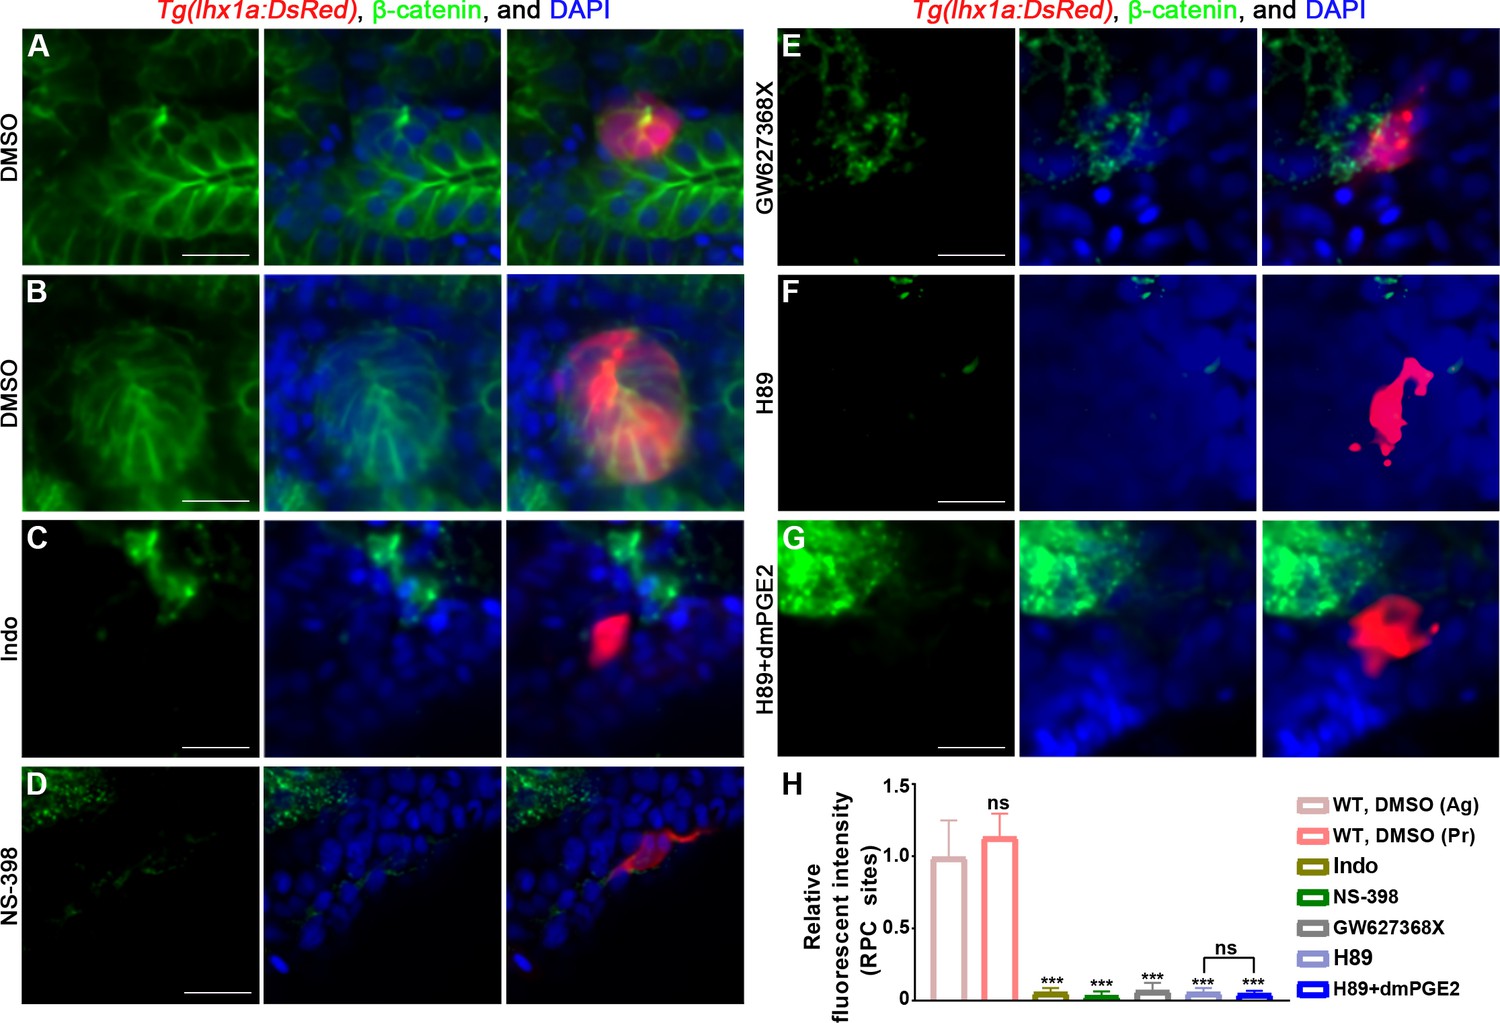
PGE2–EP4 signaling promotes nephron regeneration through regulating β-catenin level.
(A–C) lhx1a mRNA levels were assessed by RT-PCR at 7 dpi. β-actin was used as a sample control. (D–K) lhx1a whole-mount in situ hybridization (WISH) showing the trunk kidney region at 7 dpi. XAV939 (F) could reduce the number of lhx1a + cell aggregates and dmPGE2 could rescue the influence of XAV939 treatment (G); ICRT 14 (H) or ICG-001 (J) could reduce the number of lhx1a+ cell aggregates and dmPGE2 could not rescue the influence of ICRT 14 (I) or ICG-001 (K) treatment. n = 5–7 in each condition. (L) lhx1a+ cell aggregates of whole kidney were calculated using ImageJ. Data were analyzed by ANOVA, ***p<0.001; ns, no significant difference. (M–V) Immunofluorescence staining of β-catenin in Tg(lhx1a:DsRed) zebrafish kidneys at 5 dpi. (M, N) Zebrafish injected DMSO as a control group, and the amount of β-catenin could be detected in lhx1a+ cell aggregates during renal progenitor cell (RPC) aggregation (M) or proliferation (N). (O) β-catenin level in lhx1a+ cell aggregates of cox2a-/- was significantly less than the control group, and injection of dmPGE2 (P, Q) could rescue the influence of Cox2a deficiency. (R) β-catenin level in lhx1a+ cell aggregates of wnt4a-/- was significantly less than the control group, and injection of dmPGE2 (S, T) could rescue the influence of Wnt4a deficiency. Injection of PKI (U) could reduce β-catenin level in lhx1a+ cell aggregates, while injection of dmPGE2 (V) could not rescue the influence of PKI treatment. n = 3–6 in (M–V). Scale bar in (M–V), 50 μm. (W) Bar chart depicting β-catenin levels following acute kidney injury (AKI) (M–V). Fluorescent intensities per unit area were measured at the lhx1a+ RPC aggregates using ImageJ. β-catenin levels of lhx1a+ RPCs during RPC aggregation normalized as 1. Ag, aggregation; Pr, proliferation. n = 3–6 in each condition. Data were analyzed by ANOVA, ***p<0.001; ns, no significant difference.
-
Figure 6—source data 1
Original gel files of Figure 6A–C.
- https://cdn.elifesciences.org/articles/81438/elife-81438-fig6-data1-v2.zip
-
Figure 6—source data 2
Numerical data for Figure 6L and W, Figure 6—figure supplement 1H, Figure 6—figure supplement 2F, and Figure 6—figure supplement 3I.
- https://cdn.elifesciences.org/articles/81438/elife-81438-fig6-data2-v2.xlsx
Figure 6—figure supplement 1
PGE2–EP4 signaling promotes nephron regeneration through regulating β-catenin level.
Immunofluorescent staining of β-catenin in Tg(lhx1a:DsRed) zebrafish kidneys at 5 dpi. (A, B) Injected DMSO as a control group and the amounts of β-catenin could be detected in lhx1a+ cell aggregates during renal progenitor cell (RPC) aggregation (A) or proliferation (B). Intraperitoneal injection of Indo (C), NS-398 (D), or GW627368X (E) could reduce β-catenin level in lhx1a+ cell aggregates. Injection of H89 (F) could reduce β-catenin level in lhx1a+ cell aggregates, while injection of dmPGE2 (G) could not rescue the influence of H89 treatment (n = 3–6). Scale bar, 50 μm. (H) Bar chart depicting β-catenin levels following acute kidney injury (AKI) (M–V). Fluorescent intensities per unit area were measured at the lhx1a+ RPC aggregates using ImageJ. β-catenin levels of lhx1a+ RPCs during RPC aggregation normalized as 1. Ag, aggregation; Pr, proliferation. n = 3–6 in each condition. Data were analyzed by ANOVA, ***p<0.001; ns, no significant difference.
Figure 6—figure supplement 2
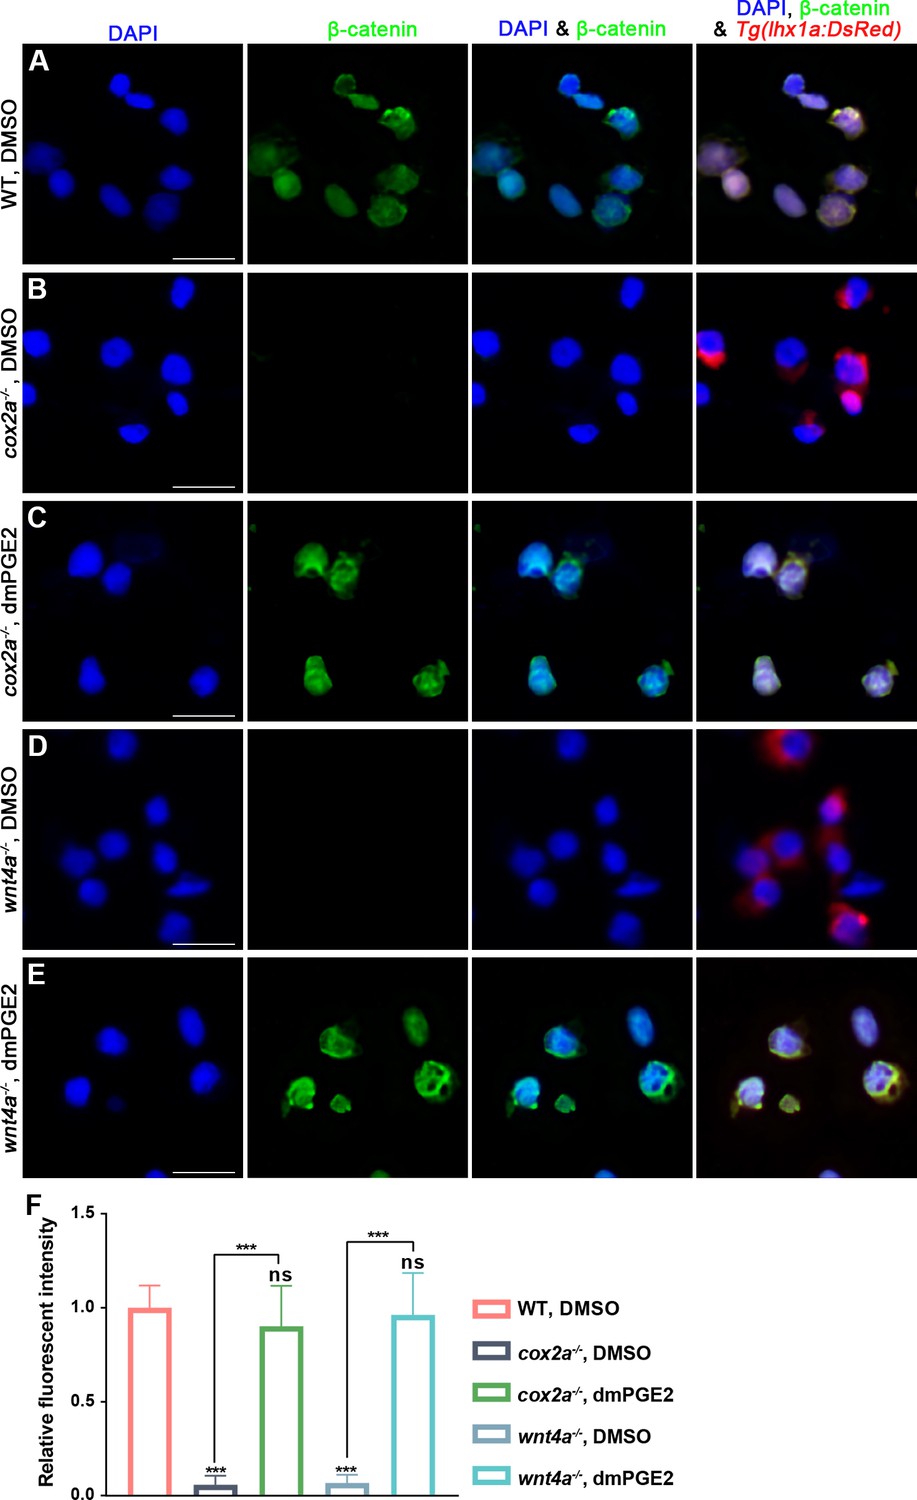
PGE2-EP4 signal regulates β-catenin levels in renal progenitor cells (RPCs).
(A–E) Immunostaining imaging analyses displaying the nuclear β-catenin and lhx1a in FACS-sorted RPCs from kidney following acute kidney injury (AKI) in WT, cox2a-/- mutants and wnt4a-/- mutants, as well as dmPGE2-treated cox2a-/- and wnt4a-/- mutants. (F) Bar chart depicting the quanbtifications of β-catenin levels in (A–E). Fluorescent intensities per unit area were measured at the lhx1a+ RPCs using ImageJ. β-catenin levels of WT at 5 dpi normalized as 1. n = 5. Data were analyzed by ANOVA, ***p<0.001; ns, no significant difference. Scale bar, 10 μm.
Figure 6—figure supplement 3
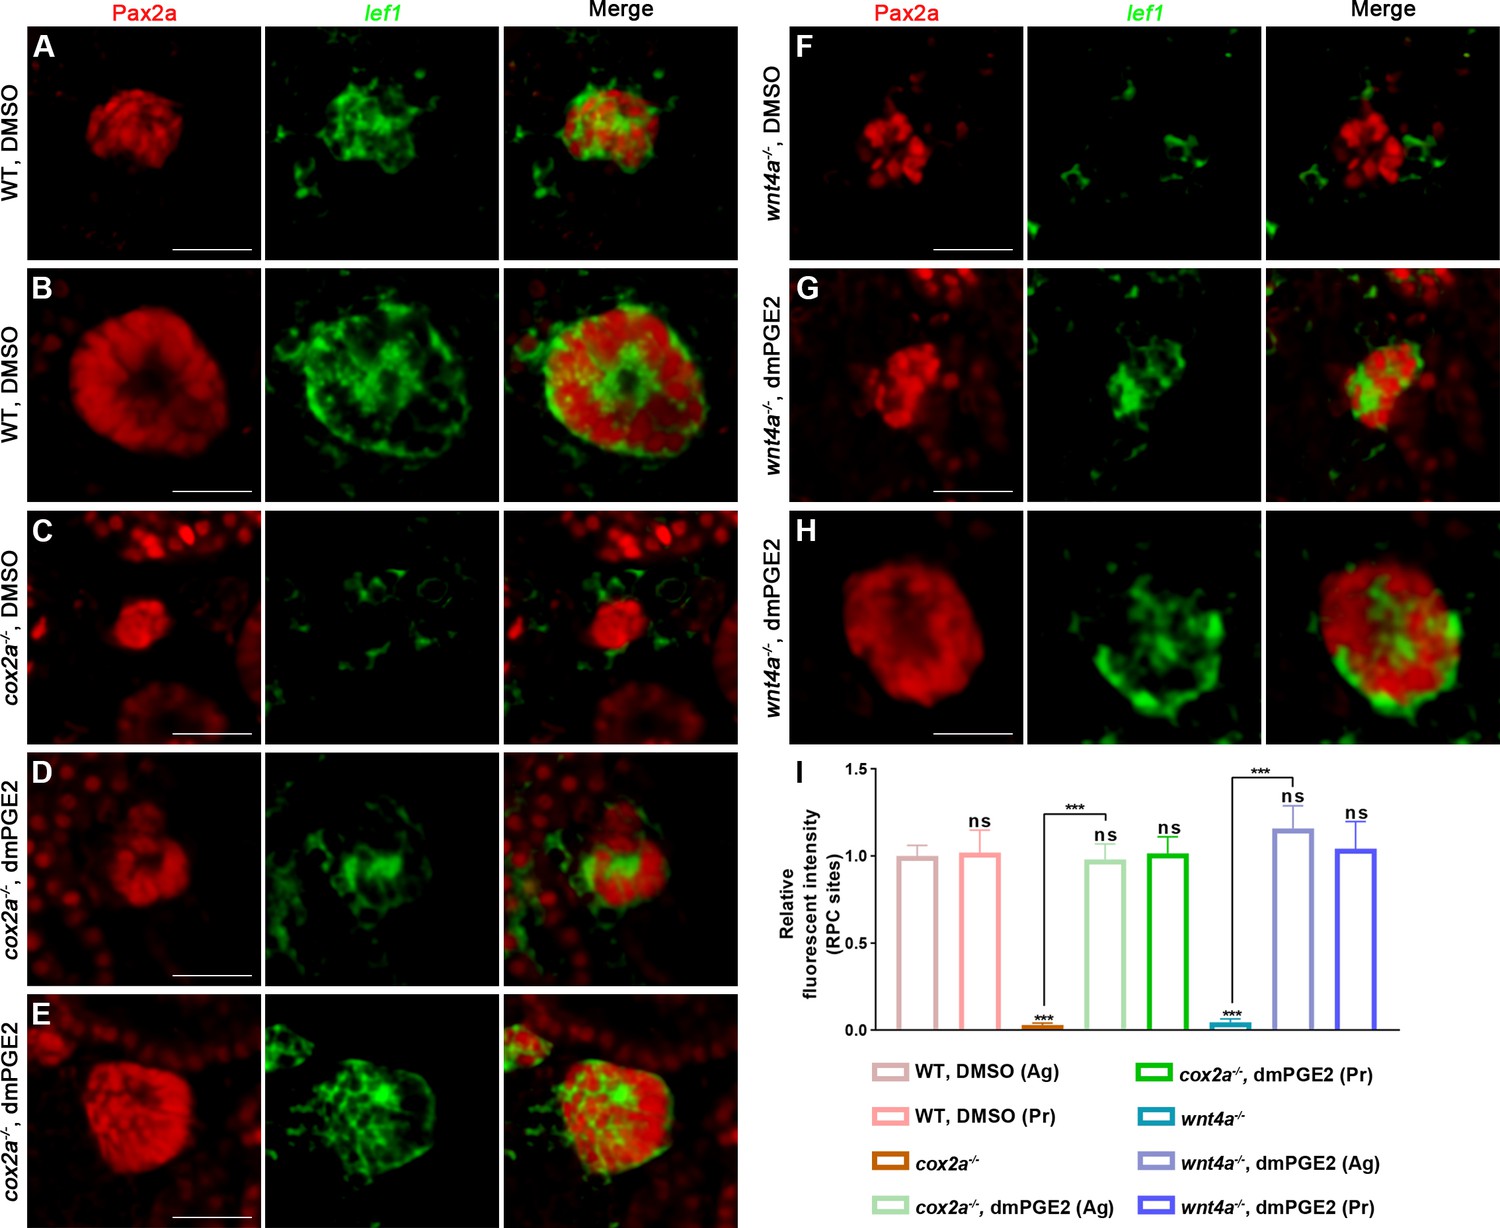
PGE2–EP4 signaling promotes nephron regeneration through regulating Wnt signaling activity.
Immunofluorescent staining of Pax2a and fluorescence in situ hybridization of lef1 in zebrafish kidneys at 5 dpi. Pax2a labeled renal tubules and renal progenitor cells (RPCs), and localized in the nucleus. (A, B) Injected DMSO as a control group and the amounts of lef1 could be detected in lhx1a+ cell aggregates during RPC aggregation (A) or proliferation (B). (C) lef1 level in lhx1a+ cell aggregates of cox2a-/- was significantly less than the control group, and injection of dmPGE2 (D, E) could rescue the influence of Cox2a deficiency. (F) lef1 level in lhx1a+ cell aggregates of wnt4a-/- was significantly less than the control group, and injection of dmPGE2 (G, H) could rescue the influence of Wnt4a deficiency. n = 3 in (A–H). Scale bar, 100 μm. (I) Bar chart depicting lef1 levels following acute kidney injury (AKI) (A–H). Fluorescent intensities per unit area were measured at the lhx1a+ RPC aggregates using ImageJ. lef1 levels of lhx1a+ RPCs during RPC aggregation normalized as 1. Ag, aggregation; Pr, proliferation. Data are mean ± SD, n = 3 in each condition.
Figure 7

PGE2 regulates the stability of β-catenin in renal progenitor cells (RPCs) through PKA.
(A, B) lhx1a mRNA levels were evaluated by RT-PCR at 7 dpi. β-actin was used as a sample control. (C–H) lhx1a whole-mount in situ hybridization (WISH) showing the trunk kidney region at 7 dpi. PKI (E) or H89 (G) treatment reduced the number of lhx1a+ cell aggregates, while injection of dmPGE2 could not rescue the influence of PKI (F) or H89 (H) treatment. (I) lhx1a+ cell aggregates of whole kidney were calculated using ImageJ. n = 5–7 in each condition. Data were analyzed by ANOVA, ***p<0.001; ns, no significant difference. (J–N) Immunofluorescence staining of p-S9-GSK3β (arrowheads) in Tg(lhx1a:DsRed) zebrafish kidneys at 5 dpi. (J, K) Zebrafish injected with DMSO as a control group, and the amount of p-S9-GSK3β could be detected in lhx1a+ cell aggregates cytoplasm during RPC aggregation (J) or proliferation (K). (L) p-S9-GSK3β in lhx1a+ cell aggregates of cox2a-/- was hardly detectable, and injection of dmPGE2 (M, N) could rescue the influence of Cox2a deficiency. Injection of PKI (O) could reduce p-S9-GSK3β level in lhx1a+ cell aggregates, while injection of dmPGE2 (P) could not rescue the influence of PKI treatment. (Q–W) Immunofluorescence staining of p-S675-β-catenin in Tg(lhx1a:DsRed) zebrafish kidneys at 5 dpi. (Q, R) Injection of DMSO as a control group and amounts of p-S675-β-catenin could be detected in lhx1a+ cell aggregates during RPC aggregation (Q) or proliferation (R). (S) p-S675-β-catenin level in lhx1a+ cell aggregates of cox2a-/- was hardly detectable, and injection of dmPGE2 (T, U) could rescue the influence of Cox2a deficiency. Injection of PKI (V) could reduce p-S675-β-catenin level in lhx1a+ cell aggregates, while injection of dmPGE2 (W) could not rescue the influence of PKI treatment. Scale bar, 50 μm. (X, Y) Bar chart depicting p-S9-GSK3β (X) and p-S675-β-catenin (Y) levels following acute kidney injury (AKI) (J–W). Fluorescent intensities per unit area were measured at the lhx1a+ RPC aggregates using ImageJ. p-S9-GSK3β or p-S675-β-catenin levels of lhx1a+ RPCs during RPC aggregation normalized as 1. Ag, aggregation; Pr, proliferation. n = 3–6 in each condition. Data were analyzed by ANOVA, ***p<0.001; ns, no significant difference.
-
Figure 7—source data 1
Original gel files of Figure 7A and B.
- https://cdn.elifesciences.org/articles/81438/elife-81438-fig7-data1-v2.zip
-
Figure 7—source data 2
Numerical data for Figure 7I, X, and Y.
- https://cdn.elifesciences.org/articles/81438/elife-81438-fig7-data2-v2.xlsx
Figure 8
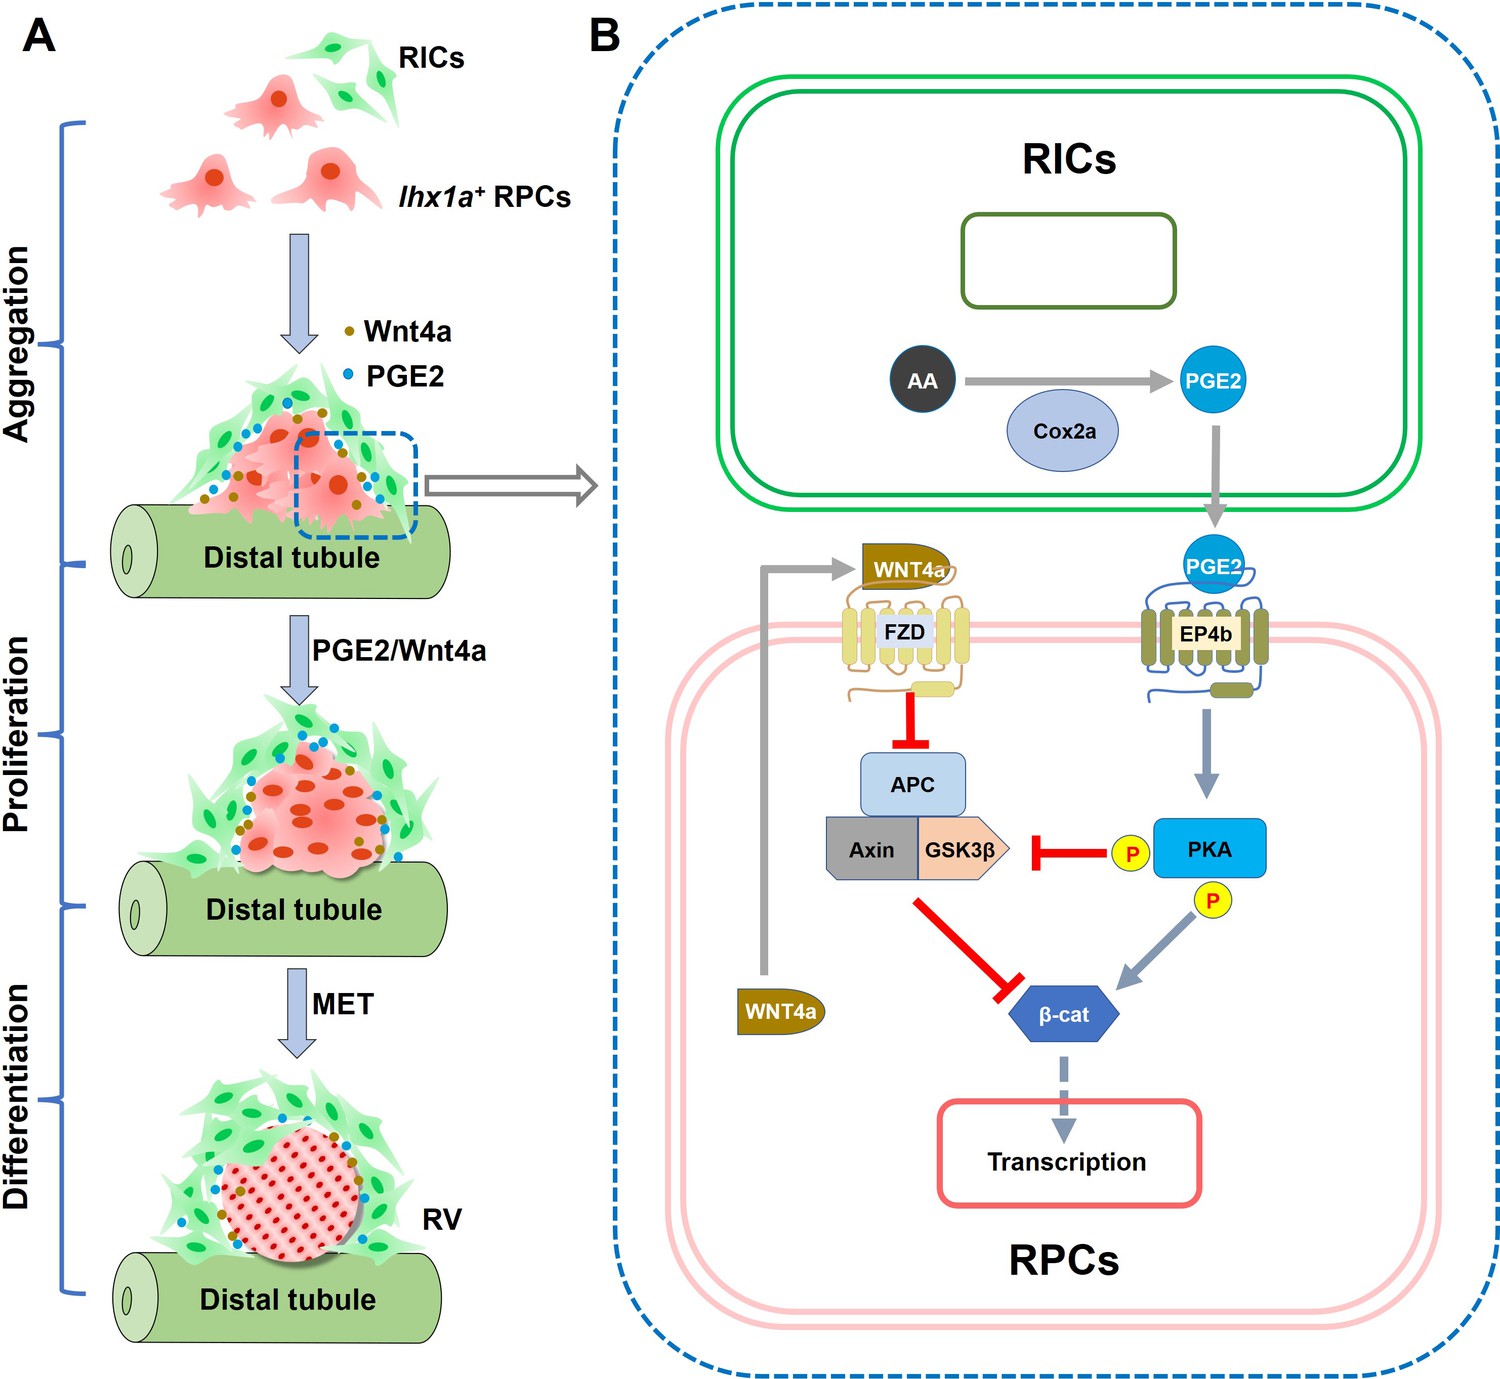
Graphical abstract summarizing the research findings.
(A) Diagram of RV formation process. During nephron regeneration, renal progenitor cells (RPCs) congregate to form cell aggregate, then renal interstitial cells (RICs) form a network to wrap the RPC aggregate and secrete PGE2. RIC-secreted PGE2 and RPC-secreted Wnt4a synergistically promote RPCs to proliferate rapidly and then differentiate into RV. (B) Model of the interaction between PGE2 and Wnt signaling pathway in RPC during regeneration. During nephron regeneration, RICs that are in close contact with RPC aggregates express Cox2a and secrete PGE2. PGE2 signaling interacts with Wnt/β-catenin pathway at the level of β-catenin destruction complex and direct modification of β-catenin stability in RPC. This is achieved through EP4b induction and the activation of PKA. PKA phosphorylates GSK3β at Ser9, preventing the assembly of the β-catenin destruction complex. PKA also phosphorylates β-catenin at Ser675, resulting in stabilization of β-catenin. Wnt4a secreted by RPC can also reduce the stability of the destruction complex through the FZD receptor, thereby enhancing stabilization of β-catenin in response to acute kidney injury (AKI).
Tables
Key resources table
| Reagent type (species) or resource | Designation | Source or reference | Identifiers | Additional information |
|---|---|---|---|---|
| Gene (Danio rerio) | cox2a | GenBank | NM_153657.1 | |
| Gene (D. rerio) | cox1 | GenBank | NM_153656.2 | |
| Gene (D. rerio) | cox2b | GenBank | NM_001025504.2 | |
| Gene (D. rerio) | ep1 | GenBank | NM_001166330.1 | |
| Gene (D. rerio) | ep2a | GenBank | NM_200635.1 | |
| Gene (D. rerio) | ep3 | GenBank | XM_017356646.2 | |
| Gene (D. rerio) | ep4a | GenBank | NM_001039629.1 | |
| Gene (D. rerio) | ep4b | GenBank | NM_001128367.1 | |
| Gene (D. rerio) | wnt4a | GenBank | NM_001040387.1 | |
| Gene (D. rerio) | lhx1a | GenBank | NM_131216.1 | |
| Gene (D. rerio) | lef1 | GenBank | NM_131426.1 | |
| Gene (D. rerio) | epoa | GenBank | NM_001038009.2 | |
| Strain, strain background (D. rerio) | AB | Laboratory resources | Labs | |
| Strain, strain background (D. rerio) | Tg(fabp10a:GFP) | Laboratory resources | Labs | |
| Strain, strain background (D. rerio) | Tg(lhx1a:DsRed) | This study | methods | |
| Strain, strain background (D. rerio) | Tg(cdh17:DsRed) | This study | methods | |
| Strain, strain background (D. rerio) | wnt4a-/- | Chinese National Zebrafish Resource Center (Wuhan, China) | fh294 | |
| Strain, strain background (D. rerio) | cox2a-/- | Li et al., 2019 | ||
| Antibody | Anti-Cox2 (goat polyclonal) | Cayman, 100034-lea | RRID:AB_10078977 | IF (1:200) |
| Antibody | Anti-β-catenin (mouse monoclonal) | Sigma, C7207 | RRID:AB_2086128 | IF (1:200) |
| Antibody | Anti-p-Ser9-GSK3 beta (rabbit polyclonal) | Abcam, ab107166 | RRID:AB_476865 | IF (1:200) |
| Antibody | Anti-phospho-β-catenin (ser675) (D2F1) XP (rabbit monoclonal) | CST, 4176T | RRID:AB_1903923 | IF (1:200) |
| Antibody | Anti-Pax2a (rabbit polyclonal) | Abcam, ab229318, Chen et al., 2019 | IF (1:200) | |
| Antibody | Anti-Pan-cadherin (rabbit polyclonal) | Sigma, C3678 | RRID:AB_258851 | IF (1:100) |
| Antibody | Goat anti-mouse IgG H&L Alexa Fluor 647 (goat polyclonal) | Abcam, ab150115 | RRID:AB_2687948 | IF (1:500) |
| Antibody | Donkey anti-goat IgG (Alexa Fluor 647) (donkey polyclonal) | Abcam, ab150131 | RRID:AB_2732857 | IF (1:500) |
| Antibody | Goat anti-rabbit IgG (H+L) Alexa Fluor 488 (goat polyclonal) | Invitrogen, A11008 | RRID:AB_143165 | IF (1:500) |
| Antibody | Goat anti-rabbit IgG (H+L) Alexa Fluor 633 (goat polyclonal) | Invitrogen, A21070 | RRID:AB_2535731 | IF (1:500) |
| Chemical compound, drug | Indomethacin | Sigma | I7378-5G | |
| Chemical compound, drug | NS-398 | Sigma | N194-5MG | |
| Chemical compound, drug | TG4-155 | Selleck | S6793 | |
| Chemical compound, drug | dmPGE2 | Sigma | D0160 | |
| Chemical compound, drug | GW627368X | TOPSCIENCE | T1978 | |
| Chemical compound, drug | XAV939 | Selleck | S1180 | |
| Chemical compound, drug | ICRT 14 | MCE | HY-16665 | |
| Chemical compound, drug | ICG-001 | MCE | HY-14428 | |
| Chemical compound, drug | H89 (dihydrochloride) | MCE | HY-15979A | |
| Chemical compound, drug | PKA Inhibitor Fragment (6-22) amide (TFA) | MCE | HY-P1290A | |
| Software, algorithm | GraphPad Prism (version 8.02) | GraphPad Prism, version 8.02 | RRID:SCR_002798 | |
| Software, algorithm | Excel 2019 | Microsoft, version office home and student 2019 | RRID:SCR_016137 | |
| Software, algorithm | ImageJ for Windows, V 1.8.0 | National Institutes of Health | RRID:SCR_001935 | |
| Other | DAPI Stain Solution | Beyotime | C1002 | For nucleic acid staining |
Additional files
Download links
A two-part list of links to download the article, or parts of the article, in various formats.
Downloads (link to download the article as PDF)
Open citations (links to open the citations from this article in various online reference manager services)
Cite this article (links to download the citations from this article in formats compatible with various reference manager tools)
Renal interstitial cells promote nephron regeneration by secreting prostaglandin E2
eLife 12:e81438.
https://doi.org/10.7554/eLife.81438


