State-specific morphological deformations of the lipid bilayer explain mechanosensitive gating of MscS ion channels
- Theoretical Molecular Biophysics Laboratory, National Heart, Lung and Blood Institute, National Institutes of Health, United States
- Department of Biochemistry and Molecular Biology, University of Chicago, United States
Figures
Figure 1
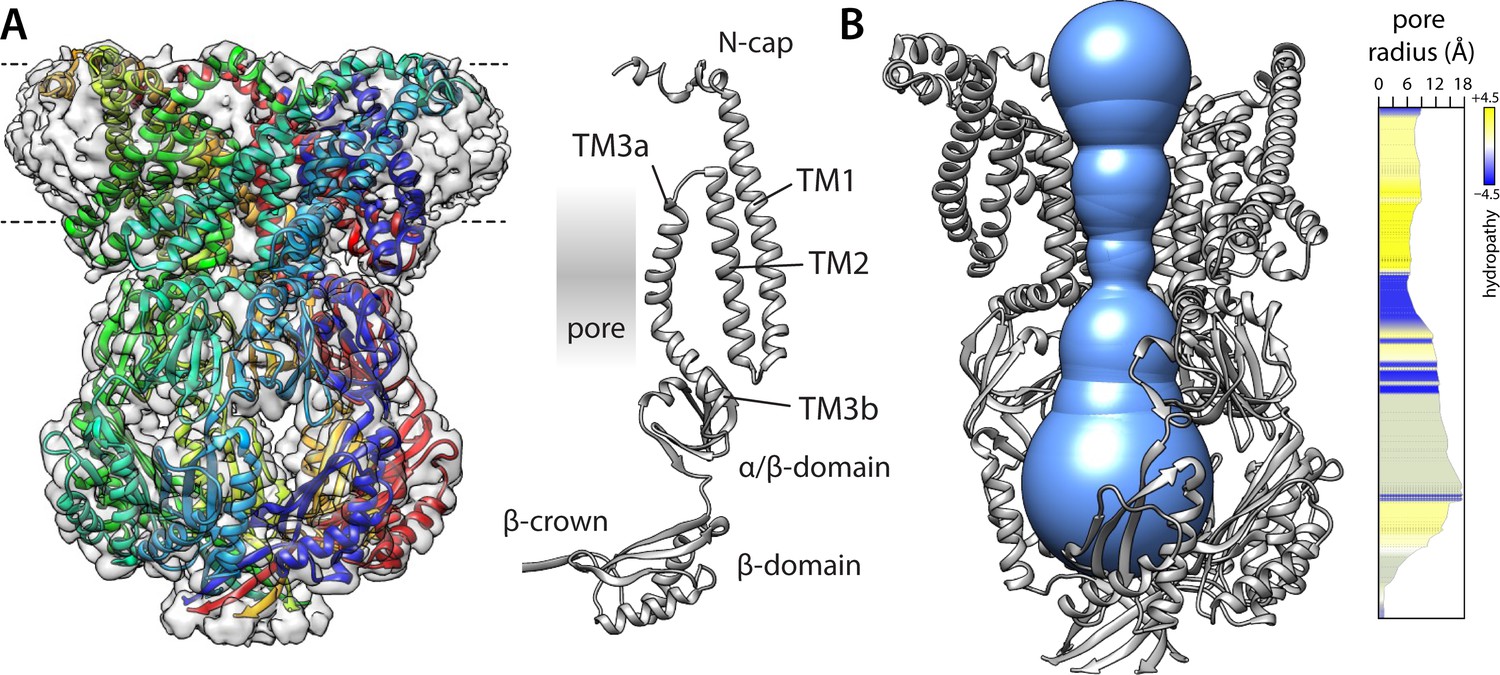
Structure of a putatively open conformation of wild-type MscS in a lipid nanodisc.
(A) Left, structure of the MscS heptamer (in cartoon representation) fitted on the 3.1 Å resolution cryo-electron microscopy (EM) map (transparent surface). Each protomer is shown in a different color. The approximate position of the membrane is indicated with dashed lines. Right, cartoon representation of an individual protomer, in relation to the central pore. (B) Cut-away of the structure (minus two protomers) showing the shape of the ion permeation pathway as determined by MOLEonline (Pravda et al., 2018). The rightmost plot quantifies the radius along the central symmetry axis as well as the hydrophobicity of the pore amino-acid make up.
Figure 2 with 1 supplement
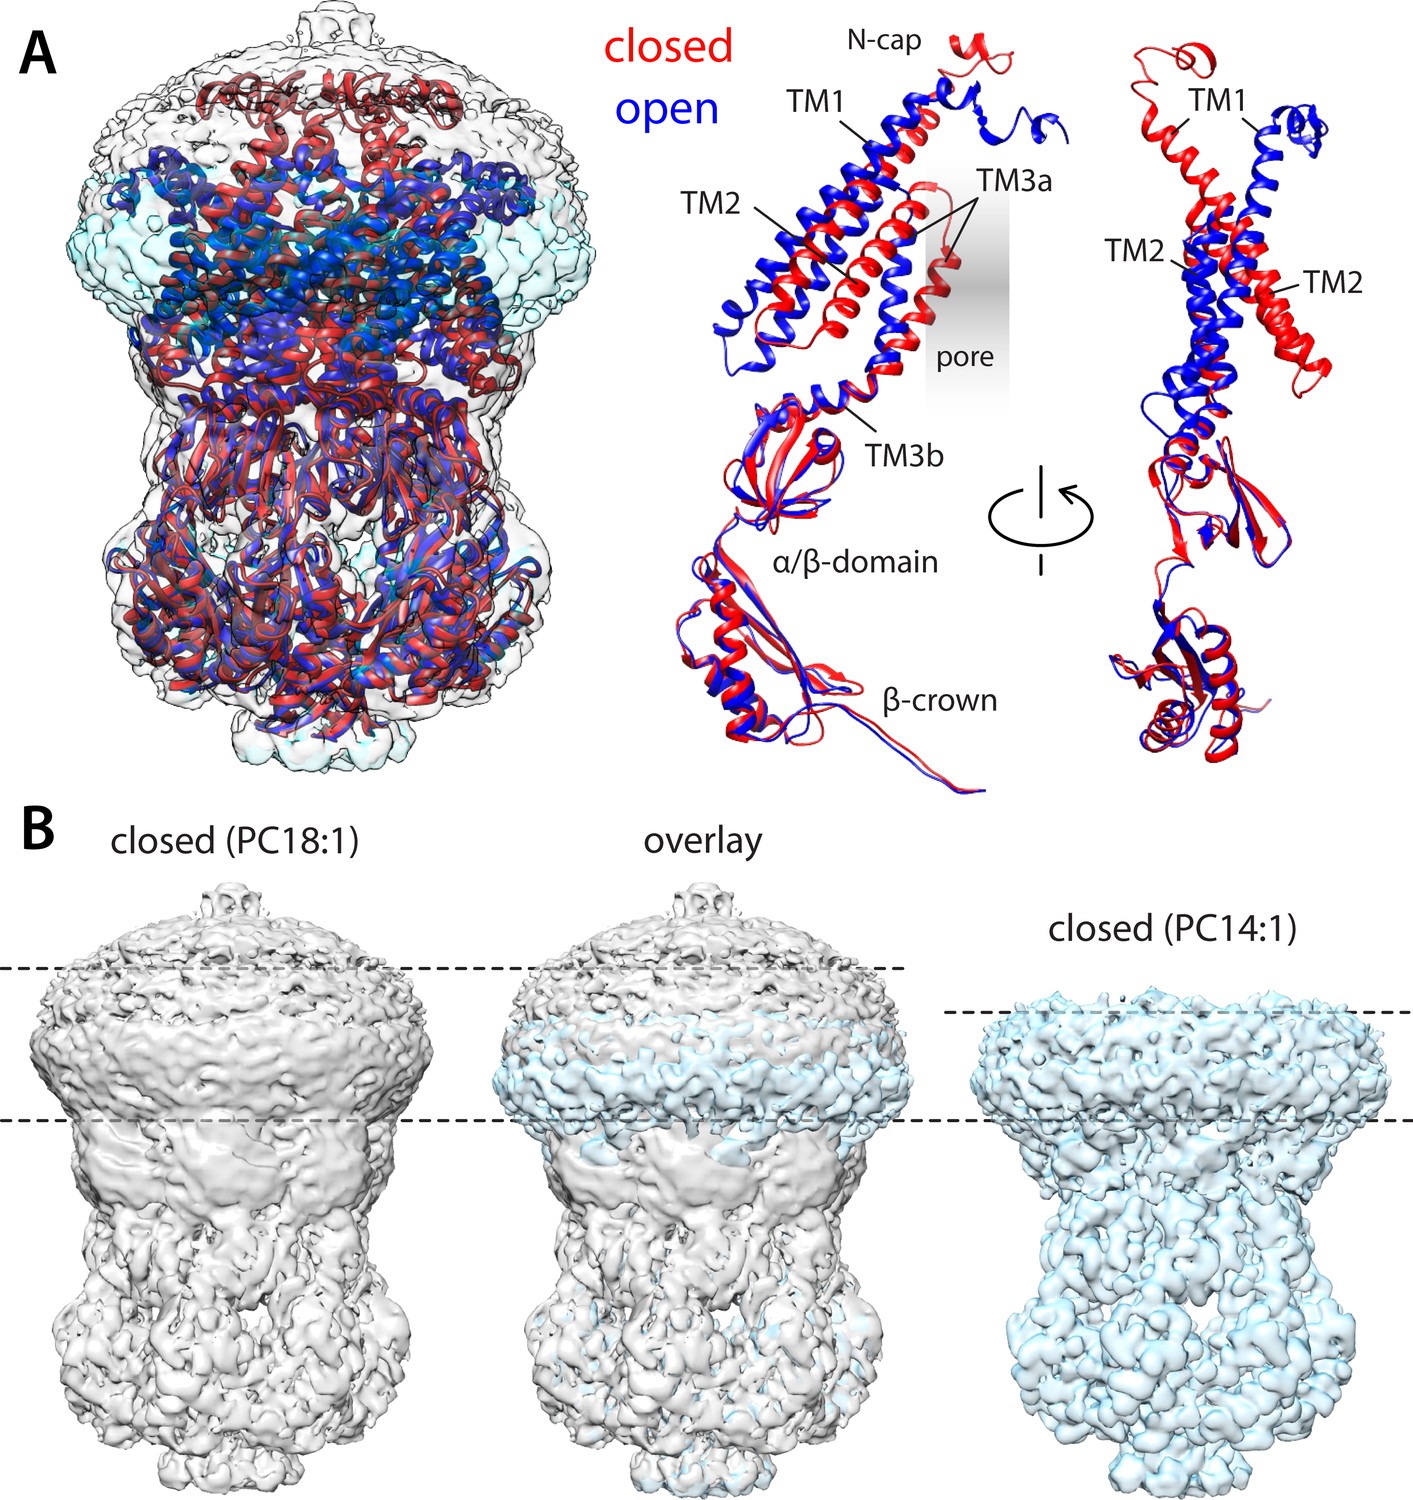
Comparison of closed and open structures of MscS in lipid nanodiscs.
(A) Left, the open structure of MscS in PC14:1 lipid nanodiscs (blue cartoons) is superimposed onto that of the closed state (red), previously determined in PC18:1 nanodiscs (PDB ID 6PWN, and EMD-20508). The corresponding cryo-electron microscopy (EM) density maps (transparent cyan and gray surfaces, respectively) are shown as well. Right, conformational change in each of the protomers. (B) Side-by-side comparison of the cryo-EM density maps obtained in PC18:1 (gray) and PC14:1 (cyan), alongside their overlap. The comparison highlights the reduction in the width of the transmembrane span of the channel upon opening, seemingly matched by thinning of the lipid nanodiscs, by approximately 7 Å.
Figure 2—figure supplement 1
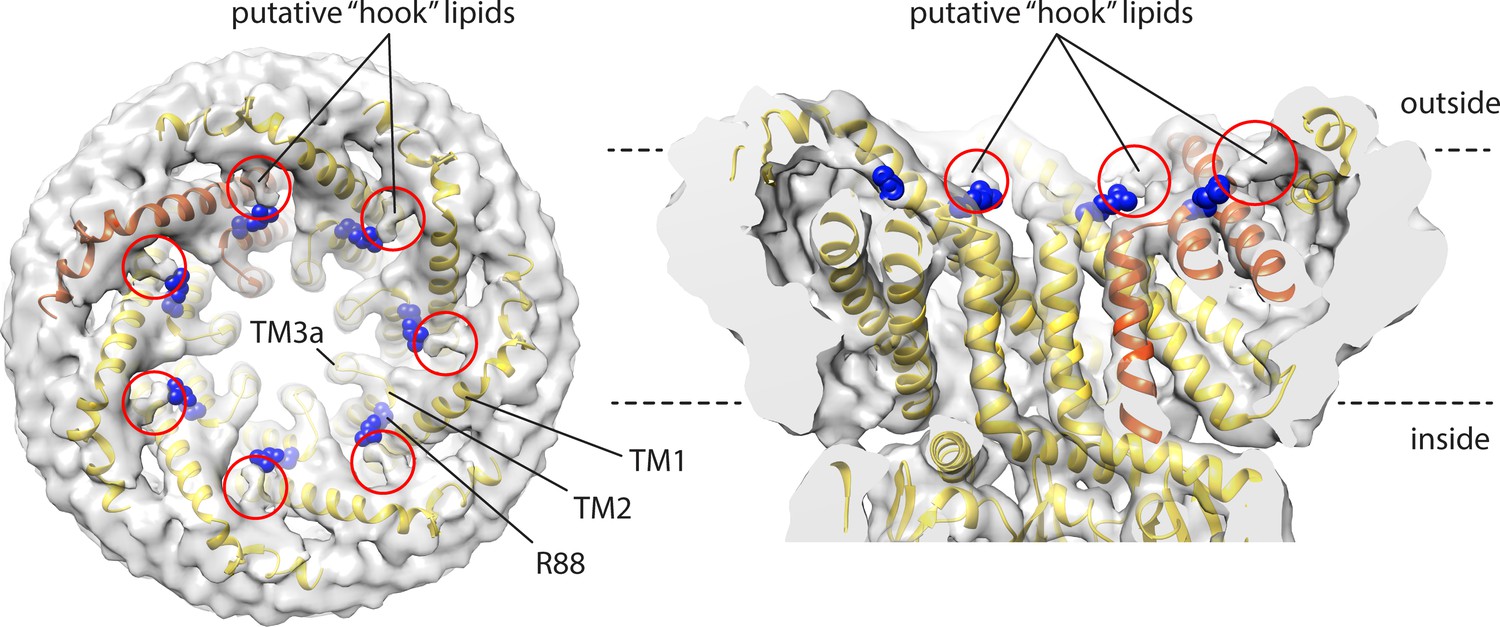
Cryo-electron microscopy (EM) map and structural model of open-state MscS in PC14:1 lipid nanodiscs, highlighting putative sites of lipid interaction atop the C-terminus of TM2, involving residue R88.
Lipids at these sites were more clearly discerned in the closed state in PC18:1 nanodiscs (Reddy et al., 2019), and referred to as ‘hook’ lipids.
Figure 3
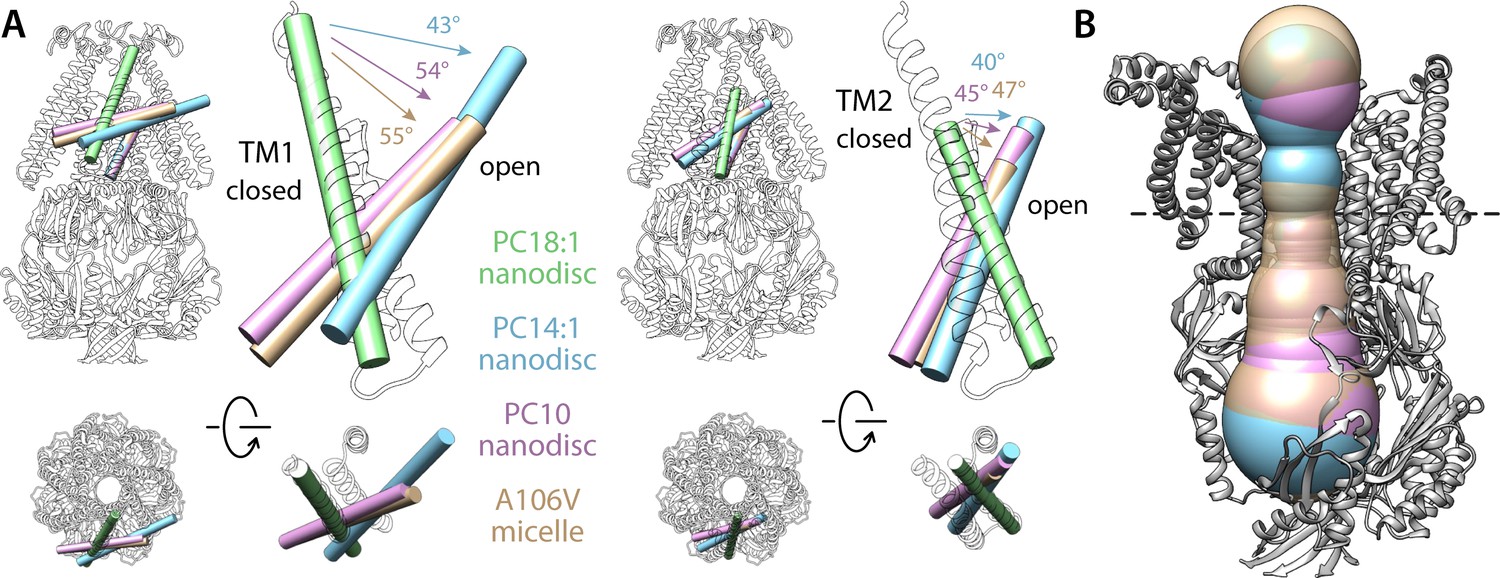
Comparison of alternate conformations of open MscS obtained in different experimental conditions.
(A) Overlay comparing helices TM1 and TM2 in the closed state (green tube and white cartoons) and in the putatively open states obtained in PC14:1 nanodiscs (this work, cyan), in PC10:0 nanodiscs (PDB 6VYL, pink) and in detergent micelles (PDB ID 2VV5, orange). Note the structures in lipid nanodisc were determined with single-particle cryo-electron microscopy (EM) for the wild-type protein, while the A106V structure in detergent was determined with X-ray crystallography. All structures are superimposed based on TM3. (B) Comparison of the dimensions of the permeation pore in the three structures of the putatively open state. The black-dashed line indicates the position of L105, which is approximately where the pore is narrowest; the radius here is 6.3 Å for the PC14:1 structure, 6.7 Å for the PC10:0 structure, and 7.5 Å for the mutant in detergent.
Figure 4 with 2 supplements
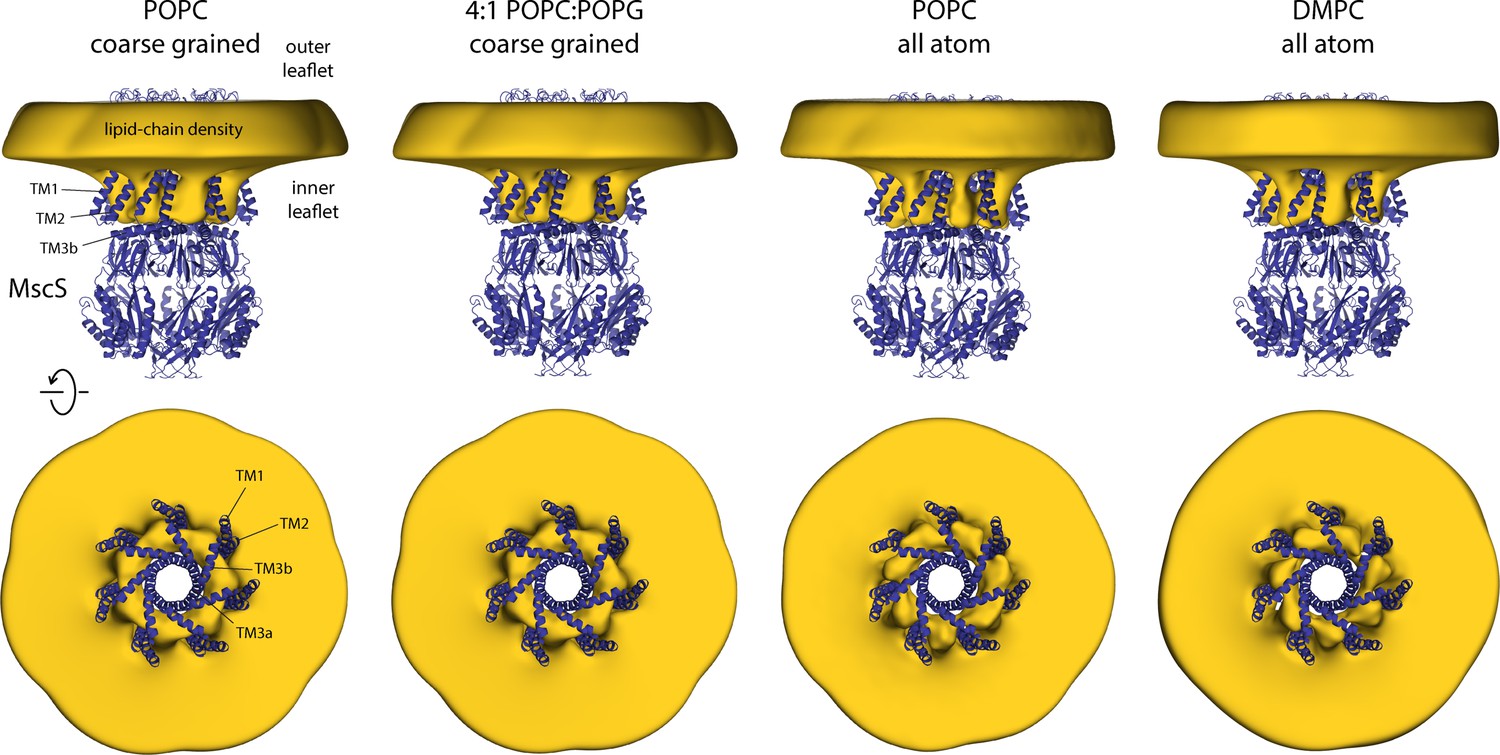
Closed-state MscS induces drastic perturbations of the lipid bilayer.
The figure summarizes the results from multiple simulations of the closed structure of MscS in different membrane compositions and using different forcefield representations (Table 1). The cryo-electron microscopy (EM) structure of MscS (blue cartoons) is overlaid with calculated 3D density distributions mapping the morphology of the alkyl chain bilayer in each of the molecular dynamics (MD) trajectories (gold volume), up to 50 Å from the protein surface. Protein and density maps are viewed along the membrane plane (top row) and along the pore axis, from the cytosolic side (bottom row); the latter includes only the transmembrane domain of the channel, for clarity. The calculated density maps derive from 20 µs of trajectory data for each of the coarse-grained systems and at least 8 µs of trajectory data for the all-atom systems.
Figure 4—figure supplement 1
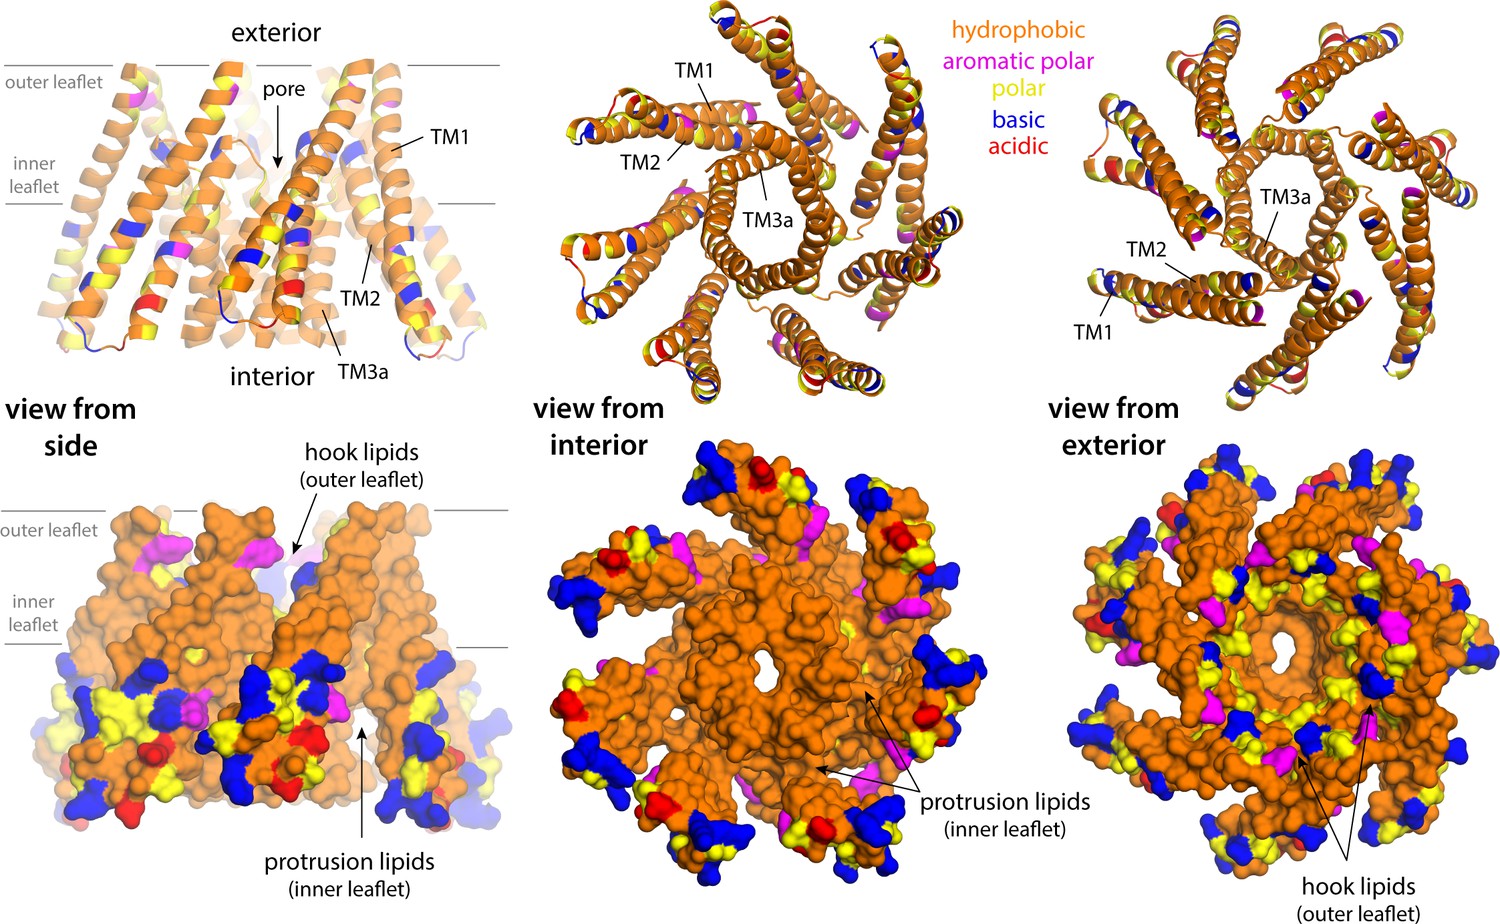
Lipid solvation of hydrophobic cavities outside the membrane drives the formation of inner-leaflet protrusions in closed-state MscS.
The figure shows three different views of a fragment of the closed MscS structure comprising TM1, TM2, and TM3a (from left to right) in two alternative representations (top and bottom). Residues are colored according to type, as indicated. The location of the inner leaflet protrusions under the TM1–TM2 hairpin is indicated; the site where the so-called ‘hook’ lipids are observed is also indicated. The conformation of the channel that is represented is that in the all-atom snapshot shown in Figure 5A.
Figure 4—figure supplement 2
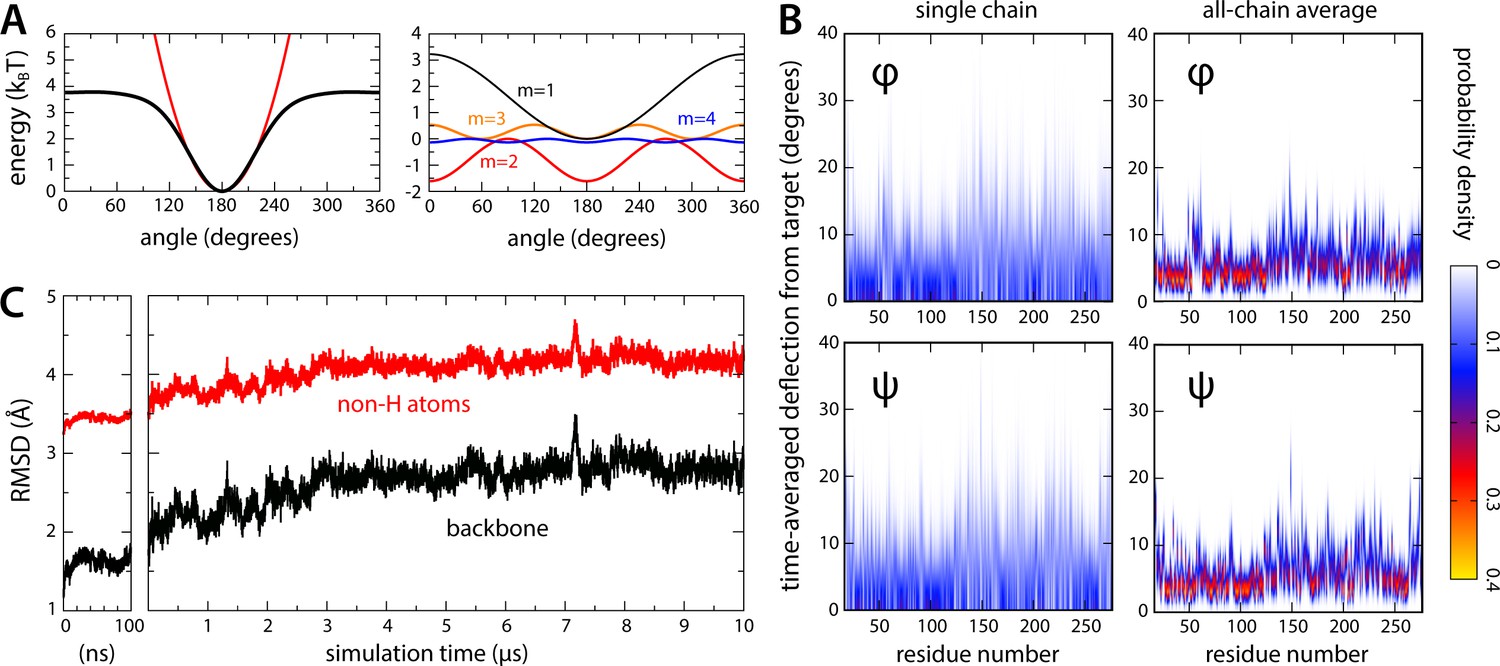
Relaxation of the closed-state MscS structure in all-atom simulations.
(A) To preclude large-scale changes in fold that might develop in the 10-μs timescale due to cumulative forcefield inaccuracies, a restraining potential was applied to all and angles in the channel backbone, of the form , where is the value of either dihedral angle at time in the simulation, denotes the value in the experimental structure, and equals 4 kJ/mol (see Materials and methods). The black curve in the left plot in (A) exemplifies this potential for = 180; for comparison, a harmonic potential is superimposed (red line), where 0.0025 kJ/mol/deg2. The right plot in (A) shows each of the first four terms contributing to . (B) For each residue in the channel, observed deflections in and during the simulation relative to the corresponding values in the experimental structure, individually quantified as probability density distributions. The left plots show data for a single chain in the heptamer, selected at random; the right plots show a global analysis for all seven chains. (C) Root-mean-squared (RMS) difference between simulated and experimental channel structure, as a function of simulation time. Data is provided for the backbone atoms only and for backbone and sidechains, excluding hydrogen atoms. The RMS difference calculation was preceded by least-squares superposition of the protein backbone in the snapshot considered and in the experimental structure. The plot on the left shows data for the initial equilibration of the simulation system, carried out using NAMD; the plot on the right shows data for the ANTON2 simulation (see Materials and methods).
Figure 5 with 1 supplement
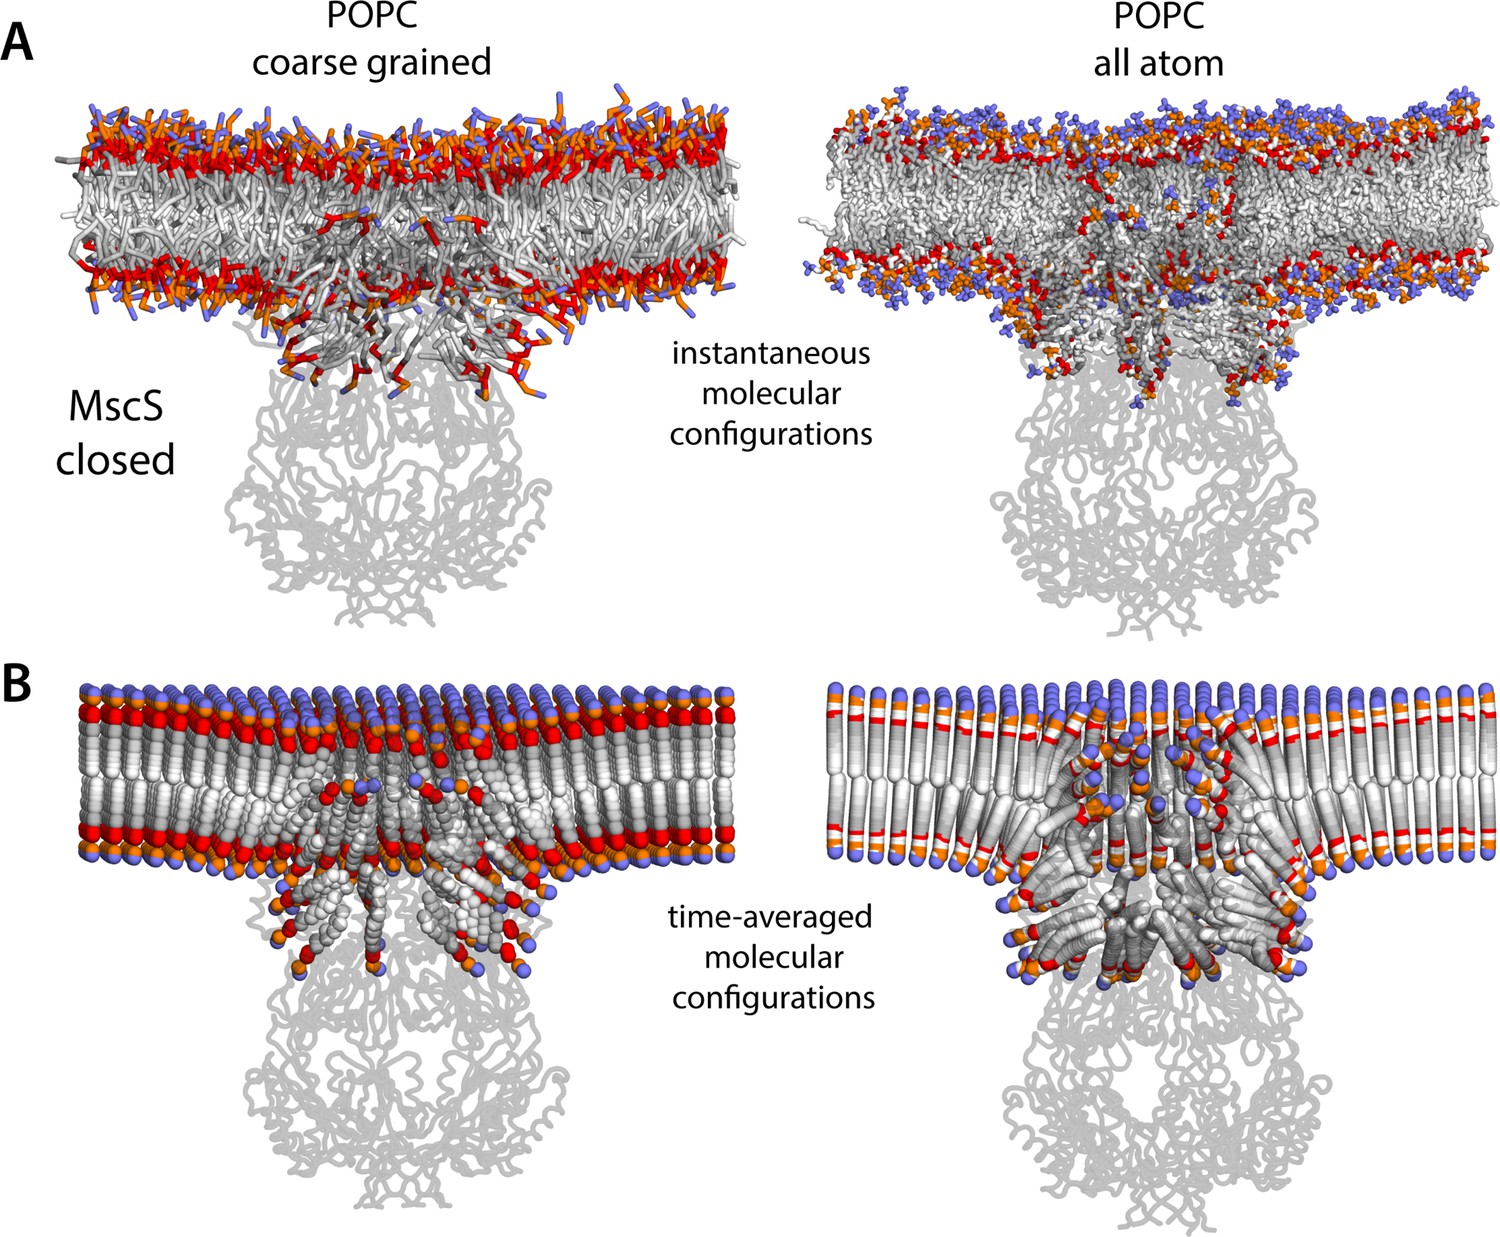
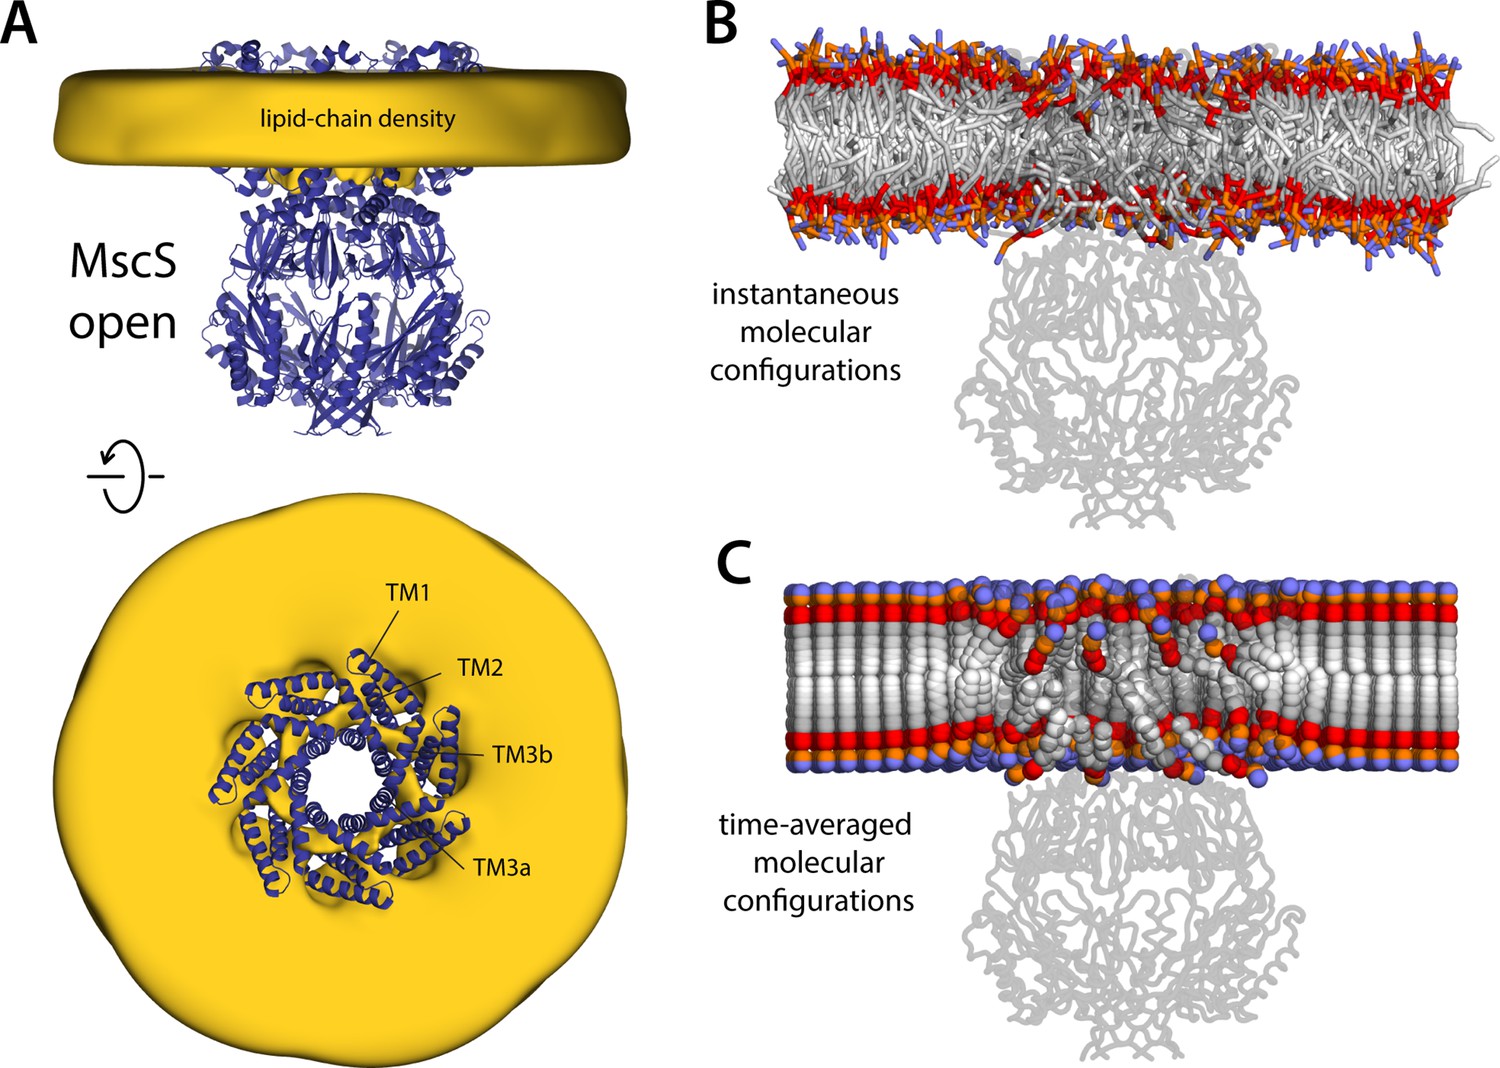
Molecular structure of the membrane perturbations induced by MscS in the closed state.
(A) Instantaneous configurations of the lipid bilayer in single snapshots of two of the molecular dynamics (MD) trajectories calculated for closed-state MscS in POPC (1-palmitoyl-2-oleoyl-sn-glycero-3-phosphocholine), shown in cross section to reveal the structure of the membrane perturbations induced by the protein. Choline groups are shown in purple, phosphate in orange, ester linkages in red, and alkyl chains in shades of gray. The channel structure is overlaid, shown in cartoons. (B) Time-averages of the instantaneous lipid configurations observed in the same two trajectories, mapped across the membrane plane. Averages are calculated for each lipid atom and shown as spheres, colored as in panel (A). Owing to the configurational and rotational dynamics of lipids, the resulting averages are non-physical structures, but they nevertheless capture the position and orientation adopted by lipid molecules in different regions of the membrane. The average configuration of the channel backbone is also shown, overlaid. Protein and lipid averages are derived from 20 µs of trajectory data for the coarse-grained system and 10 µs of trajectory data for the all-atom system. The figures in panel A show snapshots at t ≈ 7 µs of the coarse-grained simulation and at t ≈ 5 µs of the all-atom simulation.
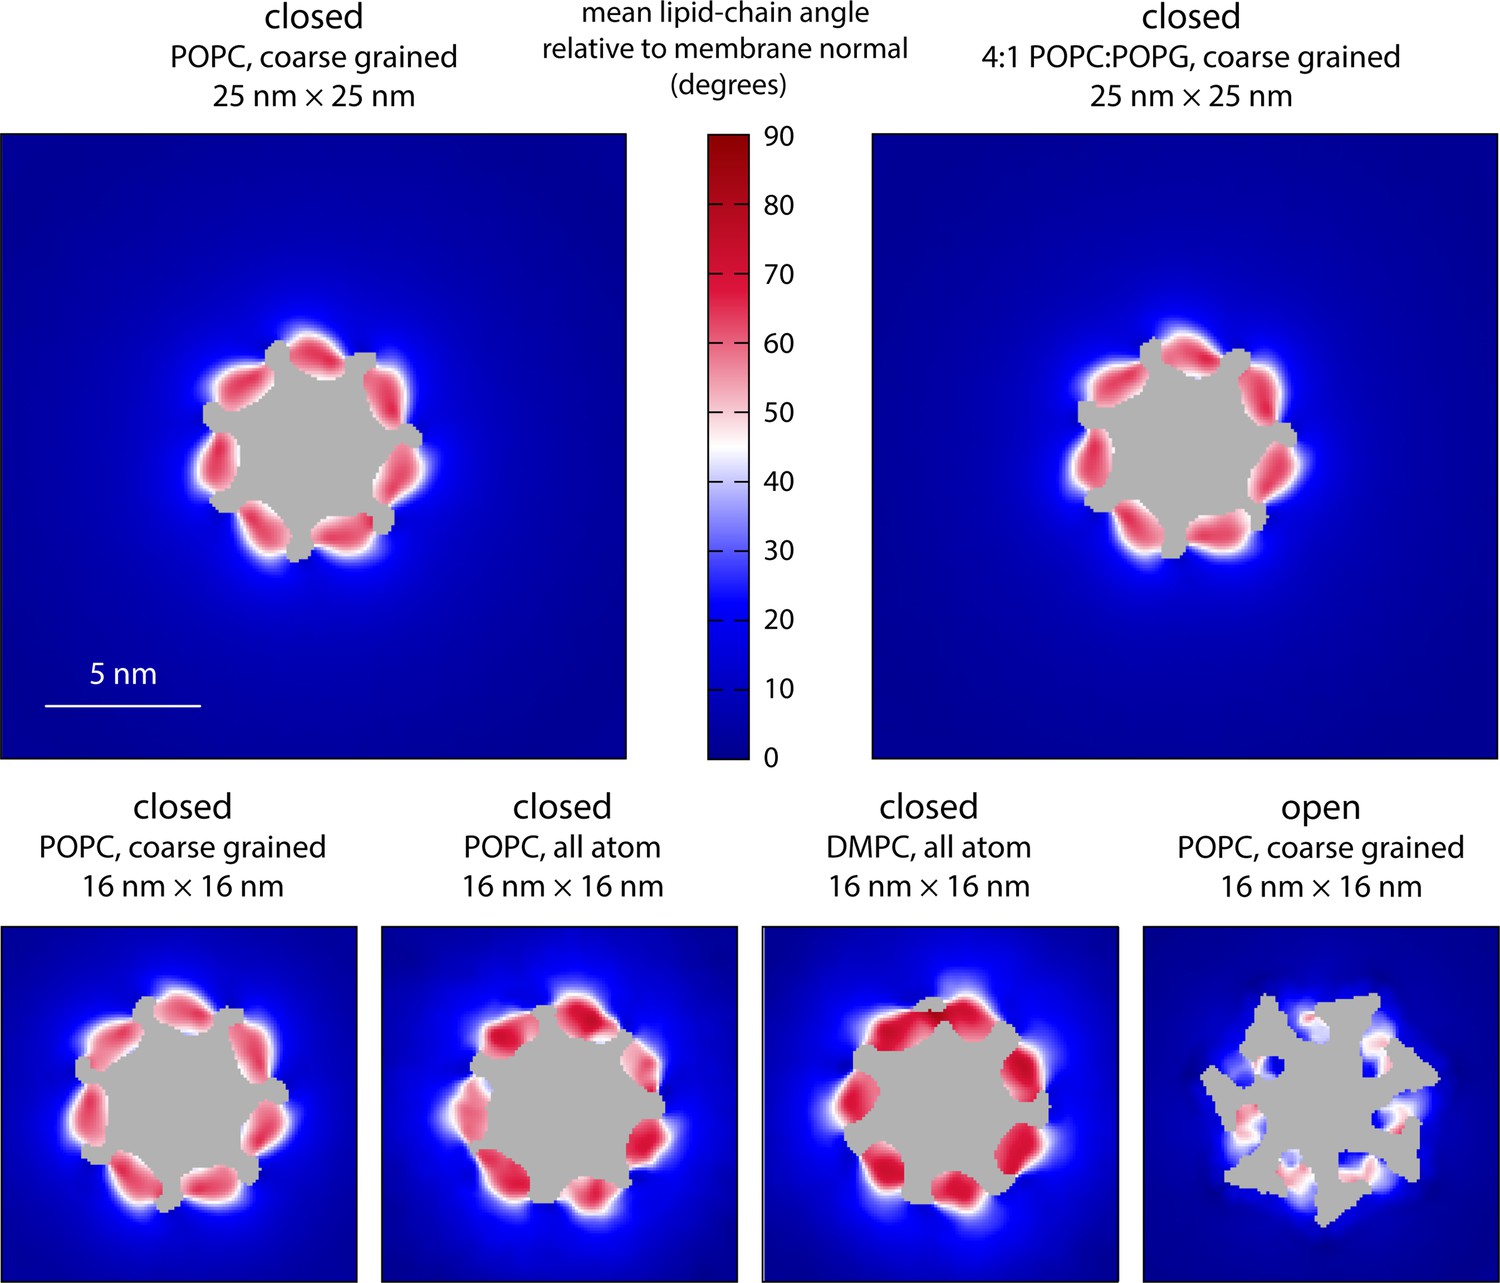
Figure 5—figure supplement 1
Molecular structure of the membrane perturbations induced by MscS in the closed state.
The figure reports results for multiple simulations of closed- and open-state MscS in membranes of different size and lipid composition using either coarse-grained or all-atom representations (Table 1). Specifically, the plots map the characteristic tilt of the lipid alkyl chains across the inner leaflet of the bilayer, relative to the membrane perpendicular, derived from analysis and averaging of instantaneous lipid configurations. The central areas (gray) are occupied by protein or solvent filling the central pore. The maps are derived from 20 µs of trajectory data for each of the coarse-grained systems and at least 8 µs of trajectory data for the all-atom systems.
Figure 6

Lipids in inner-leaflet protrusions exchange with lipids in the bulk membrane.
(A) Close-up of one of the hydrophobic cavities that drive the formation of membrane protrusions in closed-state MscS. To identify which lipids reside in these protrusions and for how long, we monitored their distance to the Cα atom of residue Ile150; for comparison, we also tracked their distance to residue Ile43, which faces the inner leaflet of the (locally unperturbed) membrane. (B) Number of lipid molecules found at any given time in the inner leaflet protrusions (i.e. within 20 Å of Ile150; blue lines), in comparison with those found in proximity to Ile43 (black), during coarse-grained simulations of closed-state MscS in POPC (1-palmitoyl-2-oleoyl-sn-glycero-3-phosphocholine). The plot shows the average value for the seven protrusions (thick lines) as well as the variance in the observed values (thin lines). (C) Time-course of the number of new, unique lipids contributing to the populations shown in panel (B). Lipids in the first snapshot were not considered newly found; hence, all curves start from a value of 0. For comparison, the total number of lipid molecules in the inner leaflet is indicated (red line). Note that after 20 μs of coarse-grained (CG) simulation, all lipids in the inner leaflet have at some point been in proximity to each of the seven Ile43 residues, while about 40 different lipids have been at some point in each of the seven membrane protrusions. (D and E) Same as (B and C), for the analogous 10 μs all-atom simulation of closed-state MscS in POPC.
Figure 7

Persistence of lipid protrusions across increasing lateral tension conditions despite changes in global membrane properties.
The figure summarizes the results from simulations of the closed structure of MscS under different membrane tensions. (A) The cryo-electron microscopy (EM) structure of MscS in the closed state (blue cartoons) is overlaid with a calculated 3D density distribution mapping the morphology of the alkyl chain double layer in the molecular dynamics (MD) trajectory (gold volume), up to 50 Å from the protein surface. Protein and density maps are shown as in Figure 4. (B) The lateral tension reported by the MD engine during the simulations (in 500 ps intervals, then averaged) is compared with the target tension value in each case (see Materials and methods). Error bars denote the SEM. A line of best fit is shown superimposed (gray), along with the slope a and intercept b. (C) Number of lipids in the inner-leaflet protrusions and near control sites, calculated as described in Figure 6, for each tension condition (average values for control sites: 10.13, 10.09, 10.01, 9.86, and 9.50 lipids; for protrusions: 3.82, 3.83, 3.80, 3.77, and 3.73 lipids; for applied tensions of 0, 0.5, 2.5, 5, and 10 mN/m, respectively). (D) Lipid exchange between the bulk and the protrusions/control sites, for each tension condition, evaluated as in Figure 6. (E and F) Changes in mean membrane thickness and mean area per lipid as the applied lateral tension increases. Bulk values were computed by averaging all local values (mapped on a discrete lattice) at least 20 Å away from the surface of the protein. Bilayer thickness was evaluated using the glycerol groups. Area-per-lipid values were averaged across leaflets. Error bars represent the SEM.
Figure 8 with 2 supplements
Membrane perturbations are largely eliminated upon MscS channel opening.
The figure summarizes the results from a 20-µs simulation of open MscS in a POPC (1-palmitoyl-2-oleoyl-sn-glycero-3-phosphocholine) membrane, using a coarse-grained representation. (A) The cryo-electron microscopy (EM) structure of MscS in the open state (blue cartoons) is overlaid with a calculated 3D density distribution mapping the morphology of the alkyl chain double layer in the molecular dynamics (MD) trajectory (gold volume), up to 50 Å from the protein surface. Protein and density maps are shown as in Figure 4. (B) Instantaneous configuration of the lipid bilayer in a snapshot of the MD trajectory, shown in cross-section as in Figure 5A. (C) Time-averages of the instantaneous lipid configurations observed in the trajectory, mapped across the membrane plane and shown in cross-section. Averages were calculated and are represented as in Figure 5B.
Figure 8—figure supplement 1
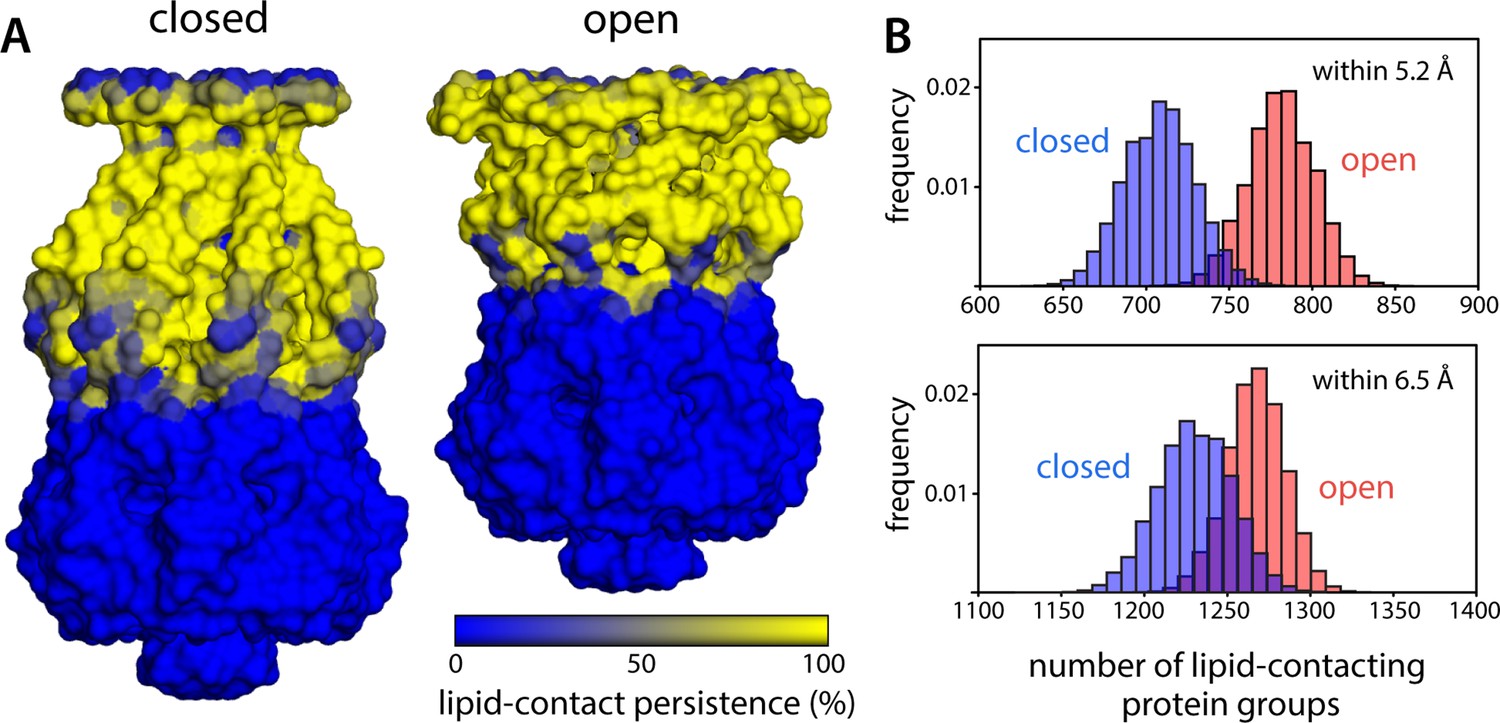
Change in protein-lipid interfacial area during gating is much smaller than what could be inferred from change of in-plane cross-sectional area.
(A) To evaluate the area of the protein surface exposed to the membrane, we quantified the number of coarse-grained (CG) particles in the channel within 6.5 Å of any lipid particle, for each snapshot of the molecular dynamics (MD) trajectories calculated for closed and open MscS in a POPC (1-palmitoyl-2-oleoyl-sn-glycero-3-phosphocholine) lipid bilayer. Note that each CG particle approximately represents one chemical group in protein sidechains and backbone and that a distance of 6.5 Å implies either a direct or close-range contact, as the typical radius of the CG particles is 2.6 Å. The results from this analysis are mapped on the channel surface, for either functional state, coloring each CG particle according to the persistence of their exposure to the lipid bilayer over time. (B) Histograms quantifying the variability in number of CG particles in the channel that are exposed to the lipid bilayer across different snapshots within the same trajectory. For completeness, data are shown for a distance threshold of 6.5 Å, as in panel (A), as well as for 5.2 Å, which implies direct contact. For threshold 5.2 Å, the number of lipid-contacting protein groups is 708.2±21.4, while in the open state, this number is 781.3±20.1, reflecting a 10.3% increase. For threshold 6.5 Å, the corresponding values are 1230.3±22.5 and 1267.9±17.6, reflecting a 3.0% difference. In contrast, geometric idealiziations of the protein-lipid interface would suggest a >90% increase in the in-plane cross-sectional area of the channel upon opening, and a >120% increase in the membrane-exposed area.
Figure 8—figure supplement 2
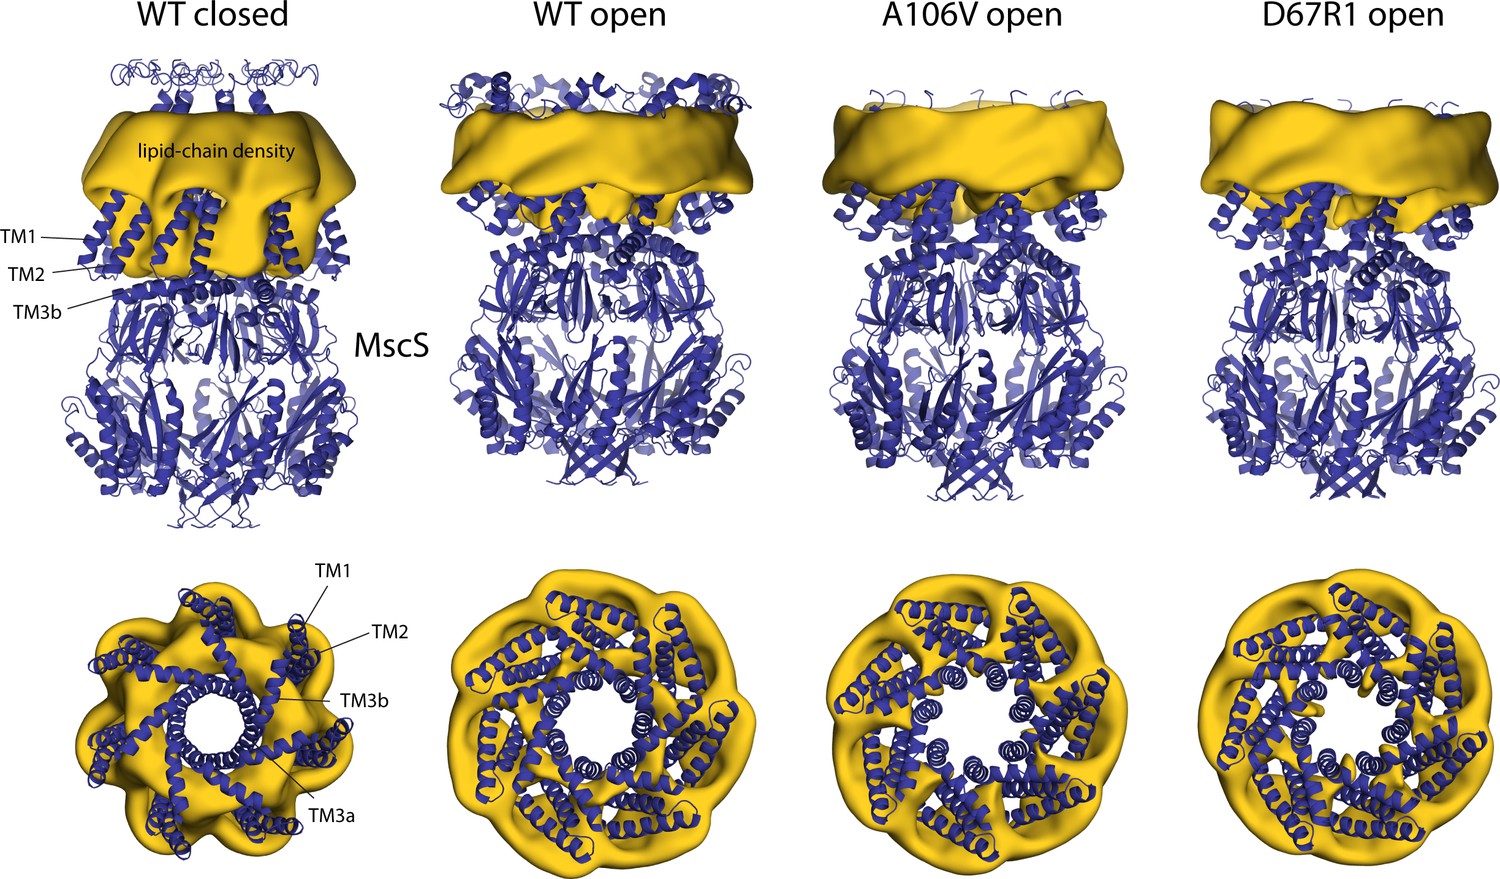
Changes in membrane morphology upon gating of MscS.
The figure summarizes results from simulations of alternative open conformations of wild-type and mutagenized MscS in POPC (1-palmitoyl-2-oleoyl-sn-glycero-3-phosphocholine; Wang et al., 2008; Pliotas et al., 2015), as well as of a closed state, using a coarse-grained representation of the system (Table 1). The experimental structures (blue cartoons) are overlaid with calculated 3D density distributions mapping the morphology of the alkyl chain double layer in each of the molecular dynamics (MD) trajectories (gold volumes), up to 10 Å from the protein surface. Maps are represented as in Figure 4. Data represent averages over 20 µs of simulation.
Figure 9
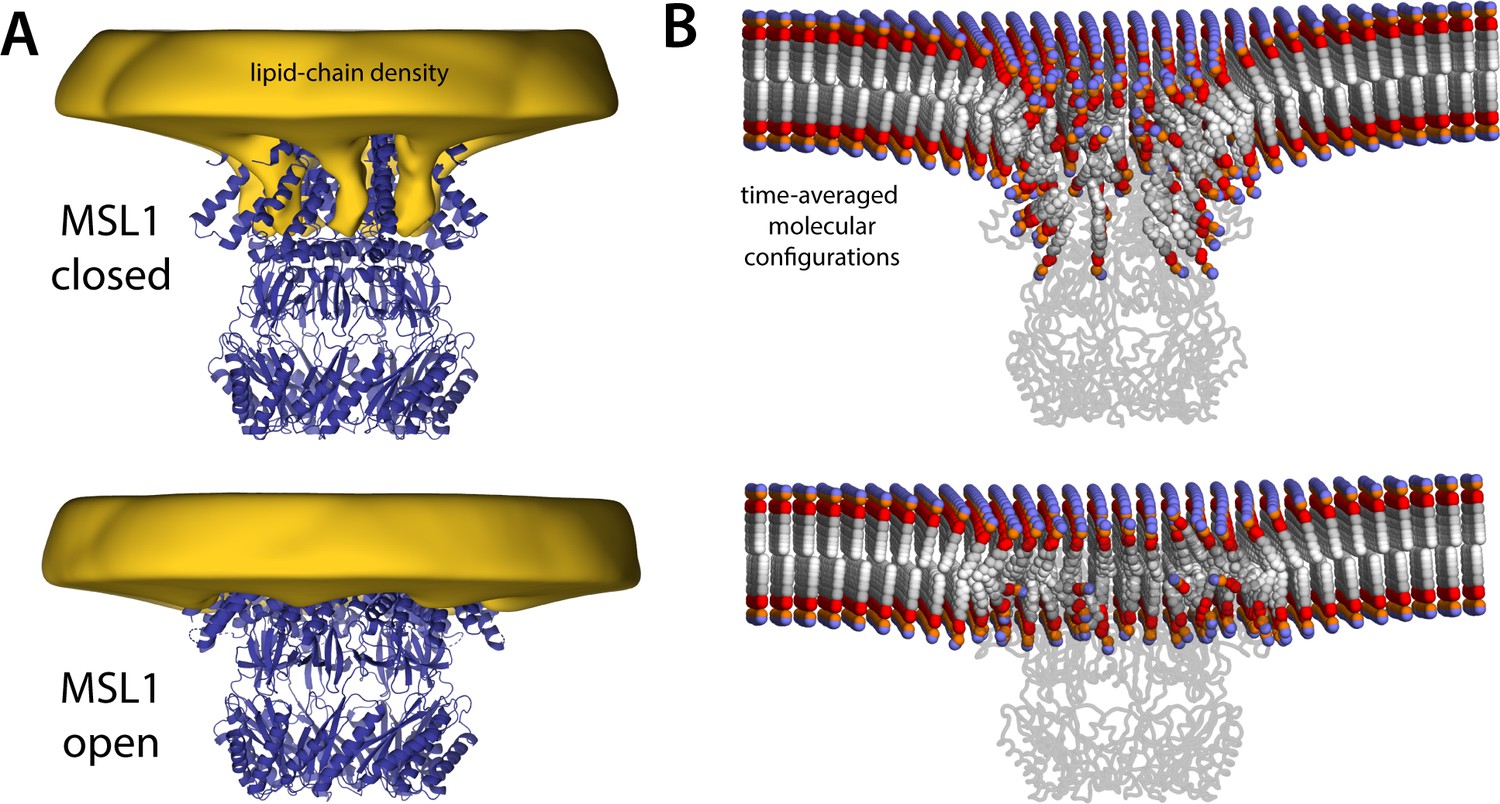
MSL1 gating causes morphological changes in membrane akin to those observed for MscS.
The figure summarizes the results from simulations of closed and open states of MSL1 in a POPC (1-palmitoyl-2-oleoyl-sn-glycero-3-phosphocholine) membrane, using a coarse-grained representation (Table 1). (A) The cryo-electron microscopy (EM) structures (blue cartoons) are overlaid with calculated 3D density distributions mapping the morphology of the alkyl chain double layer in each of the molecular dynamics (MD) trajectories (gold volumes), up to 50 Å from the protein surface. Maps were calculated and are represented as in Figure 4. (B) Time-averages of the instantaneous lipid configurations observed in each of the two MD trajectories, mapped across the membrane plane and shown in cross-section. Averages were calculated and are represented as in Figure 5B. The datasets in panels (A) and (B) were symmetrized in accordance with the sevenfold internal symmetry of the channel.
Figure 10
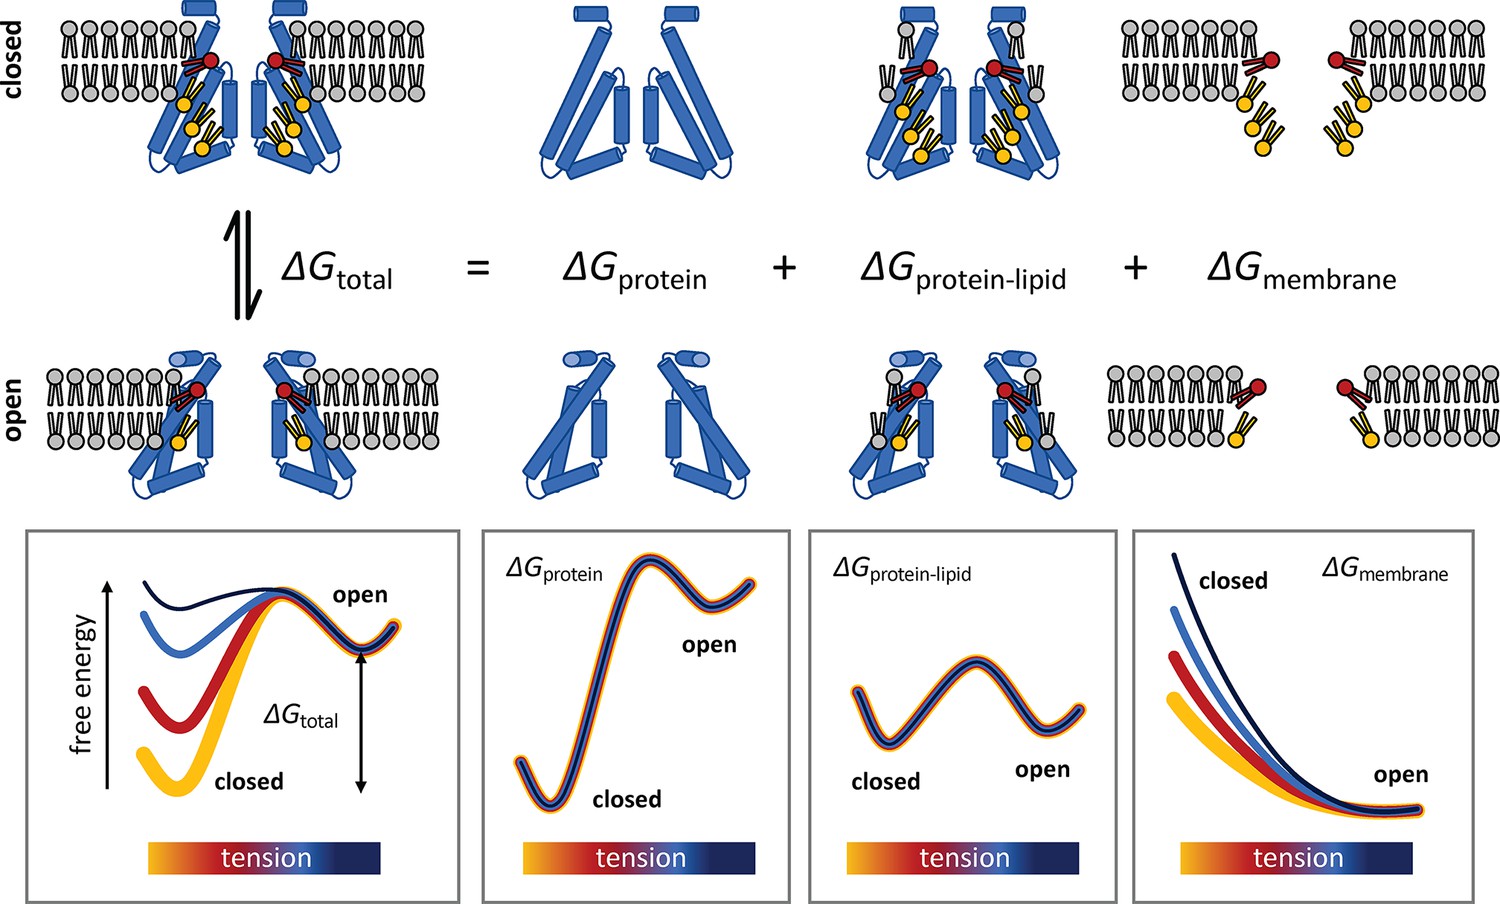
Conceptualization of the membrane deformation model of mechanosensation proposed in this study.
Lateral tension increases the open-state probability of MscS because membrane stretching increases the energetic cost of the deformations in the lipid bilayer that stabilize the closed conformation of the channel, which are largely eliminated when the structure opens. This rationalization of mechanosensitive gating does not presuppose that the closed state of the channel is structurally frustrated, but rather that it is highly stable, consistent with its greater compactness as well as with empirical observations. In addition, the proposed model does not assume that lateral tension must alter the mode of interaction between the protein and the neighboring lipids or that tension causes putative lipid binding sites to be vacated or eliminated. Instead, this ‘membrane deformation model’ recognizes that the inherent conformational preferences of the lipid bilayer contribute to dictating the overall energetics of the gating equilibrium and that the cost of any deformation is invariably dependent on the degree of lateral stretching, regardless of lipid composition.
Tables
Table 1
Molecular simulation systems evaluated in this study of McsS and MSL1 mechanosensation.
| MscS coarse grained* | MscS all atom† | MSL1coarse grained* | |||||||||
|---|---|---|---|---|---|---|---|---|---|---|---|
| Closed WT POPC | Closed WT POPC §d | Closed WT DMPC | Closed WT PC:PG | Open WT POPC | Open A106V POPC | Open D67R1 POPC | Closed WT POPC | Closed WT DMPC | Closed WT POPC | Open WT POPC | |
| Protein | 1 | 1 | 1 | 1 | 1 | 1 | 1 | 1 | 1 | 1 | 1 |
| POPC | 2057 | 755 | 0 | 1651 | 686 | 737 | 740 | 755 | 0 | 2001 | 1916 |
| POPG | 0 | 0 | 0 | 407 | 0 | 0 | 0 | 0 | 0 | 0 | 0 |
| DMPC | 0 | 0 | 768 | 0 | 0 | 0 | 0 | 0 | 768 | 0 | 0 |
| Na+ | 855 | 328 | 340 | 1265 | 328 | 328 | 328 | 314 | 326 | 855 | 855 |
| Cl– | 862 | 335 | 347 | 865 | 335 | 356 | 349 | 335 | 347 | 890 | 883 |
| Water ‡ | 75,938 | 28,123 | 29,000 | 75,501 | 28,200 | 28,372 | 28,299 | 115,170 | 118,774 | 76,076 | 76,549 |
| Total atoms or particles | 106,364 | 41,871 | 41,392 | 106,352 | 41,120 | 41,603 | 41,524 | 476,183 | 476,473 | 106,012 | 105,248 |
| System size (nm) | 26.5×26.5×18.7 | 16.9×16.9×17.9 | 16.3×16.3×19.1 | 26.3×26.3×19.0 | 16.9×16.9×17.9 | 16.9×16.9×17.9 | 16.9×16.9×17.9 | 15.9×15.9×19.9 | 15.4×15.4×21.1 | 26.5×26.5×18.7 | 26.5×26.5×18.7 |
| Time (μs) | 20 | 20 | 20 | 20 | 20 | 20 | 20 | 10 | 8 | 80 | 20 |
-
POPC: 1-palmitoyl-2-oleoyl-sn-glycero-3-phosphocholine; WT: wild type; DMPC:1–2-dimyristoleoyl-sn-glycero-3-phosphocholine; POPG:1–2-palmitoyl-2-oleoylglycero-3-phosphoglycerol.
-
*
MARTINI 2.2 forcefield.
-
†
CHARMM36m forcefield.
-
‡
One CG water particle is equivalent to four AA water molecules.
-
§
Five additional 10 μs simulations were carried out for this system under applied lateral tensions of 0, 0.5. 2.5, 5.0, and 10 mN/m.
Additional files
-
Supplementary file 1
Cryo-electron microscopy (EM) data acquisition and model refinement statistics.
EM maps and atomic models have been deposited in the Electron Microscopy Data Bank (accession number EMD-27337) and the Protein Data Back (entry code 8DDJ).
- https://cdn.elifesciences.org/articles/81445/elife-81445-supp1-v2.docx
-
MDAR checklist
- https://cdn.elifesciences.org/articles/81445/elife-81445-mdarchecklist1-v2.docx
Download links
A two-part list of links to download the article, or parts of the article, in various formats.
Downloads (link to download the article as PDF)
Open citations (links to open the citations from this article in various online reference manager services)
Cite this article (links to download the citations from this article in formats compatible with various reference manager tools)
State-specific morphological deformations of the lipid bilayer explain mechanosensitive gating of MscS ion channels
eLife 12:e81445.
https://doi.org/10.7554/eLife.81445


