A prebiotic diet modulates microglial states and motor deficits in α-synuclein overexpressing mice
- Division of Biology and Biological Engineering, California Institute of Technology, United States
- Aligning Science Across Parkinson’s (ASAP) Collaborative Research Network, United States
- Department of Cellular and Molecular Medicine, University of California, San Diego, United States
- Department of Food Science, Whistler Center for Carbohydrate Research, Purdue University West Lafayette, United States
- Lawrence J Ellison Institute for Transformative Medicine, University of Southern California, United States
- Department of Pediatrics, University of California, San Diego, United States
- Department of Internal Medicine, Division of Gastroenterology, Rush University Medical Center, United States
- Rush Center for Integrated Microbiome and Chronobiology Research, Rush University Medical Center, United States
- Department of Computer Science and Engineering, University of California, San Diego, United States
- Department of Bioengineering, University of California, San Diego, United States
- Center for Microbiome Innovation, University of California San Diego, United States
Figures
Figure 1 with 3 supplements
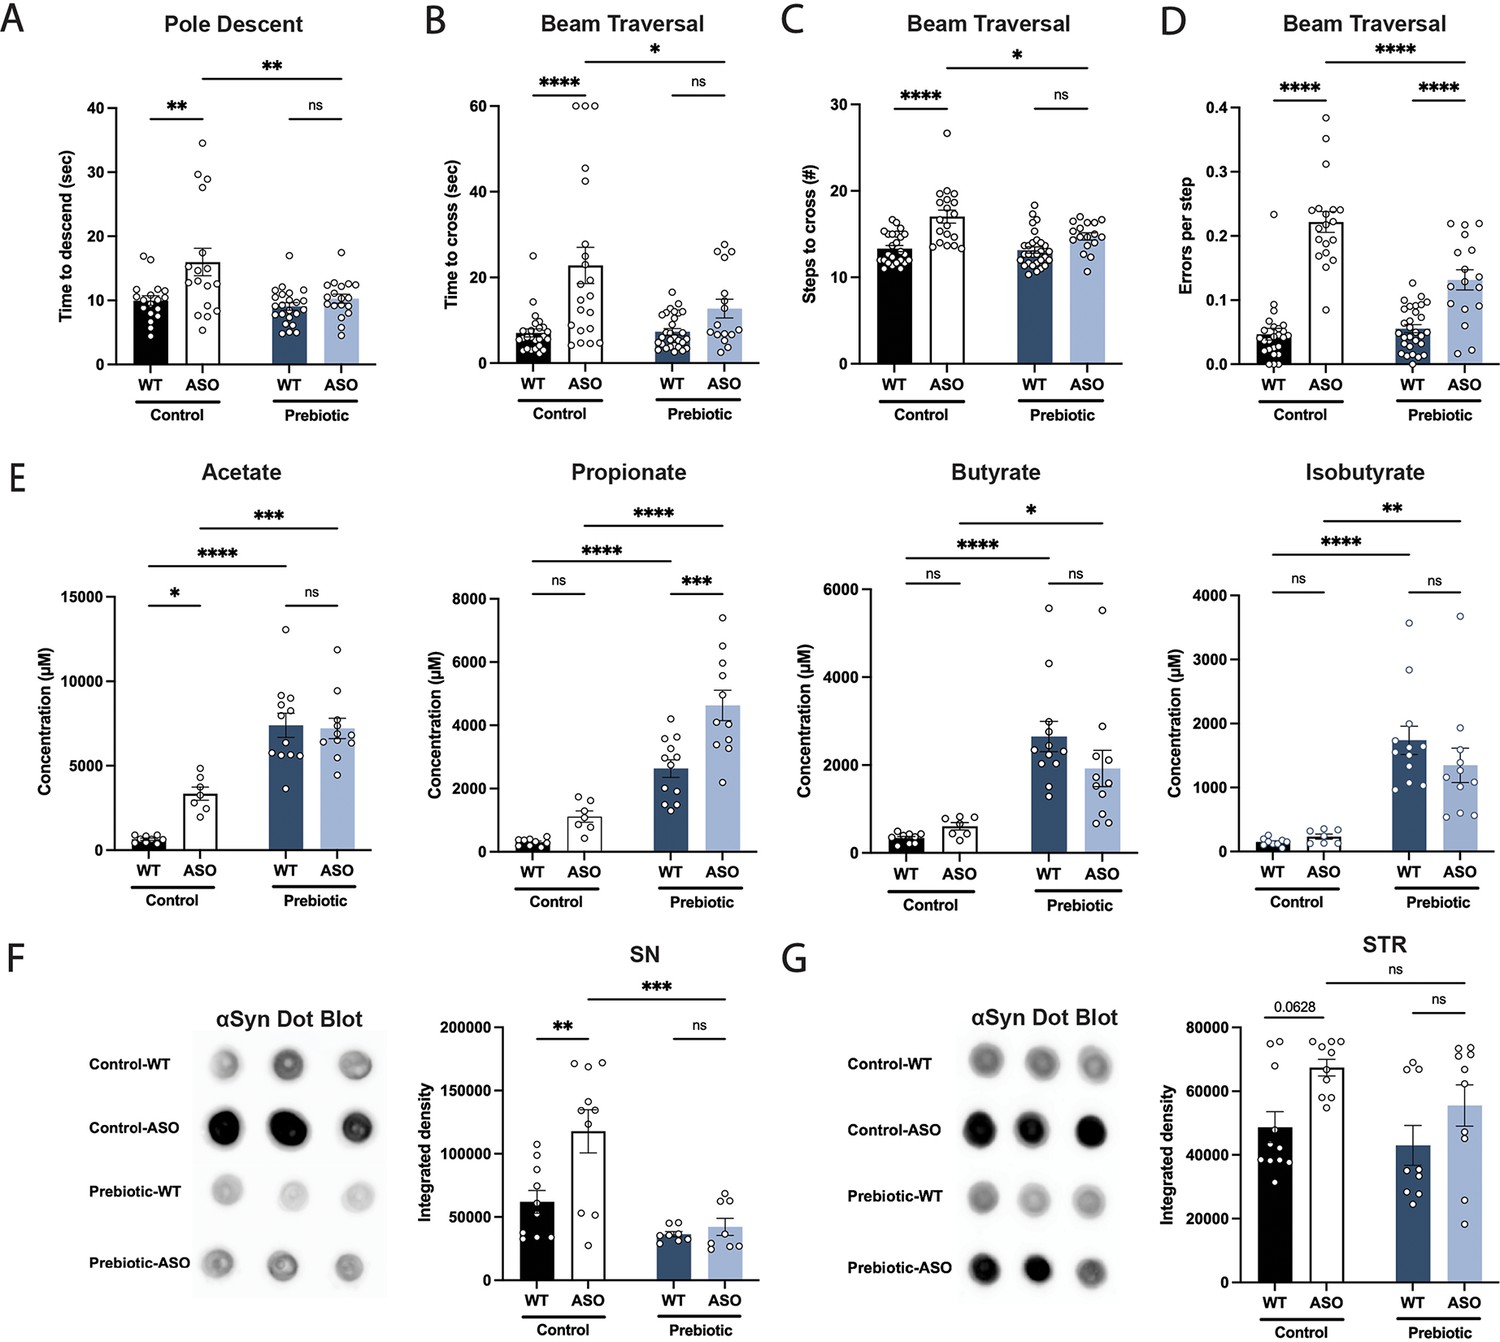
Prebiotic diet #1 attenuates motor symptoms and reduces αSyn aggregation.
(A–D) Motor behavior metrics at 22 weeks of age for prebiotic- and control-fed WT and ASO mice from pole descent (A) and beam traversal (B–D) tests. Motor test data is derived from two independent experiments (n=16–29/group). (E) Concentrations (μM) of acetate, propionate, butyrate, and isobutyrate in fecal samples collected from prebiotic-fed WT and ASO mice (n=7–12/group). (F–G) Aggregated α-synuclein levels in the substantia nigra (SN) (F; n=8–10/group) and striatum (STR) (G; n=9–11/group) measured by dot blot. Each point represents data from one mouse. Data analyzed by two-way ANOVA followed by Tukey’s multiple comparisons test. Bars represent mean ± SEM. *p<0.05, **p<0.01, ***p<0.001, and ****p<0.0001.
-
Figure 1—source data 1
Original image of αSyn dot blot shown in Figure 1F.
- https://cdn.elifesciences.org/articles/81453/elife-81453-fig1-data1-v4.zip
-
Figure 1—source data 2
Original image of αSyn dot blot shown in Figure 1G.
- https://cdn.elifesciences.org/articles/81453/elife-81453-fig1-data2-v4.zip
Figure 1—figure supplement 1
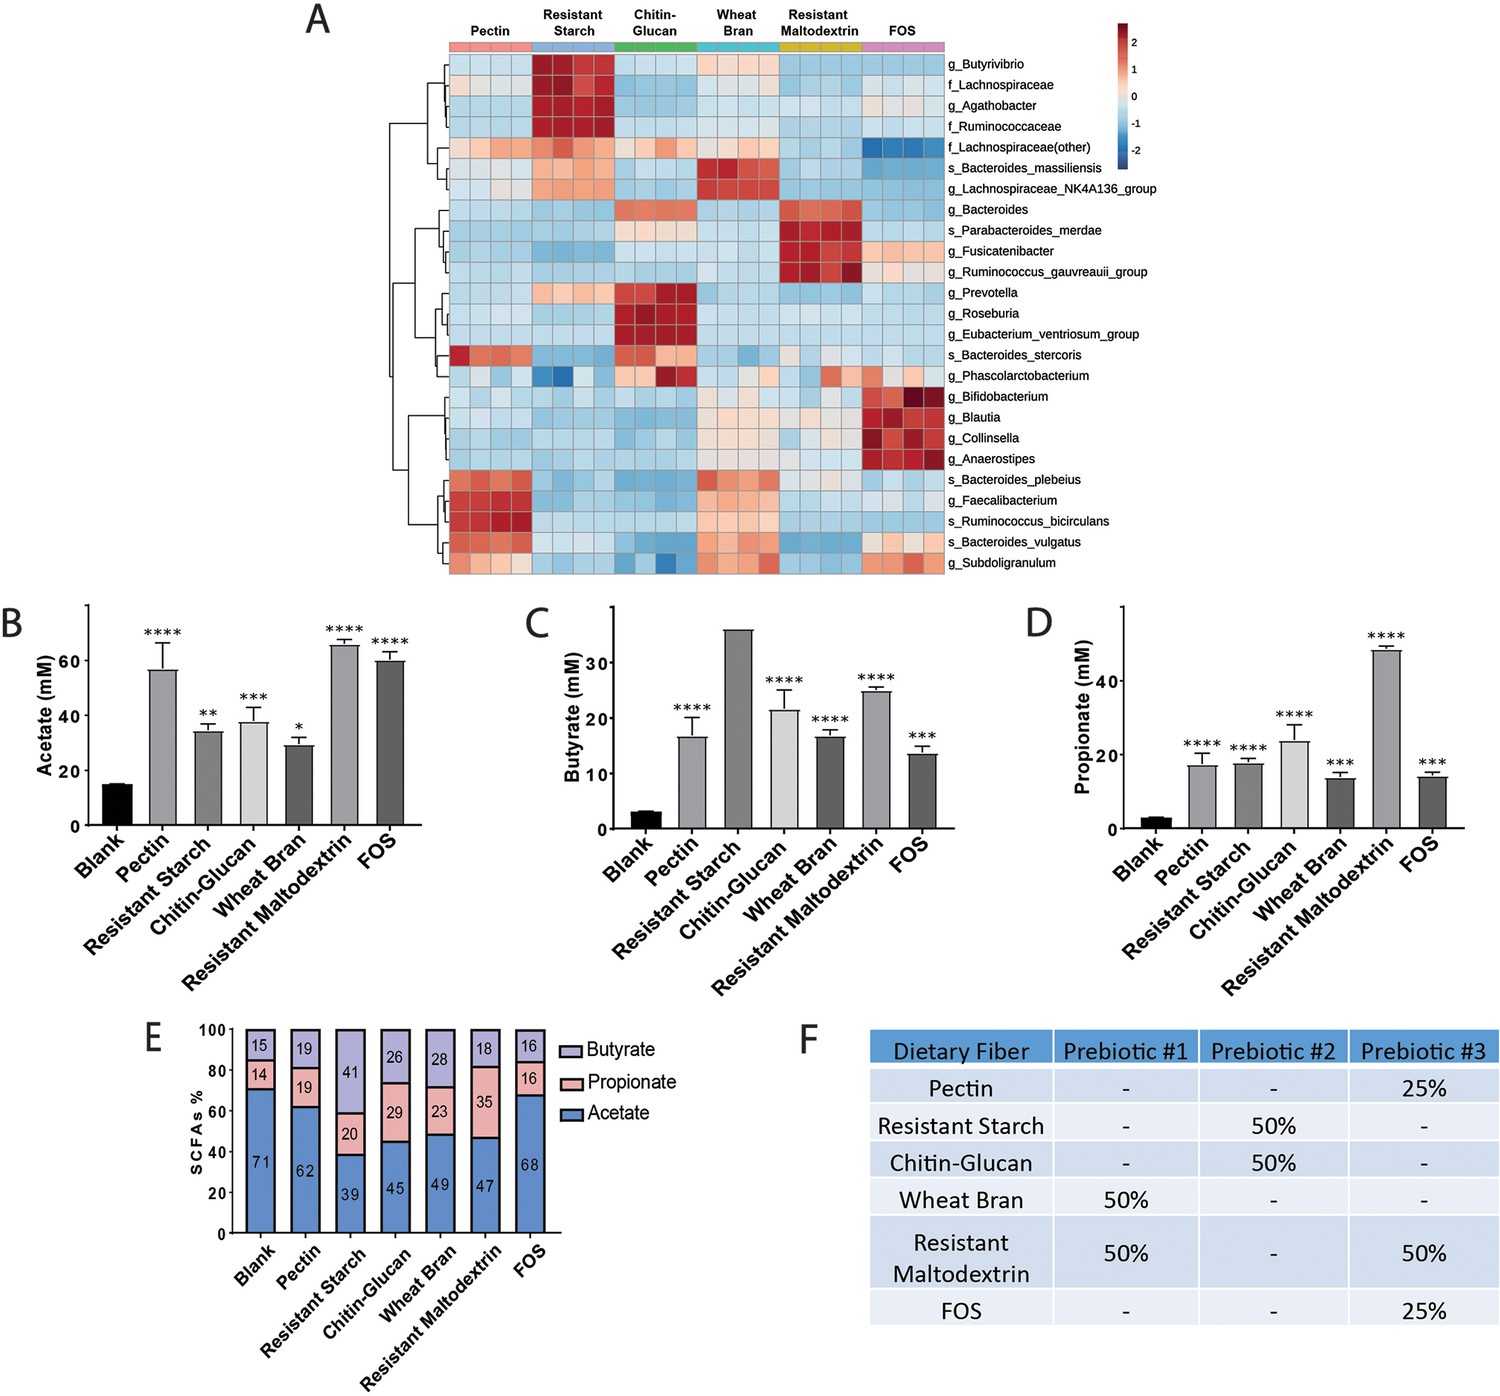
Effect of dietary fibers on gut microbial community and metabolic function in vitro.
(A) Hierarchical clustering of the 25 most abundant genera after 24 hr of in vitro fecal fermentation using a pooled human gut microbiota community, as previously described (Cantu-Jungles et al., 2018). Taxa were associated with fiber type by hierarchical clustering using Euclidean distances and the Ward algorithm. (B–D) SCFA concentration (mM) in fecal slurries of acetate (B), butyrate (C) and propionate (D). Data analyzed by two-way ANOVA followed by Tukey’s multiple comparisons test. Bars represent mean ± SEM. Statistical differences from the blank are indicated by *p<0.05, **p<0.01, ***p<0.001, and ****p<0.0001. (E) Relative proportion of each SCFA produced in the 24 hr in vitro fecal fermentation, showing association with fiber type. (F) Fiber composition of Prebiotic Diets 1–3.
Figure 1—figure supplement 2
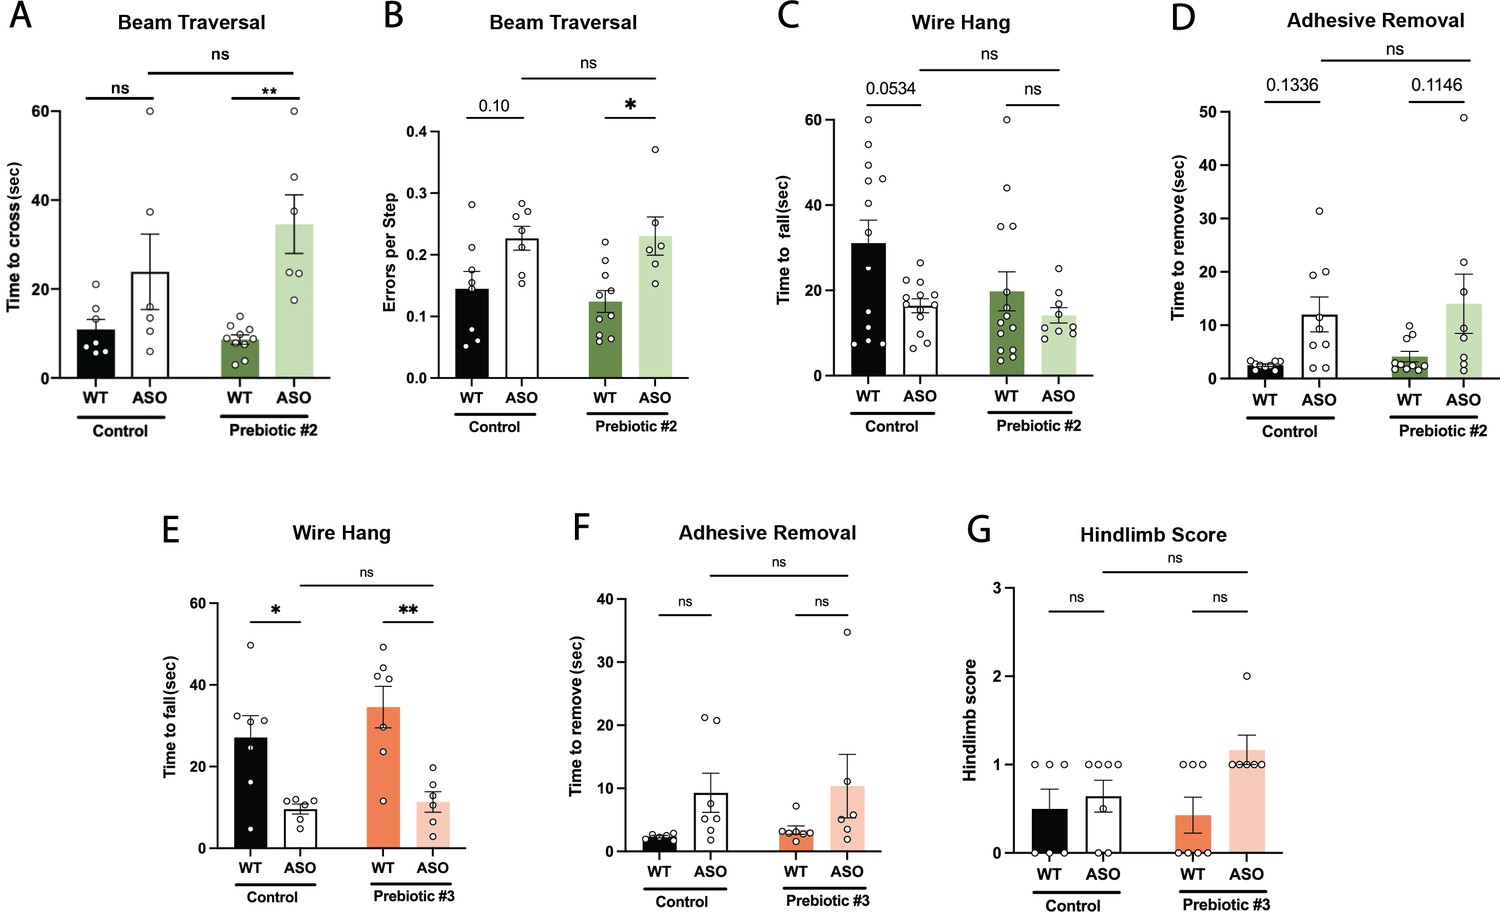
Motor behavior in mice fed Prebiotic #2 and Prebiotic #3 diets.
(A–D) Motor behavior metrics for mice fed Prebiotic #2 diet from beam traversal (A,B), wire hang (C), and adhesive removal (D) tests. (E–G) Motor behavior metrics for mice fed Prebiotic #3 diet from wire hang (E), adhesive removal (F), and hindlimb score (G) tests (n=6–7/group). Data analyzed by two-way ANOVA followed by Tukey’s multiple comparisons test, except for hindlimb score data, which was analyzed by Kruskal-Wallis test. Bars represent mean ± SEM. *p<0.05, **p<0.01, ***p<0.001, and ****p<0.0001.
Figure 1—figure supplement 3
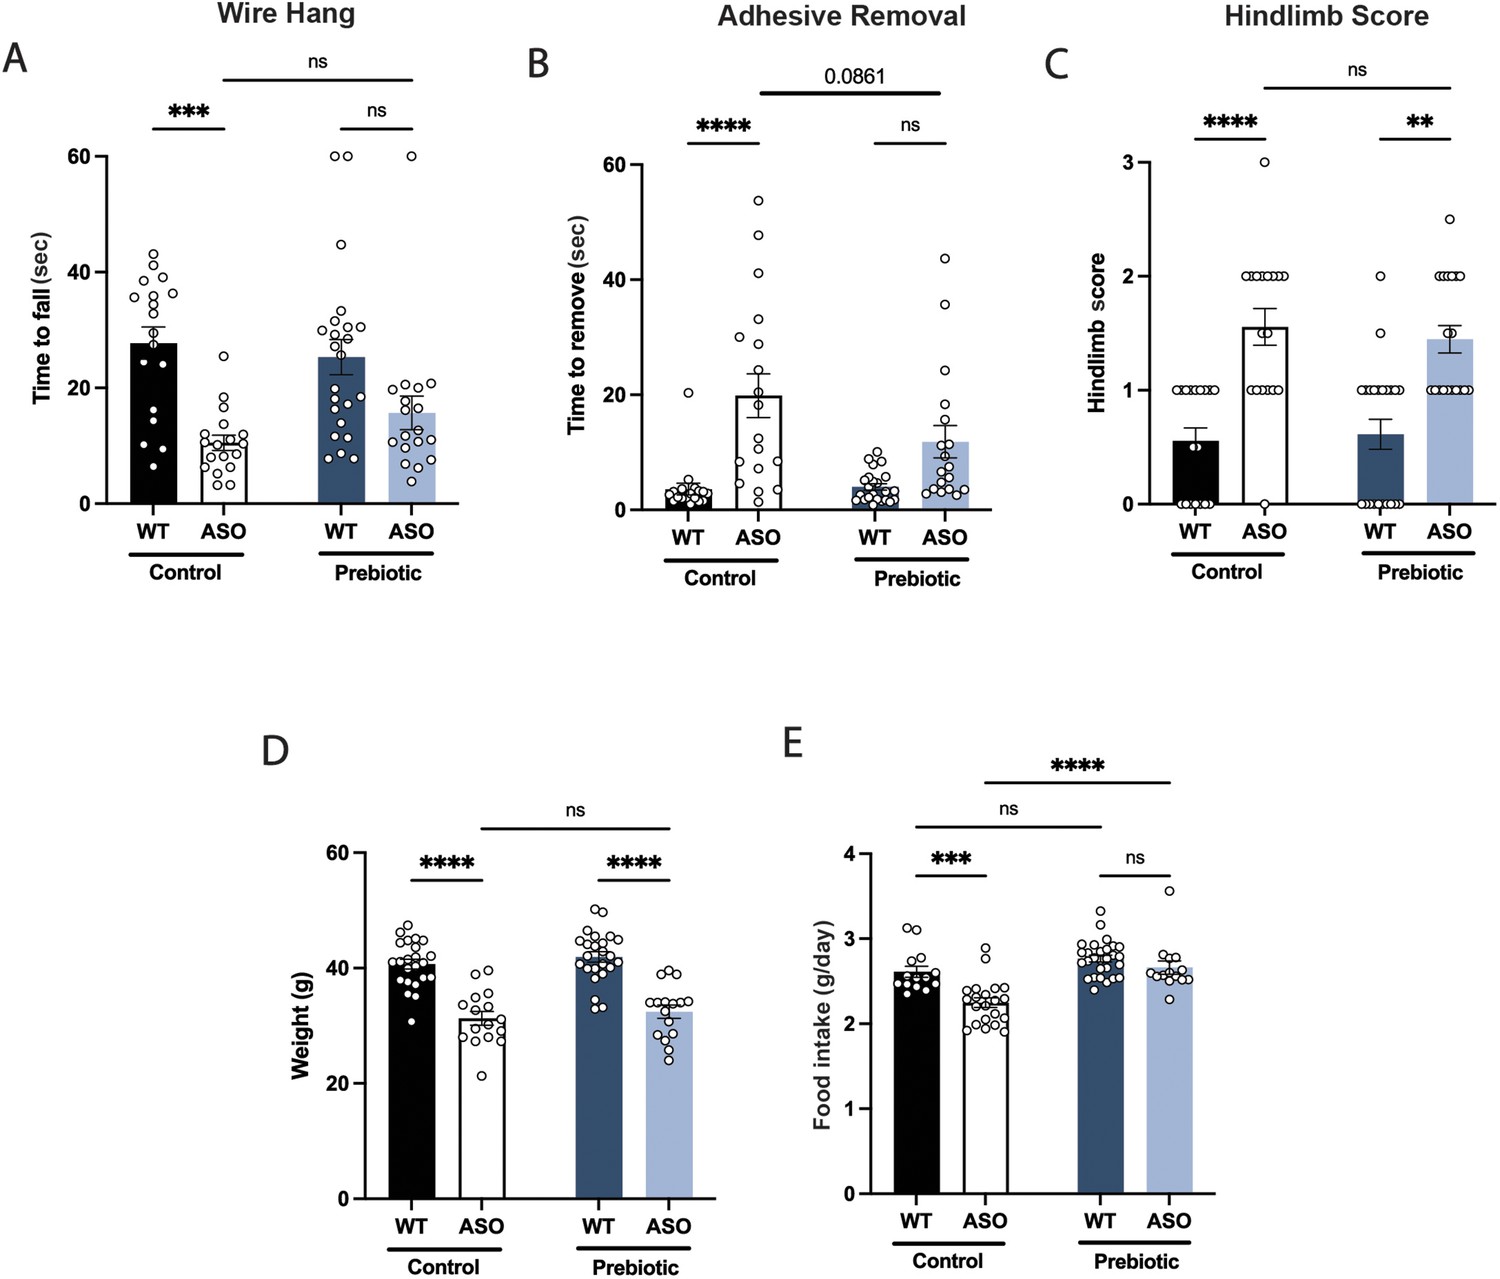
Prebiotic diet does not improve performance in certain motor tests.
(A–C) Motor behavior metrics for mice at 22 weeks from wire hang (A), adhesive removal (B), and hindlimb score (C) tests (n=18–24/group). (D) Mouse weight at 22 weeks (n=16–24/group). (E) Food intake per mouse recorded over the course of experiment. Data analyzed by two-way ANOVA followed by Tukey’s multiple comparisons test, except hindlimb score data, which was analyzed by Kruskal-Wallis test. Bars represent mean ± SEM. *p<0.05, **p<0.01, ***p<0.001, and ****p<0.0001.
Figure 2
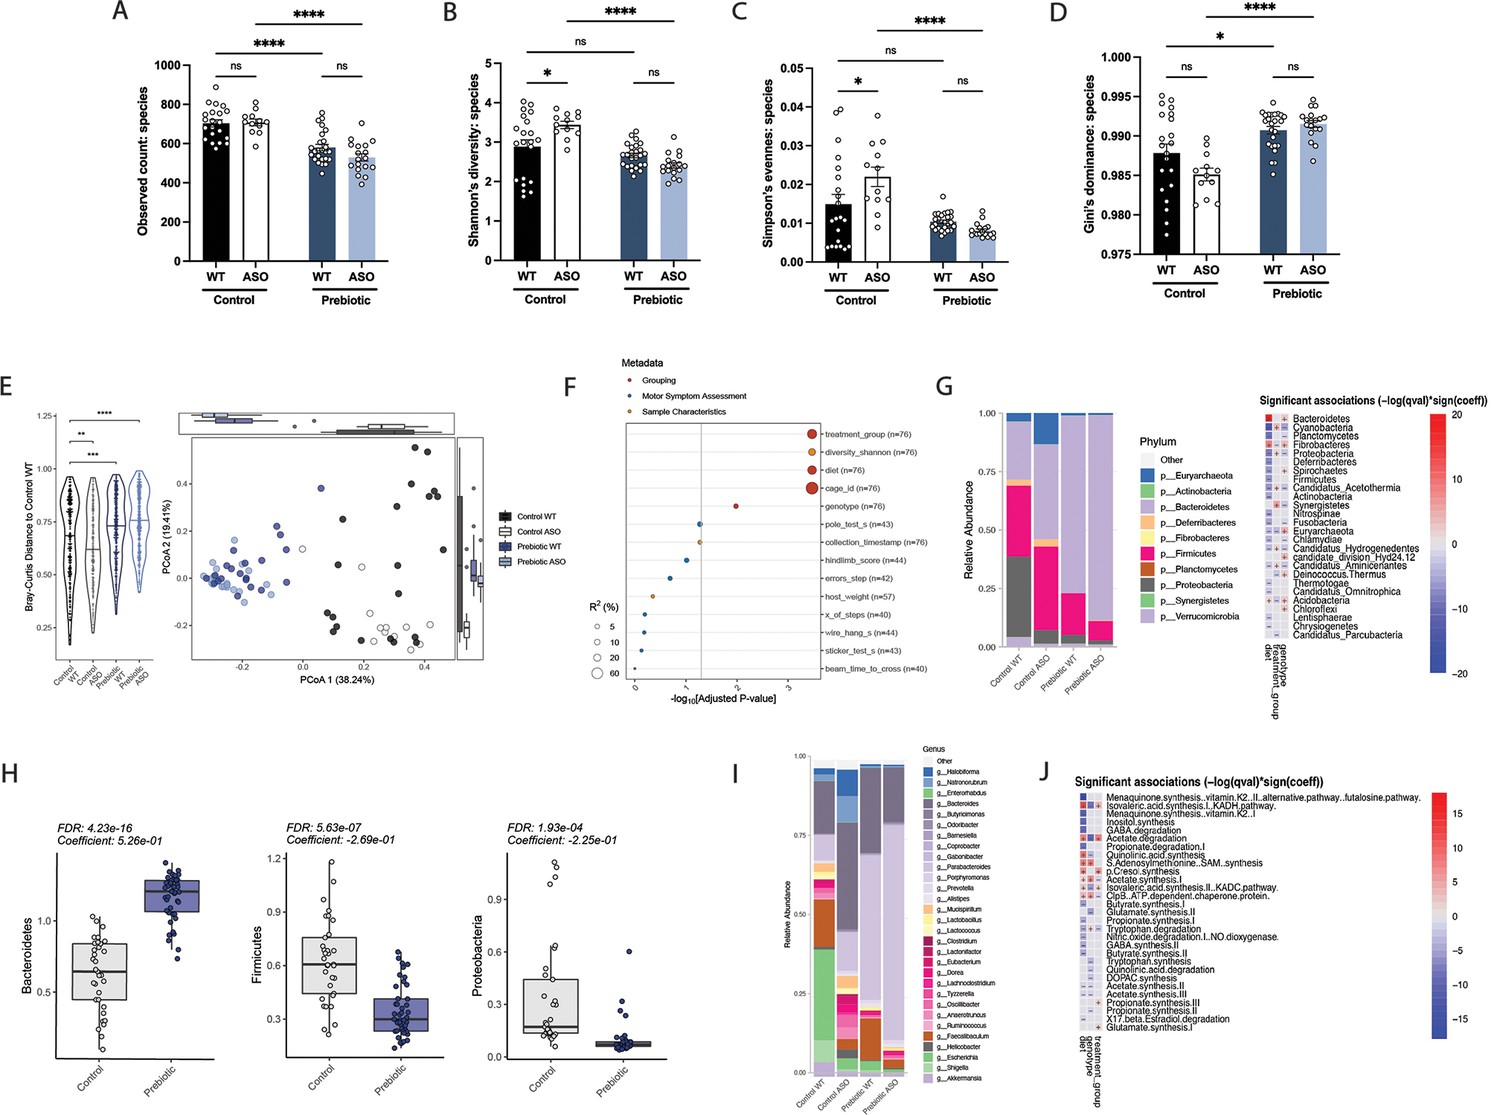
Mice fed a prebiotic diet display a distinctive gut microbiome compared to controls.
(A–D) Diversity metrics from metagenomic analysis of treatment groups at 22 weeks of age, including observed species count (A), Shannon’s diversity (B), Simpson’s evenness (C), and Gini’s dominance (D). (E) Principal Coordinate Analysis (PCoA) plot of Bray-Curtis dissimilarity (n=12–25/group). (F) PERMANOVA analysis summary of Bray-Curtis dissimilarity. (G) Relative abundance of phyla among treatment groups (left) and heat map showing differentially abundant phyla (right). Diet values are displayed relative to control diet and genotype values relative to WT mice. (H) Relative abundance of select phyla in treatment groups. (I) Summary plot of relative abundance of genera. (J) Differentially expressed pathways identified from the ‘Gut Microbiome-Brain module’. Diet values are displayed relative to control diet and genotype values relative to WT mice (n=12–25/group).
Figure 3
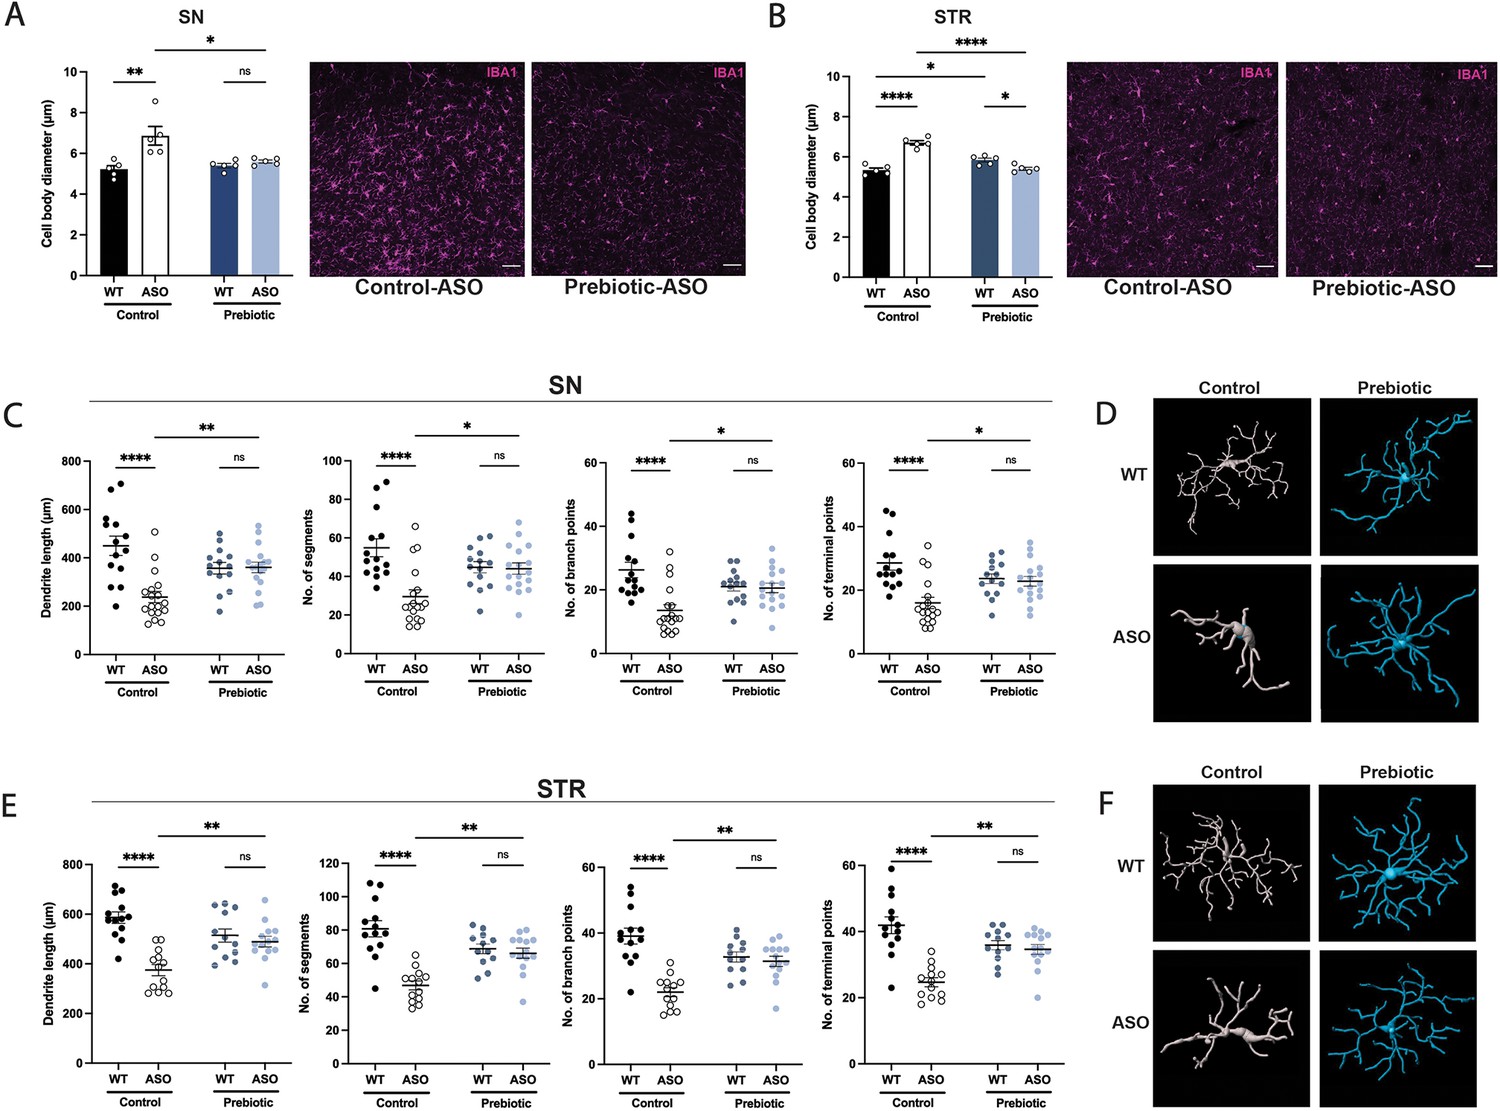
Prebiotic diet alters microglia morphology and reactivity status in ASO mice.
(A,B) Measurement of IBA1+ microglia diameter in substantia nigra (SN) (A; n=5/group) and striatum (STR) (B; n=5/group). Left: quantification of cell diameter. Each point represents one mouse with 26–79 cells measured per mouse. Right: Representative 20 X images of IBA1 staining. Scale bars 50 μm. (C–F) 3D reconstruction of microglia in the substantia nigra (C–D) and striatum (E–F). (C,E) Quantification of dendrite length, number of segments, number of branch points, and number of terminal points (n=14–18/group for SN and n=12–14/group for STR). Each point represents one cell, with 3–5 cells analyzed/mouse. (D,F) Representative 3D reconstructions of microglia imaged at 40 X magnification. Data analyzed by two-way ANOVA followed by Tukey’s multiple comparisons test. Bars represent mean ± SEM. *p<0.05, **p<0.01, ***p<0.001, and ****p<0.0001.
Figure 4 with 2 supplements
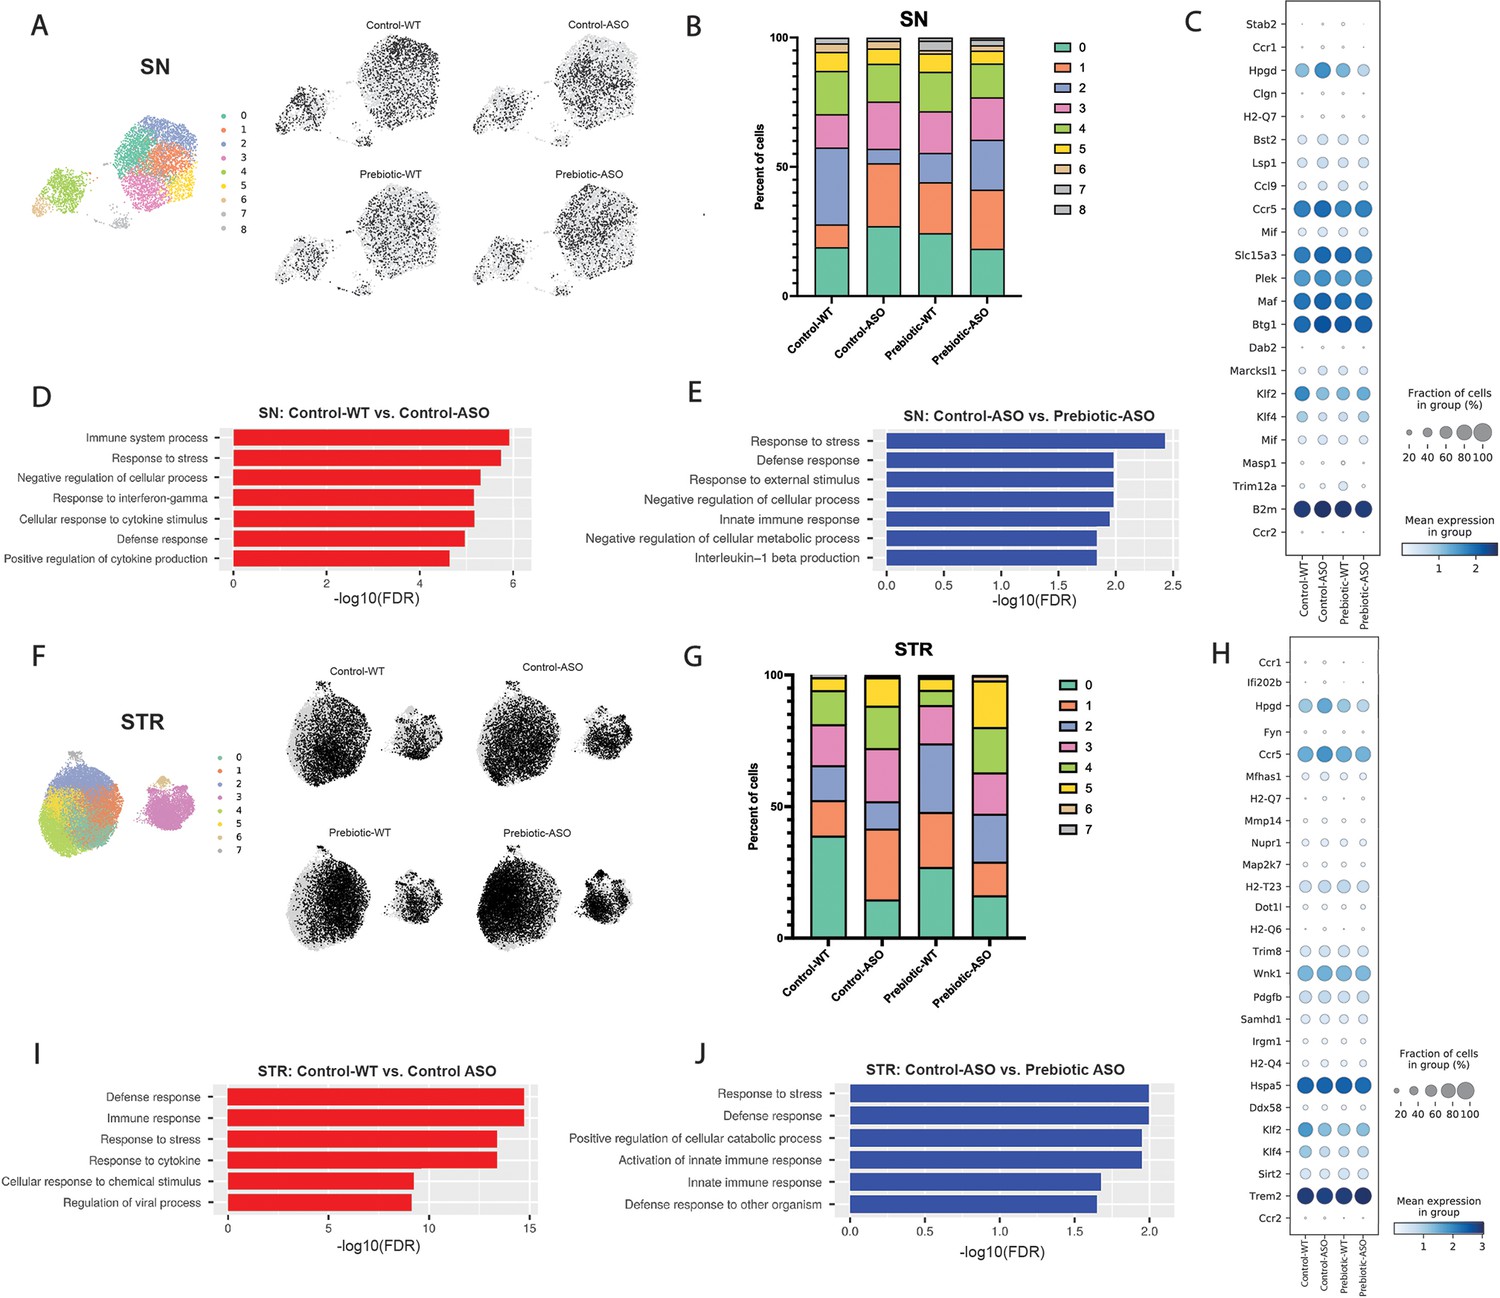
Prebiotic diet alters microglial gene expression.
(A) UMAP plot of all 5278 substantia nigra (SN) cells sequenced by scRNA-seq from all four treatment groups (left) and distribution of cells from individual samples (right). (B) Relative distribution of cells within each cluster in the SN. (C) Dot plot showing genes significantly upregulated in control-ASO microglia (relative to control-WT) and significantly downregulated in prebiotic-ASO microglia (relative to control-ASO) in the SN. (D) Significantly enriched pathways among 163 genes upregulated in control-ASO microglia relative to control-WT microglia in the SN. (E) Significantly enriched pathways among 156 genes downregulated in prebiotic-ASO microglia relative to control-ASO microglia in the SN. (F) UMAP plot of all 27,152 striatal (STR) cells sequenced by scRNA-seq from all four treatment groups (left) and distribution of cells from individual samples (right). (G) Relative distribution of cells within each cluster in the STR. (H) Dot plot and showing genes significantly upregulated in control-ASO microglia (relative to control-WT) and significantly downregulated in prebiotic-ASO microglia (relative to control-ASO) in the STR. (I) Significantly enriched pathways among the 50 most upregulated genes in control-ASO microglia relative to control-WT microglia in the STR. (J) Significantly enriched pathways among the 50 most downregulated genes in prebiotic-ASO microglia relative to control-ASO microglia in the STR.
Figure 4—figure supplement 1
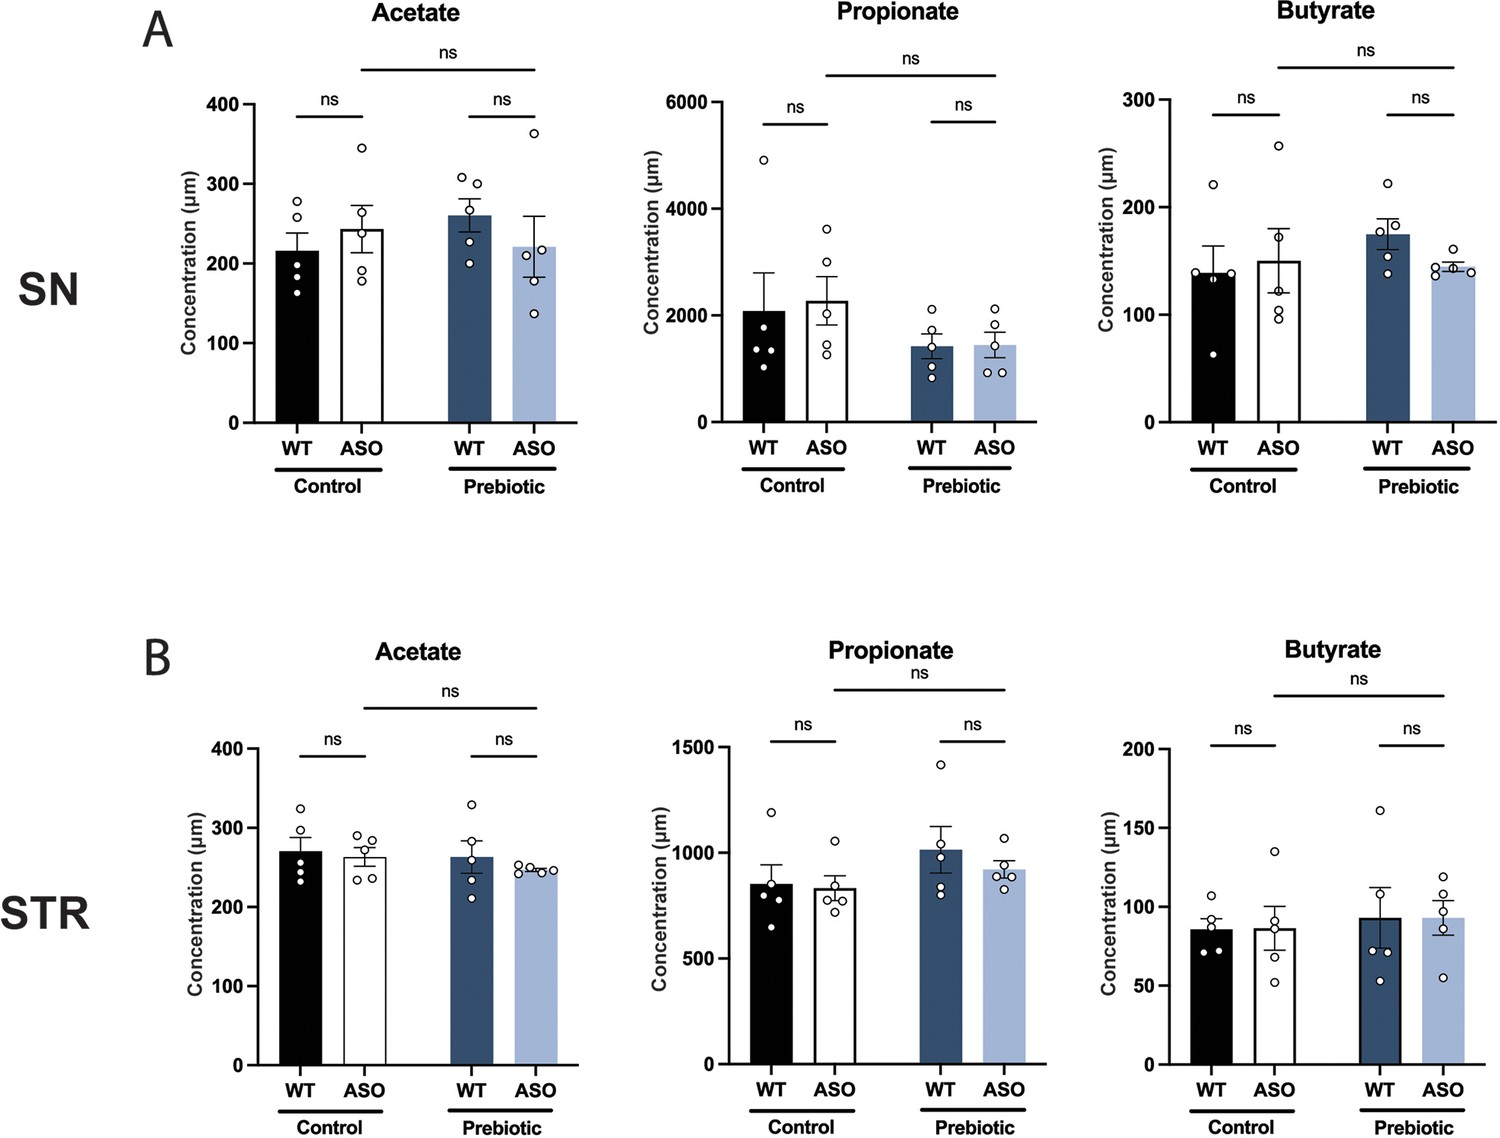
Prebiotics do not change SCFA levels in the brain.
(A,B) Concentration (μM) of acetate, propionate, and butyrate measured by UHP-LC in the substantia nigra (A) and striatum (B). Each point represents data from one mouse (n=5/group). Data analyzed by two-way ANOVA followed by Tukey’s multiple comparisons test. Bars represent mean ± SEM.
Figure 4—figure supplement 2
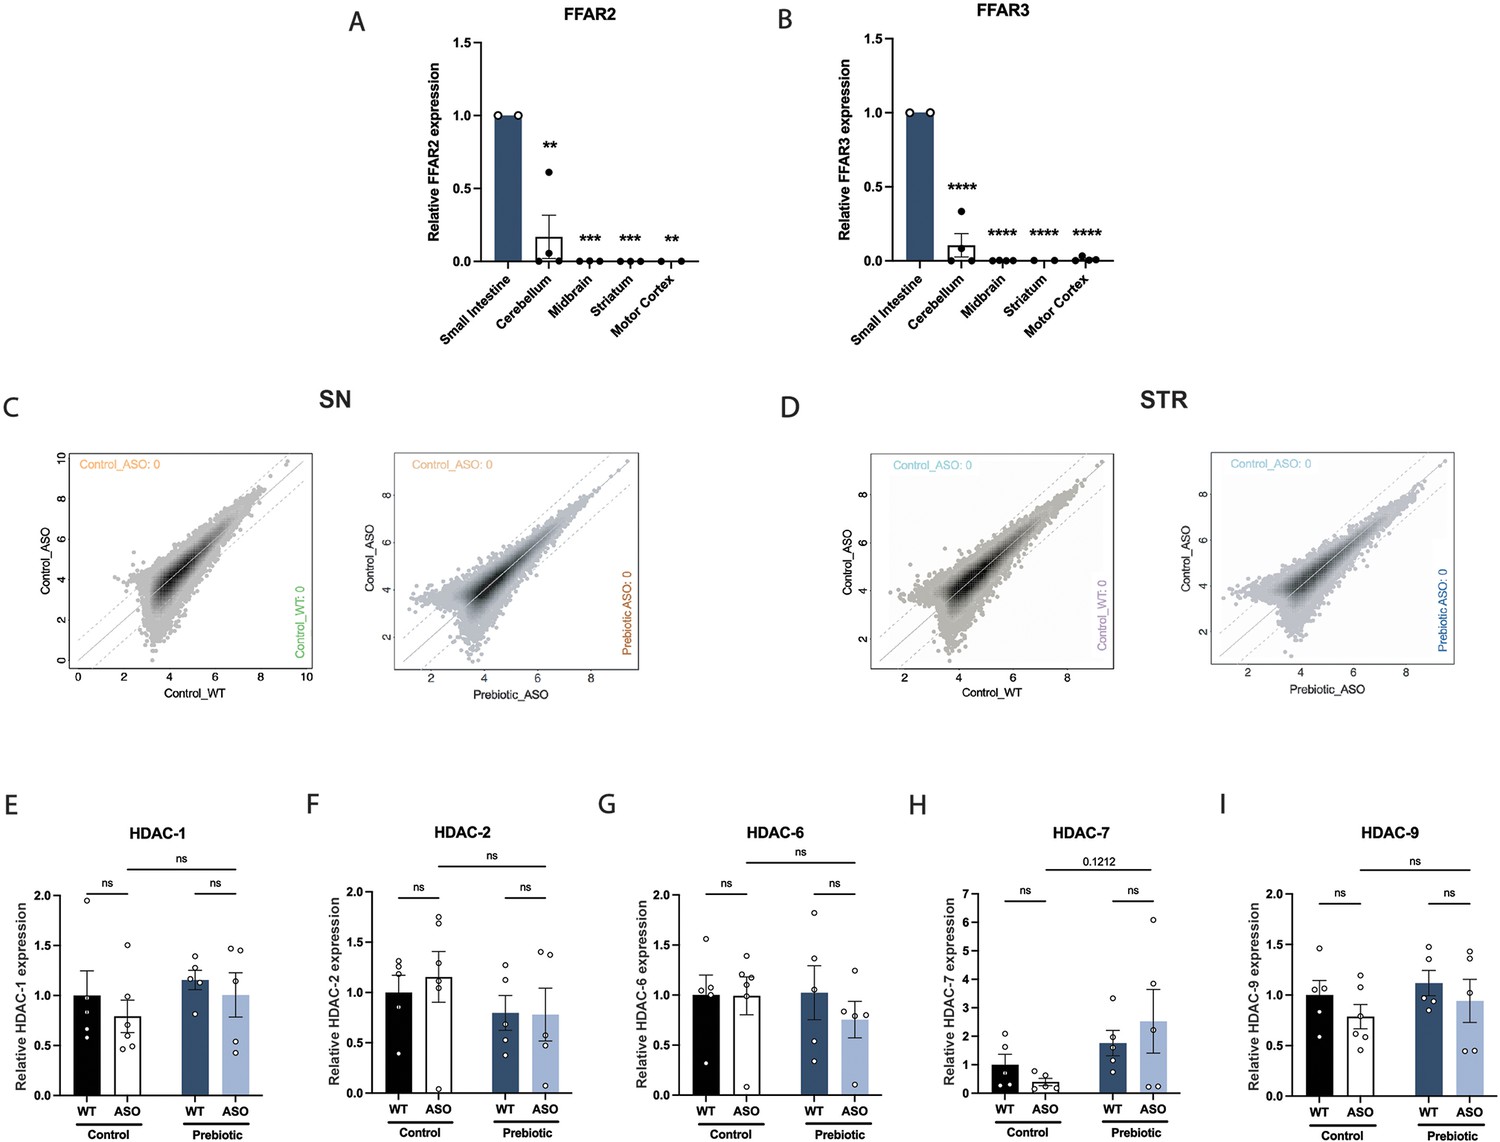
FFAR2/3 levels in brain and GI tissue and epigenetic analysis.
(A,B) qPCR measurement of FFAR2 (A) and FFAR3 (B) in small intestine, cerebellum, midbrain, striatum and motor cortex (n=2–4/group). (C,D) ATAC-seq measurement of open chromatin regions in purified microglia in the substantia nigra (C) and striatum (D). (E–I) qPCR measurement of HDAC-1 (E), HDAC-2 (F), HDAC-6 (G), HDAC-7 (H), and HDAC-9 (I) in the striatum (n=5–6/group). qPCR data analyzed by two-way ANOVA followed by Tukey’s multiple comparisons test. Bars represent mean ± SEM. *p<0.05, **p<0.01, ***p<0.001, and ****p<0.0001.
Figure 5 with 2 supplements
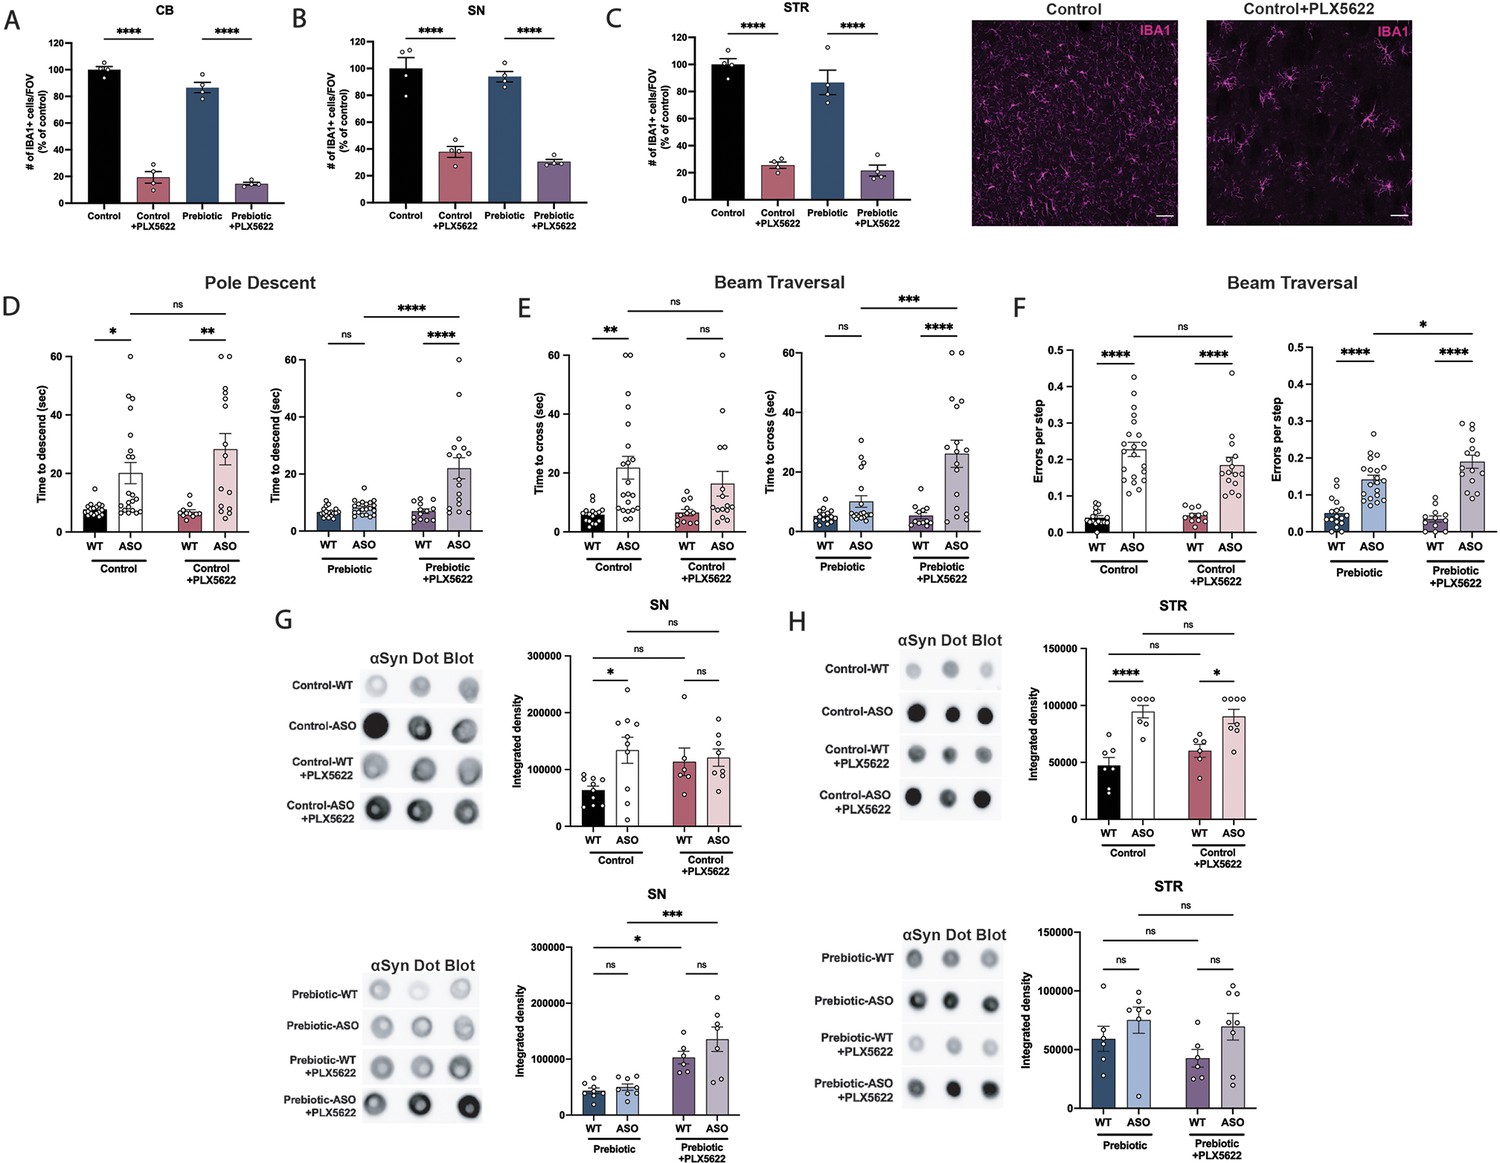
Depletion of microglia inhibits beneficial effects of prebiotics.
(A–C) Number of IBA1+ cells per field of view in 20 X images of the cerebellum (A), substantia nigra (B), and striatum (C). n=4/group. Representative images from the striatum are shown at right (scale bars: 50 μm). (D–F) Motor performance metrics for pole descent (D) and beam traversal (E–F) tests. Motor data derived from five independent cohorts (n=12–21/group). (G,H) Aggregated α-synuclein measured by dot blot in the substantia nigra (G; n=6–10/group) and striatum (H; n=6–8/group). Microglia count data analyzed by one-way ANOVA followed by Tukey’s multiple comparisons test. Motor and αSyn data analyzed by two-way ANOVA followed by Tukey’s multiple comparisons test. Data represent mean ± SEM. *p<0.05, **p<0.01, ***p<0.001, and ****p<0.0001.
-
Figure 5—source data 1
Original image of αSyn dot blot shown in Figure 5G.
- https://cdn.elifesciences.org/articles/81453/elife-81453-fig5-data1-v4.zip
-
Figure 5—source data 2
Original image of αSyn dot blot shown in Figure 5H.
- https://cdn.elifesciences.org/articles/81453/elife-81453-fig5-data2-v4.zip
Figure 5—figure supplement 1
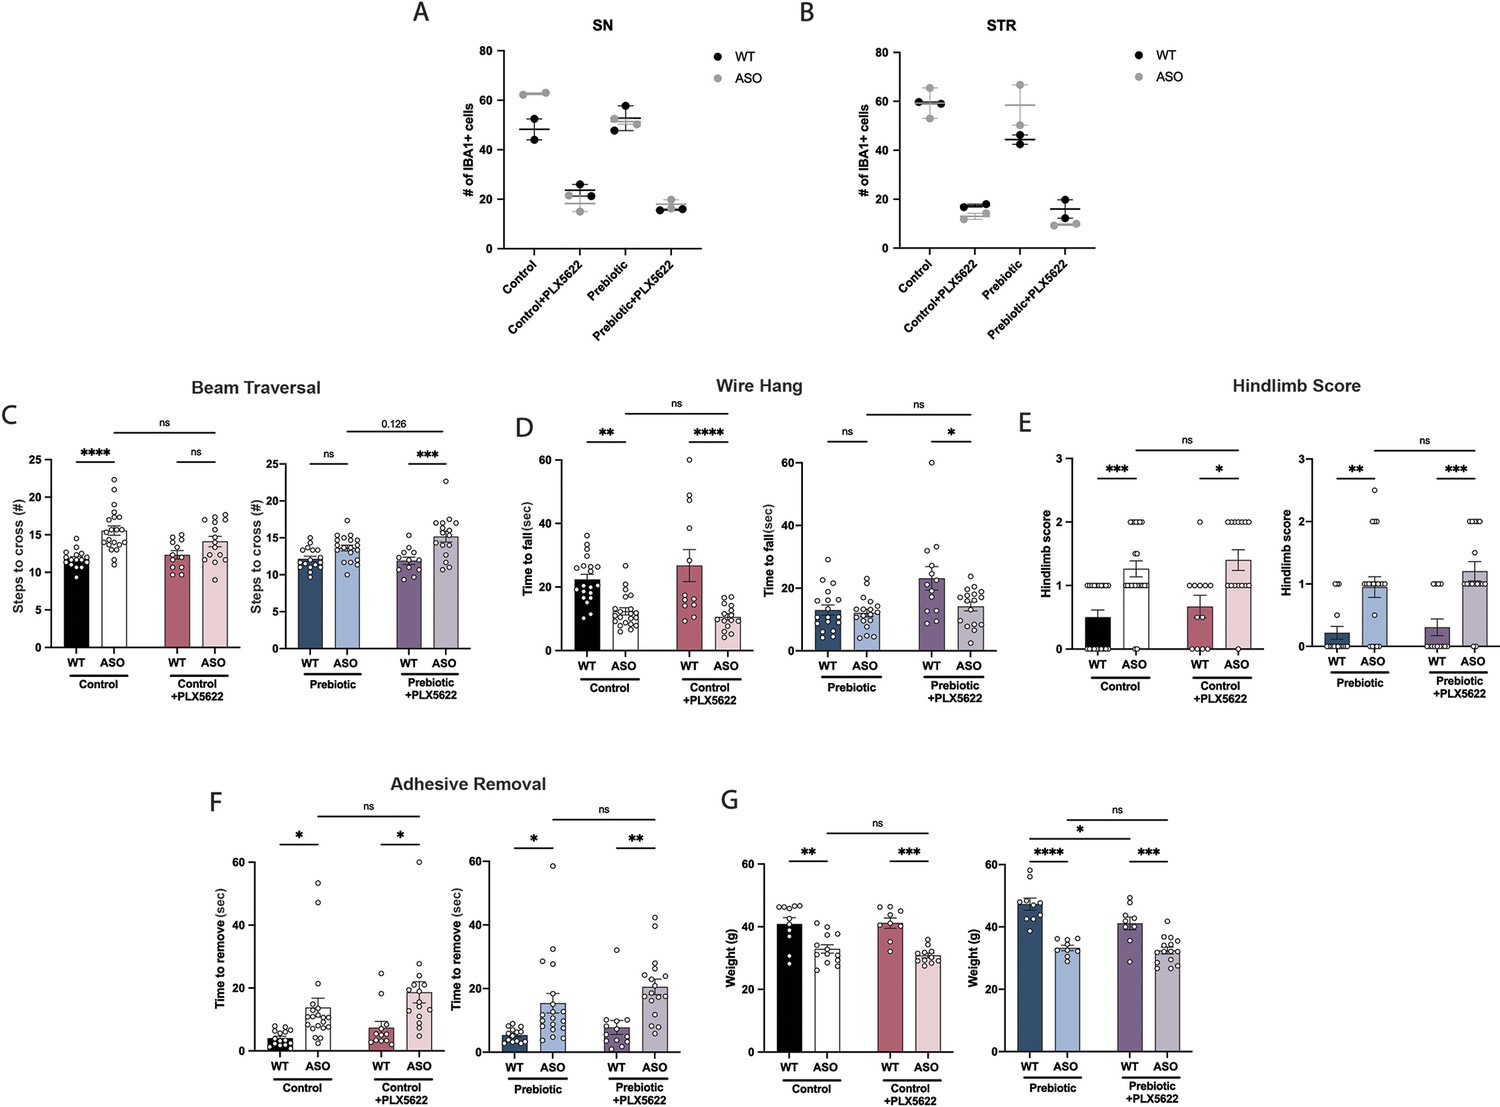
Characterization of PLX5622 treatment.
(A,B) Iba1+ cell count in the substantia nigra (A) and striatum (B). n=2/group. (C–F) Motor behavior metrics from beam traversal (C), wire hang (D), hindlimb score (E), and adhesive removal (F) tests (n=12–23/group). (G) Mouse weight at 22 weeks (n=9–15/group). Data analyzed by two-way ANOVA followed by Tukey’s multiple comparisons test. Bars represent mean ± SEM. *p<0.05, **p<0.01, ***p<0.001, and ****p<0.0001.
Figure 5—figure supplement 2
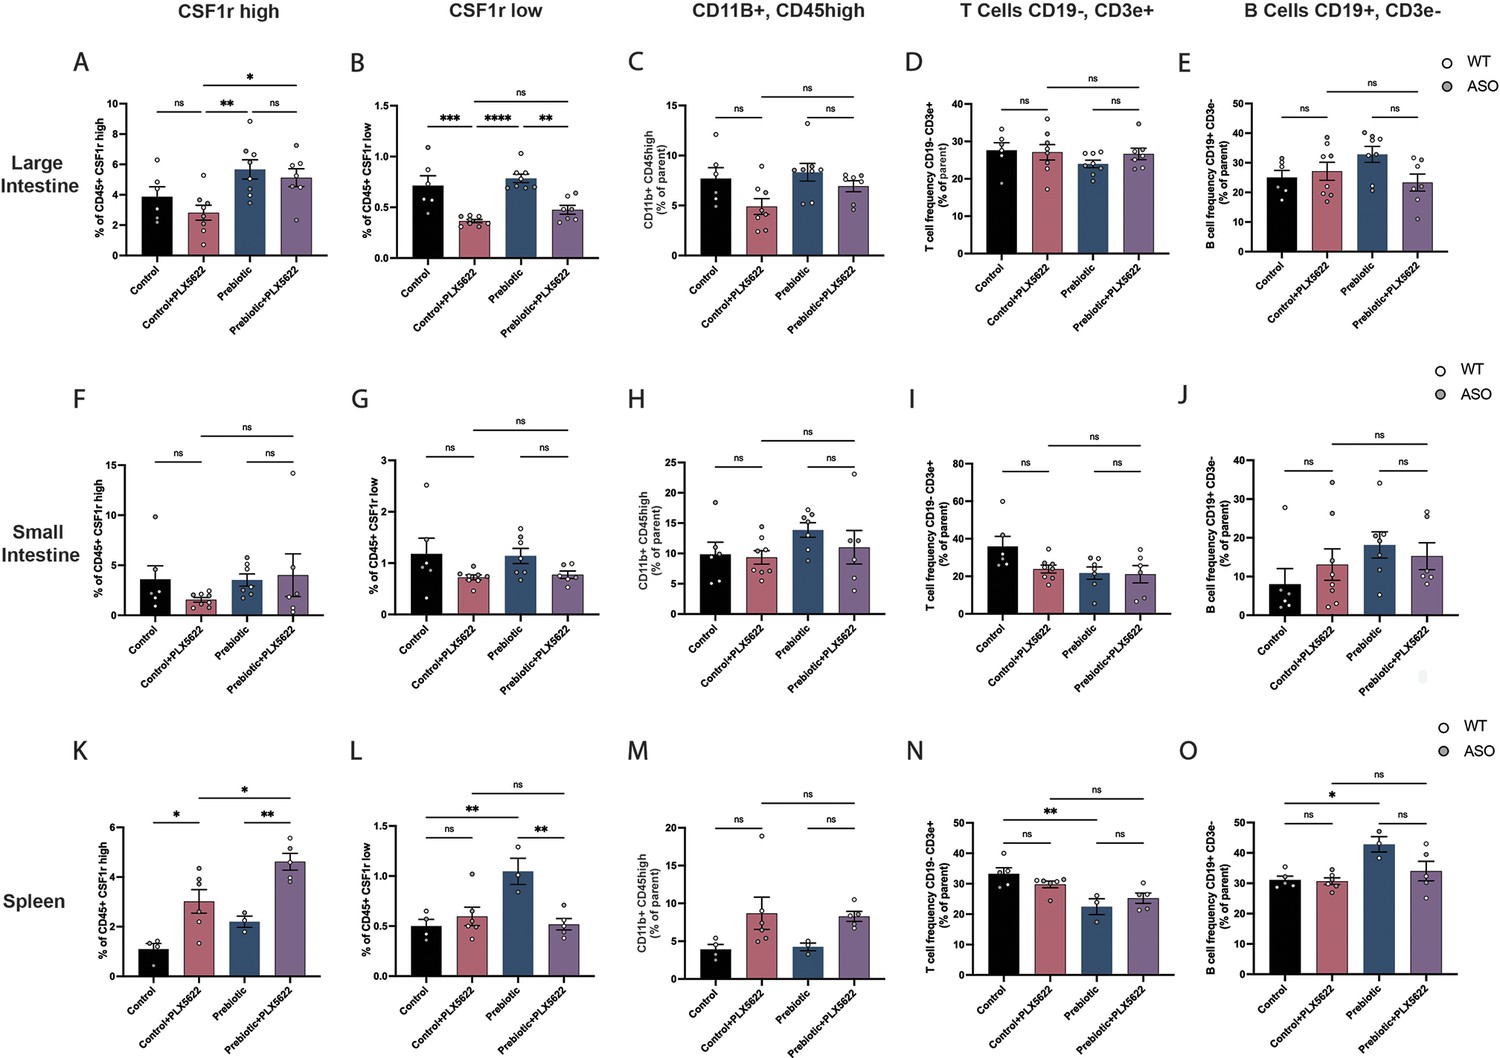
Immune cell characterization in the gut and spleen of PLX5622-treated mice.
(A–E) Large intestine quantification of CD45, CSF1r+high cells (A); CD45+, CSF1r low cells (B); CD11b+, CD45 high cells (C); T cells (CD19-, CD3e+) (D); and B cells (CD19+, CD3e-) (E). n=6–8/group. (F–J) Small intestine quantification of the same populations (n=6–8/group). (K–O) Spleen quantification of the same populations (n=3–6/group). Each point represents data from an individual mouse. White data points represent WT mice and grey data points represent ASO mice. Data is combined from three independent experiments. Data analyzed by one-way ANOVA followed by Tukey’s multiple comparisons test. Bars represent mean ± SEM. *p<0.05, **p<0.01, ***p<0.001, and ****p<0.0001.
Tables
Key resources table
| Reagent type (species) or resource | Designation | Source or reference | Identifiers | Additional information |
|---|---|---|---|---|
| Cell line (M. musculus) | Thy1-α-synuclein (line 61) | Chesselet et al., 2012; Rockenstein et al., 2002 | ASO | |
| Antibody | Anti-beta actin, rabbit polyclonal | Abcam | Cat# ab8227; RRID:AB_2305186 | 1:1,000 |
| Antibody | Anti-aggregated α-synuclein, rabbit polyclonal | Abcam | Cat# ab209538; RRID:AB_2714215 | 1:1000 |
| Antibody | Anti-Iba1, rabbit polyclonal | Wako | Cat# 019–19741; RRID:AB_839504 | 1:1000 |
| Antibody | Anti-tyrosine hydroxylase, chicken polyclonal | Abcam | Cat# ab76442; RRID:AB_1524535 | 1:1000 |
| Antibody | Anti-rabbit IgG-647, donkey polyclonal | Life Technologies | Cat# 1874788; RRID:AB_2536183 | 1:1000 |
| Antibody | Anti-chicken IgG-594, donkey polyclonal | Jackson Immunoresearch | Cat# 703-585-155; RRID:AB_2340377 | 1:600 |
| Antibody | Anti-rabbit IgG, HRP-linked, goat polyclonal | Cell Signaling | Cat# 7074; RRID:AB_2099233 | 1:1000 |
| Antibody | Anti-mouse/human CD11b-APC, rat monoclonal | BioLegend | Cat# 101211; RRID:AB_312794 | 1:1000 |
| Antibody | Anti-mouse CX3CR1-PE/Cyanine7, mouse monoclonal | BioLegend | Cat# 149016; RRID:AB_2565700 | 1:10,000 |
| Antibody | Anti-mouse CD45-Alexa Flour 488, rat monoclonal | BioLegend | Cat# 103121; RRID:AB_493532 | 1:1000 |
| Antibody | Anti-mouse CD16/CD32 Antibody (93), eBioscience (1 mg); rat monoclonal | ThermoFisher | Cat# 14-0161-86; RRID:AB_467135 | 1:100 |
| Antibody | Anti-mouse CD3e Antibody (145–2 C11), PE, eBioscience, hamster monoclonal | ThermoFisher | Cat# 12-0031-82; RRID:AB_465496 | 1:200 |
| Antibody | Anti-mouse CD4 Antibody (GK1.5), APC, eBioscience, rat monoclonal | ThermoFisher | Cat# 17-0041-83; RRID:AB_469321 | 1:200 |
| Antibody | Anti-mouse TCR beta Antibody (H57-597), PerCP-Cyanine5.5, eBioscience, hamster monoclonal | ThermoFisher | Cat# 45-5961-82; RRID:AB_925763 | 1:200 |
| Antibody | Anti-mouse CD8a Antibody (53–6.7), APC-eFluor 780, eBioscience, rat monoclonal | ThermoFisher | Cat# 47-0081-82; RRID:AB_1272185 | 1:200 |
| Antibody | Anti-mouse CD11c Antibody (N418), FITC, eBioscience, hamster monoclonal | ThermoFisher | Cat# 11-0114-82; RRID:AB_464940 | 1:200 |
| Antibody | Anti-mouse CD170 (Siglec F) Monoclonal Antibody (1RNM44N), PE-Cyanine7, eBioscience, rat monoclonal | ThermoFisher | Cat# 25-1702-82; RRID:AB_2802251 | 1:200 |
| Antibody | Anti-mouse Ly-6C Antibody (HK1.4), APC, eBioscience, rat monoclonal | ThermoFisher | Cat# 17-5932-82; RRID:AB_1724153 | 1:200 |
| Antibody | Anti-mouse CD103 (Integrin alpha E) Monoclonal Antibody (2E7), PerCP-eFluor 710, eBioscience, hamster monoclonal | ThermoFisher | Cat# 46-1031-82; RRID:AB_2573704 | 1:200 |
| Antibody | Anti-mouse CD64 Antibody (X54-5/7.1), APC-eFluor 780, eBioscience, mouse monoclonal | ThermoFisher | Cat# 47-0641-82; RRID:AB_2735012 | 1:200 |
| Antibody | Anti-mouse CD11b Antibody (M1/70), Super Bright 645, eBioscience, rat monoclonal | ThermoFisher | Cat# 64-0112-82; RRID:AB_2662387 | 1:200 |
| Antibody | APC anti-mouse CD45.2, mouse monoclonal | Tonbo | Cat# 20–0454; RRID:AB_2621576 | 1:200 |
| Antibody | PE-Cy7 anti-mouse Ly6G, rat monoclonal | Tonbo | Cat# 60–1276; RRID:AB_2621860 | 1:200 |
| Antibody | PE-Cy7 anti-mouse TCRb, hamster monoclonal | Tonbo | Cat# 60–5961; RRID:AB_2877098 | 1:200 |
| Antibody | PE-Cy7 anti-mouse/human B220, rat monoclonal | Tonbo | Cat# 60–0452; RRID:AB_2621849 | 1:200 |
| Antibody | FITC anti-mouse CD19, rat monoclonal | Tonbo | Cat# 35–0193; RRID:AB_2621682 | 1:200 |
| Antibody | PE Anti-Mouse MHC Class II (I-A/I-E) (M5/114.15.2), rat monoclonal | Tonbo | Cat# 50–5321; RRID:AB_2621796 | 1:200 |
| Antibody | PE anti-mouse CD115 (CSF-1R) Antibody, rat monoclonal | BioLegend | Cat# 135506; RRID:AB_1937253 | 1:200 |
| Antibody | MHC Class II (I-A/I-E) anti-mouse Antibody (M5/114.15.2), PerCP-eFluor 710, eBioscience, rat monoclonal | ThermoFisher | Cat# 46-5321-82; RRID:AB_1834439 | 1:200 |
| Commercial assay, kit | eBioscience Foxp3 /Transcription Factor Staining Buffer Set | ThermoFisher | Cat# 00-5523-00 | |
| Chemical compound, drug | PLX5622 | DC Chemicals | Cat# DC21518 | |
| Commercial assay, kit | IL-6 Mouse ELISA kit | ThermoFisher | Cat# 88-7064-88 | |
| Commercial assay, kit | TNF-α Mouse ELISA Kit | ThermoFisher | Cat# 88-7324-77 | |
| Commercial assay, kit | Tagment DNA enzyme and buffer kit | Illumina | Cat# 20034197 | |
| Other | Prolong Diamond antifade mountant with DAPI | Invitrogen | Cat# P36971 | |
| Commercial assay, kit | Tissue Extraction Reagent I | ThermoFisher | Cat# FNN0071 | |
| Commercial assay, kit | Chromium Next GEM Single Cell 3' GEM, Library & Gel Bead Kit v3.1 | 10 x Genomics | Cat# 1000128 | |
| Commercial assay, kit | Chromium Next GEM Chip G Single Cell Kit | 10 x Genomics | Cat# 1000127 | |
| Commercial assay, kit | Single Index Kit T Set A | 10 x Genomics | Cat# 2000240 | |
| Commercial assay, kit | ChiP DNA clean and concentrator | Zymo | Cat# D5205 | |
| Commercial assay, kit | Direct-zol RNA Microprep | Zymo | Cat# R2062 | |
| Commercial assay, kit | Direct-zol RNA Miniprep | Zymo | Cat# R2050 | |
| Commercial assay, kit | iScript cDNA synthesis kit | Bio-Rad | Cat# 1708890 | |
| Commercial assay, kit | Clarity Western ECL Substrate | Bio-Rad | Cat# 1705060 | |
| Sequence-based reagent | HDAC1_F | This paper | PCR primers | GAACTGCTAAAGTACCACC |
| Sequence-based reagent | HDAC1_R | This paper | PCR primers | CATGACCCGGTCTGTAGTAT-3’ |
| Sequence-based reagent | HDAC2_F | This paper | PCR primers | CGGTGTTTGATGGACTCTTTG |
| Sequence-based reagent | HDAC2_R | This paper | PCR primers | CCTGATGCTTCTGACTTCTTG |
| Sequence-based reagent | HDAC6_F | This paper | PCR primers | CTGCATGGCATCGCTGGTA |
| Sequence-based reagent | HDAC6_R | This paper | PCR primers | GCATCAAAGCCAGTGAGATC |
| Sequence-based reagent | HDAC7_F | This paper | PCR primers | CTCGGCTGAGGACCTAGAGA |
| Sequence-based reagent | HDAC7_R | This paper | PCR primers | CAGAGAAATGGAGCCTCTGC |
| Sequence-based reagent | HDAC9_F | This paper | PCR primers | GCGGTCCAGGTTAAAACAGA |
| Sequence-based reagent | HDAC9_R | This paper | PCR primers | GCCACCTCAAACACTCGCTT |
| Sequence-based reagent | GAPDH_F | This paper | PCR primers | ATGGCCTTCCGTGTTCCTA |
| Sequence-based reagent | GAPDH_R | This paper | PCR primers | CCTGCTTCACCACCTTCTTGAT |
| Sequence-based reagent | FFAR2_F | This paper | PCR primers | TTCCCATGGCAGTCACCATC |
| Sequence-based reagent | FFAR2_R | This paper | PCR primers | TGTAGGGTCCAAAGCACACC |
| Sequence-based reagent | FFAR3_F | This paper | PCR primers | ACCGCCGTCAGGAAGAGGGAG |
| Sequence-based reagent | FFAR3_R | This paper | PCR primers | TCCTGCCGTTTCGCSTGGTGG |
| Other | DAPI | Sigma-Aldrich | Cat# 10236276001 | 1:10,000 |
| Other | Aqua Viability Dye | ThermoFisher/Invitrogen | Cat# L34957 | 1:1000 |
Additional files
-
Supplementary file 1
Composition of custom-made prebiotic diets.
- https://cdn.elifesciences.org/articles/81453/elife-81453-supp1-v4.xlsx
-
Supplementary file 2
Differentially expressed genes (DEGs) in microglia of the Substantia Nigra and Striatum.
(a) DEGs in Control-WT vs Control-ASO microglia in the Substantia Nigra. Log fold change relative to Control-WT. (b) DEGs in Control-ASO vs Prebiotic-ASO microglia in the Substantia Nigra. Log fold change relative to Control-ASO. (c) DEGs in Control-WT vs Control-ASO microglia in the Striatum. Log fold change relative to Control-WT. (d) DEGs in Control-ASO vs Prebiotic-ASO microglia in the Striatum. Log fold change relative to Control-ASO.
- https://cdn.elifesciences.org/articles/81453/elife-81453-supp2-v4.xlsx
-
Supplementary file 3
Genes detected in microglia in scRNA-seq in the Substantia Nigra and Striatum.
- https://cdn.elifesciences.org/articles/81453/elife-81453-supp3-v4.xlsx
-
MDAR checklist
- https://cdn.elifesciences.org/articles/81453/elife-81453-mdarchecklist1-v4.docx
Download links
A two-part list of links to download the article, or parts of the article, in various formats.
Downloads (link to download the article as PDF)
Open citations (links to open the citations from this article in various online reference manager services)
Cite this article (links to download the citations from this article in formats compatible with various reference manager tools)
A prebiotic diet modulates microglial states and motor deficits in α-synuclein overexpressing mice
eLife 11:e81453.
https://doi.org/10.7554/eLife.81453


