Precise and stable edge orientation signaling by human first-order tactile neurons
- Neuroscience Graduate Program, Western University, Canada
- Department of Integrative Medical Biology, Umeå University, Sweden
- Department of Physiology and Pharmacology, Western University, Canada
Figures
Figure 1
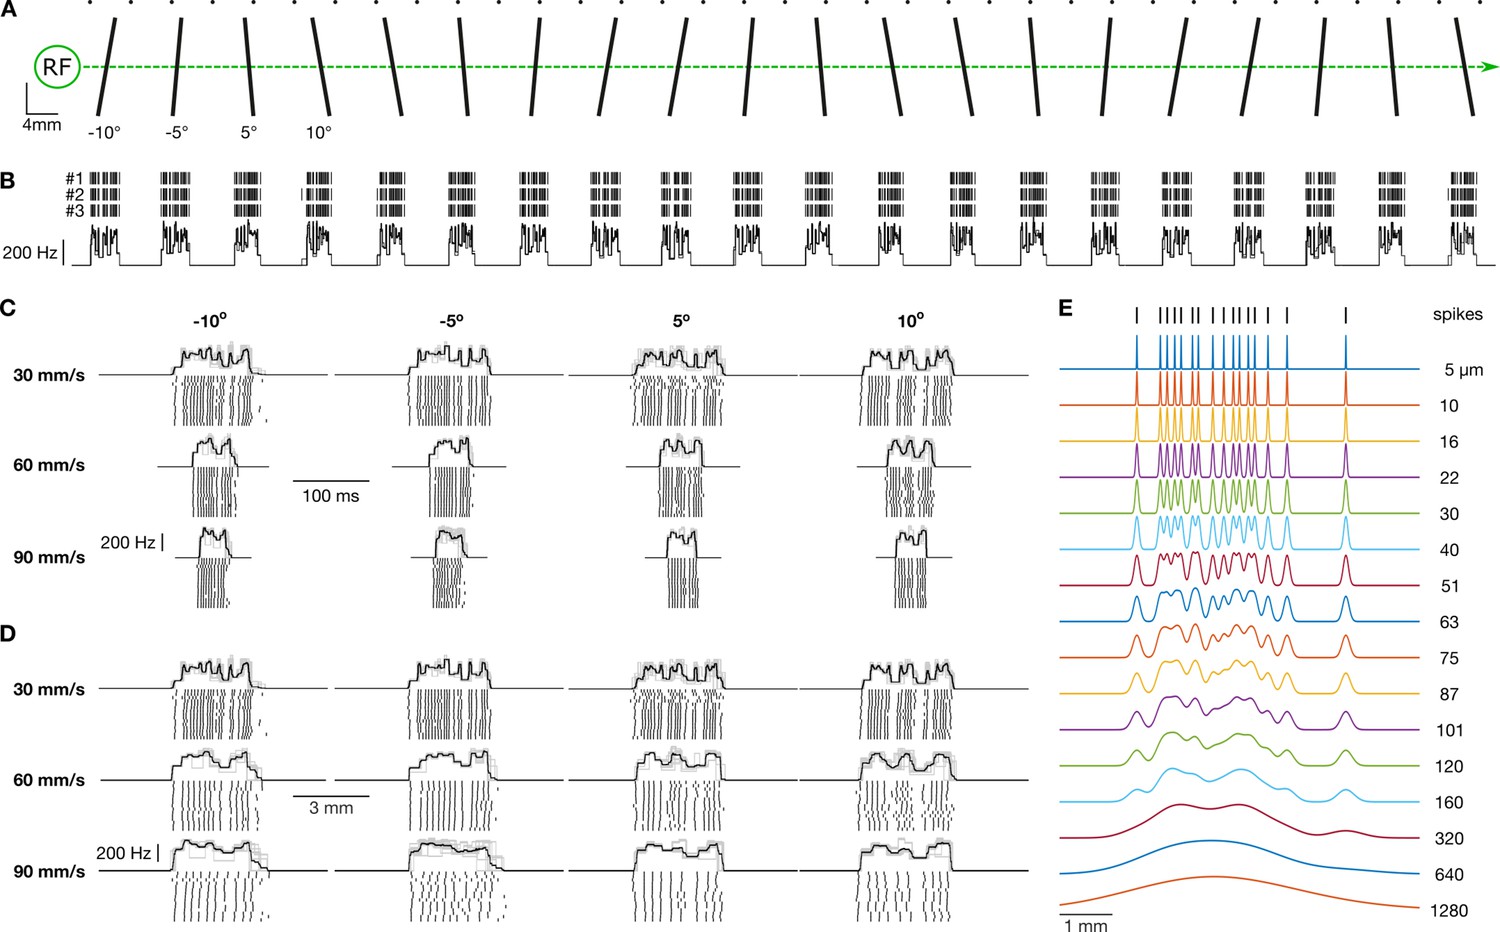
Experimental setup and raw data.
(A) Schematic of the stimulating surface, which includes five repetitions of four oriented line stimuli. The small dots above the line stimuli are used during the experiment to align the stimulating surface with an isolated neuron’s receptive field (RF). The layout of the line stimuli is such that an isolated RF is only stimulated by a single line stimulus at any given moment in time. (B) Tick marks represent action potentials from an exemplar neuron plotted relative to the position of the stimulating surface. All three rotations (#1, #2, and #3) are shown. The superimposed traces below represent the firing rate profile, defined as the reciprocal of the interval between subsequent action potentials, for each of the three rotations. This constitutes the raw data for this study. (C) Response from an exemplar neuron for the four line orientations and three stimulating speeds. The black trace represents the mean response, and the light gray traces show responses for the 15 individual trials. Tick marks below represent action potentials for each individual trial. Scale bars show time (100 ms). (D) Same data as in C but represented in spatial coordinates. Scale bars show distance traversed by the drum (2 mm). (E) Each trace shows an exemplar spike train smoothed by Gaussian kernels of various widths (noted is the SD of the kernel).
Figure 2
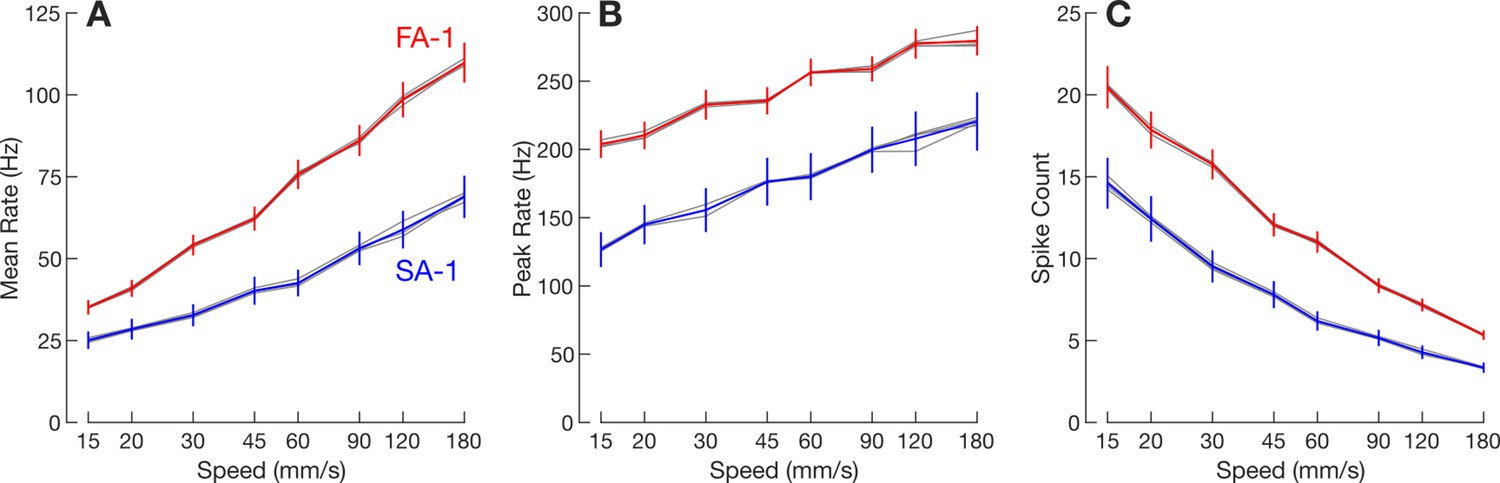
Response intensity as a function of stimulation speed.
(A) Mean firing rate averaged across fast-adapting type 1 (FA-1) neurons (red line) and slow-adapting type 1 (SA-1) neurons (blue line), respectively. The error bars represent the SEM across neurons (FA-1: n=30; SA-1: n=23). The thin gray lines represent mean responses for each of the four line stimuli separately. (B and C) Same format but for peak firing rate and spike count, respectively.
Figure 3
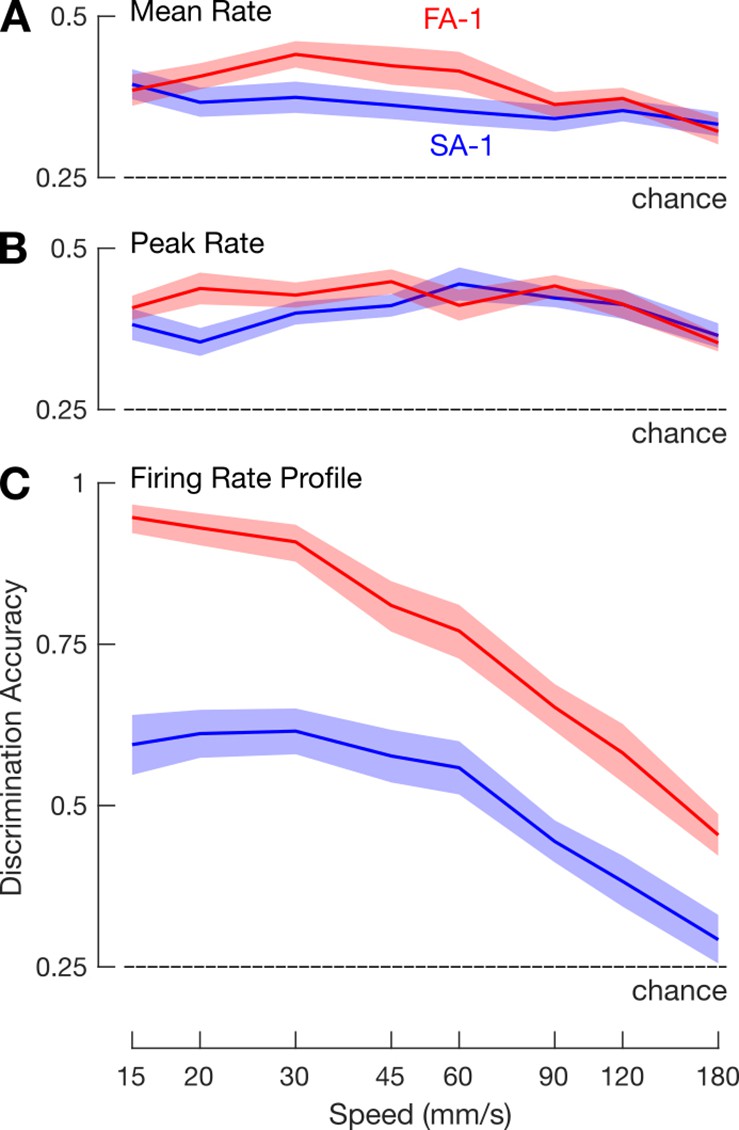
Within-speed discrimination accuracy.
Mean within-speed discrimination accuracy for fast-adapting type 1 (FA-1) neurons (red lines) and slow-adapting type 1 (SA-1) neurons (blue lines) as a function of simulation speed based on neuron’s mean firing rate (A), peak firing rate (B), and firing rate profile (C). (A – C) Shaded areas illustrate the SEM and dashed line chance discrimination performance (25%).
Figure 4
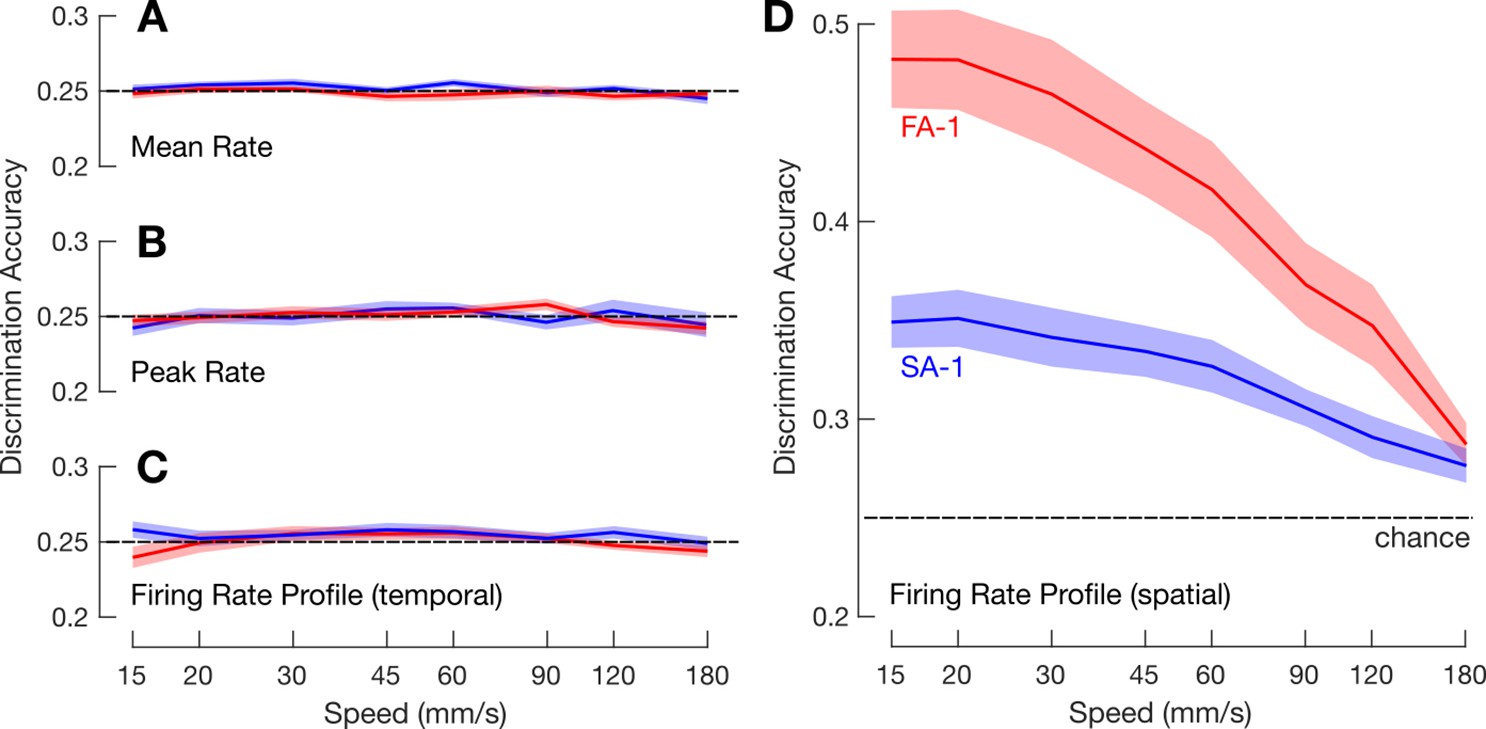
Across-speed discrimination accuracy.
Mean across-speed discrimination accuracy for fast-adapting type 1 (FA-1) neurons (red lines) and slow-adapting type 1 (SA-1) neurons (blue lines) as a function of core speed based on neuron’s mean firing rate (A), peak firing rate (B), firing rate profile represented in the temporal domain (C), and in the spatial domain (D). (A – C) Shaded areas illustrate the standard error around the mean (FA-1: n=30; SA-1: n=23) and dashed horizontal line chance discrimination performance (25%).
Figure 5
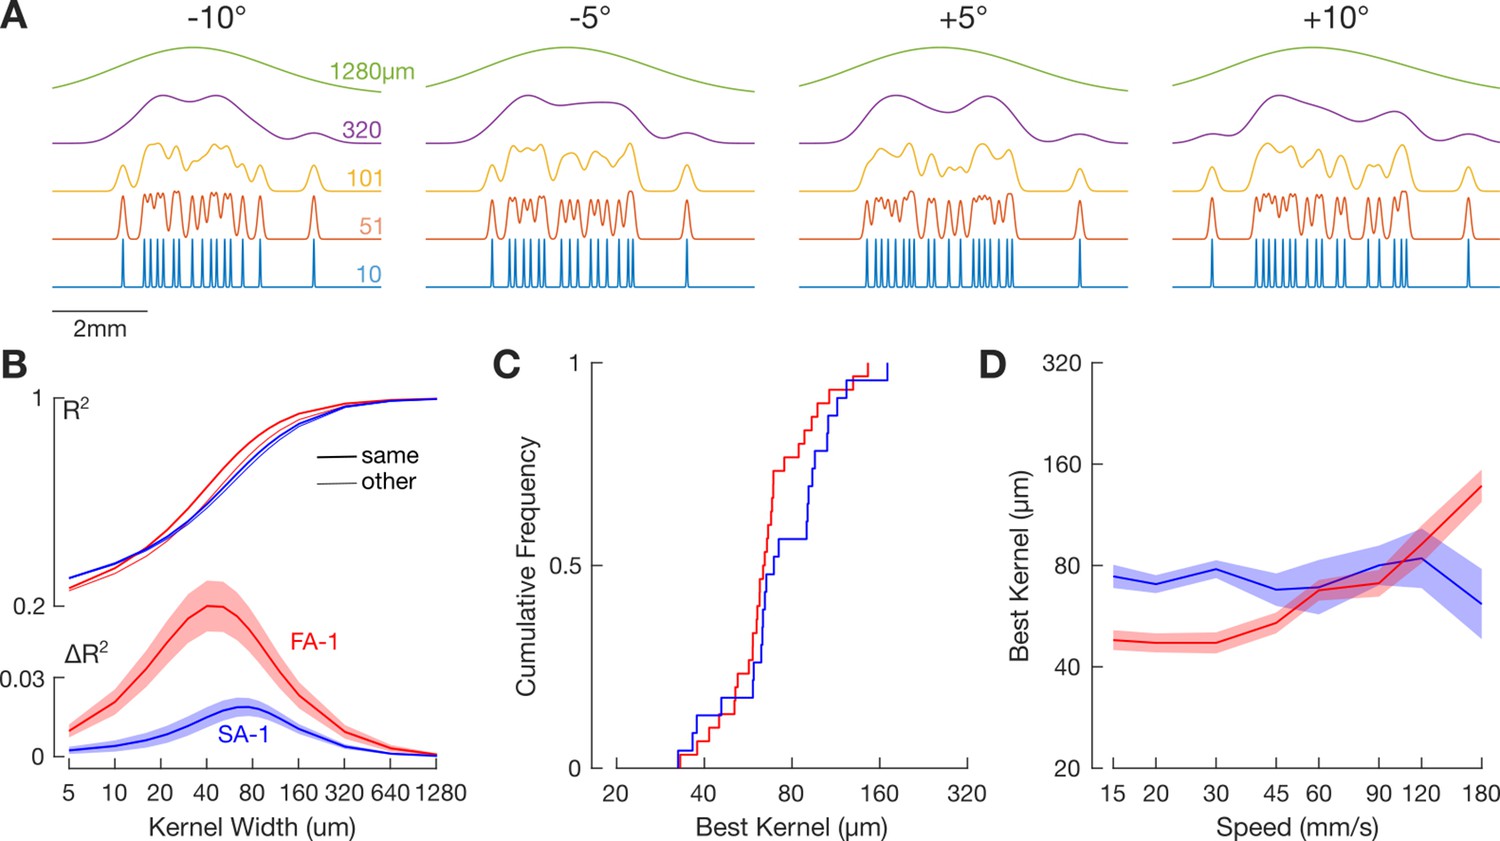
Spatial precision of spike responses.
(A) Illustration of the kernel convolution procedure for an exemplar neuron for one speed and all four line stimuli. Colored traces within each panel show the spike train smoothed by a Gaussian kernel of the indicated SD. Note how increasing the kernel width progressively blurs the representation of where individual action potentials occur. (B) Top: mean correlation (expressed as R2) between neuron responses to the same edge orientations (thick line) and different edge orientations (thin line) as a function of kernel width for the 30 mm/s scanning speed. Bottom: average correlation difference between stimuli with the same and with different edge orientations as a function of kernel width for the 30 mm/s scanning speed. Red and blue lines represent fast-adapting type 1 (FA-1) and slow-adapting type 1 (SA-1) neurons, respectively. Shaded areas illustrate the standard error around the mean. (C) Cumulative frequency distribution of the best kernel of FA-1 (red) and SA-1 (blue) neurons where each neuron is represented by the mean value of the best kernel calculated across speeds. (D) Mean best kernel as a function of scanning speed for FA-1 (red line) and SA-1 neurons (blue line). Shaded areas illustrate the standard error around the mean (FA-1: n=30; SA-1: n=23).
Figure 6
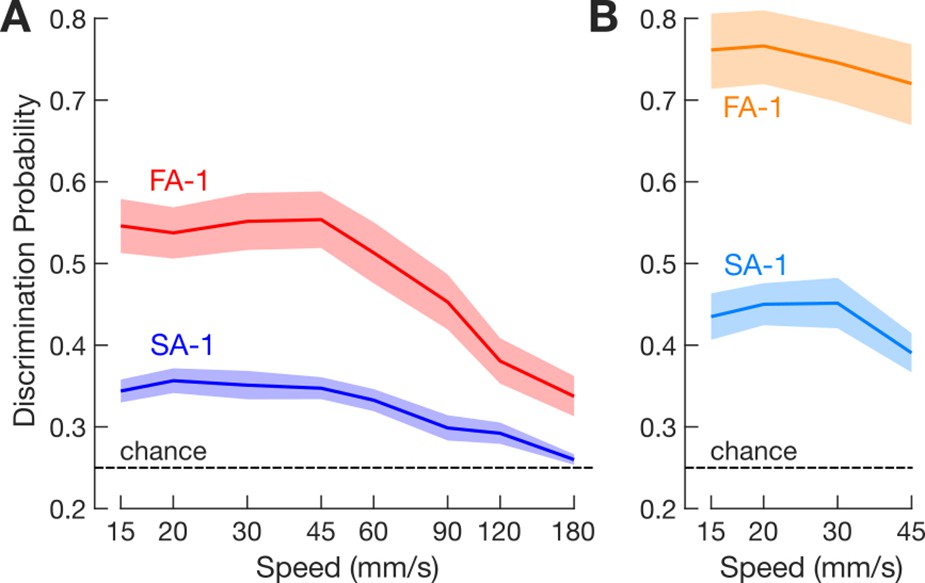
Across-speed discrimination accuracy based on smoothed spike trains.
(A) Average across-speed discrimination accuracy for fast-adapting type 1 (FA-1) (red line) and slow-adapting type 1 (SA-1) neurons (blue line) as a function of scanning speed. (B) Same format but considering only the speeds commonly used by people when discriminating these kinds of stimuli (15–45 mm/s). (A and B) Data based on spike trains convolved by the average best kernel over neurons and speeds (66 μm for FA-1 neurons, n=30; 73 μm for SA-1 neurons, n=23). Shaded areas illustrate the SEM, and the dashed line indicates chance discrimination performance (25%).
Figure 7
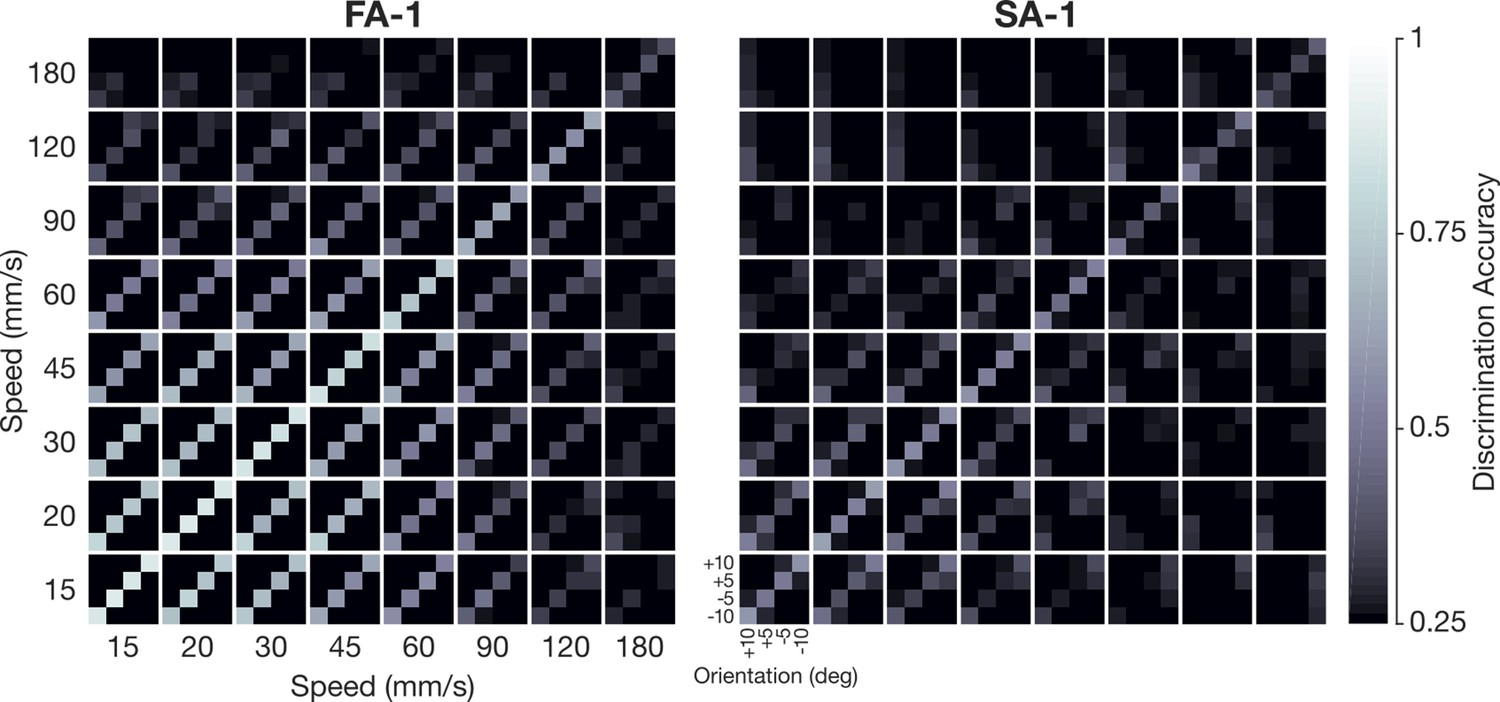
Confusion matrix showing discrimination across all experimental conditions.
Discrimination accuracy for all edge orientation and speed combinations based on spike trains convolved by the average best kernel over neurons and speeds (66μm for fast-adapting type 1 [FA-1] neurons, n=30; 73μm for slow-adapting type 1 [SA –1], n=23). Each 4×4 submatrix represents comparisons of the four oriented edges within the indicated speed combination. Thus, the main diagonal of the submatrices represents within-speed comparisons, and the off-diagonal submatrices represent across-speed comparisons. The brightness of each element represents the probability of assigning the correct edge orientation to each of the four possibilities where chance performance is 25%.
Figure 8
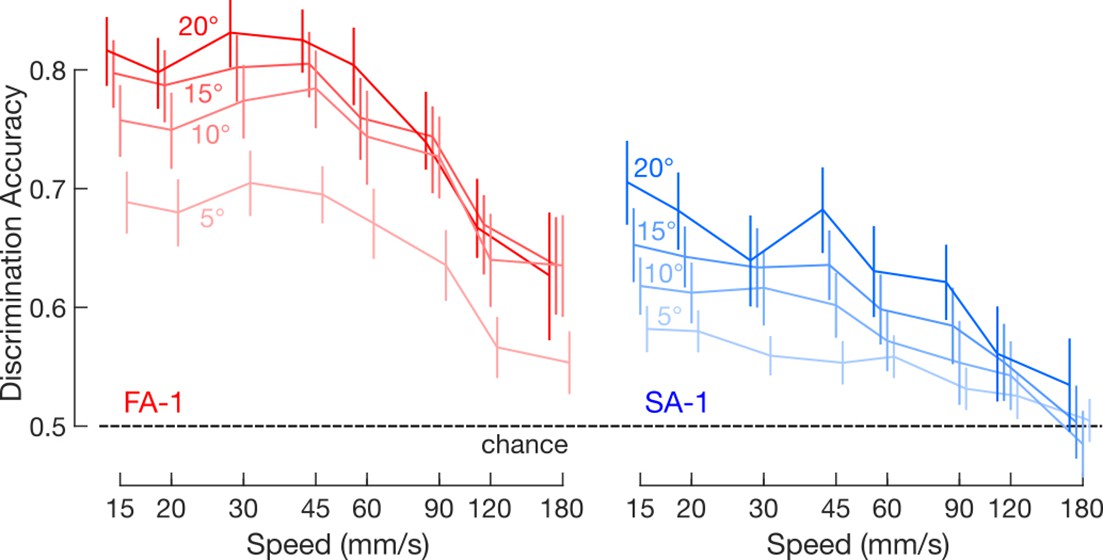
Discrimination accuracy as a function of orientation difference.
Mean across-speed discrimination accuracy for fast-adapting type 1 (FA-1) (red lines) and slow-adapting type 1 (SA-1) neurons (blue lines) as a function of speed and orientation difference. Data based on spike trains convolved by the average best kernel over neurons and speeds (66 μm for FA-1 neurons, n=30; 73 μm for SA –1, n=23). The different shades of each color represent the indicated orientation differences. Error bars represent the SEM, and the dashed line indicates chance discrimination performance (50%).
Additional files
Download links
A two-part list of links to download the article, or parts of the article, in various formats.
Downloads (link to download the article as PDF)
Open citations (links to open the citations from this article in various online reference manager services)
Cite this article (links to download the citations from this article in formats compatible with various reference manager tools)
Precise and stable edge orientation signaling by human first-order tactile neurons
eLife 11:e81476.
https://doi.org/10.7554/eLife.81476


