Presynaptic Rac1 controls synaptic strength through the regulation of synaptic vesicle priming
- Department of Anatomy and Cell Biology, University of Iowa, United States
- Department of Human Medicine, Carl-von-Ossietzky University Oldenburg, Germany
- Research Center Neurosensory Science, Carl-von-Ossietzky University Oldenburg, Germany
- Electron Microscopy Core Facility, Max Planck Florida Institute for Neuroscience, United States
- Department of Molecular Neurobiology, Max Planck Institute for Multidisciplinary Sciences, Germany
- Göttingen Graduate School for Neurosciences, Biophysics, and Molecular Biosciences, Germany
- Department of Otolaryngology, Iowa Neuroscience Institute, University of Iowa, United States
Figures
Figure 1
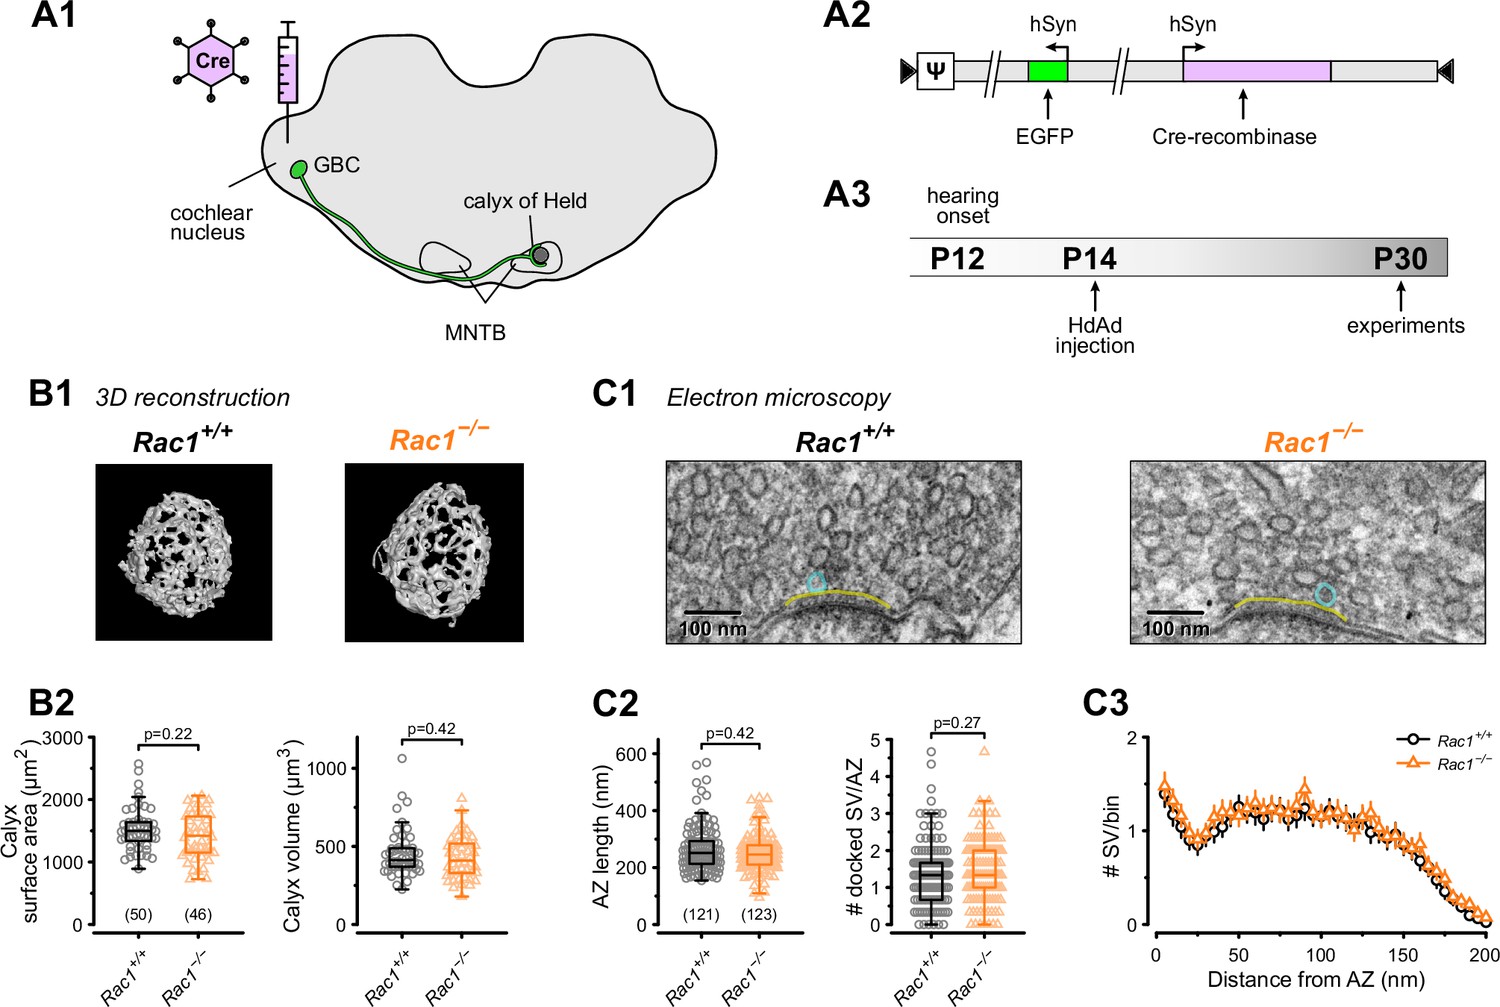
Loss of presynaptic Rac1 after hearing onset does not affect calyx of Held gross morphology or ultrastructure.
(A) Cre recombinase-expressing HdAds were injected into the cochlear nucleus of Rac1fl/fl mice at P14, yielding Rac1−/− calyces of Held. All experiments were performed at around four weeks of age. Cre recombinase-expressing calyces could be visually identified by simultaneous expression of EGFP. (B1) Representative reconstruction of calyx terminals of Rac1+/+ (left) and Rac1−/− (right) animals. (B2) Calyx morphology assessed by surface area (left) and volume (right) was not affected by the loss of Rac1. (C1) Representative EM images of the active zone (yellow) and docked SV (blue) to assess synaptic ultrastructure. (C2) AZ length and number of docked SV were comparable between Rac1+/+ and Rac1−/−. (C3) SV distribution as a function of distance to AZ was not different between Rac1+/+ and Rac1−/−. Box plot whiskers extend to the minimum/maximum within the 1.5 interquartile range; open markers indicate individual data points. For EM data, the results of three independent investigators were averaged. All data shown in the figure and the detailed results of statistical tests are part of the supplementary file.
-
Figure 1—source data 1
Excel file containing the data shown in Figure 1 and the results of statistical analysis.
- https://cdn.elifesciences.org/articles/81505/elife-81505-fig1-data1-v2.xlsx
Figure 2
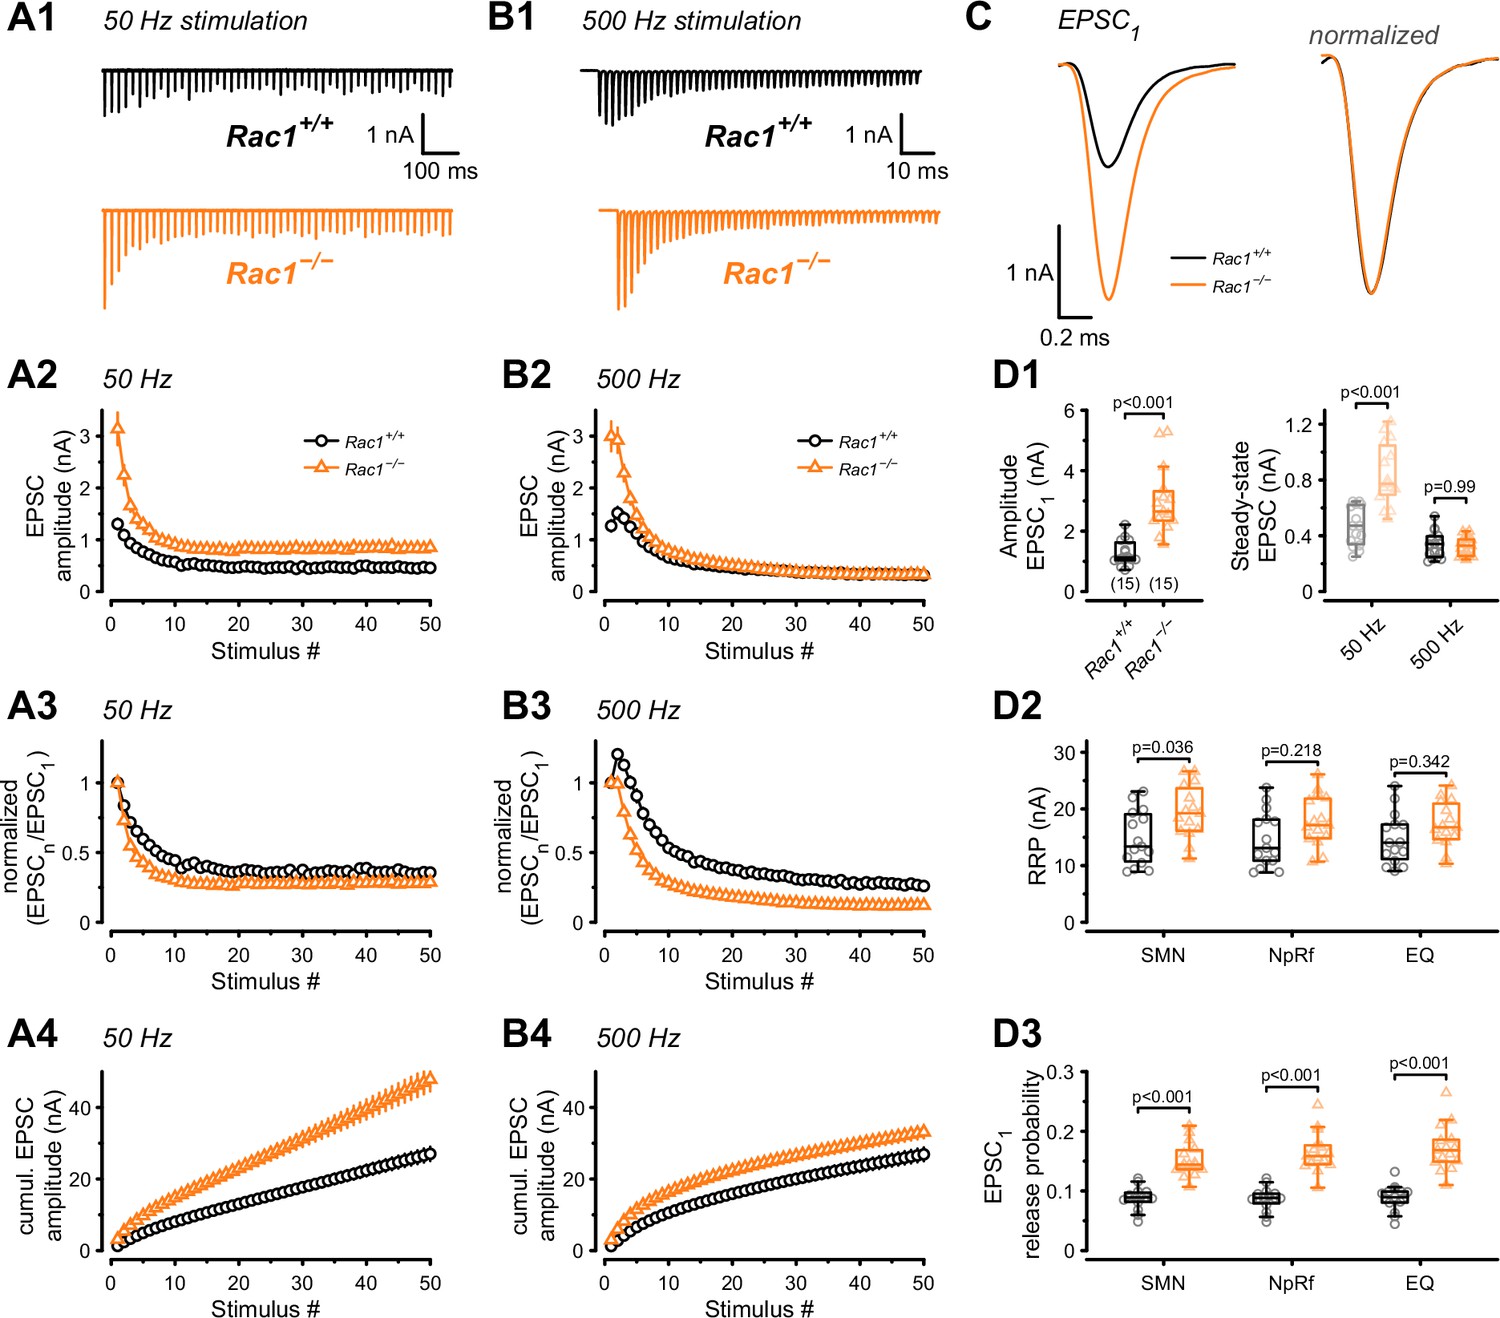
Presynaptic Rac1 regulates synaptic vesicles release probability and synaptic strength.
Synaptic transmission at the calyx of Held – MNTB synapse was studied using different stimulation frequencies at P28 after deletion of Rac1 at P14. (A1, B1) Representative evoked EPSCs for Rac1+/+ (black) and Rac1−/− (orange) at 50 Hz and 500 Hz stimulation frequency. Stimulus artifacts were blanked for clarity. (C) Magnification of the first EPSC (EPSC1). Ablation of presynaptic Rac1 resulted in increased EPSC1 amplitude with no change in EPSC dynamics. (A2–A4) At 50 Hz stimulation frequency, Rac1−/− showed stronger short-term depression despite larger steady-state EPSC amplitudes. (B2–B4) At 500 Hz stimulation frequency, loss of Rac1 resulted in a lack of short-term facilitation and increased synaptic depression with no change in steady-state EPSC amplitude. (D1) Population data showing an increase in EPSC1 amplitude in Rac1−/−. Steady-state EPSC amplitudes were increased in Rac1−/− at 50 Hz but not at 500 Hz stimulation frequency. (D2) Population data of the readily releasable pool (RRP) using three different estimation methods, suggesting little to no change in RRP size (D3) Population data indicating that EPSC1 release probability in Rac1−/− was elevated independent of estimation method. All data shown in the figure and the detailed results of statistical tests are part of the supplementary file.
-
Figure 2—source data 1
Excel file containing the data shown in Figure 2 and the results of statistical analysis.
- https://cdn.elifesciences.org/articles/81505/elife-81505-fig2-data1-v2.xlsx
Figure 3
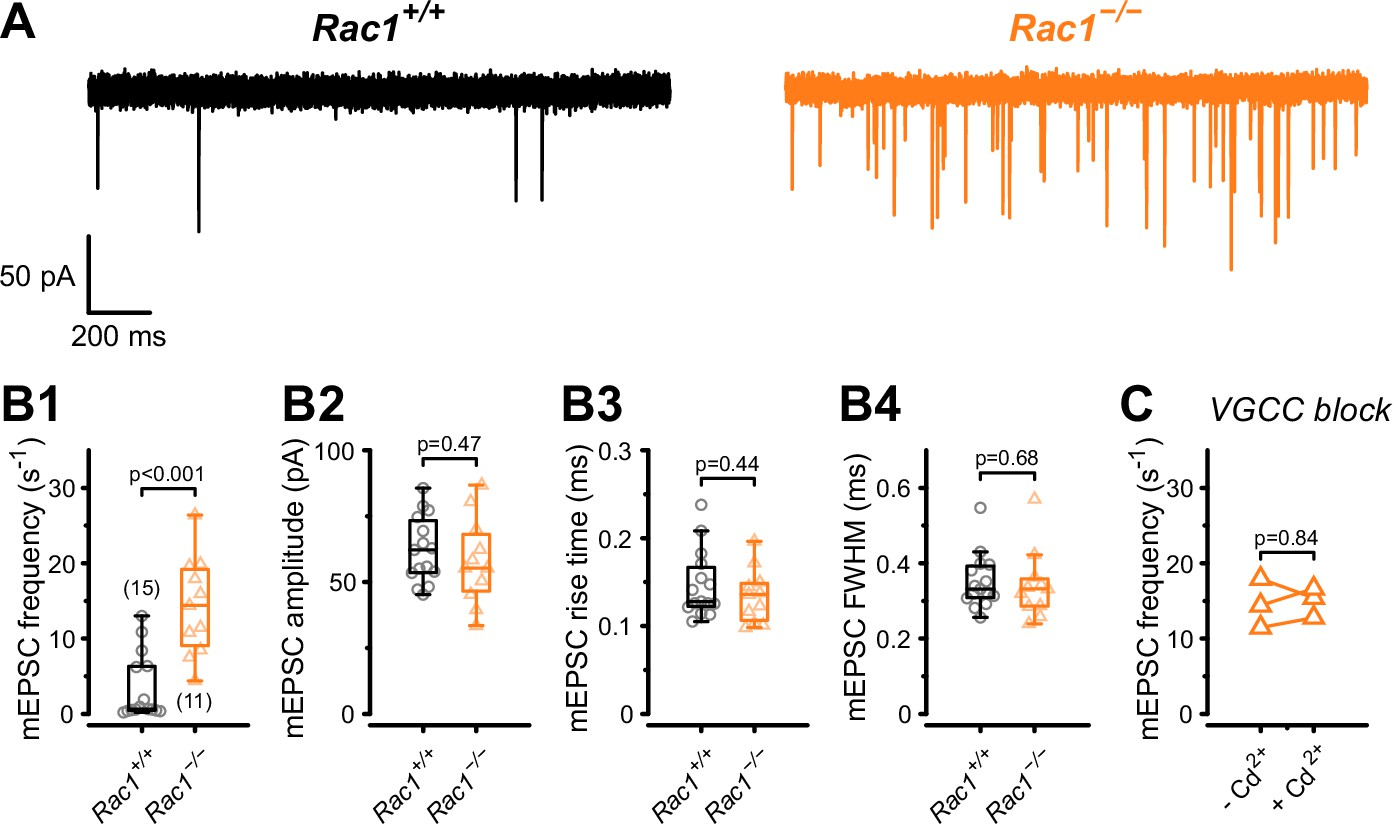
Presynaptic loss of Rac1 increases calcium-independent neurotransmitter release.
(A) Representative recordings of mEPSCs for Rac1+/+ (left, black) and Rac1−/− (right, orange). (B1–B4) Rac1 deletion increased mEPSC frequency but did not affect mEPSC amplitude, rise time, or full width at half-maximal amplitude (FWHM). (C) The increased mEPSC rates at Rac1−/− were independent of presynaptic voltage-gated calcium channels (VGCC), as blocking VGCC with cadmium (Cd2+) did not affect mEPSC frequency. All data shown in the figure and the detailed results of statistical tests are part of the supplementary file.
-
Figure 3—source data 1
Excel file containing the data shown in Figure 3 and the results of statistical analysis.
- https://cdn.elifesciences.org/articles/81505/elife-81505-fig3-data1-v2.xlsx
Figure 4
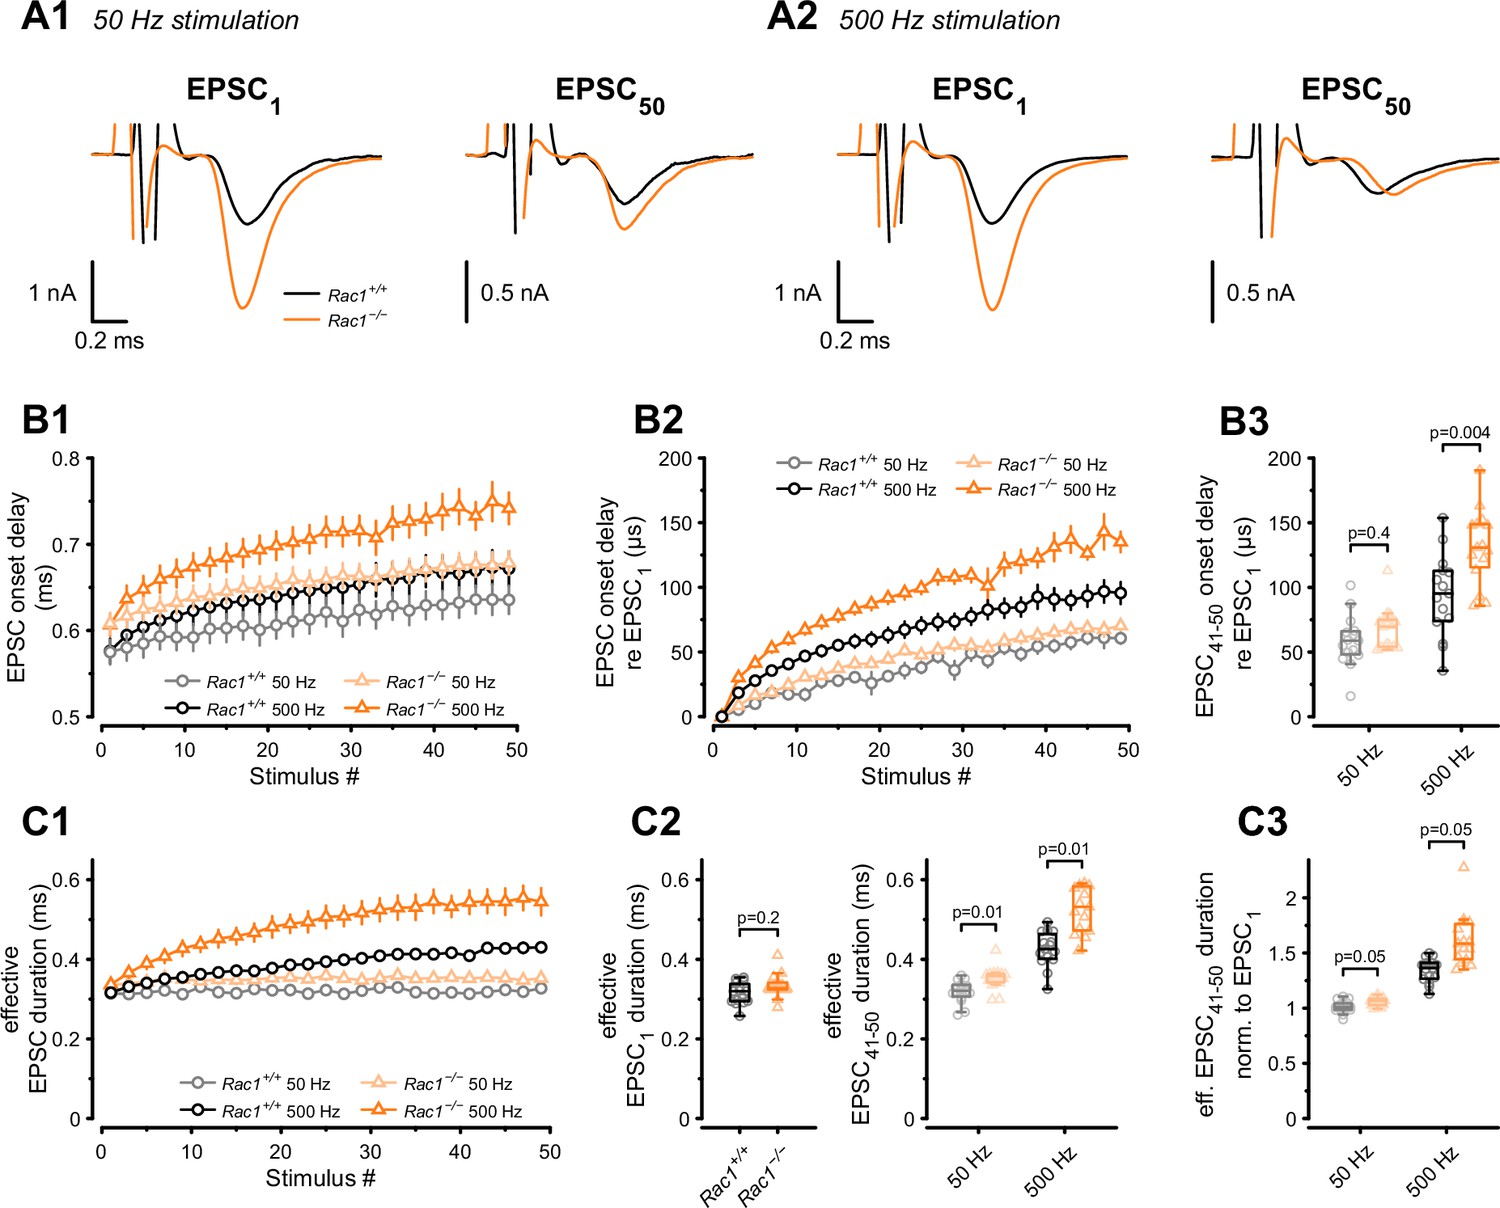
Presynaptic loss of Rac1 decreases SV synchronicity and prolongs EPSC onset at high-frequency stimulation.
(A) Experiments were performed at low (50 Hz, A1) and high (500 Hz, A2) stimulation frequencies. Representative recordings of first (EPSC1) and last (EPSC50) EPSC in the stimulus train. Traces are aligned at the EPSC onset of EPSC1. Stimulus artifacts are partially blanked for better visibility. Note the shift in the onset of EPSC50 in Rac1−/− compared to Rac1+/+ at 500 Hz but not 50 Hz. (B1) Absolute EPSC onset delay for 50 Hz (gray and light orange) and 500 Hz (black and orange) stimulation. (B2) EPSC onset delay relative to EPSC1 for 50 Hz (gray and light orange) and 500 Hz (black and orange). At 50 Hz, the EPSC onset delay was similar between Rac1+/+ and Rac1−/−. At 500 Hz, the EPSC onset delay was substantially larger at Rac1−/−. For better visualization, only every second data point is shown. (B3) EPSC onset delay of the last ten EPSCs relative to EPSC1 for 50 Hz and 500 Hz stimulation. EPSC delay of the last ten EPSCs in the stimulus train (EPSC41-50) was not different between Rac1+/+ and Rac1−/− at 50 Hz but increased for Rac1−/− at 500 Hz stimulation frequency. (C1) Analysis of ‘effective EPSC duration’ to estimate SV release synchronicity during 50 Hz and 500 Hz stimulation. Synchronicity was estimated from ‘effective EPSC duration’ by dividing the EPSC charge by the EPSC amplitude. Note the increase in effective EPSC duration for Rac1−/− at 500 Hz stimulation. For better visualization, only every second data point is shown (C2) EPSC duration was not different for EPSC1 but slightly longer for late EPSCs in Rac1−/− at 50 Hz and substantially longer at 500 Hz stimulation frequency. (C3) Effective EPSC duration of EPSC41-50 normalized to EPSC1. Note the progressive increase in effective EPSC duration in Rac1−/− with increasing stimulation frequency. All data shown in the figure and the detailed results of statistical tests are part of the supplementary file.
-
Figure 4—source data 1
Excel file containing the data shown in Figure 4 and the results of statistical analysis.
- https://cdn.elifesciences.org/articles/81505/elife-81505-fig4-data1-v2.xlsx
Figure 5
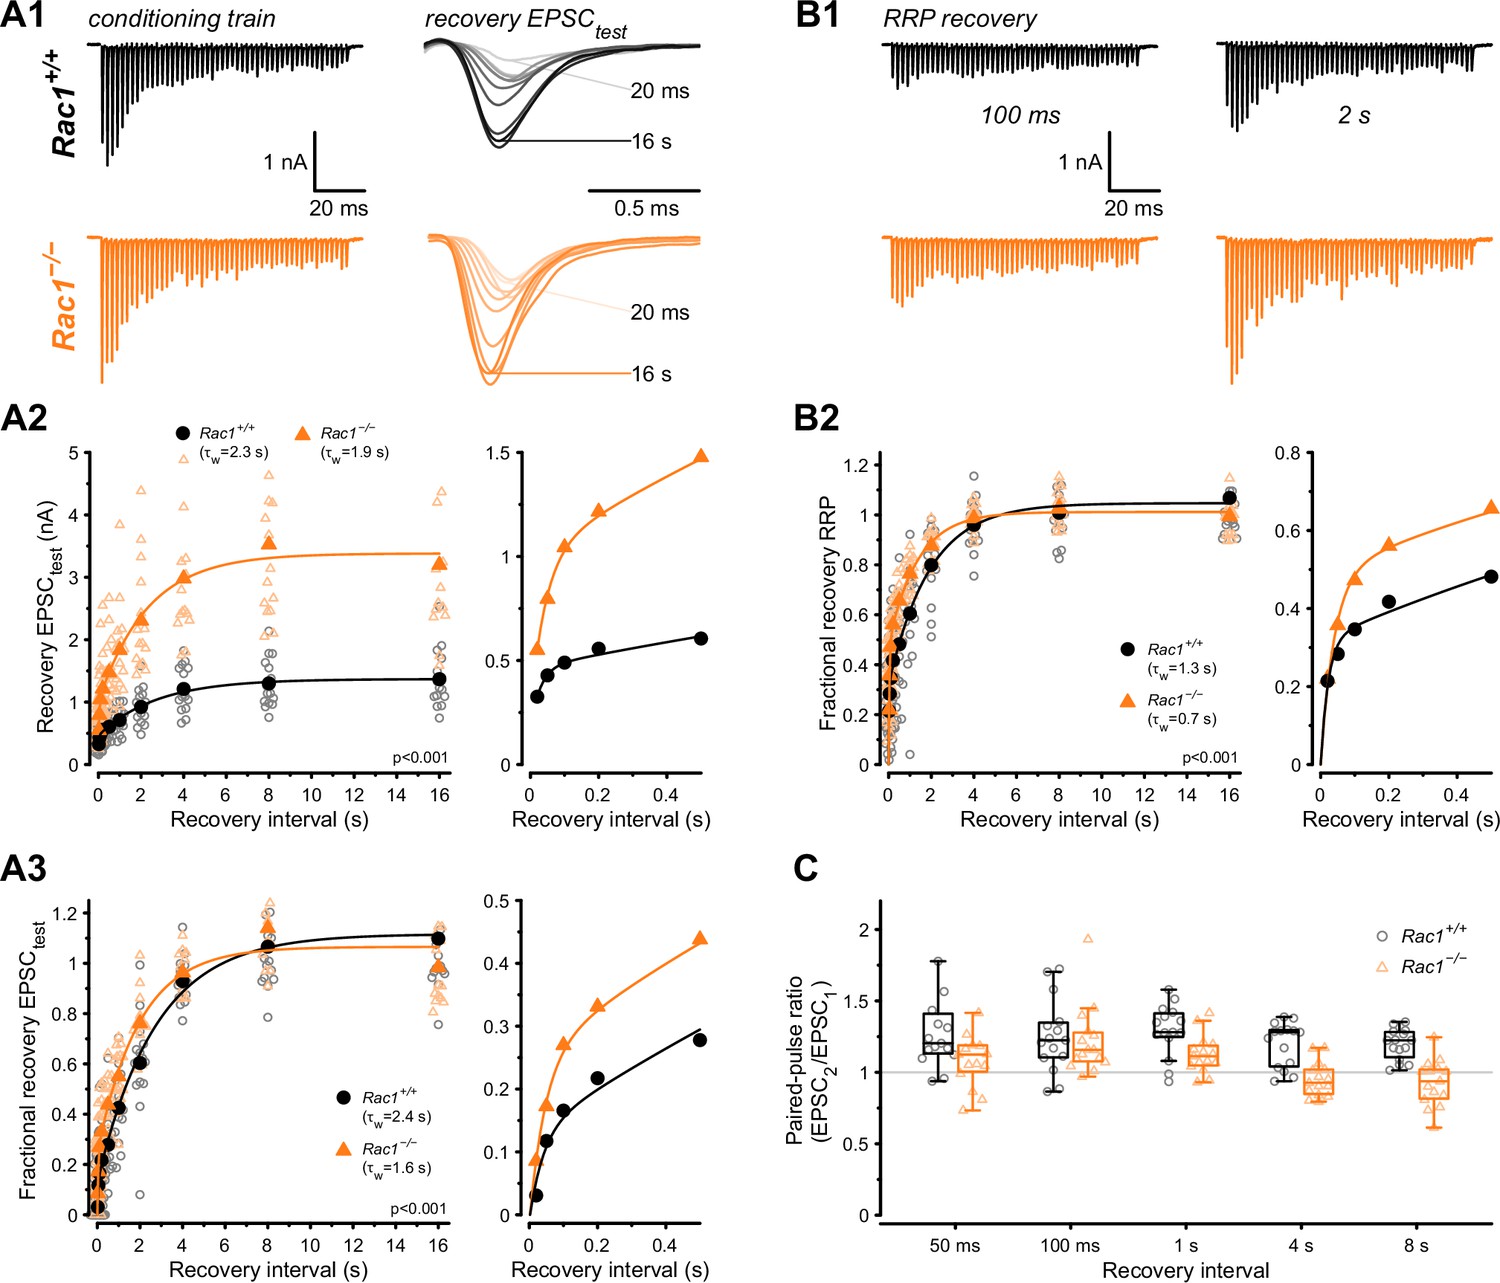
Loss of presynaptic Rac1 facilitates synaptic vesicle recovery.
Recovery of single EPSC (EPSCtest) and RRP recovery was measured by two consecutive train stimuli (conditioning stimulus and recovery stimulus) at 500 Hz at varying recovery intervals. (A) Single EPSC recovery. (A1) Representative traces for Rac1+/+ (black) and Rac1−/− (orange) for recovery intervals ranging from 20 ms to 16 s. (A2) Recovery of absolute EPSC amplitudes as a function of recovery interval with a magnification of short intervals (right). (A3) Fractional EPSC recovery as a function of recovery interval. (B) Recovery of the RRP. (B1) Representative recovery traces following a 100 ms and 2 s recovery interval. The conditioning stimulus train is the same as in A1. (B2) Fractional RRP recovery was faster in Rac1−/− compared to Rac1+/+. (C) Recovery of the paired-pulse ratio (PPR) of the first two EPSCs of the recovery train. PPR was consistently lower in Rac1−/− but the difference was emphasized at longer recovery intervals. All data shown in the figure and the detailed results of statistical tests are part of the supplementary file.
-
Figure 5—source data 1
Excel file containing the data shown in Figure 5 and the results of statistical analysis.
- https://cdn.elifesciences.org/articles/81505/elife-81505-fig5-data1-v2.xlsx
Figure 6 with 2 supplements
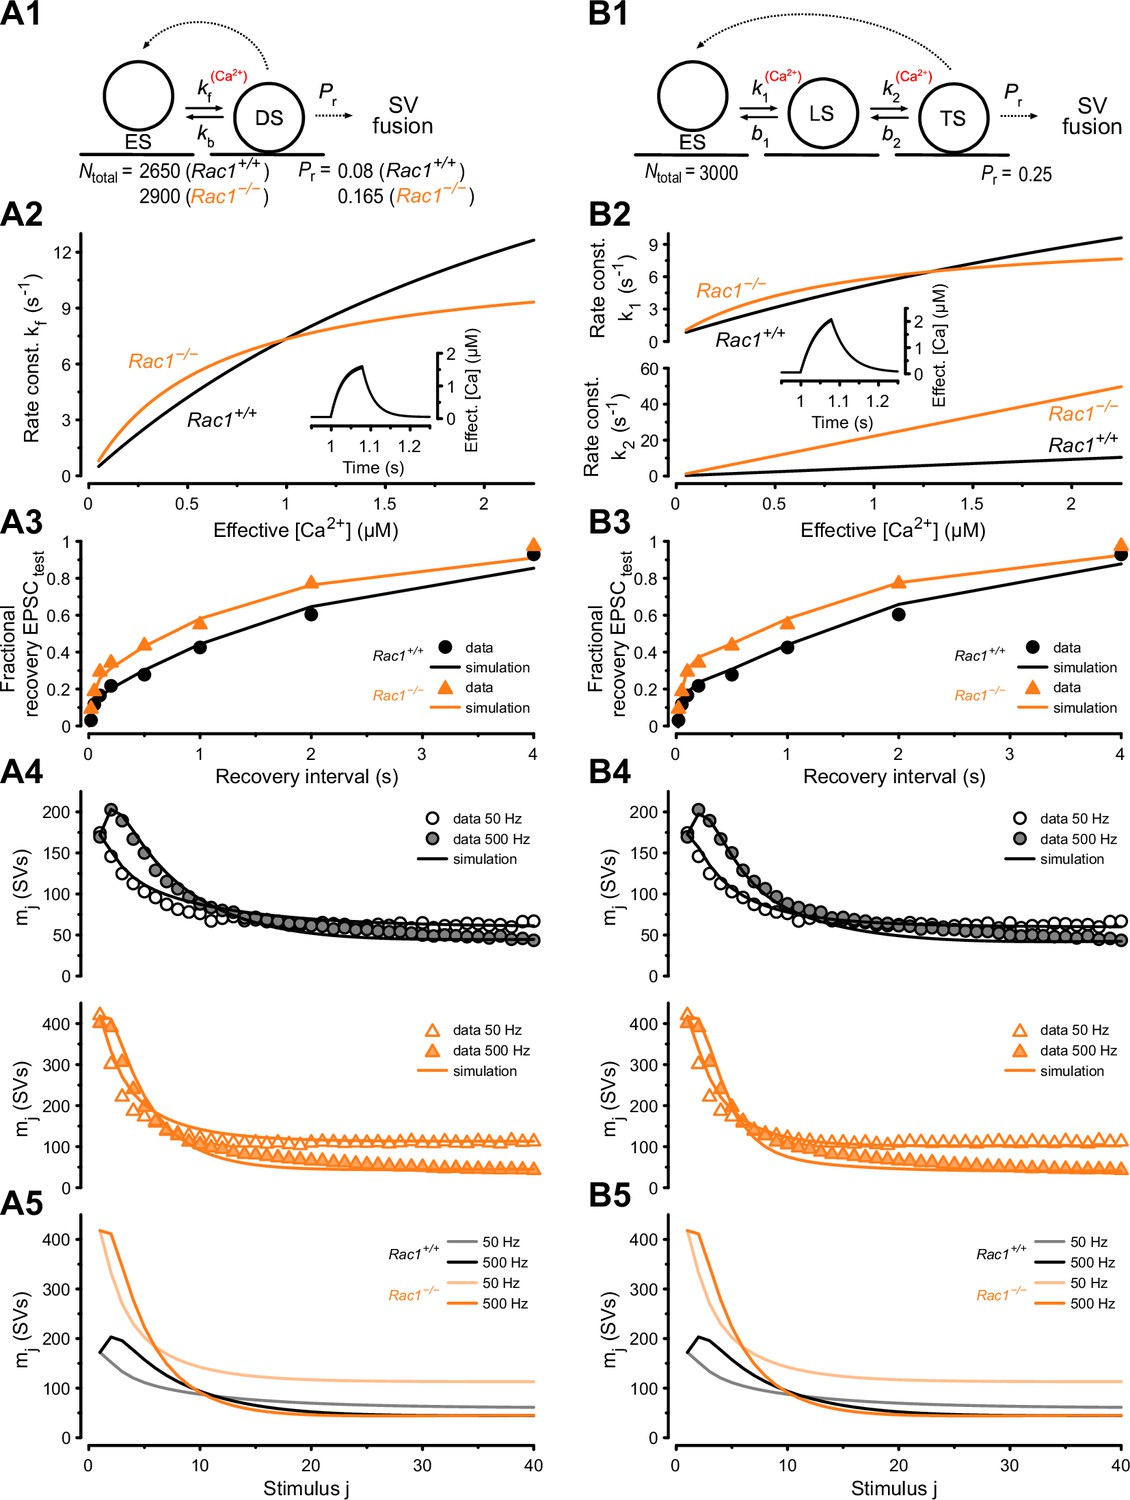
Numerical simulations of 50 and 500 Hz STP and EPSC recovery after conditioning 500 Hz trains are consistent with Rac1-loss induced changes in SV priming.
Experimental observations were equally well reproduced by either of two kinetic schemes of SV priming and fusion: a single-pool model (A) or a recently proposed (Lin et al., 2022) sequential two-step SV priming scheme (B). (A1) Diagram of vesicle states for the single-pool model. SVs reversibly dock at empty release sites (ES). SVs in the docked and primed state (DS) undergo fusion with the probability Pr upon AP arrival. Vacated sites become immediately available for SV docking and priming. Transitions represented by dashed lines occur instantaneously, while those represented by solid lines occur with rate constants as indicated. Forward transition rate constant is Ca2+-dependent. For the single-pool model, Pr and total number of sites (Ntotal) were free parameters for both genotypes. The model predicts an increased Pr from 0.08 (Rac1+/+) to 0.165 (Rac1−/−) and an increase in the number of docked SVs (RRP) from 2150 SVs (Rac1+/+) to 2532 SVs (Rac1−/−). (A2) Dependence of kf on cytosolic [Ca2+] (effective [Ca2+]) for Rac1+/+ (black) and Rac1−/− (orange) synapses. The inset illustrates the time course of the effective [Ca2+] during a 500 Hz train consisting of 40 stimuli. (A3) Predictions of the single-pool model (lines) for the time course of the fractional recovery of EPSCtest after 500 Hz conditioning trains superimposed onto experimental data for Rac1+/+ (black circles) and Rac1−/− (orange triangles) synapses (data from Figure 5A3). (A4) Predictions of the single-pool model (lines) for the time course of STP during 50 Hz and 500 Hz trains superimposed onto experimental data (circles) for Rac1+/+ (black, top panel) and Rac1−/− (orange, bottom panel) synapses. (A5) Model predictions for the time course of STP during 50 Hz and 500 Hz trains for Rac1+/+ (gray and black) and Rac1−/− (light and dark orange) synapses shown superimposed to facilitate comparison. (B1) Diagram of vesicle states for the sequential two-step priming scheme. SVs reversibly dock at empty release sites (ES) and become fusion-competent by undergoing a sequence of two priming steps. After initial docking, SVs in the loosely docked state (LS) reversibly transition to the tightly docked state (TS) from which they undergo fusion upon AP arrival with the probability Pr. Vacated sites become immediately available for SV docking and priming. Transitions represented by dashed lines occur instantaneously, while those represented by solid lines occur with rate constants as indicated. Forward transition rate constants are Ca2+-dependent. For the sequential two-step priming scheme, Pr and total number of sites (Ntotal) were constrained to the same values for Rac1+/+ and Rac1−/− synapses and only parameters determining the kinetics of the two priming steps were allowed to differ between genotypes. (B2) Dependence of k1 (top panel) and k2 (bottom panel) on cytosolic [Ca2+] for Rac1+/+ (black) and Rac1−/− (orange) synapses. The inset illustrates the time course of the effective [Ca2+] during a 500 Hz train consisting of 40 stimuli. (B3) Predictions of the sequential two-step model (lines) for the time course of the fractional recovery of EPSCtest after 500 Hz conditioning trains superimposed onto experimental data for Rac1+/+ (black circles) and Rac1−/− (orange triangles) synapses (data from Figure 5A3). (B4) Predictions of the sequential two-step model (lines) for the time course of STP during 50 Hz and 500 Hz trains superimposed onto experimental data (circles) for Rac1+/+ (black, top panel) and Rac1−/− (orange, bottom panel) synapses. (B5) Model predictions for the time course of STP during 50 Hz and 500 Hz trains for Rac1+/+ (gray and black) and Rac1−/− (light and dark orange) synapses shown superimposed to facilitate comparison.
Figure 6—figure supplement 1

Model predictions and parameters of simple single-pool models fitted to Rac1+/+ and Rac1−/− STP and recovery data sets.
(A) Model predictions for synaptic STP during regular stimulus trains consisting of 40 APs and delivered at frequencies from 0.5 to 500 Hz for Rac1+/+ (A1), (black) and Rac1−/− (A2), (orange) synapses. Note the strongly enhanced initial synaptic strength but similar steady-state release at the highest stimulus frequency. (B) Model predictions for the paired-pulse ratio (PPR = EPSC2/EPSC1) for Rac1+/+ (black circles) and Rac1−/− (orange triangles) synapses. While Rac1+/+ synapses show substantial net facilitation at ISIs of 2 and 5ms, net facilitation is absent from for Rac1−/− synapses. (D) Model parameters for Rac1+/+ (D1), (black) and Rac1−/− (D2), (orange) synapses. Parameter values that differ between the models for Rac1+/+ and Rac1−/− synapses are listed in bold. For details, please refer to Lin et al., 2022. For converting EPSC amplitudes measured in the presence of 1 mM kynurenic acid into quantal content, a quantal size of q=7.48 pA was assumed.
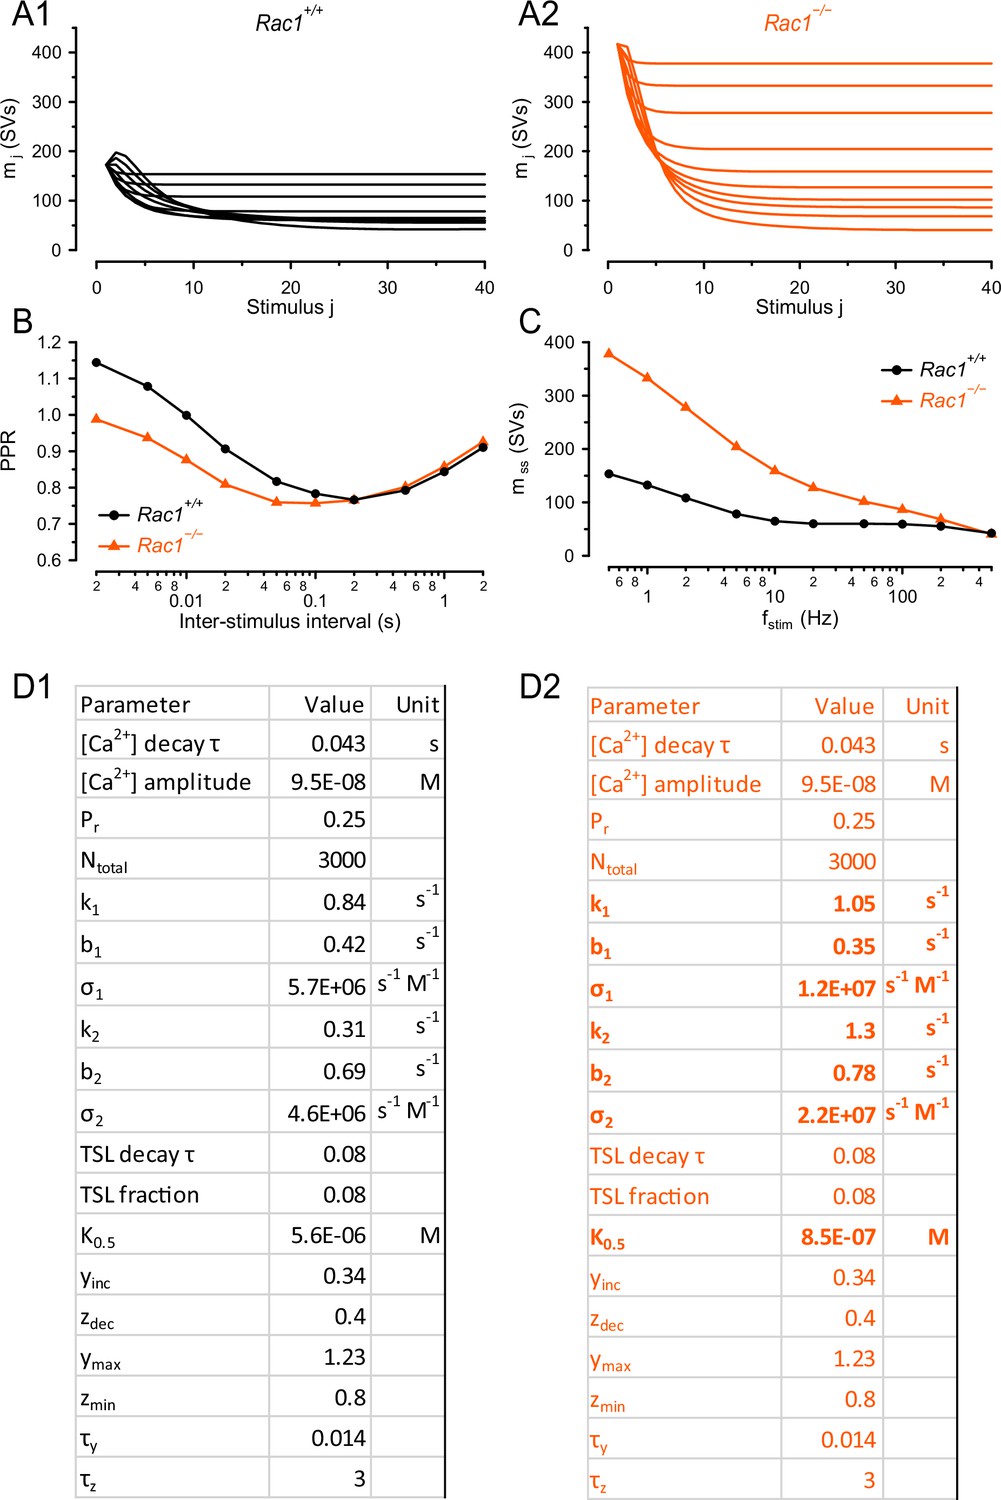
Figure 6—figure supplement 2
Model predictions and parameters of sequential two-step models fitted to Rac1+/+ and Rac1−/− STP and recovery data sets.
(A) Model predictions for synaptic STP during regular stimulus trains consisting of 40 APs and delivered at frequencies from 0.5 to 500 Hz for Rac1+/+ (A1), (black) and Rac1−/− (A2), (orange) synapses. Note the strongly enhanced initial synaptic strength but similar steady-state release at the highest stimulus frequency. (B) Model predictions for the paired-pulse ratio (PPR = EPSC2/EPSC1) for Rac1+/+ (black circles) and Rac1−/− (orange triangles) synapses. While Rac1+/+ synapses show substantial net facilitation at ISIs of 2 and 5ms, net facilitation is absent from for Rac1−/− synapses. (D) Model parameters for Rac1+/+ (D1), (black) and Rac1−/− (D2), (orange) synapses. Parameter values that differ between the models for Rac1+/+ and Rac1−/− synapses are listed in bold. For details, please refer to Lin et al., 2022. For converting EPSC amplitudes measured in the presence of 1 mM kynurenic acid into quantal content, a quantal size of q=7.48 pA was assumed.
Figure 7
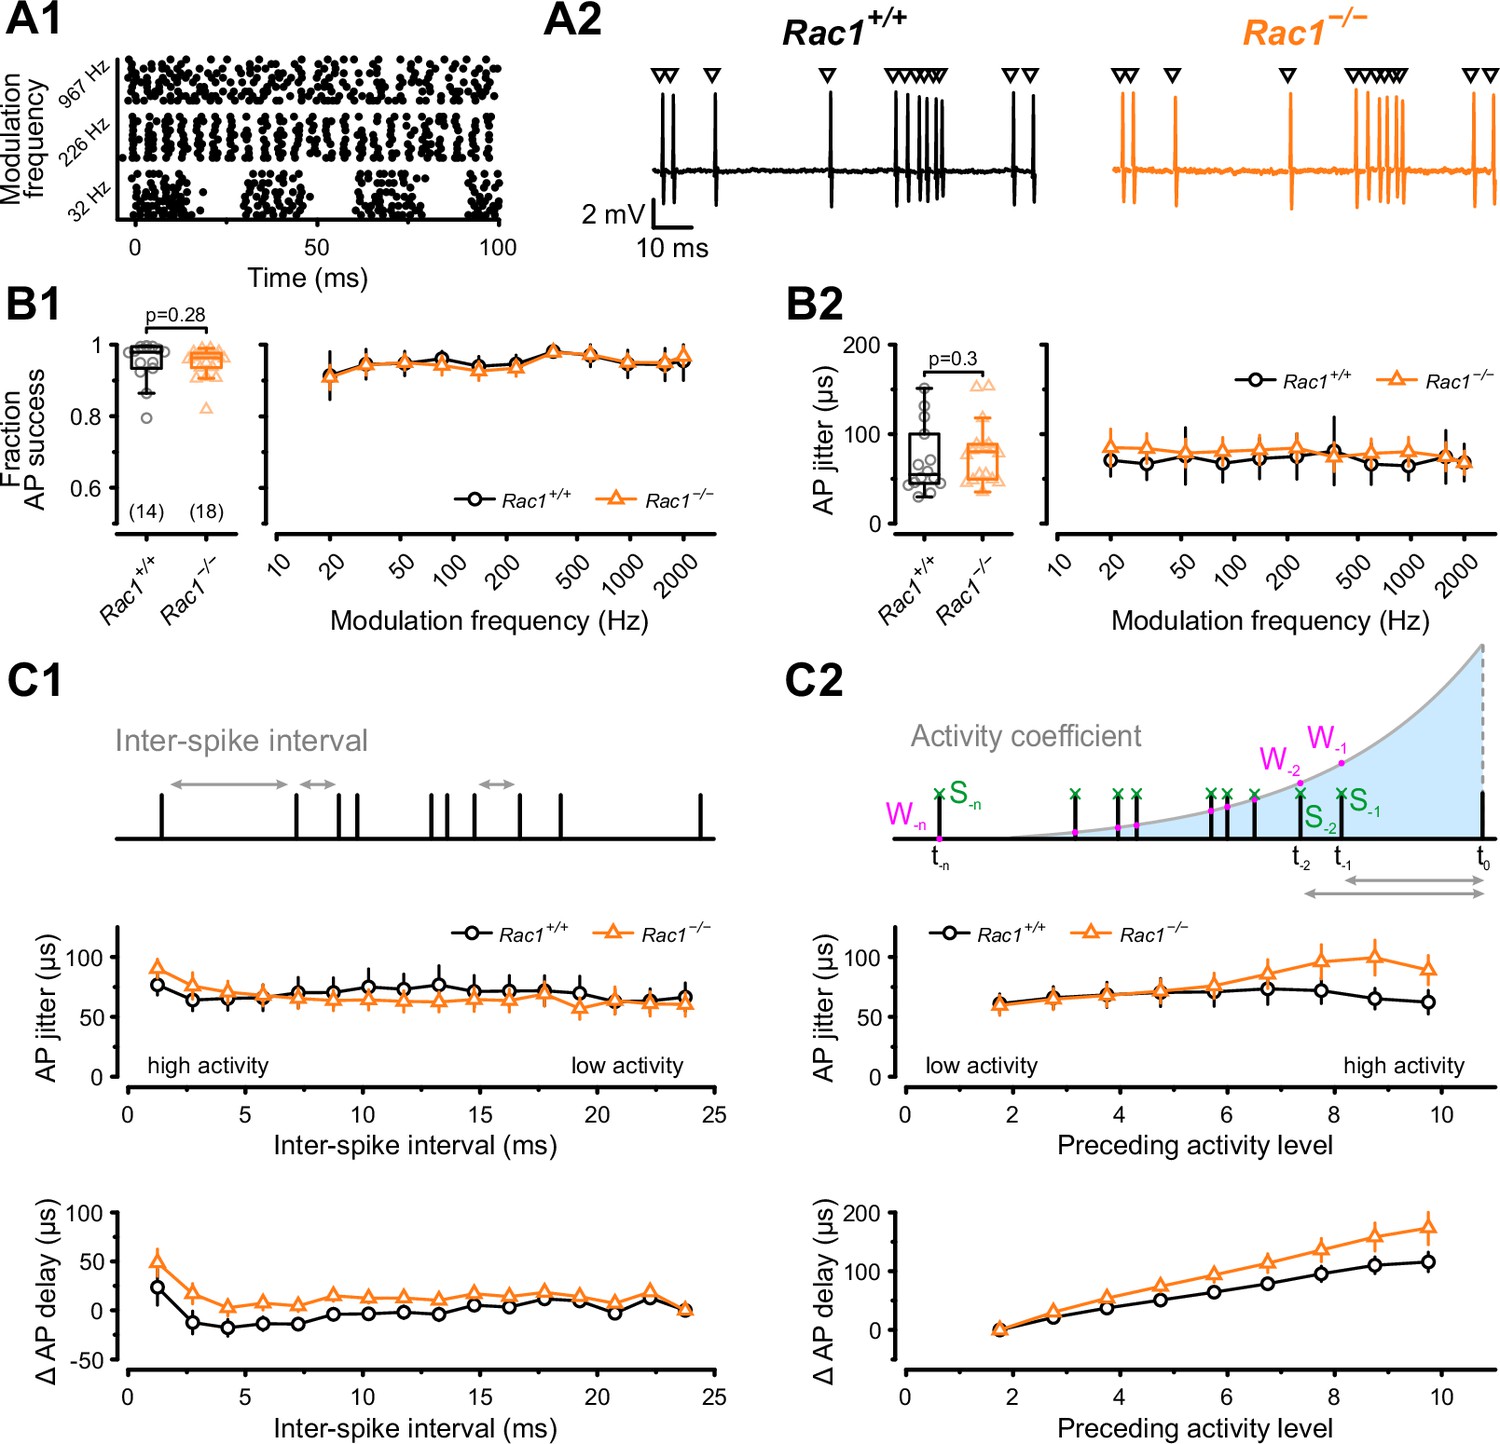
Alterations in presynaptic release probability did not impair the reliability of postsynaptic action potential generation but decreased temporal precision during in vivo-like activity.
(A1) AP firing was recorded in response to in vivo-like stimulation patterns derived from responses to sinusoidal amplitude-modulated sounds at different modulation frequencies. Raster plot shows three representative stimulation patterns. (A2) Representative traces of loose-patch recordings during afferent fiber stimulation with in vivo-like activity for Rac1+/+ (black) and Rac1−/− (orange). Triangles indicate the stimulus time points. Stimulus artifacts were blanked for clarity. (B1) Fraction of successful AP generation was not different between Rac1+/+ and Rac1−/− independent of modulation frequency (B2) AP jitter defined as the standard deviation of AP latencies was not changed in Rac1−/− neither for the complete stimulus nor as a function of amplitude modulation frequency. (C1) AP jitter and AP delay were largely independent of preceding inter-spike interval. (C2) AP jitter and AP delay as a function of preceding activity level. The preceding activity was calculated as the sum of all preceding APs (green, S-1, S-2, …, S–n) weighted by their temporal distance to the AP under observation (purple, W-1, W-2, …, W–n). The weighting was implemented as an exponentially decaying kernel (blue shaded area). Note the increased AP jitter and AP delay in Rac1−/− at higher activity levels. All data shown in the figure and the detailed results of statistical tests are part of the supplementary file.
-
Figure 7—source data 1
Excel file containing the data shown in Figure 7 and the results of statistical analysis.
- https://cdn.elifesciences.org/articles/81505/elife-81505-fig7-data1-v2.xlsx
Figure 8
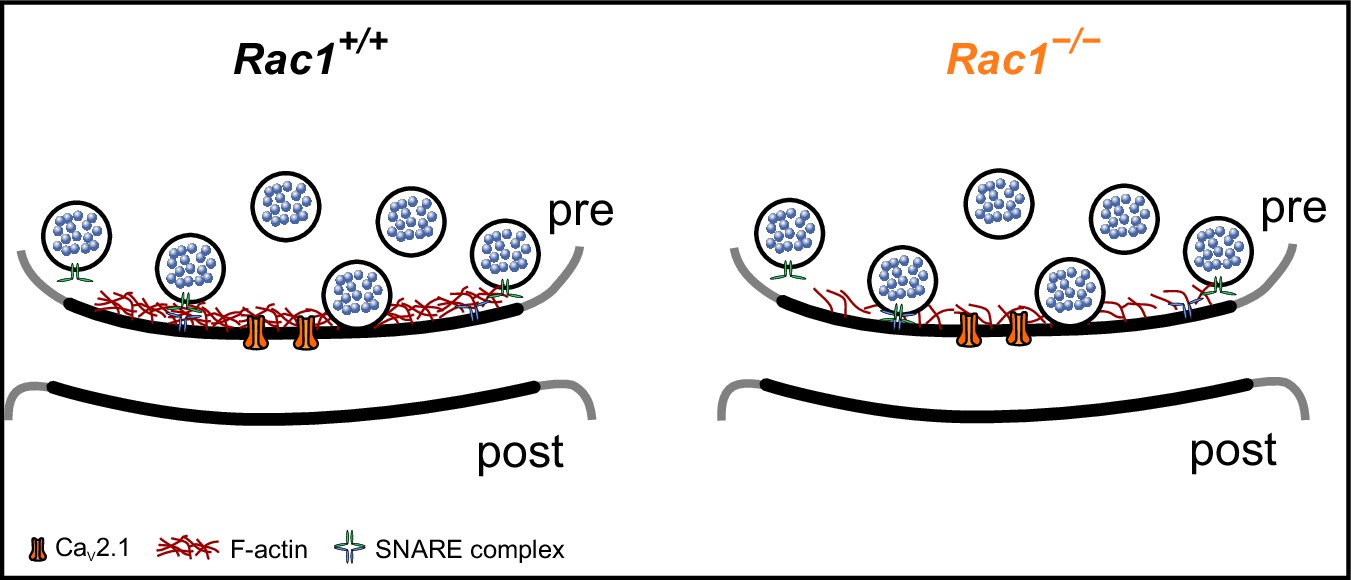
Proposed model of Rac1’s presynaptic role in regulating synaptic transmission.
In the proposed model, loss of Rac1 results in changes in F-actin at the active zone, thereby reducing the physical barrier between SVs and the plasma membrane which increases synaptic strength through faster SV priming and potentially higher Pr.
Author response image 1
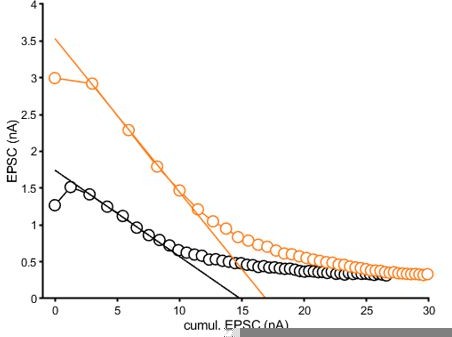
Graphical representation of the EQ fit to the average data reported in Figure 2B2.
The fitting area was determined by the steepest slope.
Tables
Key resources table
| Reagent type (species) or resource | Designation | Source or reference | Identifiers | Additional information |
|---|---|---|---|---|
| Strain, strain background (Mus musculus) | Rac1tm1Djk/J (Rac1flox/flox) | Jackson Laboratory; Glogauer et al., 2003 | RRID:IMSR_JAX:005550 | either sex |
| Antibody | Anti-GFP (rabbit polyclonal) | Abcam | Cat# ab6556 RRID:AB_305564 | EM (0.1 µg/mL) |
| Antibody | 6 nm colloidal Gold-AffiniPure anti-rabbit IgG (donkey polyclonal) | Jackson ImmunoResearch | Cat# 711-195-152 RRID:AB_2340609 | EM (1:100) |
| Sequence-based reagent | primer: 5’-TCC AAT CTG TGC TGC CCA TC-3' | Glogauer et al., 2003 | ||
| Sequence-based reagent | primer: 5’-GAT GCT TCT AGG GGT GAG CC-3' | Glogauer et al., 2003 | ||
| Recombinant DNA reagent | HdAd 28E4 hsyn iCre EGFP (viral vector) | Samuel M. Young, Jr., University of Iowa | ||
| Recombinant DNA reagent | HdAd 28E4 hsyn iCre mEGFP (viral vector) | Samuel M. Young, Jr., University of Iowa | ||
| Recombinant DNA reagent | HdAd 28E4 hsyn mEGFP (viral vector) | Samuel M. Young, Jr., University of Iowa | ||
| Chemical compound, drug | Kynurenic acid | Tocris Bioscience | Cat# 0223 | |
| Chemical compound, drug | Lidocaine N-ethyl bromide (QX-314) | Sigma-Aldrich | Cat# L5783 | |
| Chemical compound, drug | D-AP5 | Tocris Bioscience | Cat# 0106 | |
| Chemical compound, drug | (-)-bicuculline methochloride | Tocris Bioscience | Cat# 0131 | |
| Chemical compound, drug | Strychnine hydrochloride | Tocris Bioscience | Cat# 2785 | |
| Chemical compound, drug | Tetraethylammonium chloride | Sigma-Aldrich | Cat# T-2265 | |
| Chemical compound, drug | Tetrodotoxin | Alomone labs | Cat# T-550 | |
| Chemical compound, drug | Cadmium chloride hemi(pentahydrate) | Sigma-Aldrich | Cat# C3141 | |
| Software, algorithm | Matlab | The Mathworks | RRID:SCR_001622; v9.10 | |
| Software, algorithm | Patchmaster | HEKA; Harvard Bioscience | RRID:SCR_000034; v2x90.2 | |
| Software, algorithm | Igor Pro | Wavemetrics | RRID:SCR_000325; v6.37 | |
| Software, algorithm | Fiji | https://fiji.sc/ | RRID:SCR_002285 | |
| Software, algorithm | Patcher’s Power Tools | Max Planck Institute for Biophysical Chemistry; Gottingen; Germany | RRID:SCR_001950; v2.19 | |
| Software, algorithm | StereoDrive | Neurostar | N/A; v3.1.5 | |
| Software, algorithm | Live Acquisition | Thermo Fisher Scientific | N/A; v2.1.0.10 | |
| Software, algorithm | Neuromatic | Rothman and Silver, 2018 | RRID:SCR_004186 |
Additional files
Download links
A two-part list of links to download the article, or parts of the article, in various formats.
Downloads (link to download the article as PDF)
Open citations (links to open the citations from this article in various online reference manager services)
Cite this article (links to download the citations from this article in formats compatible with various reference manager tools)
Presynaptic Rac1 controls synaptic strength through the regulation of synaptic vesicle priming
eLife 11:e81505.
https://doi.org/10.7554/eLife.81505


