Spatiotemporal properties of glutamate input support direction selectivity in the dendrites of retinal starburst amacrine cells
- Department of Biology, University of Victoria, Canada
- Danish Research Institute of Translational Neuroscience, Nordic-EMBL Partnership for Molecular Medicine, Department of Biomedicine, Aarhus University, Denmark
Figures
Figure 1
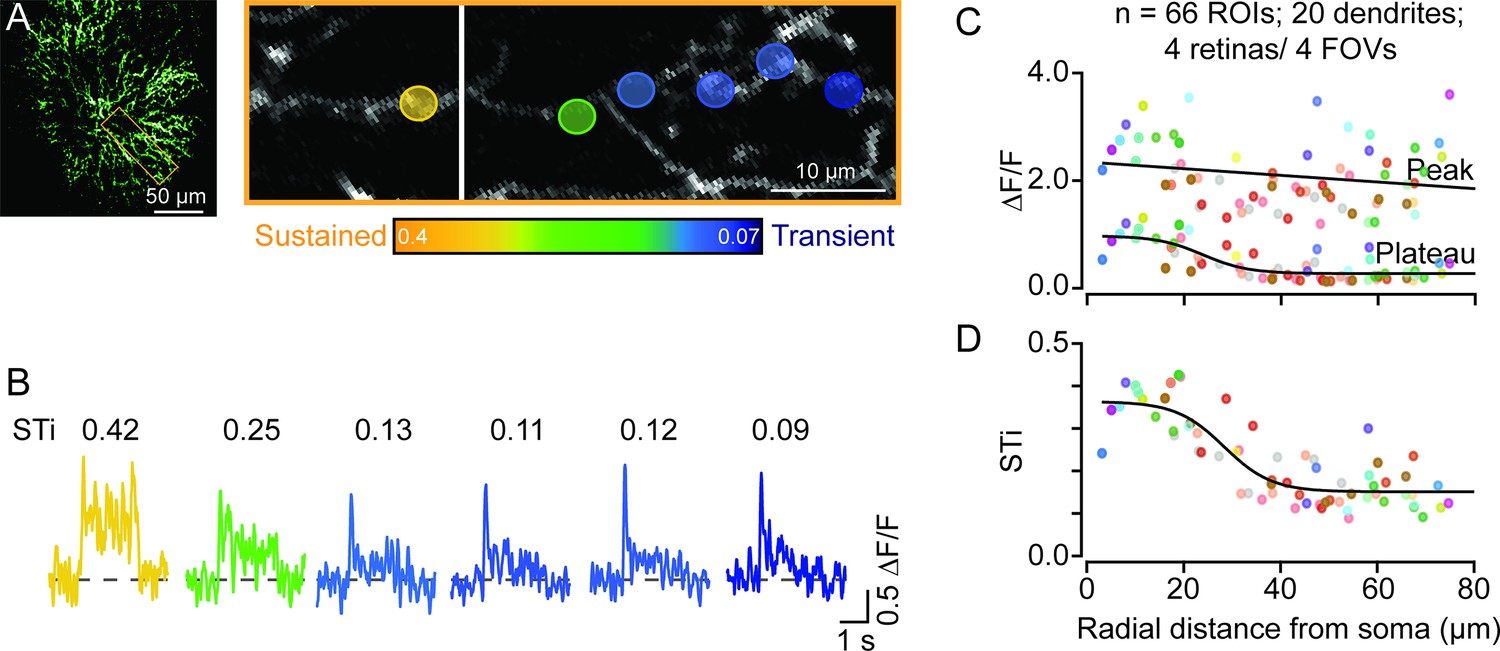
Temporal diversity of inputs across single starburst dendrites revealed by sparse iGluSnFR imaging.
(A) Two-photon z-stack image (left) of a single ON starburst amacrine cell expressing iGluSnFR. Changes in iGluSnFR fluorescence evoked by a 200-μm spot were measured across the single starburst dendrite (yellow box; left). Proximal and distal responses were captured in separate focal planes, and the resulting images were stitched together (right; the vertical white line separates the two planes). (B) Examples of time-varying iGluSnFR signals (ΔF/F) (average; two trials) measured in small dendritic regions of interest (5×5 μm2 ROIs; shown in (A)). The responses and ROIs are color-coded according to their sustained/transient indices (STis; color scale bar shown in (A)). The STis (mean; two trials) are indicated above each trace. (C) The amplitudes of the peak and plateau iGluSnFR responses are plotted as a function of radial distance from the soma. Each point indicates the value obtained from an individual ROI averaged over two trials; ROIs on the same dendrite share the same color (n=66 ROIs from 20 dendrites/4 retinas/4 mice). (D) STis computed from (C) plotted as a function of radial distance from the soma. ROI, region of interest.
-
Figure 1—source data 1
Temporal diversity of inputs across single starburst dendrites revealed by sparse iGluSnFR imaging.
- https://cdn.elifesciences.org/articles/81533/elife-81533-fig1-data1-v2.xlsx
Figure 2
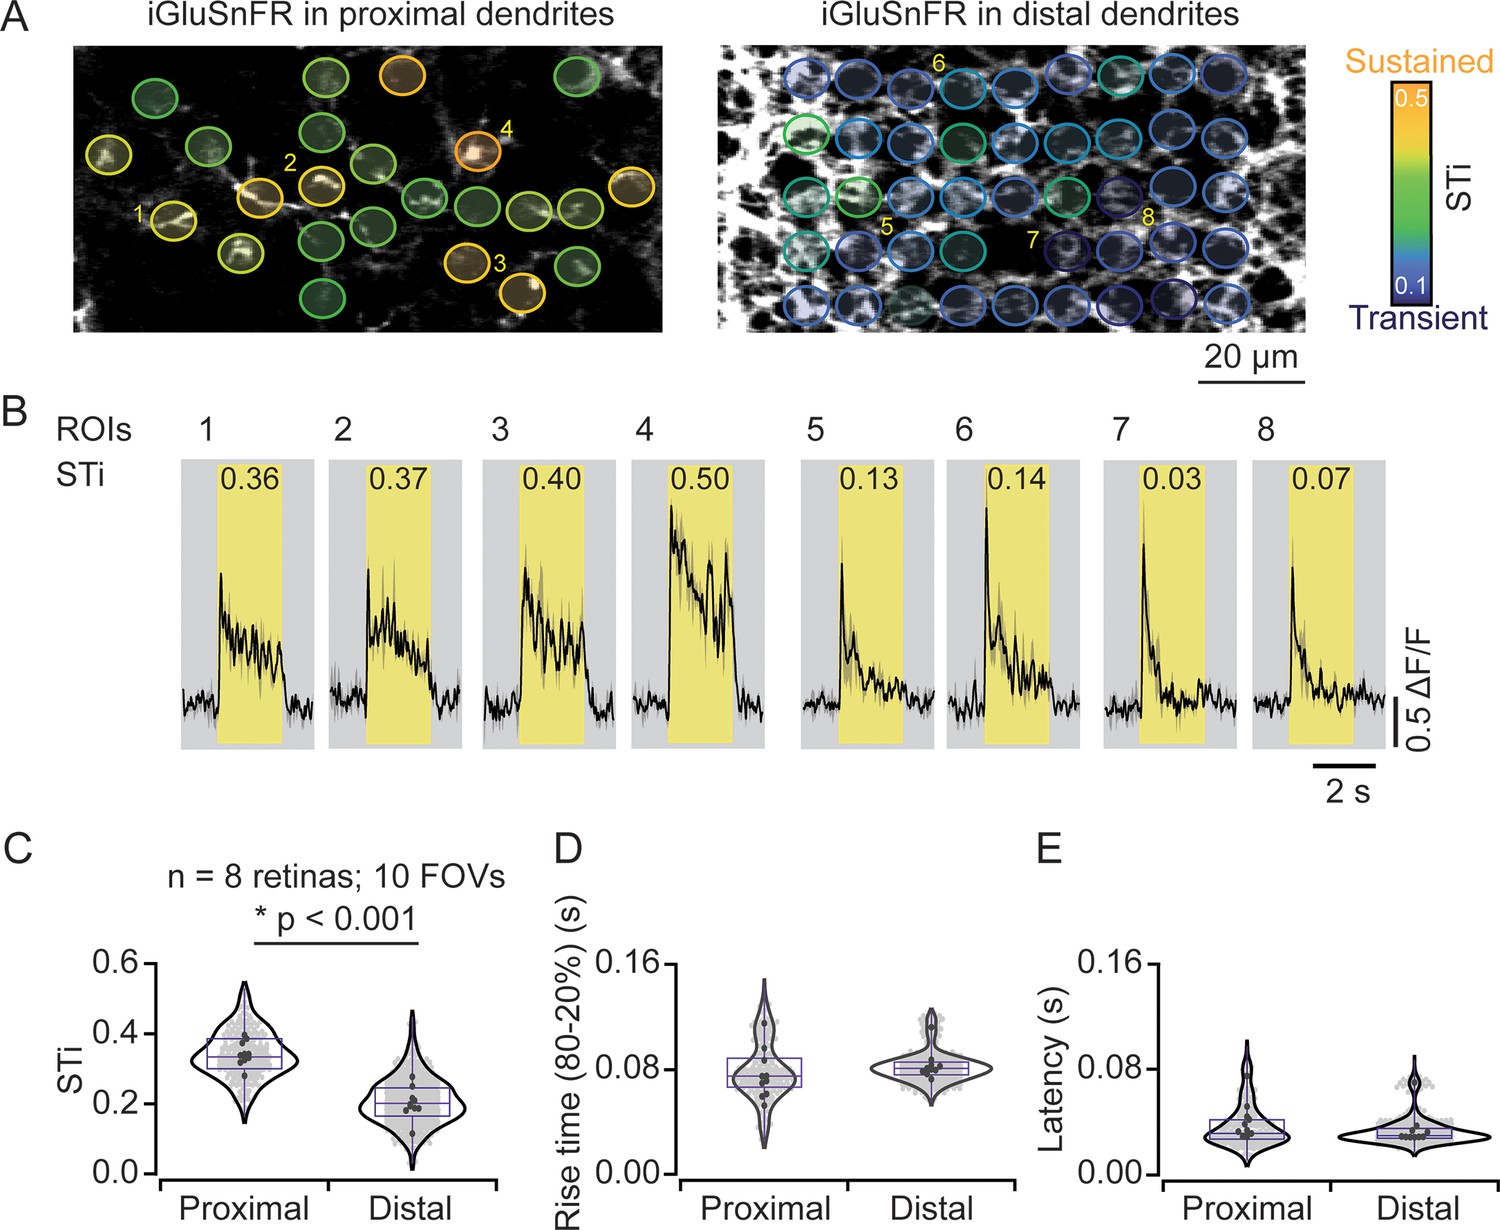
Measuring inputs kinetics in the starburst population.
(A) In the left scan field, proximal dendrites arising from the starburst soma expressing iGluSnFR can be visualized in relative isolation. Images that were taken ~5 μm deeper in the retina (right) reveal the dense ‘honeycomb’ structure formed by distal starburst dendrites. (B) Example iGluSnFR responses evoked by 200 μm static spot extracted for a few ROIs numbered in (A) with their STis indicated on the top. Yellow bands indicate stimulus duration. Black, mean responses; gray, ± s.e.m. of two trials. (C–E) Distribution of STis (C), 80–20% rise times (D) and latencies (E) in the proximal and distal field of views (FOVs) of the individual (gray) and average (black) ROIs from different recordings (n=10 FOVs, 8 retinas, *p<0.001; t-test). ROI, region of interest; STi, sustained/transient index.
-
Figure 2—source data 1
Measuring inputs kinetics in the starburst population.
- https://cdn.elifesciences.org/articles/81533/elife-81533-fig2-data1-v2.xlsx
Figure 3 with 2 supplements
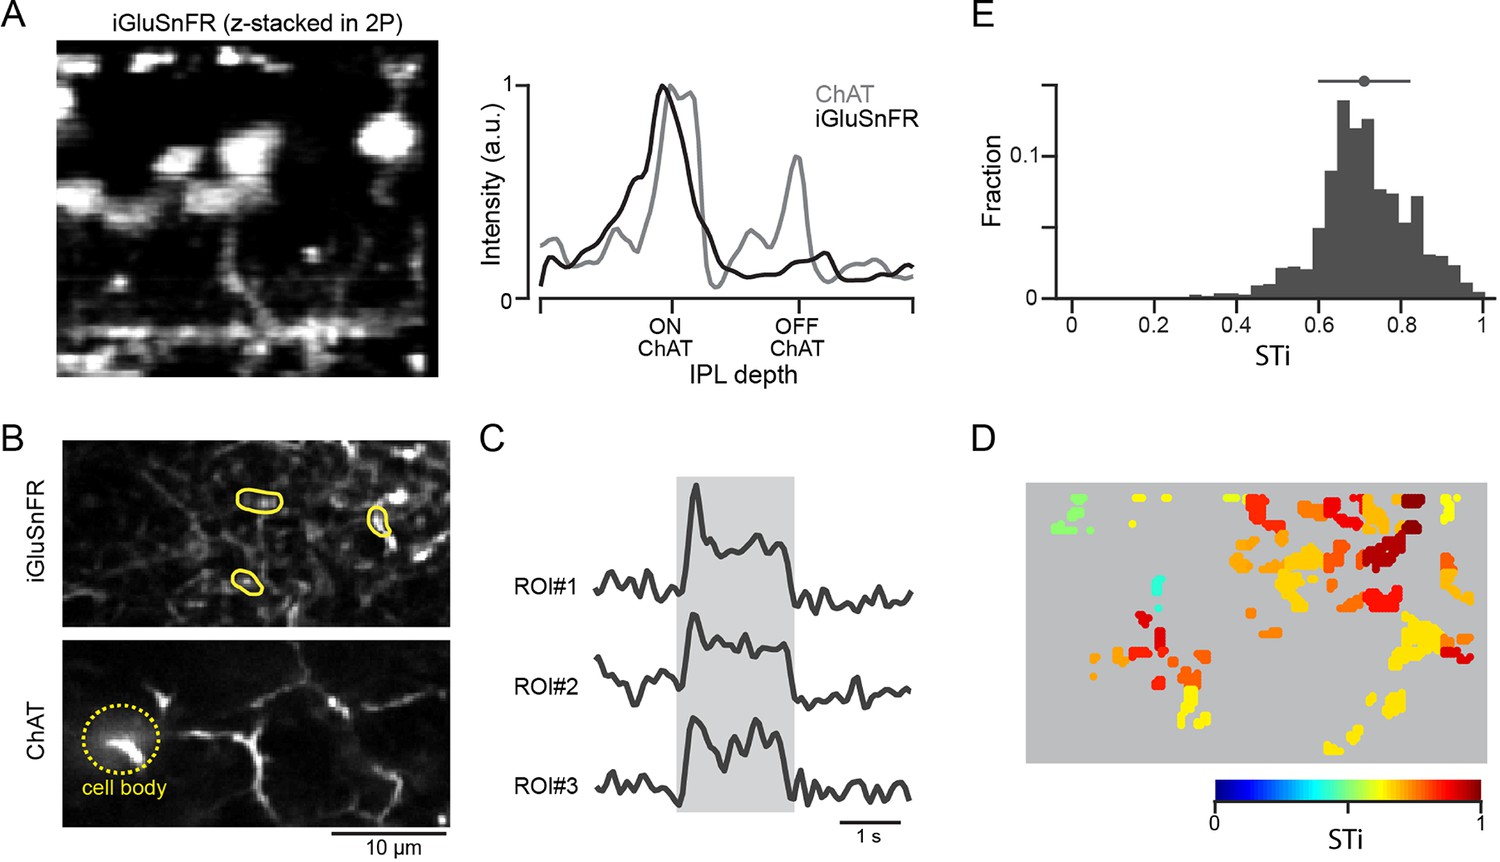
Expressing iGluSnFR in BC7 axon terminals reveals their sustained output.
(A) Cross-section of an image stack showing iGluSnFR labelled BC7 (left). The intensity profiles of the BC terminals labeled with iGluSnFR (gray), and starburst dendrites labeled with tdTomato (black) across the inner plexiform layer (IPL) show that BC terminals co-stratify with dendrites of ON starbursts (right). (B) iGluSnFR expression in BC7 terminals (top) imaged at the same depth as the proximal ON starburst dendrites labeled with tdTomato (bottom). (C) Light-evoked glutamate signals (right) extracted from three ROIs shown in (B) (left). The gray band indicates the stimulus duration. (D) Heat maps of the STis for all identified ROIs. (E) A histogram of STis for the light-evoked responses for all ROIs. Top, mean (circle), and s.d. (horizontal bar) of the STis. BC, bipolar cell; ROI, region of interest; STi, sustained/transient index.
Figure 3—figure supplement 1
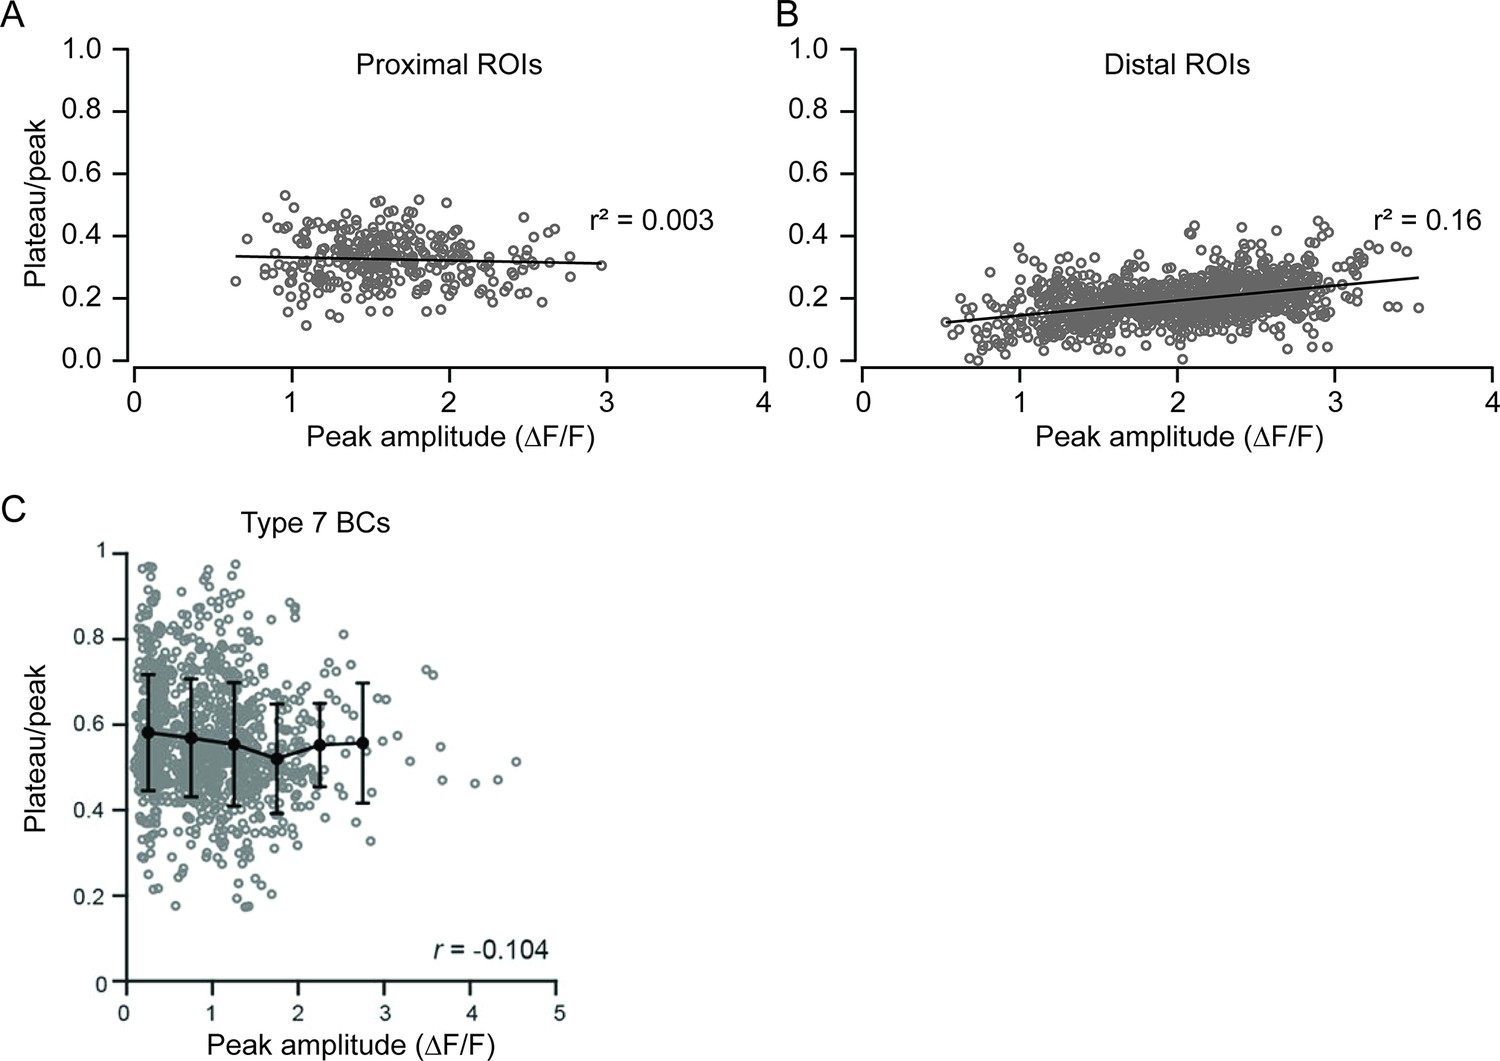
Response kinetics are not strongly associated with their peak amplitudes.
(A) Plateau/peak (STi) versus peak amplitude (ΔF/F) for individual ROIs (gray circles, average from two trials) extracted from both proximal and distal field of views (FOVs) (n=313 proximal; 994 distal ROIs). (B) Same as (A) but for type 7 BCs. BC, bipolar cell; ROI, region of interest.
-
Figure 3—figure supplement 1—source data 1
Response kinetics are not strongly associated with their peak amplitudes.
- https://cdn.elifesciences.org/articles/81533/elife-81533-fig3-figsupp1-data1-v2.xlsx
Figure 3—figure supplement 2

Temporal properties of proximal and distal input revealed by noise analysis.
(A) Average waveform of iGluSnFR responses to Gaussian white noise measured in the proximal (orange) or distal (blue) dendritic regions of starbursts. Shading indicates ± s.e.m. (B) Event-triggered average stimulus waveform, which represents the BCs’ preferred stimulus, is shown for proximal and distal regions. Shading indicates ± s.e.m. (C) The intensity profile of the 20 Hz Gaussian white noise stimulus. (D) The iGluSnFR response to the stimulus in (C). (E) Model iGluSnFR response obtained by convolving stimulus with linear filter shown in (B). (F, G) Distributions of biphasic peak (F) and area (G) index for different ROIs in the proximal and distal regions (n=120 proximal; 218 distal ROIs). BC, bipolar cell; ROI, region of interest.
-
Figure 3—figure supplement 2—source data 1
Bipahsic peak and area indices.
- https://cdn.elifesciences.org/articles/81533/elife-81533-fig3-figsupp2-data1-v2.xlsx
Figure 4
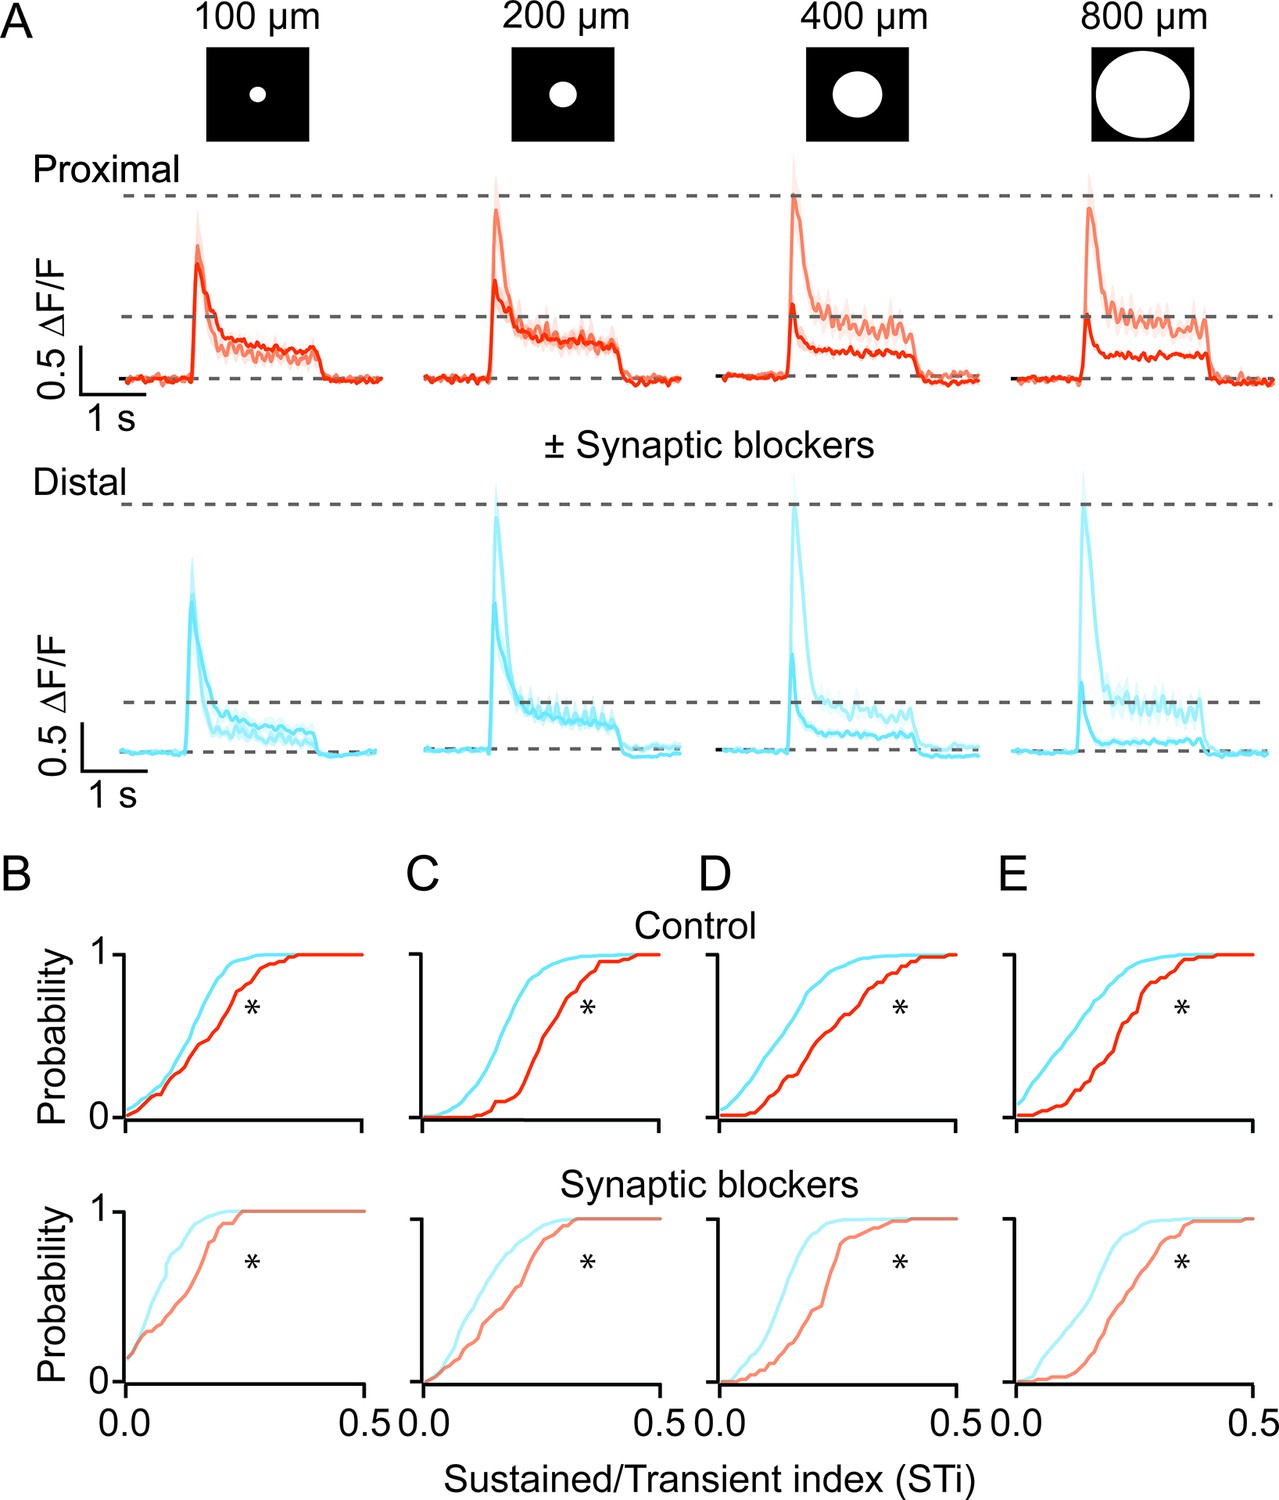
Kinetic differences in iGluSnFR signals are apparent across a range of stimulus sizes and persist in the presence of inhibitory receptor blockers.
(A) The average iGluSnFR signals were evoked by spots of different diameters (100–800 μm). Responses were averaged across five proximal (orange) or distal (blue) FOVs. Responses measured under control (dark traces) conditions and in the presence of synaptic blockers (SR, TPMPA, and CNQX; light traces) are overlaid. Shading indicates ± s.e.m. (B–E) Cumulative distributions of STis for ROIs in the proximal and distal FOVs under control and blocker conditions for different stimulus sizes. (n=5 FOVs, 4 retinas, *p<0.001; Kolmogorov-Smirnov test). FOV, field of view; ROI, region of interest; STi, sustained/transient index.
-
Figure 4—source data 1
Kinetic differences in iGluSnFR signals are apparent across a range of stimulus sizes and persist in the presence of inhibitory receptor blockers.
- https://cdn.elifesciences.org/articles/81533/elife-81533-fig4-data1-v2.xlsx
Figure 5
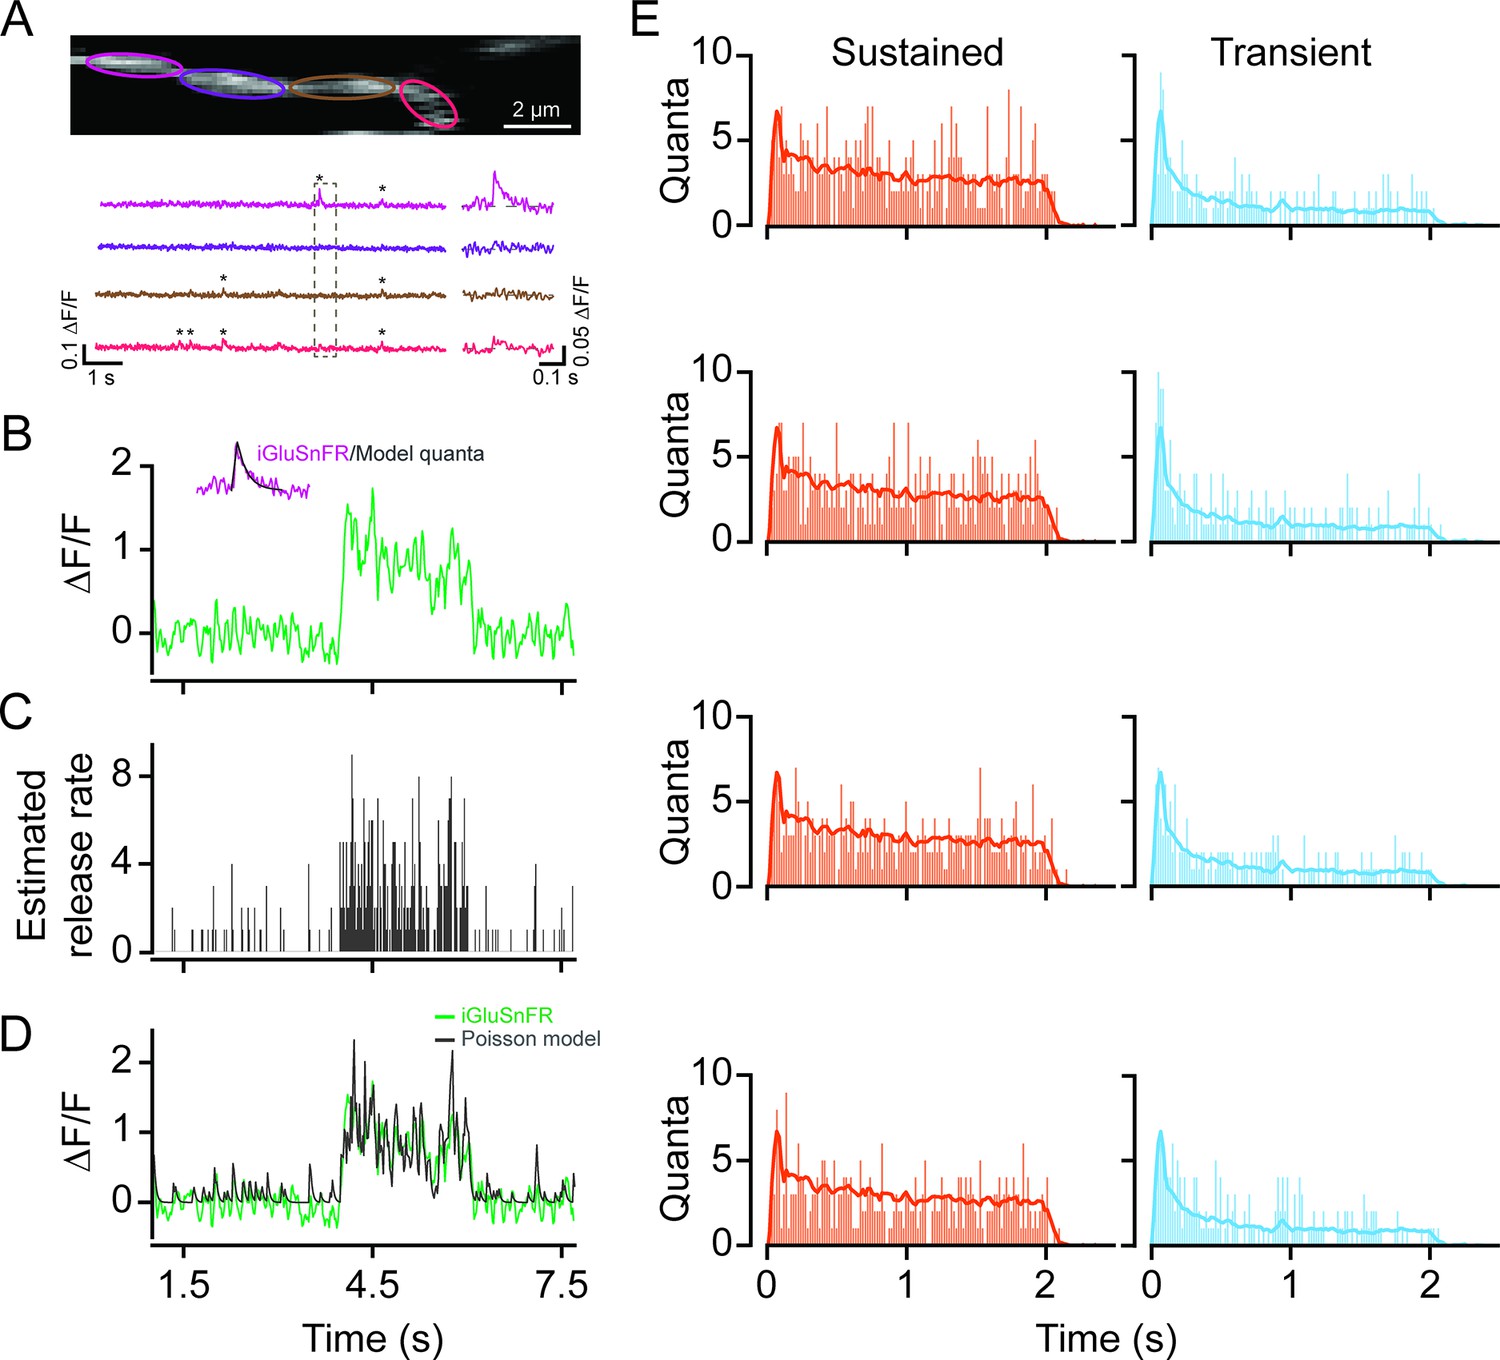
Time-varying vesicle release rates estimated using temporal deconvolution.
(A) Spontaneous iGluSnFR signals measured in neighboring ROIs across a small dendritic section (color-coded to match ROIs). (B) A typical light-evoked iGluSnFR signal measured from proximal dendrites; inset: iGluSnFR quantal event fitted with an alpha function. (C) A time-varying release rate was estimated by deconvolving the iGluSnFR signal with the quantal signal (shown in (B)). (D) Convolving the estimated release rate with a unitary event recapitulates the shape of the original iGluSnFR response. (E) Example vesicle release rates for sustained (orange) and transient (blue) iGluSnFR responses. The solid line indicates the average vesicle release rates for all ROIs. n=50 each, proximal and distal ROIs. ROI, region of interest.
Figure 6 with 1 supplement
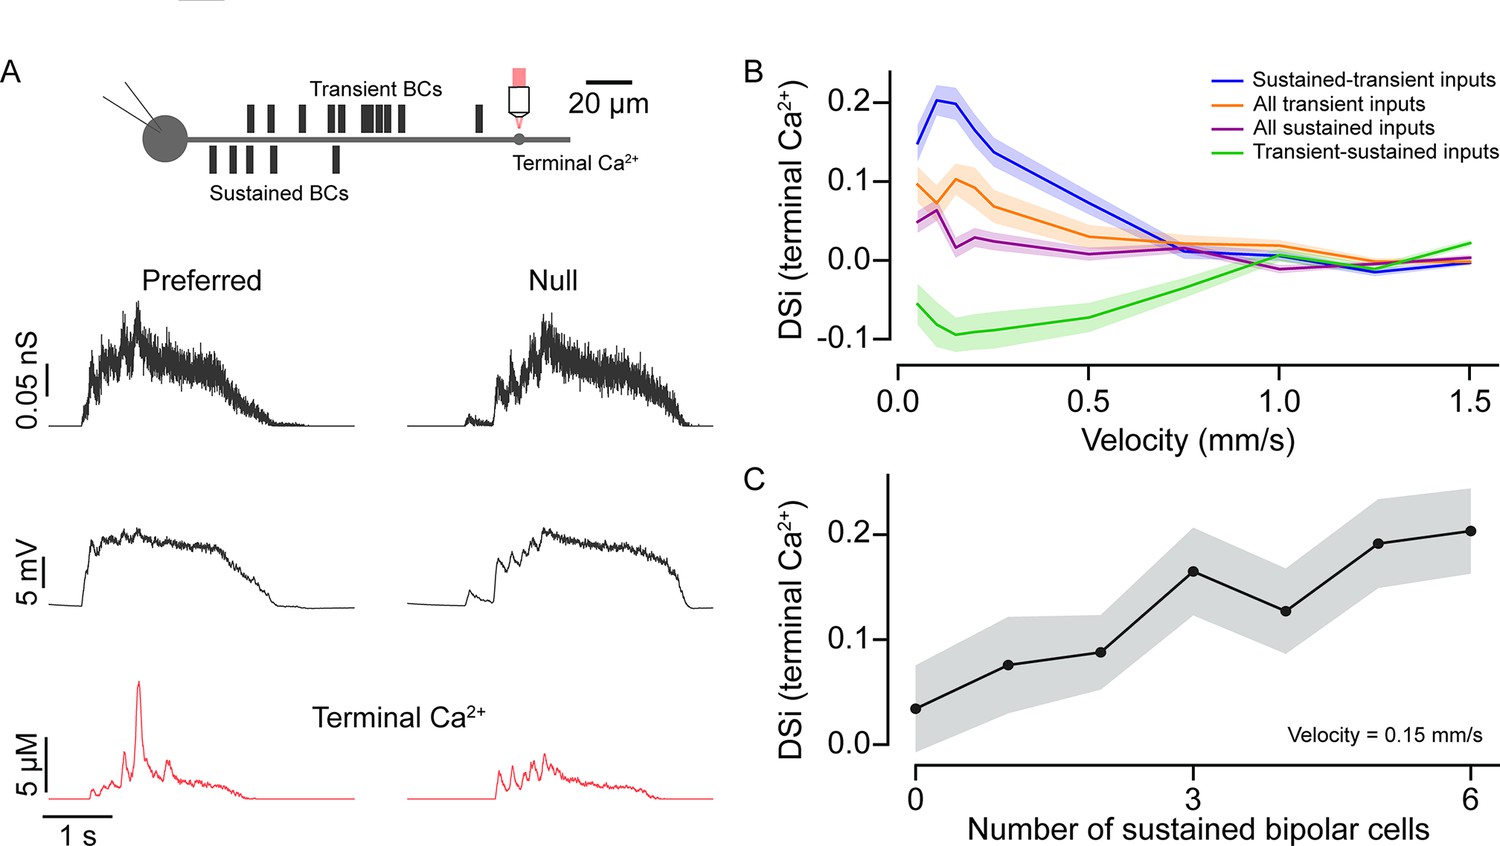
Input kinetics shape direction selectivity at low stimulus velocities.
(A) Schematic representation of locations of somatic voltage and terminal Ca2+ recordings from a model SAC under simulated conditions (top). Bipolar cell conductances, somatic voltage, and terminal Ca2+ responses (bottom) were measured in the preferred and null direction from the model SAC when simulated using moving bars. (B) Direction selectivity index (DSi) of peak Ca2+ (terminal) responses versus velocity for different BC input distributions—(i) sustained and transient inputs; when proximal (sustained) and distal (transient) inputs are distributed based on connectomics data (original model); (ii) transient-sustained inputs; when sustained and transient BC inputs are reversed at their locations; (iii) all transient inputs; when all proximal inputs are replaced by transient BCs; and (iv) all sustained inputs; when all distal inputs are replaced by sustained BCs. Shading indicates ± s.e.m. (C) DSi of peak Ca2+ (terminal) responses versus number of inputs from sustained BCs at a velocity of 0.15 mm/s. BC, bipolar cell.
-
Figure 6—source data 1
Model parameters.
- https://cdn.elifesciences.org/articles/81533/elife-81533-fig6-data1-v2.xlsx
Figure 6—figure supplement 1
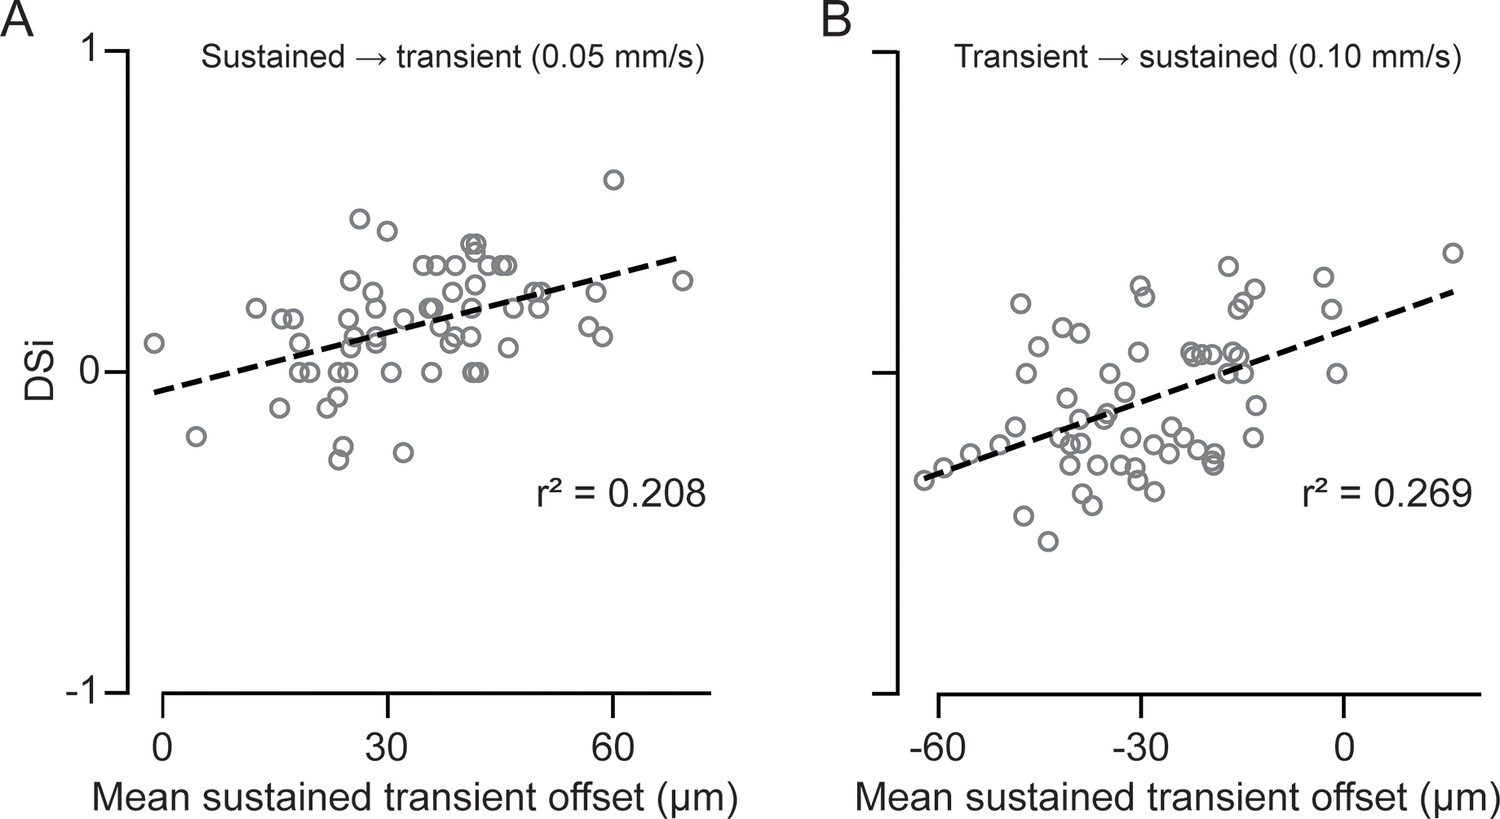
Relationship between the direction selectivity index and the magnitude of the spatial offset between bipolar cell (BC) inputs.
Direction selectivity index (DSi) of peak Ca2+ responses in terminal dendrites as a function of the spatial offset between sustained and transient BC inputs. The spatial offset was calculated by subtracting the mean somatic distance of the proximal population from that of the distal population. (A) Control conditions, where proximal BCs are sustained, and distal BCs are transient. (B) Reverse conditions, where proximal BCs are transient and distal BCs are sustained.
Additional files
Download links
A two-part list of links to download the article, or parts of the article, in various formats.
Downloads (link to download the article as PDF)
Open citations (links to open the citations from this article in various online reference manager services)
Cite this article (links to download the citations from this article in formats compatible with various reference manager tools)
Spatiotemporal properties of glutamate input support direction selectivity in the dendrites of retinal starburst amacrine cells
eLife 11:e81533.
https://doi.org/10.7554/eLife.81533


