LRG1 is an adipokine that promotes insulin sensitivity and suppresses inflammation
- Weill Cornell/Rockefeller/Sloan Kettering Tri-Institutional MD-PhD Program, United States
- Laboratory of Molecular Metabolism, Rockefeller University, United States
- Department of Immunobiology, Yale University, United States
- Bioinformatics Resouce Center, Rockefeller University, United States
- Proteomics Resource Center, Rockefeller University, United States
Figures
Figure 1 with 1 supplement
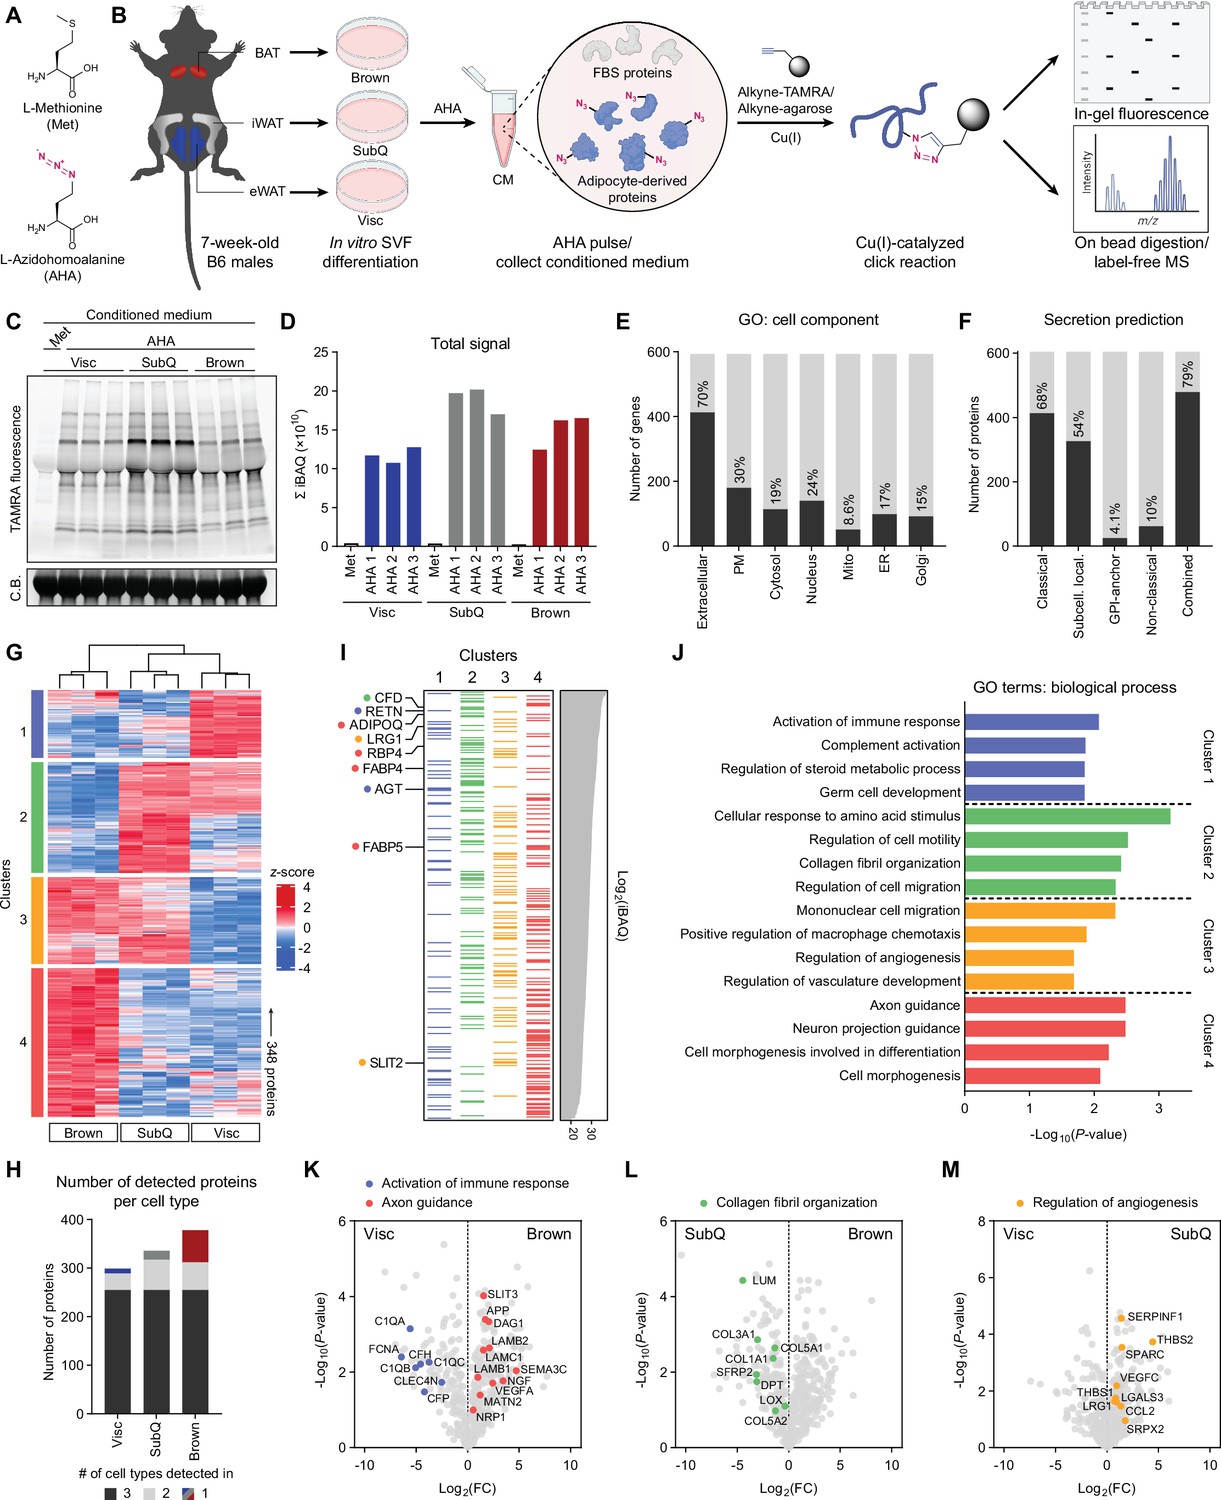
Characterization of primary adipocyte secretome using BONCAT.
(A) Chemical structures of L-methionine (Met) and L-azidohomoalanine (AHA). (B) Schematic diagram of MS-based secretome analysis from primary Visc, SubQ, and Brown adipocytes using BONCAT. (C) In-gel fluorescence analysis of TAMRA-conjugated CM proteins from Met-pulsed (lane 1) or AHA-pulsed (lanes 2–10) adipocytes. C.B., Coomassie Blue. (D) Sum of iBAQ intensities (Σ iBAQ) across all quantified proteins in each CM. (E) Number and proportion of genes annotated to GO cell component terms. Extracellular, extracellular region, space, or matrix; PM, plasma membrane; Mito, mitochondrion; ER, endoplasmic reticulum; Golgi, Golgi apparatus. (F) Number and proportion of proteins predicted to be secreted by prediction algorithms. (G) Heatmap of 348 differentially secreted proteins across cell types. (H) Number of proteins detected in at least two of three biological replicates per cell type, color-coded based on number of cell types a protein is detected in. (I) 348 proteins grouped in clusters from (G) and arranged in decreasing order of iBAQ intensities. Previously described adipokines are indicated. (J) Top 4 overrepresented GO biological process terms per cluster and their enrichment scores. (K–M) Pairwise comparisons of Log2(LFQ) intensities between Visc and Brown (K), SubQ and Brown (L), and Visc and SubQ (M) CM. Proteins and their annotated pathway terms from (J) are indicated.
-
Figure 1—source data 1
Labeled uncropped gel images in Figure 1.
- https://cdn.elifesciences.org/articles/81559/elife-81559-fig1-data1-v2.pdf
-
Figure 1—source data 2
Raw gel images in Figure 1.
- https://cdn.elifesciences.org/articles/81559/elife-81559-fig1-data2-v2.zip
Figure 1—figure supplement 1
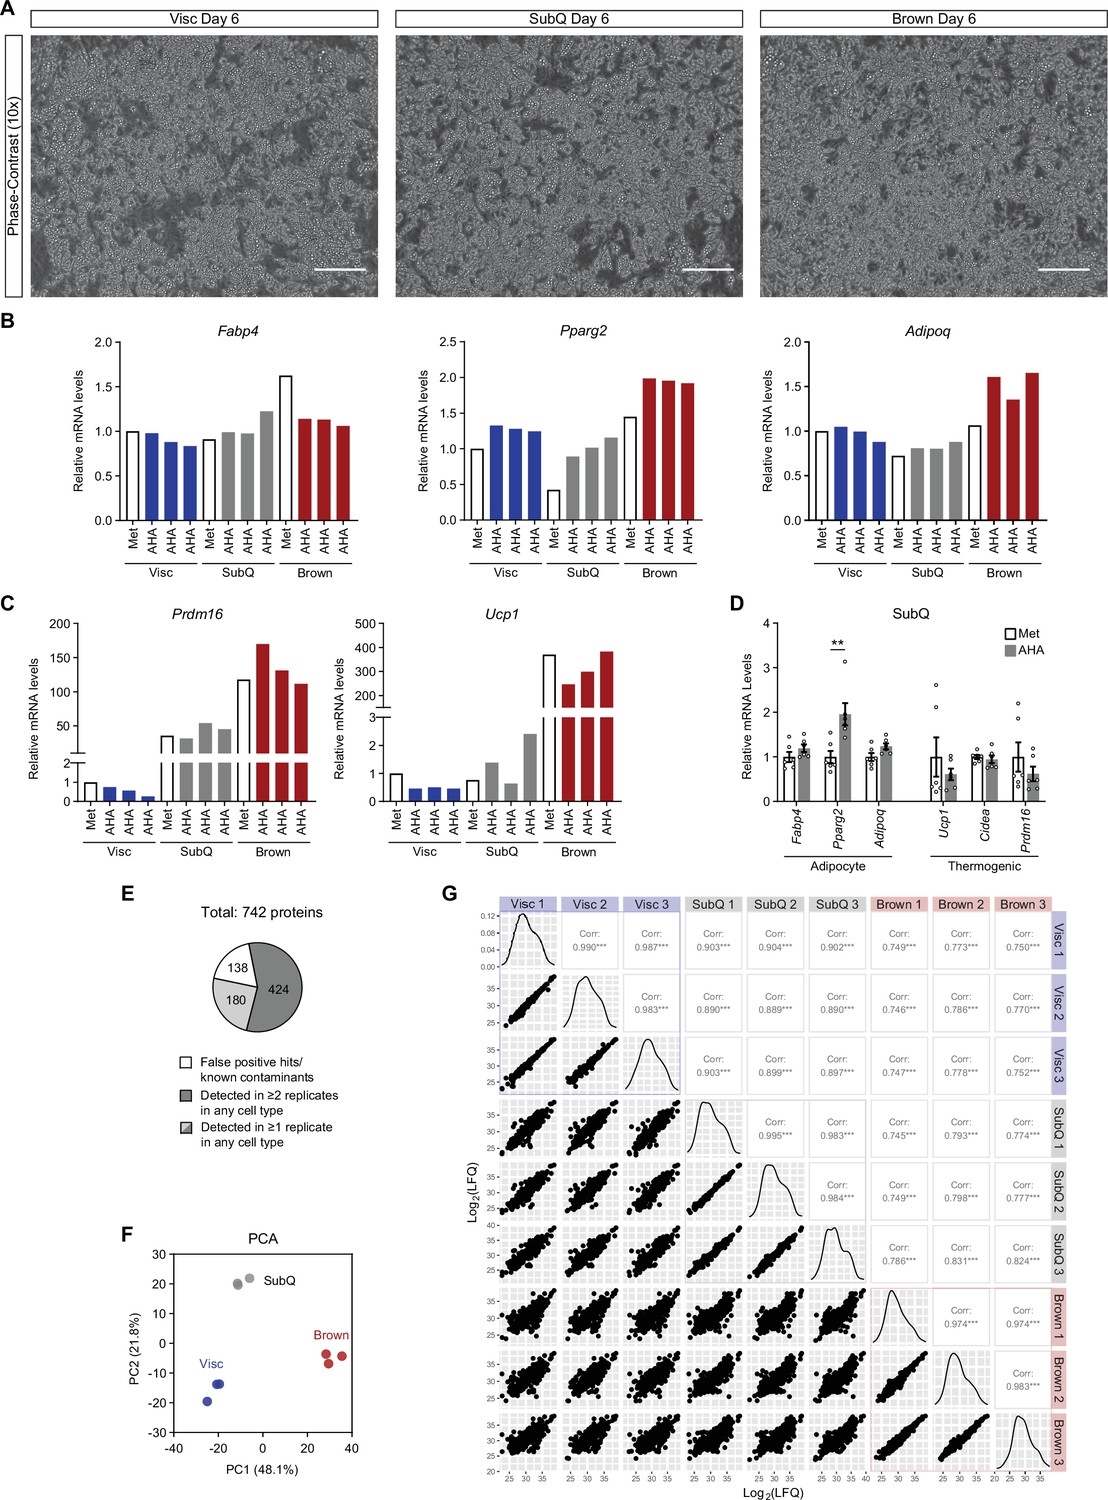
Validation of primary adipocyte differentiation and overview of MS results.
(A) Phase-contrast microscope images of mature Visc, SubQ, and Brown adipocytes on day 6 of differentiation. Scale bars indicate 500 μm. (B) Relative mRNA levels of mature adipocyte genes. (C) Relative mRNA levels of brown fat-enriched genes, Prdm16 and Ucp1. (D) Relative mRNA levels of mature adipocyte and thermogenic genes in primary SubQ adipocytes pulsed with Met of AHA for 24 hr. Data are presented as mean ± SEM. **p<0.01 from two-sided Welch’s t-test. n=6 technical replicates per group. (E) Distribution of detected proteins based on exclusion criteria and number of replicates a protein was detected in. (F) PCA of AHA-pulsed samples. (G) Pairwise comparisons of AHA-pulsed samples. Scatterplot Log2(LFQ) intensities are displayed on the bottom-left, distribution on the diagonal, and Pearson correlation coefficients on the top-right.
Figure 2
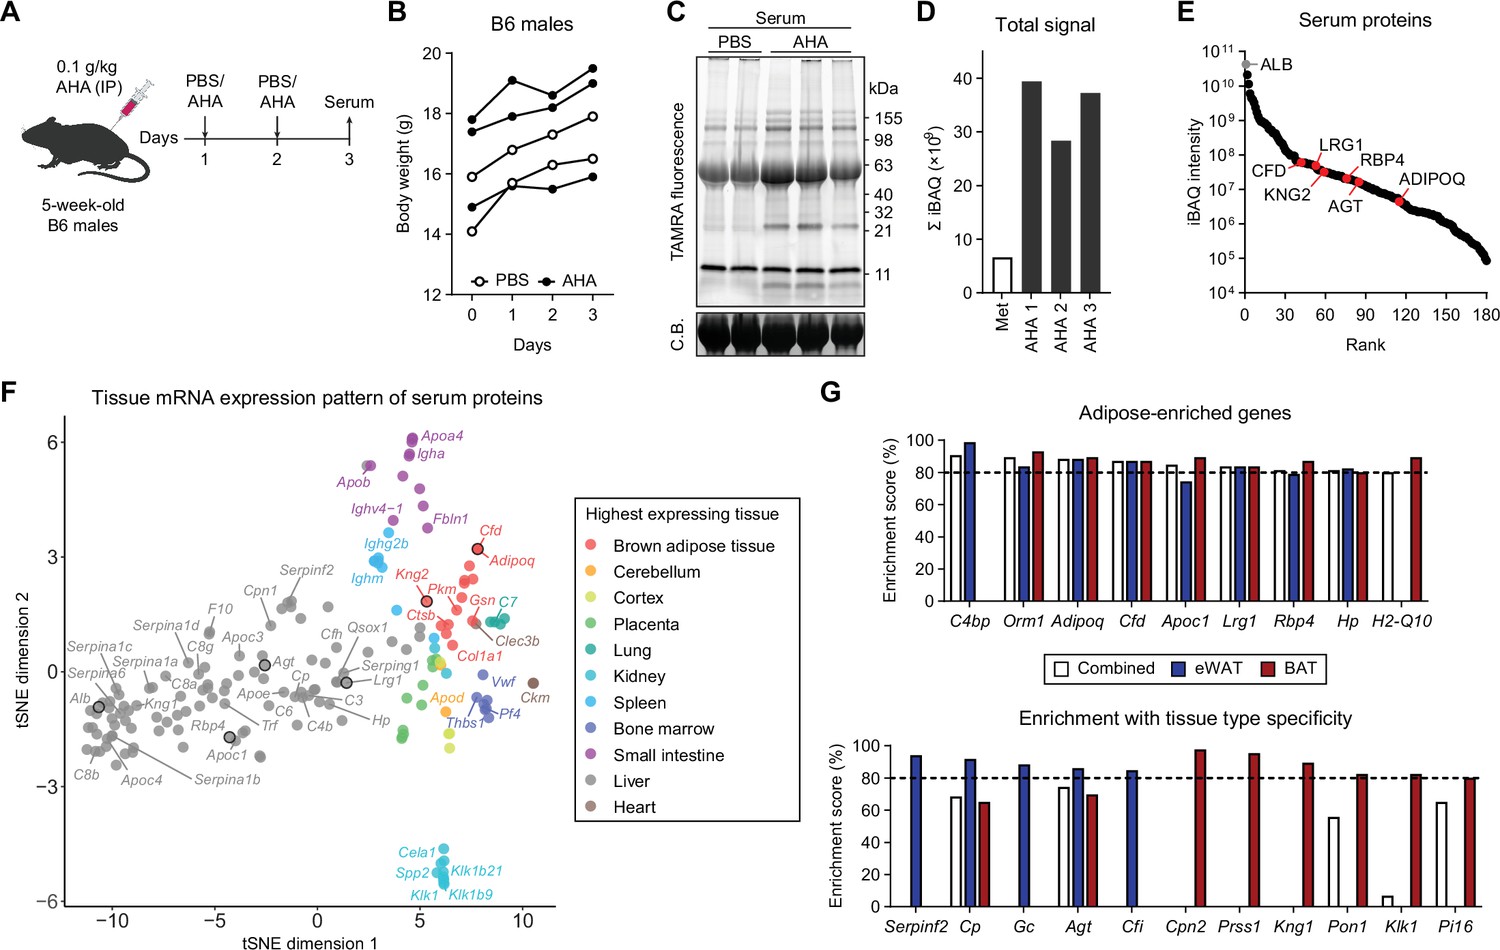
Profiling in vivo nascent serum proteome using BONCAT.
(A) Schematic of AHA IP injections. (B) Body weights of mice injected with PBS (n=2) or AHA (n=3). (C) In-gel fluorescence analysis of TAMRA-conjugated serum proteins from PBS-pulsed (lanes 1 and 2) or AHA-pulsed (lanes 3–5) mice. C.B., Coomassie Blue. (D) Sum of iBAQ intensities (Σ iBAQ) across all quantified proteins in each serum. (E) iBAQ intensities of detected serum samples arranged in decreasing order. (F) t-SNE clustering of detected serum protein genes based on tissue mRNA levels from the ENCODE/LICR dataset. (G) Adipose tissue-enriched serum protein genes and % enrichment scores calculated from Bio-GPS dataset.
-
Figure 2—source data 1
Labeled uncropped gel images in Figure 2.
- https://cdn.elifesciences.org/articles/81559/elife-81559-fig2-data1-v2.pdf
-
Figure 2—source data 2
Raw gel images in Figure 2.
- https://cdn.elifesciences.org/articles/81559/elife-81559-fig2-data2-v2.zip
Figure 3 with 2 supplements
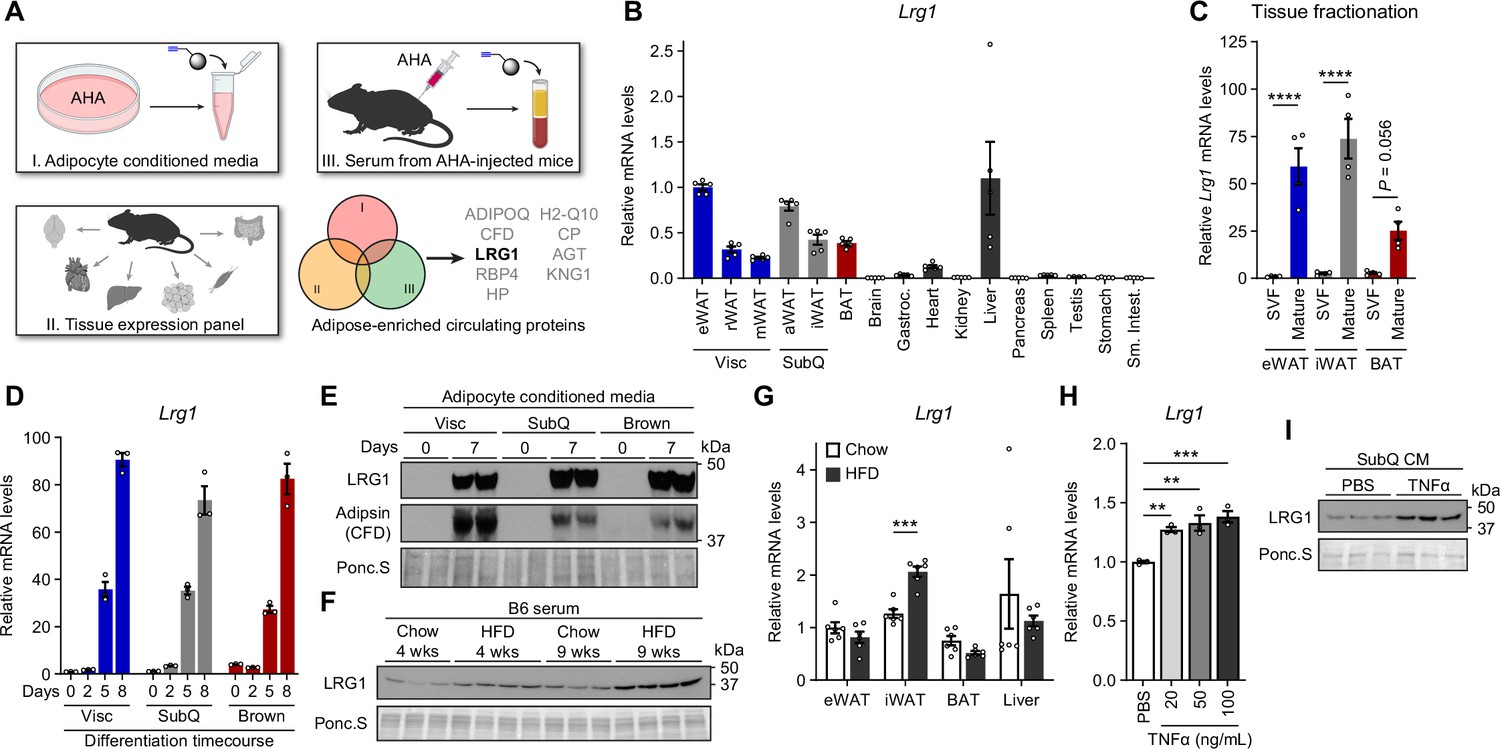
LRG1 is secreted by mature adipocytes and increased in obesity.
(A) Search strategy for identification of novel adipokines with a potential role in whole-body metabolism. (B) Relative Lrg1 mRNA levels across a panel of tissues from 8-week-old male B6 mice. Visc, visceral fat depots; SubQ, subcutaneous fat depots. n=4–5 biological replicates per group. (C) Relative Lrg1 mRNA levels of indicated adipose tissues fractionated into mature adipocytes and SVF. ****p<0.0001 from Šídák post hoc test following two-way ANOVA. n=4 biological replicates per group. (D) Relative Lrg1 mRNA levels during in vitro differentiation of primary SVF into adipocytes. n=3 technical replicates per group. (E) Western blot of LRG1 and CFD in CM before (day 0) and after (day 7) in vitro adipogenic differentiation, in technical replicates. (F) Serum western blot of LRG1 from male B6 mice on standard chow or HFD for indicated weeks. HFD was started at 6 weeks of age. Each lane represents a biological replicate. (G) Relative Lrg1 mRNA levels of indicated tissues from mice on standard chow or HFD for 15 weeks. HFD was started at 6 weeks of age. ***p<0.001 from two-sided Welch’s t-test. n=6 biological replicates per group. (H) Relative Lrg1 mRNA levels of primary SubQ adipocytes treated with recombinant TNFα and 850 nM insulin for 6 hr. **p<0.01, ***p<0.001 from Dunnett post hoc test following one-way ANOVA. n=3 technical replicates per group. (I) Western blot of LRG1 in CM of primary SubQ adipocytes treated with PBS or 100 ng/mL recombinant TNFα without insulin for 24 hr. Each lane represents a technical replicate. Data are presented as mean ± SEM.
-
Figure 3—source data 1
Uncropped gel and western blot images in Figure 3 and Figure 3—figure supplement 2.
- https://cdn.elifesciences.org/articles/81559/elife-81559-fig3-data1-v2.pdf
-
Figure 3—source data 2
Raw gel and western blot images in Figure 3 and Figure 3—figure supplement 2.
- https://cdn.elifesciences.org/articles/81559/elife-81559-fig3-data2-v2.zip
Figure 3—figure supplement 1
Validation of tissue fractionation and quantification of LRG1 in adipocyte CM.
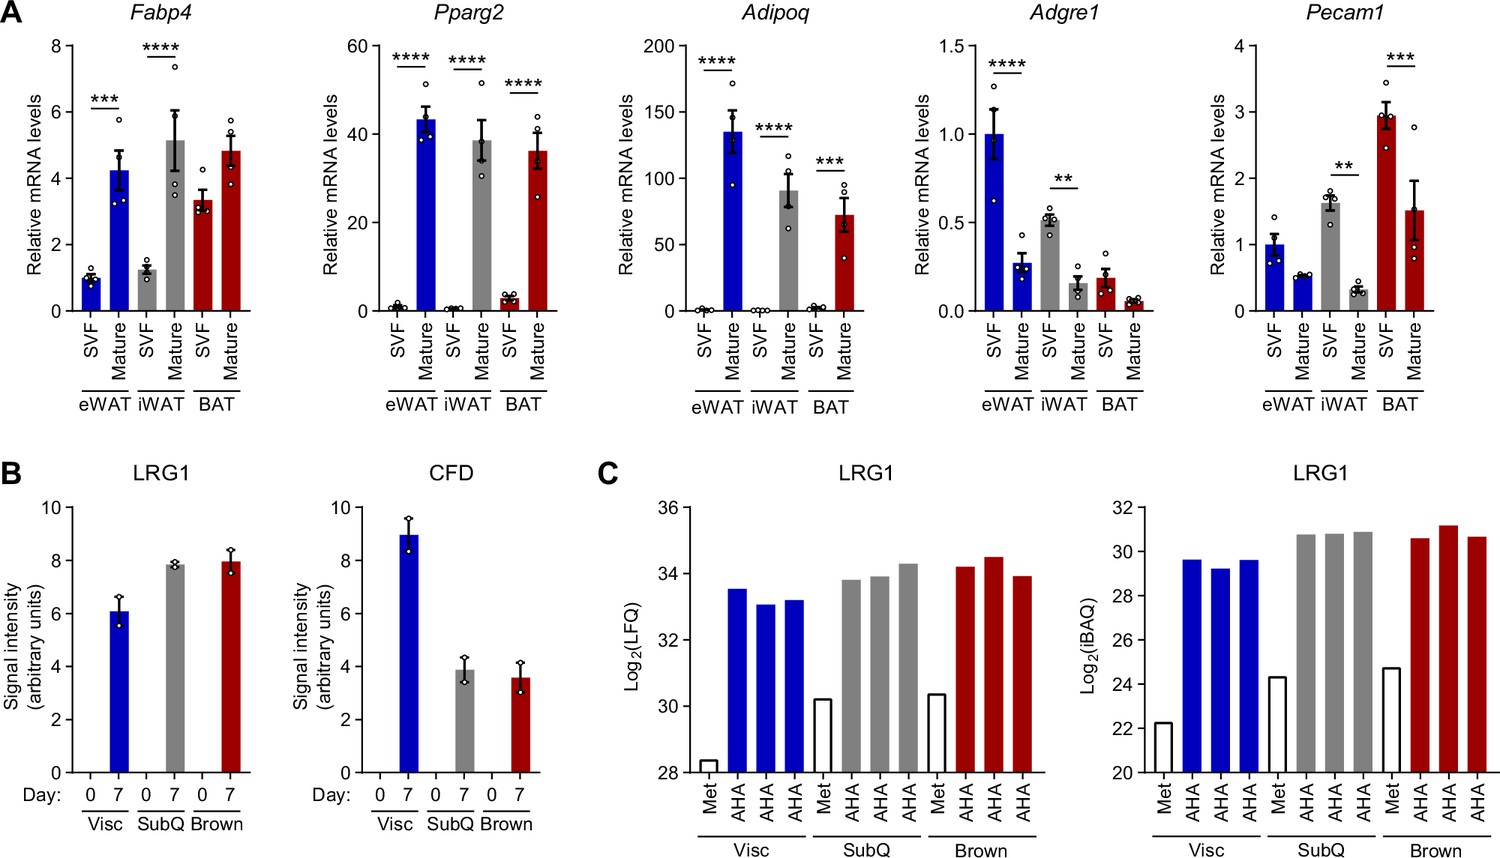
(A) Relative mRNA levels of mature adipocyte markers, Fabp4, Pparg2, and Adipoq and SVF markers, Adgre1 and Pecam1, in indicated tissues fractionated into mature adipocytes and SVF. Data are presented as mean ± SEM. ***p<0.001, ****p<0.0001 vs. SVF, from Šídák post hoc test following two-way ANOVA. n=4 biological replicates per group. (B) Quantification of intensities from Figure 3E. (C) LRG1 Log2(LFQ) and Log2(iBAQ) intensities detected by MS analysis of alkyne-agarose enriched CM.
Figure 3—figure supplement 2
LRG1 gain or loss of function does not affect adipogenesis.
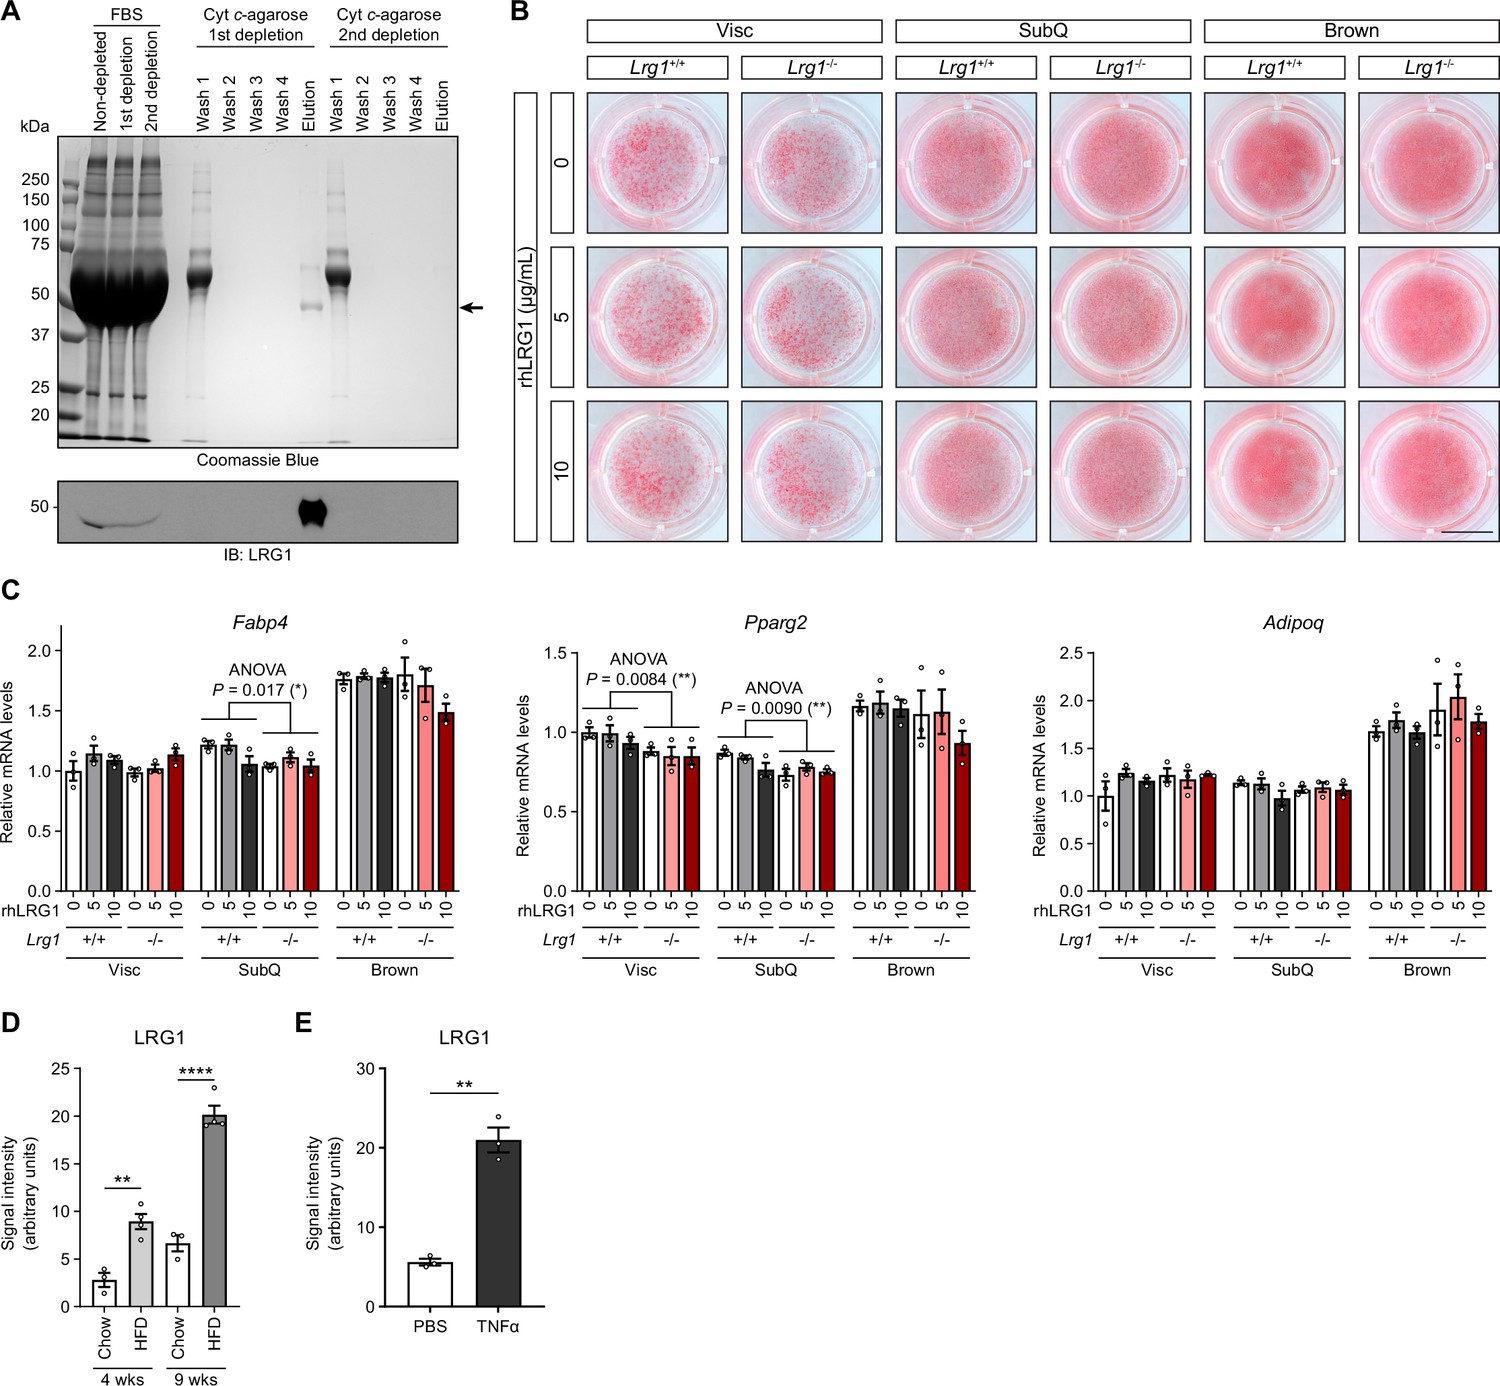
(A) Depletion of bovine LRG1 in FBS using Cyt c-conjugated agarose beads. Arrow indicates LRG1. (B) Oil red O stain of Lrg1+/+ or Lrg1-/- primary adipocytes treated with indicated concentrations of recombinant human LRG1 (rhLRG1). SVF was grown and differentiated into adipocytes in media containing 10% LRG1-depleted FBS. Scale bar indicates 1 cm. (C) Relative mRNA levels of mature adipocyte markers in adipocytes from (B). Data are presented as mean ± SEM. ANOVA P indicates genotype-factor p-values from two-way ANOVA. *p<0.05, **p<0.01. n=3 technical replicates per group. (D) Quantification of intensities from Figure 3F. **p<0.01, ****p<0.0001 from Šídák post hoc test following two-way ANOVA. n=3–4 biological replicates per group. (E) Quantification of intensities from Figure 3I. **p<0.01 from two-sided Welch’s t-test. n=3 technical replicates per group. Data are presented as mean ± SEM.
Figure 4 with 2 supplements
LRG1 overexpression improves glucose homeostasis in C57BL/6 J DIO mice.
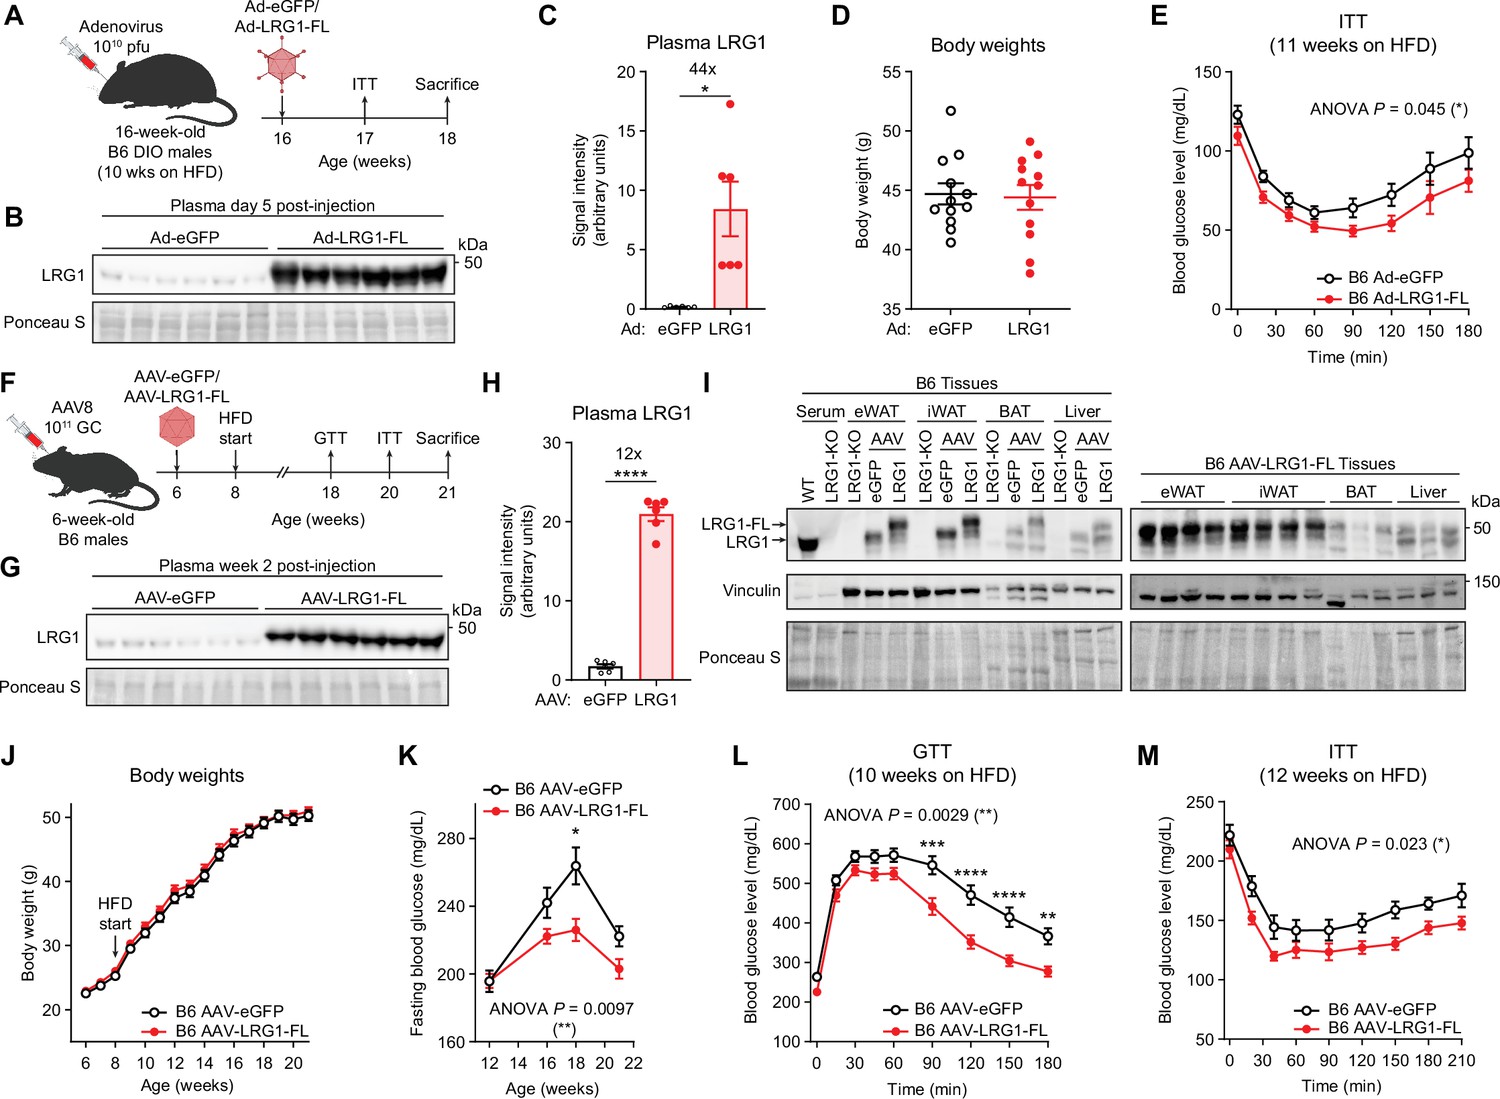
(A) Schematic of Ad vector-mediated acute LRG1 overexpression in B6 DIO male mice. (B) Plasma western blot of LRG1 5 days after Ad injection. (C) Quantification of (B). *p<0.05 from two-sided Welch’s t-test. n=6 per group. (D) Body weights of Ad-transduced B6 males at 17 weeks of age (11 weeks on HFD). (E) Insulin tolerance test (1.0 U/kg) in Ad-transduced B6 males at 17 weeks of age (11 weeks on HFD). Ad cohort consisted of n=12 per group. (F) Schematic of AAV8-mediated chronic LRG1 overexpression in B6 males. AAV injection was performed in 6-week-old B6 males. HFD was started at 8 weeks of age. (G) Plasma western blot of LRG1 2 weeks after AAV injection. (H) Quantification of (G). ****p<0.0001 from two-sided Welch’s t-test. n=6 biological replicates per group. (I) Left: western blot of LRG1 in serum and tissues from WT vs. LRG1-KO and B6 mice transduced with AAV-eGFP vs. AAV-LRG1-FL. Right: western blot of LRG1 in various tissues from AAV-LRG1-FL-transduced B6 mice. (J) Body weights of AAV-transduced B6 male mice during HFD challenge. (K) 6 hr fasting blood glucose levels of AAV-transduced B6 male mice during HFD feeding. (L) Intraperitoneal glucose tolerance test (1.5 g/kg) in AAV-transduced B6 males at 18 weeks of age (10 weeks on HFD). (M) Insulin tolerance test (1.5 U/kg) in AAV-transduced B6 males at 20 weeks of age (12 weeks on HFD). AAV cohort consisted of n=12 per group. Data are presented as mean ± SEM. In (E, K, L, M), ANOVA p indicates group factor p-values from repeated measures two-way ANOVA. Where indicated, p-values from Šídák post hoc tests are reported. *p<0.05, **p<0.01, ***p<0.001, ****p<0.0001.
-
Figure 4—source data 1
Labeled uncropped western blot images in Figure 4 and Figure 4—figure supplement 2.
- https://cdn.elifesciences.org/articles/81559/elife-81559-fig4-data1-v2.pdf
-
Figure 4—source data 2
Raw western blot images in Figure 4 and Figure 4—figure supplement 2.
- https://cdn.elifesciences.org/articles/81559/elife-81559-fig4-data2-v2.zip
Figure 4—figure supplement 1
Metabolic characterization of AAV-transduced B6 mice.
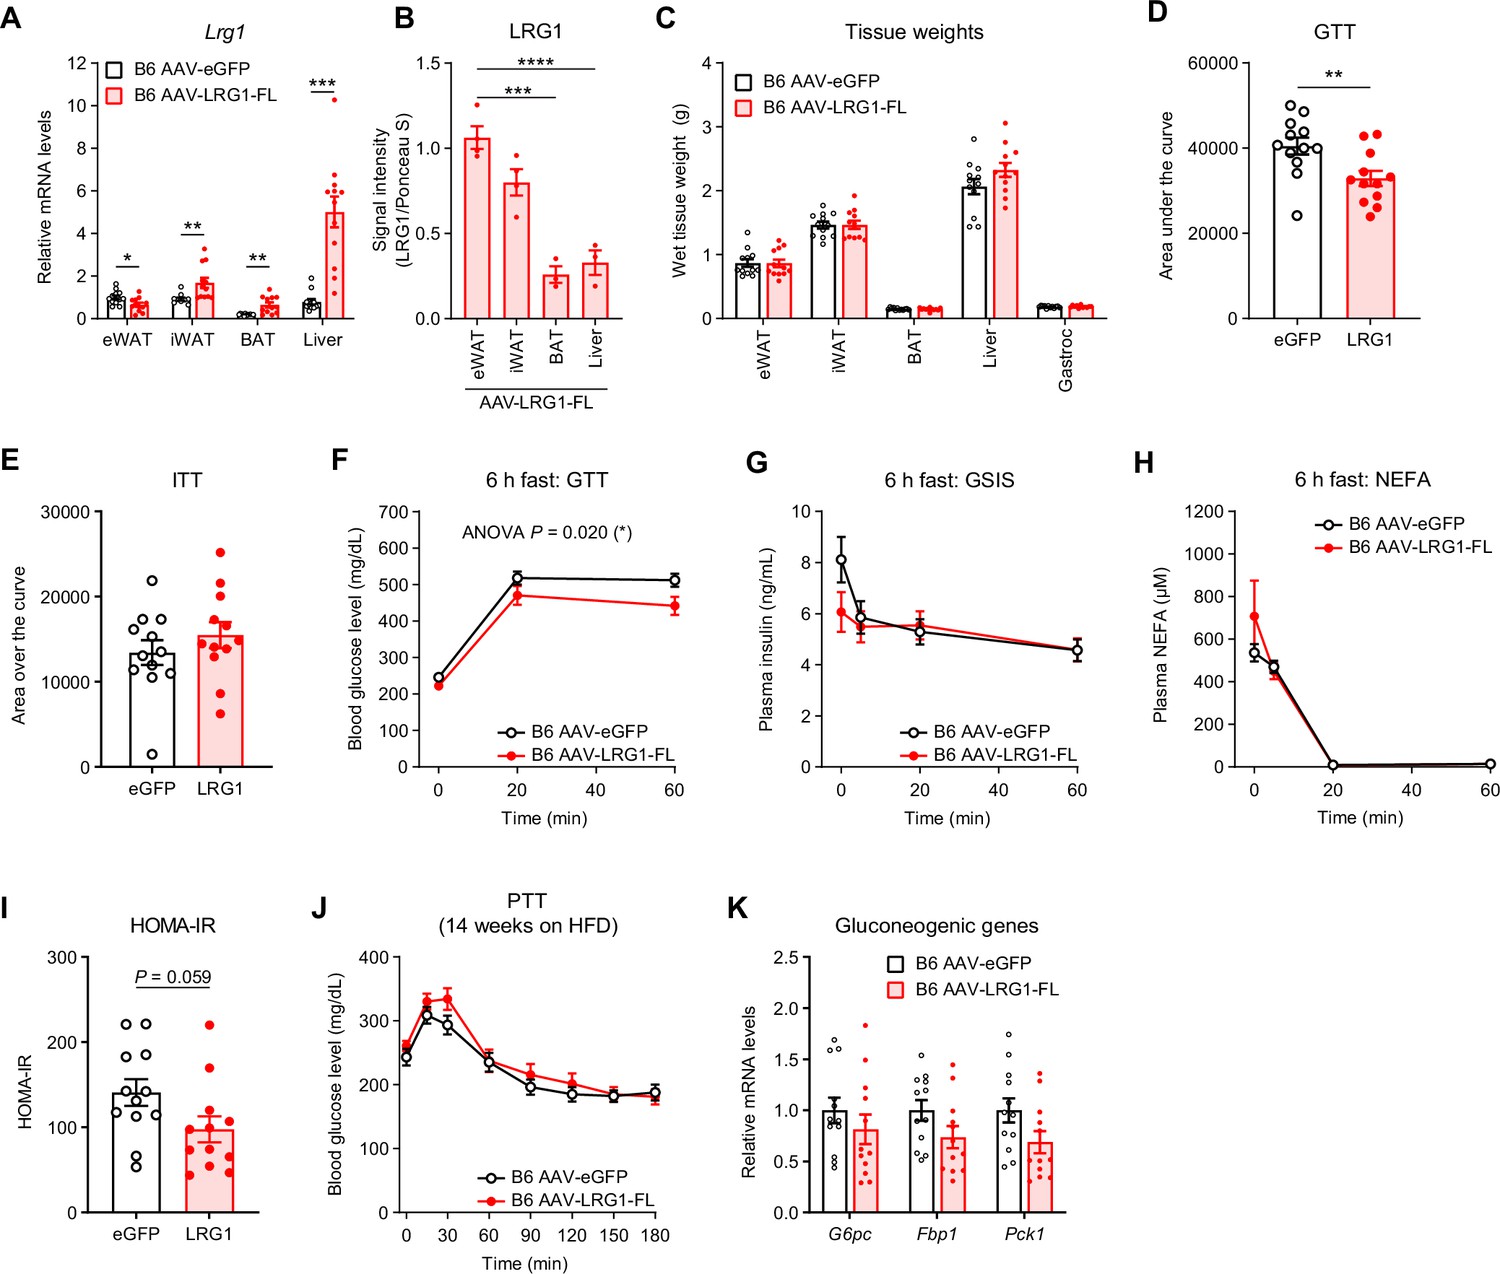
(A) Relative Lrg1 mRNA levels across AAV-transduced B6 males at 21 weeks of age (13 weeks on HFD). *p<0.05, **p<0.01, ***p<0.001 from two-sided Welch’s t-test. (B) Quantification of band intensities from Figure 4I. ***p<0.001, ****p<0.0001 from Tukey post hoc test following one-way ANOVA. n=3–4 biological replicates per group. (C) Weights of dissected tissues from AAV-transduced B6 males from (A). (D) Area under the curve analysis of GTT in Figure 4L after subtracting baseline measurement at t=0. **p<0.01 from two-sided Welch’s t-test. (E) Area over the curve analysis of ITT in Figure 4M after subtracting baseline measurement at t=0. (F) Intraperitoneal glucose tolerance test (1.5 g/kg) following a 6 hr fast in AAV-transduced B6 males at 20 weeks of age (12 weeks on HFD). ANOVA P indicates group factor p-values from repeated measures two-way ANOVA. (G) Plasma insulin levels from (F). (H) Plasma non-esterified fatty acid (NEFA) levels from (F). (I) Calculation of HOMA-IR at t=0 from (F) and (G). p-Value from two-sided Welch’s t-test. (J) Oral pyruvate tolerance test (2.0 g/kg) following a 6 h fastr in AAV-transduced B6 males at 22 weeks of age (14 weeks on HFD). (K) Relative mRNA levels of gluconeogenic genes in the liver of B6 males at 21 weeks of age (13 weeks on HFD). Data are presented as mean ± SEM. n=12 per group.
Figure 4—figure supplement 2
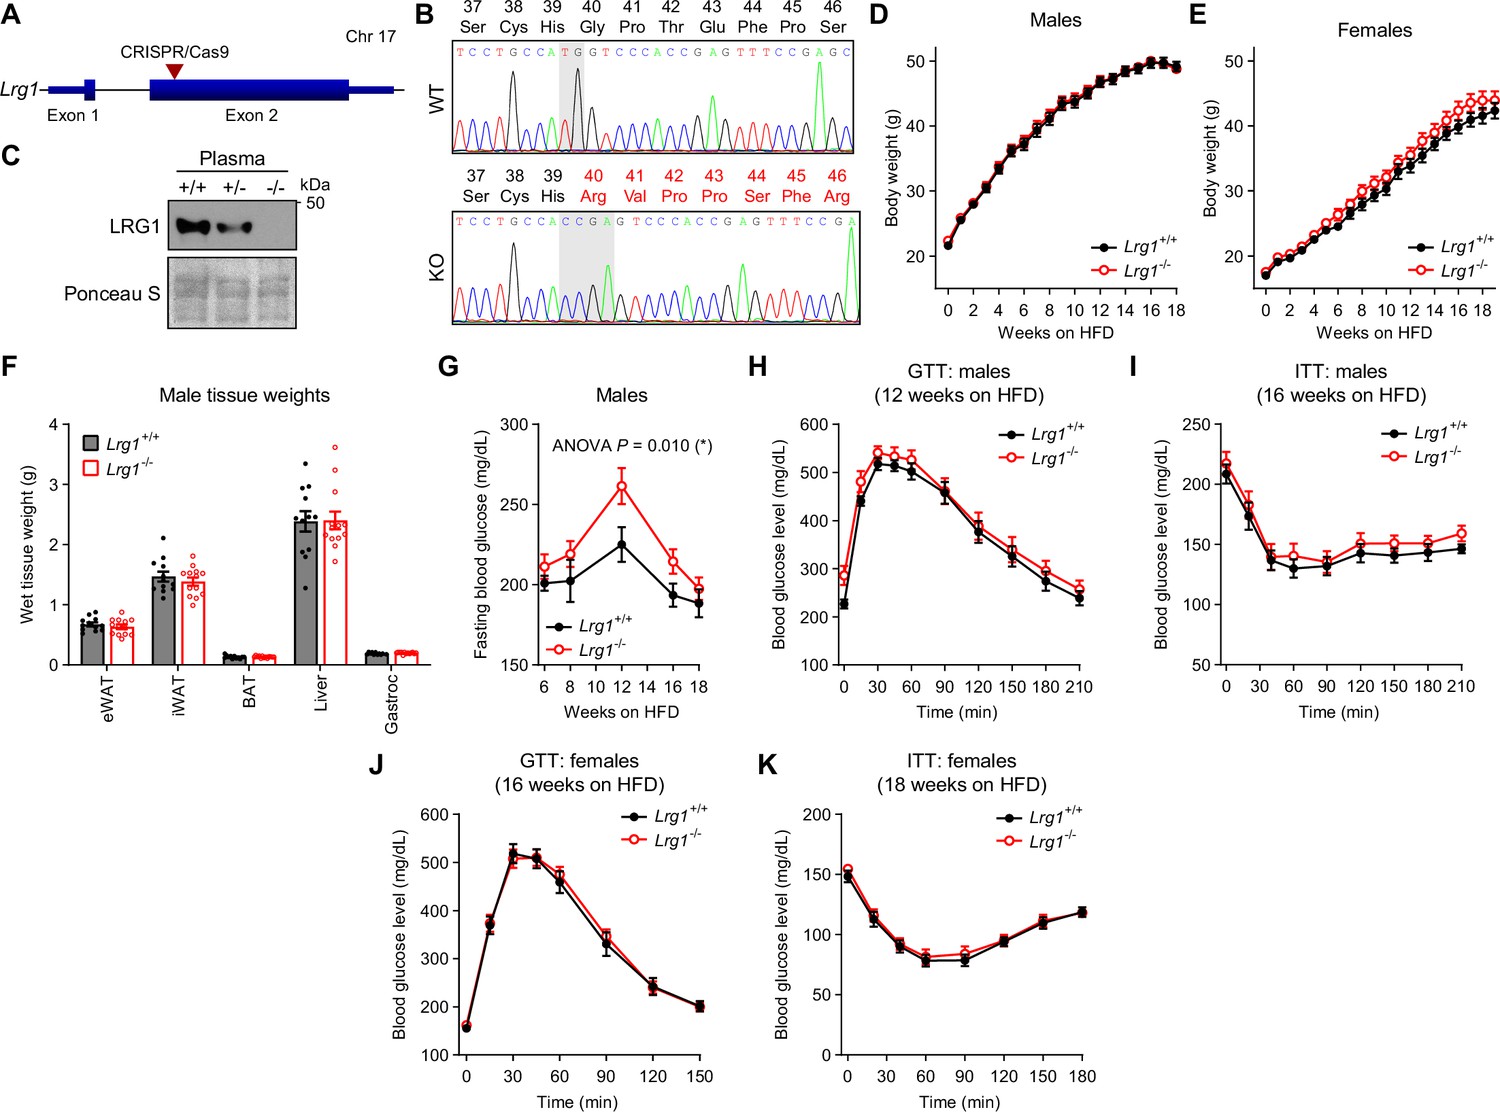
LRG1 loss of function in C57BL/6 J DIO mice elevates fasting blood glucose.
(A) Schematic diagram of murine Lrg1 exon structure. Red arrowhead indicates the region targeted by CRISPR/Cas9 gRNA. (B) Sanger sequencing chromatogram of PCR products amplifying a portion of Lrg1 exon 2. Shaded portion highlights where sequences differ between WT and LRG1-KO alleles. LRG1 amino acid positions and residues encoded by each allele are indicated above each trace. (C) Western blot of LRG1 in plasma of WT (+/+), LRG1-heterozygote (+/-), and LRG1-KO (-/-) mice. (D) Body weights of LRG1-KO and WT littermate males on HFD started at 6 weeks of age. (E) Body weights of LRG1-KO and WT littermate females on HFD started at 6 weeks of age. (F) Dissected tissue weights from LRG1-KO and WT littermate males at 24 weeks of age (18 weeks on HFD). (G) 6 hr fasting blood glucose levels of LRG1-KO and WT littermate males during HFD feeding. ANOVA p indicates group factor p-values from repeated measures two-way ANOVA. *p<0.05. (H) Intraperitoneal glucose tolerance test (1.5 g/kg) in LRG1-KO and WT littermate male mice performed at 18 weeks of age (12 weeks on HFD). (I) Insulin tolerance test (1.5 U/kg) in LRG1-KO and WT littermate male mice performed at 22 weeks of age (16 weeks on HFD). (J) Intraperitoneal glucose tolerance test (1.75 g/kg) in LRG1-KO and WT littermate female mice performed at 22 weeks of age (16 weeks on HFD). (K) Insulin tolerance test (1.0 U/kg) in LRG1-KO and WT littermate female mice performed at 24 weeks of age (18 weeks on HFD). Data are presented as mean ± SEM. Males: n=12 for WT and n=13 for LRG1-KO. Females: n=12 for WT and n=16 for LRG1-KO.
Figure 5 with 1 supplement
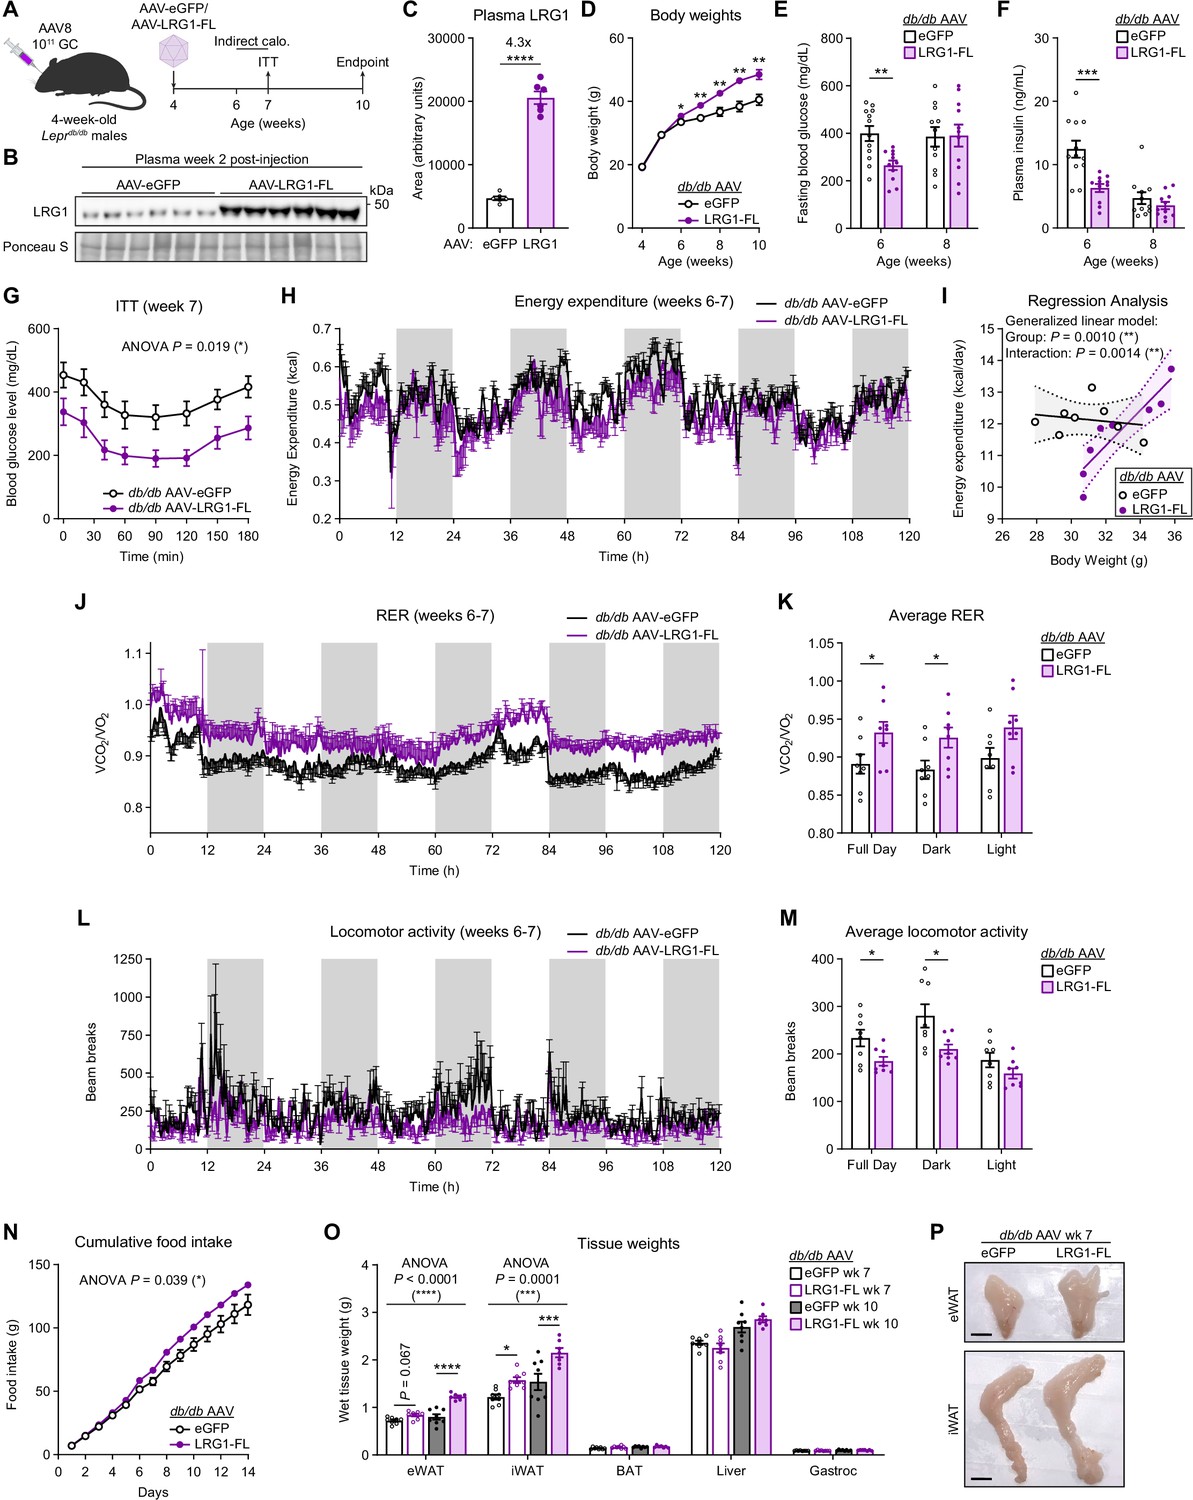
LRG1 overexpression in C57BLKS/J-Leprdb/db mice delays onset of diabetic phenotype and promotes WAT expansion.
(A) Schematic of AAV8-mediated LRG1 overexpression in db/db males. (B) Plasma western blot of LRG1 2 weeks after AAV injection. (C) Quantification of (B). ****p<0.0001 from two-sided Welch’s t-test. n=6 per group. (D) Body weights of AAV-transduced db/db male mice on standard chow diet. *p<0.05, **p<0.01 from two-sided Welch’s t-test. n=16 per group for weeks 4–6; n=7–8 per group for weeks 7–10. (E) 6 hr fasting blood glucose levels of AAV-transduced db/db male mice at 6 and 8 weeks of age. **p<0.01 from two-sided Welch’s t-test. n=11–12 per group. (F) Plasma insulin levels from (D). ***p<0.001 from two-sided Welch’s t-test. (G) Insulin tolerance test (2.0 U/kg) in AAV-transduced 7-week-old db/db male mice. ANOVA p indicates group factor p-value from repeated measures two-way ANOVA. *p<0.05. n=7–8 per group. (H) Energy expenditure (EE) of AAV-transduced db/db male mice measured by indirect calorimetry over the course of 5 days (120 hr). Shaded regions indicate dark cycles. (I) Regression analysis of EE vs. body weight from (H). (J) Respiratory exchange ratio (RER) of AAV-transduced db/db male mice in (H). (K) Daily average of (J) *p<0.05 from one-way ANOVA. (L) Locomotor activity of AAV-transduced db/db male mice in (H). (M) Daily average of (L) *p<0.05 from one-way ANOVA. (N) Cumulative daily food intake over the course of 14 days. *p<0.05 from one-way ANOVA. Indirect calorimetry and food intake measurements were performed with n=8 per group. (O) Weights of dissected tissues from AAV-transduced db/db male mice at 7 and 10 weeks of age. ANOVA p indicates group factor p-values from two-way mixed effects ANOVA. Where indicated, p-values from Šídák post hoc tests reported. *p<0.05, ***p<0.001, ****p<0.0001. n=7–8 per group. (P) eWAT and iWAT of AAV-transduced db/db male mice at 7 weeks of age. Scale bars indicate 1 cm. Data are presented as mean ± SEM.
-
Figure 5—source data 1
Labeled uncropped western blot images in Figure 5 and Figure 5—figure supplement 1.
- https://cdn.elifesciences.org/articles/81559/elife-81559-fig5-data1-v2.pdf
-
Figure 5—source data 2
Raw western blot images in Figure 5 and Figure 5—figure supplement 1.
- https://cdn.elifesciences.org/articles/81559/elife-81559-fig5-data2-v2.zip
Figure 5—figure supplement 1
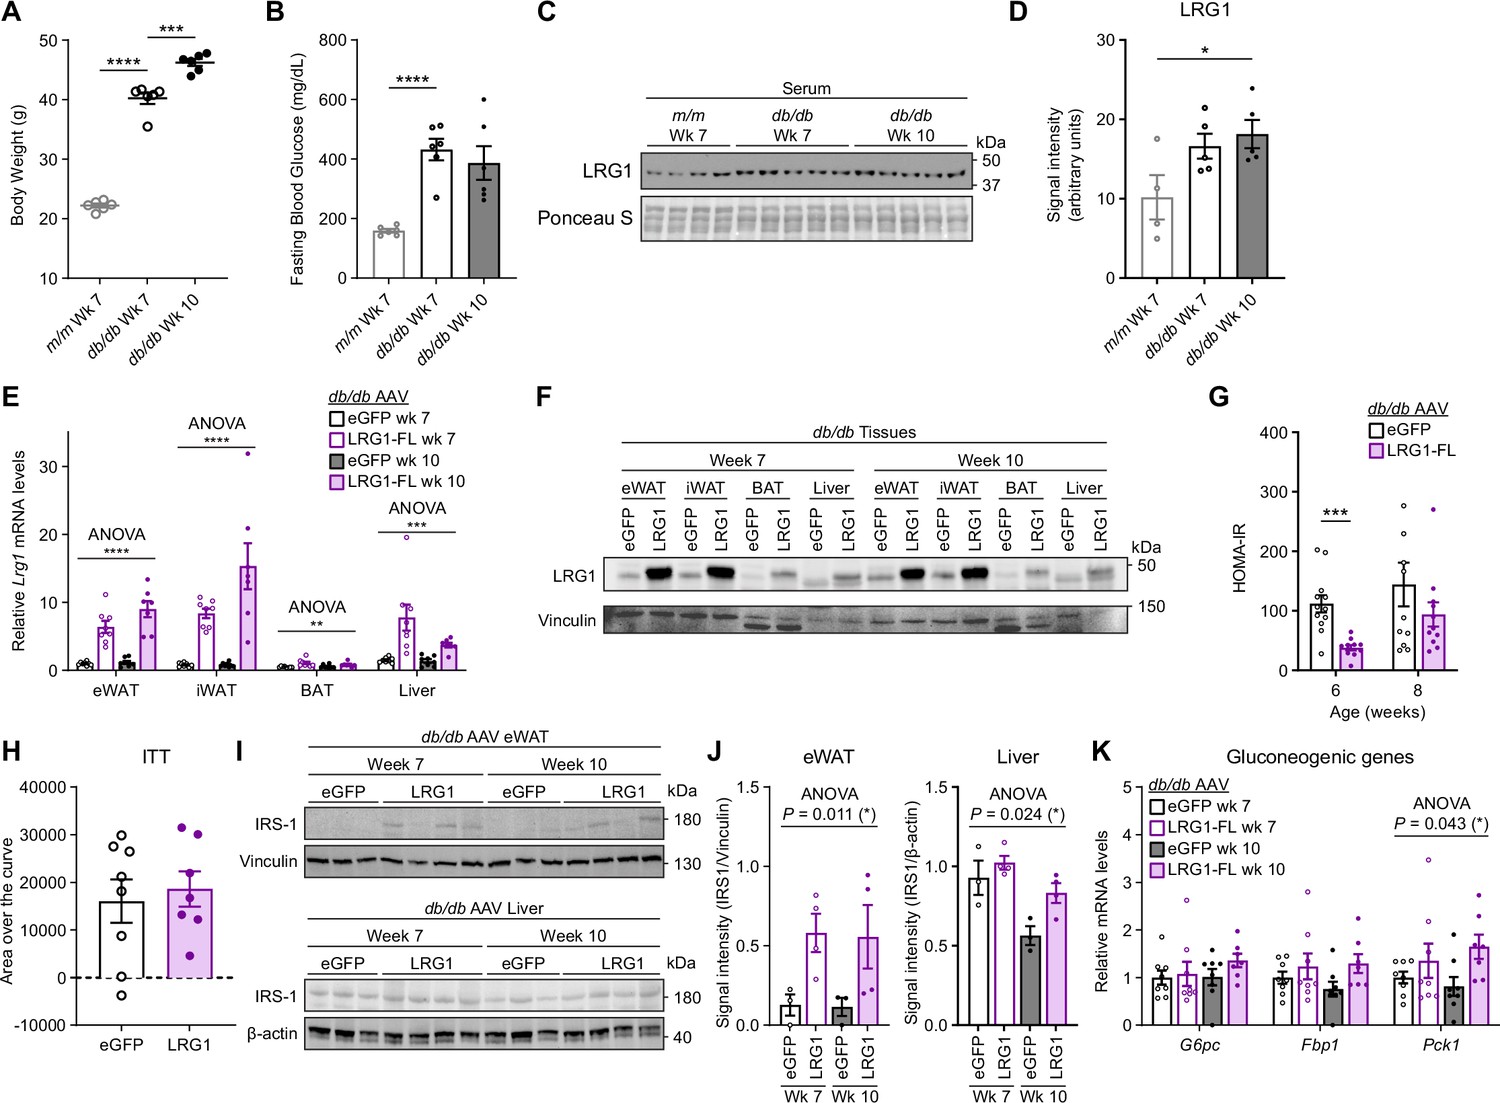
Metabolic characterization of db/db vs. m/m mice and AAV-transduced db/db mice.
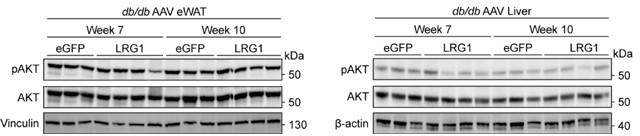
(A) Body weights of db/db and littermate m/m male mice at 7 and 10 weeks of age. ***p<0.001, ****p<0.0001 from two-sided Welch’s t-test. n=6 per group. (B) 6 hr fasting blood glucose levels of db/db and littermate m/m male mice at 7 and 10 weeks of age. ****p<0.0001 from two-sided Welch’s t-test. n=6 per group. (C) Western blot of LRG1 in serum of db/db and littermate m/m male mice. (D) Quantification of (C). *p<0.05 from Tukey post hoc test following one-way ANOVA. (E) Relative Lrg1 mRNA levels across tissues from AAV-transduced db/db male mice. **p<0.01, ***p<0.001, ****p<0.0001, group factor significance from two-way ANOVA. n=7–8 per group. (F) Western blot of LRG1 in tissues from AAV-transduced db/db male mice. (G) Calculation of HOMA-IR from Figure 5E, F. ***p<0.001 from two-sided Welch’s t-test. (H) Area over the curve analysis of ITT in Figure 5G after subtracting baseline measurement at t=0. (I) Western blot of IRS-1 in eWAT and liver of AAV-transduced db/db mice. (J) Quantification of (J).p-value indicates group-factor p-value from two-way ANOVA. n=3–4 biological replicates per group. (K) Relative mRNA levels of gluconeogenic genes in the liver of db/db males at 7 and 10 weeks of age. *p<0.05 indicates group factor p-value from two-way ANOVA. n=7–8 per group. Data are presented as mean ± SEM.
Figure 6 with 1 supplement
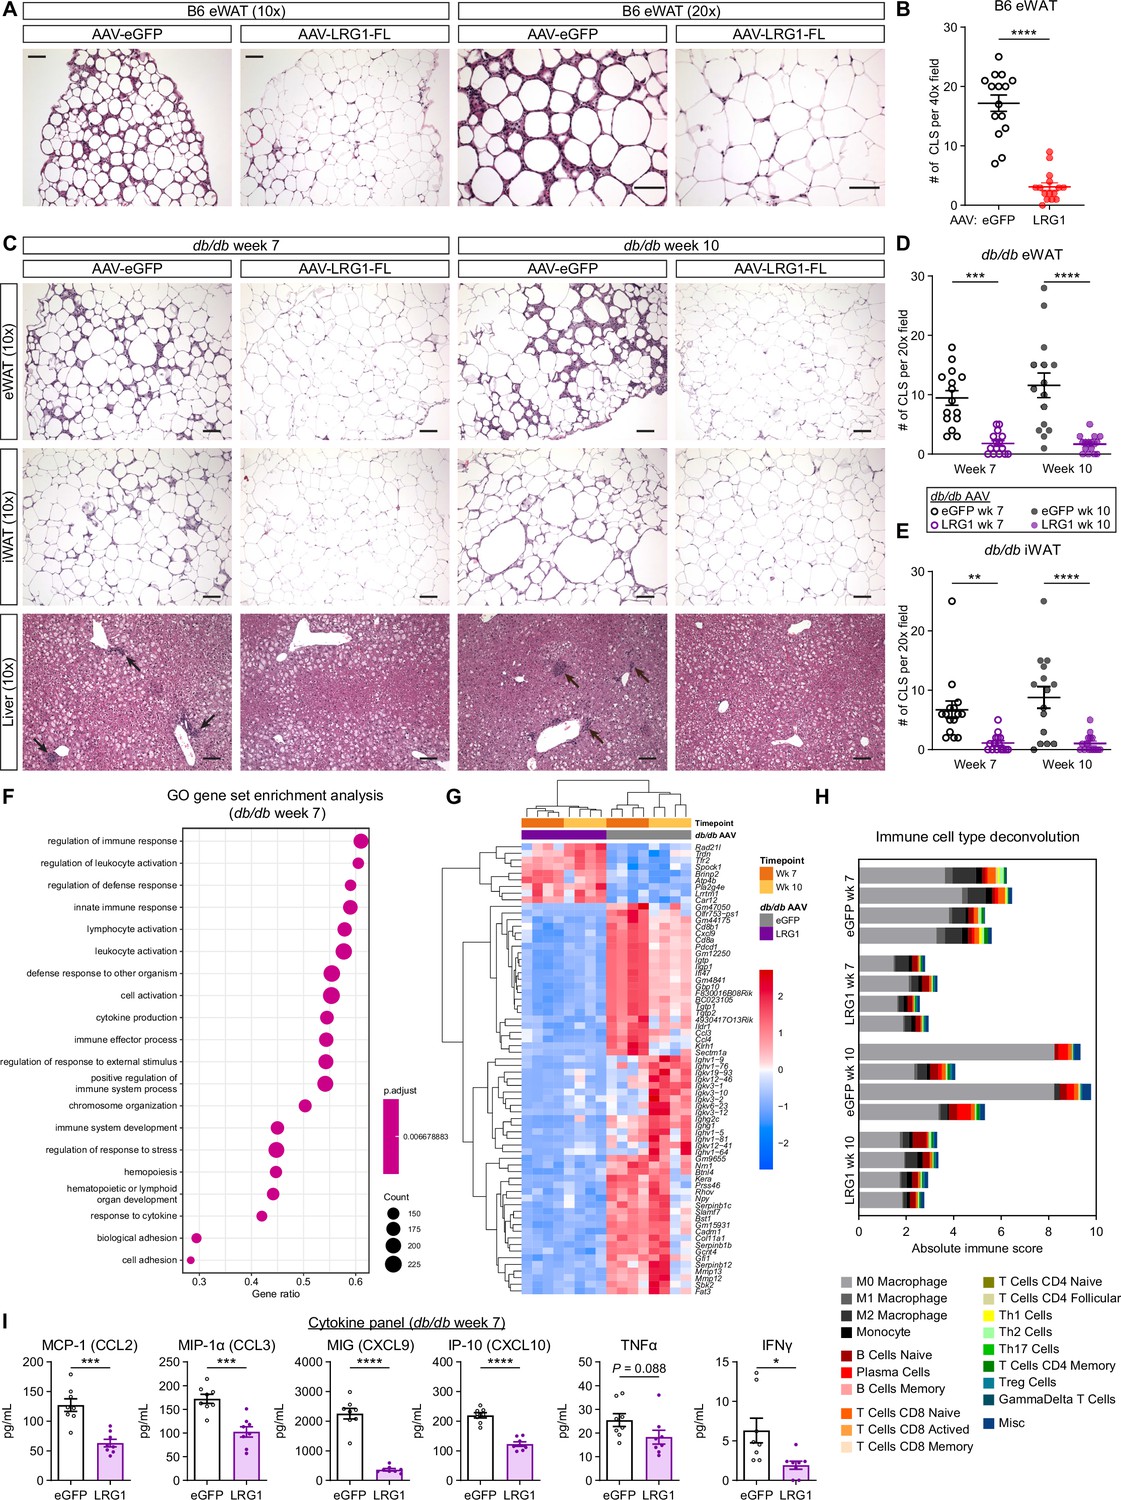
LRG1 suppresses obesity-associated systemic inflammation.
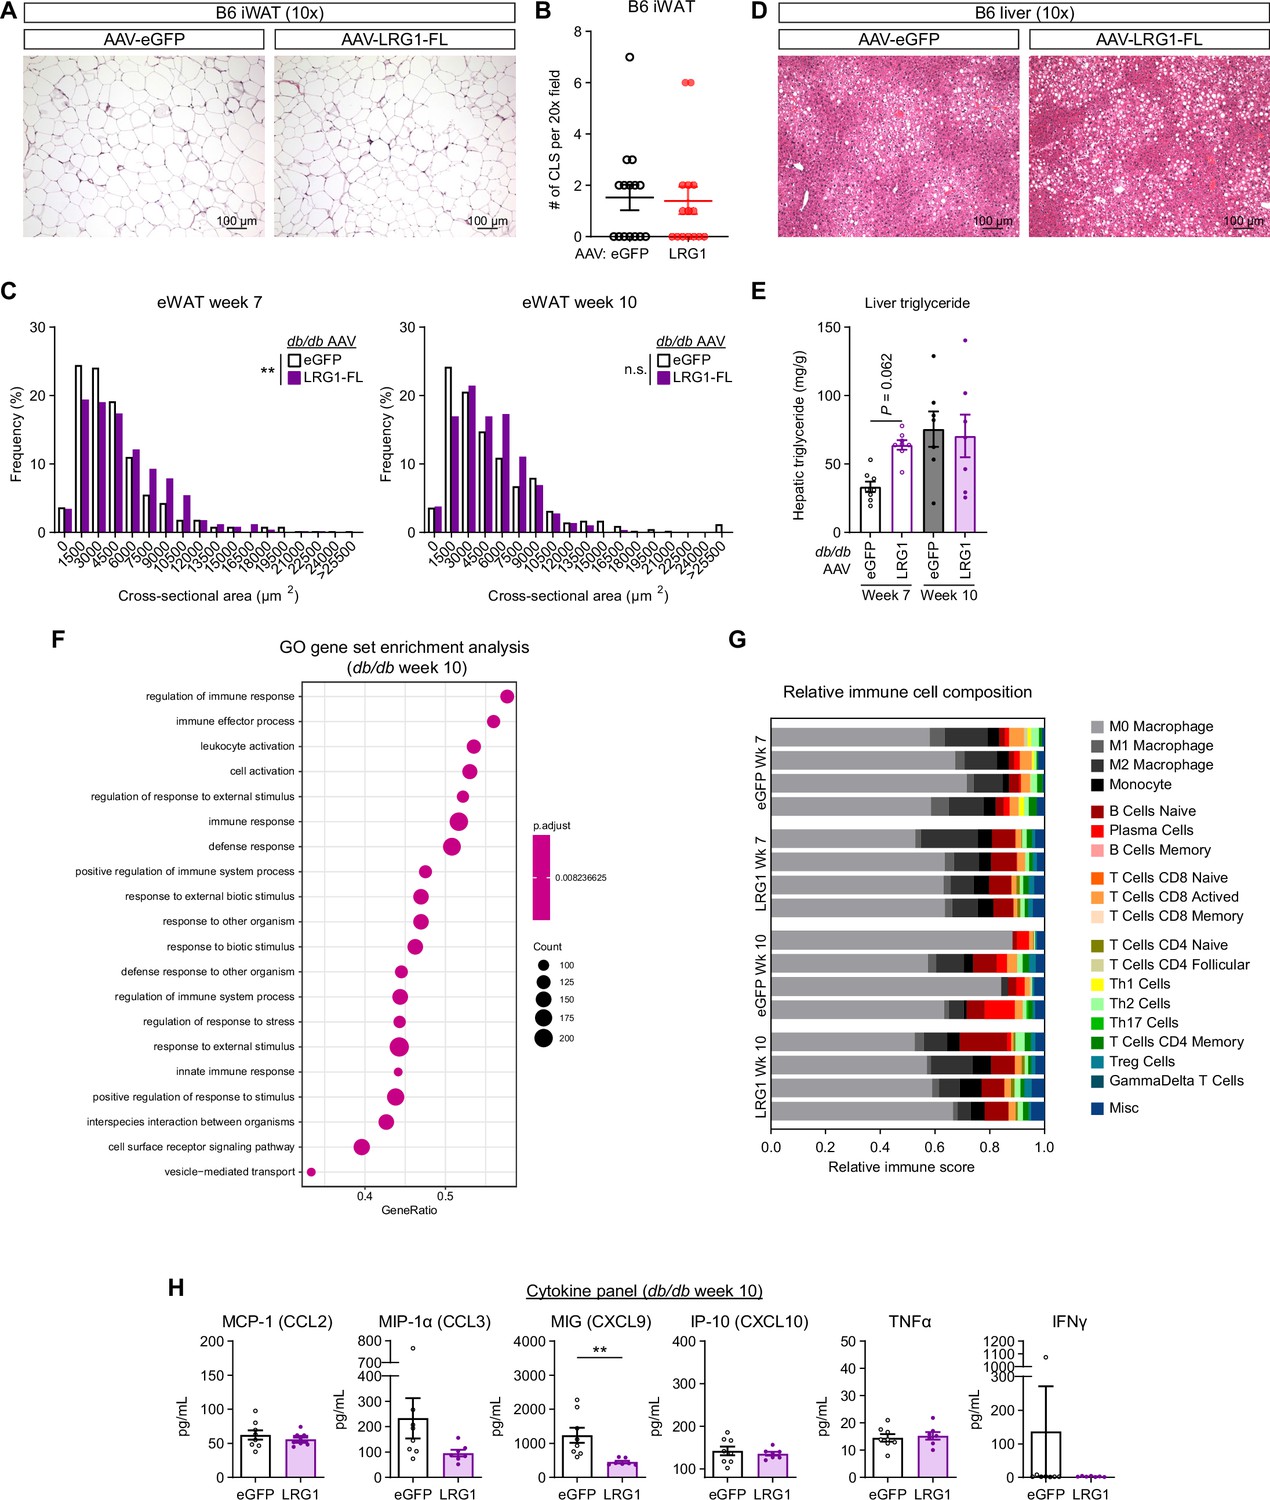
(A) Representative images from H&E-stained eWAT sections from B6 DIO mice transduced with AAV-eGFP or AAV-LRG1-FL under 10 x (left) and 20 x (right) objectives. Scale bars indicate 100 µm. (B) Quantification of CLS from (A). ****p<0.0001 from two-sided Welch’s t-test. 5 fields under a 40 x objective from three animals were used for quantification (n=15 per group). (C) Representative images from H&E-stained eWAT, iWAT, and liver sections from db/db mice transduced with AAV-eGFP or AAV-LRG1-FL. Arrows indicate liver inflammatory foci. Scale bars indicate 100 µm. (D, E) Quantification of CLS in eWAT (D) and iWAT (E) from (C). Šídák post hoc test results from two-way ANOVA are indicated. **p<0.01, ***p<0.001, ****p<0.0001. Five fields under a 20 x objective from three animals were used for quantification (n=15 per group). (F) Top 20 enriched GO BP pathways from GSEA of significantly differentially expressed genes between db/db-LRG1 and db/db-eGFP eWAT at 7 weeks of age. (G) Heatmap of 68 differentially regulated genes (Log2FC >2 or < –2 and adjusted p<0.01) between db/db-LRG1 and db/db-eGFP eWAT at both 7 and 10 weeks of age. (H) Absolute scores from immune cell type deconvolution analysis of eWAT transcriptomes using CIBERSORTx. (I) Quantification of serum chemokine/cytokine levels in db/db-LRG1 and db/db-eGFP at 7 weeks of age. *p<0.05, ***p<0.001, ****p<0.0001 from two-sided Welch’s t-test. n=8 biological replicates per group. Data are presented as mean ± SEM.
Figure 6—figure supplement 1
Analysis of inflammatory phenotypes with LRG1 gain of function.
(A) Representative images from H&E-stained iWAT sections from B6 DIO mice transduced with AAV-eGFP or AAV-LRG1-FL. Scale bars are indicated. (B) Quantification of CLS from (A). Data are presented as mean ± SEM. Five fields under a 20 x objective from three animals were used for quantification (n=15 per group). (C) Histogram of adipocyte cross-sectional areas in H&E stained eWAT sections from db/db-eGFP and db/db-LRG1. **p<0.01 from two-sided Welch’s t-test. (D) Representative images from H&E-stained liver sections from B6 DIO mice transduced with AAV-eGFP or AAV-LRG1-FL. Scale bars are indicated. (E) Quantification of hepatic triglyceride in db/db mice transduced with AAV-eGFP or AAV-LRG1-FL. Data are presented as mean ± SEM. Šídák post hoc test results from two-way ANOVA are indicated. n=7–8 per group. (F) Top 20 enriched GO BP pathways from GSEA of significantly differentially expressed genes in eWAT between db/db-LRG1 and db/db-eGFP at 10 weeks of age. (G) Relative scores from immune cell type deconvolution analysis of eWAT transcriptomes using CIBERSORTx. (H) Quantification of serum chemokine/cytokine levels in db/db-LRG1 and db/db-eGFP at 10 weeks of age. Data are presented as mean ± SEM. **p<0.01 from two-sided Welch’s t-test. n=8 for db/db-eGFP and n=7 for db/db-LRG1 (biological replicates).
Figure 7 with 1 supplement
LRG1 binds extracellular cytochrome c and blocks its pro-inflammatory effect on macrophages.
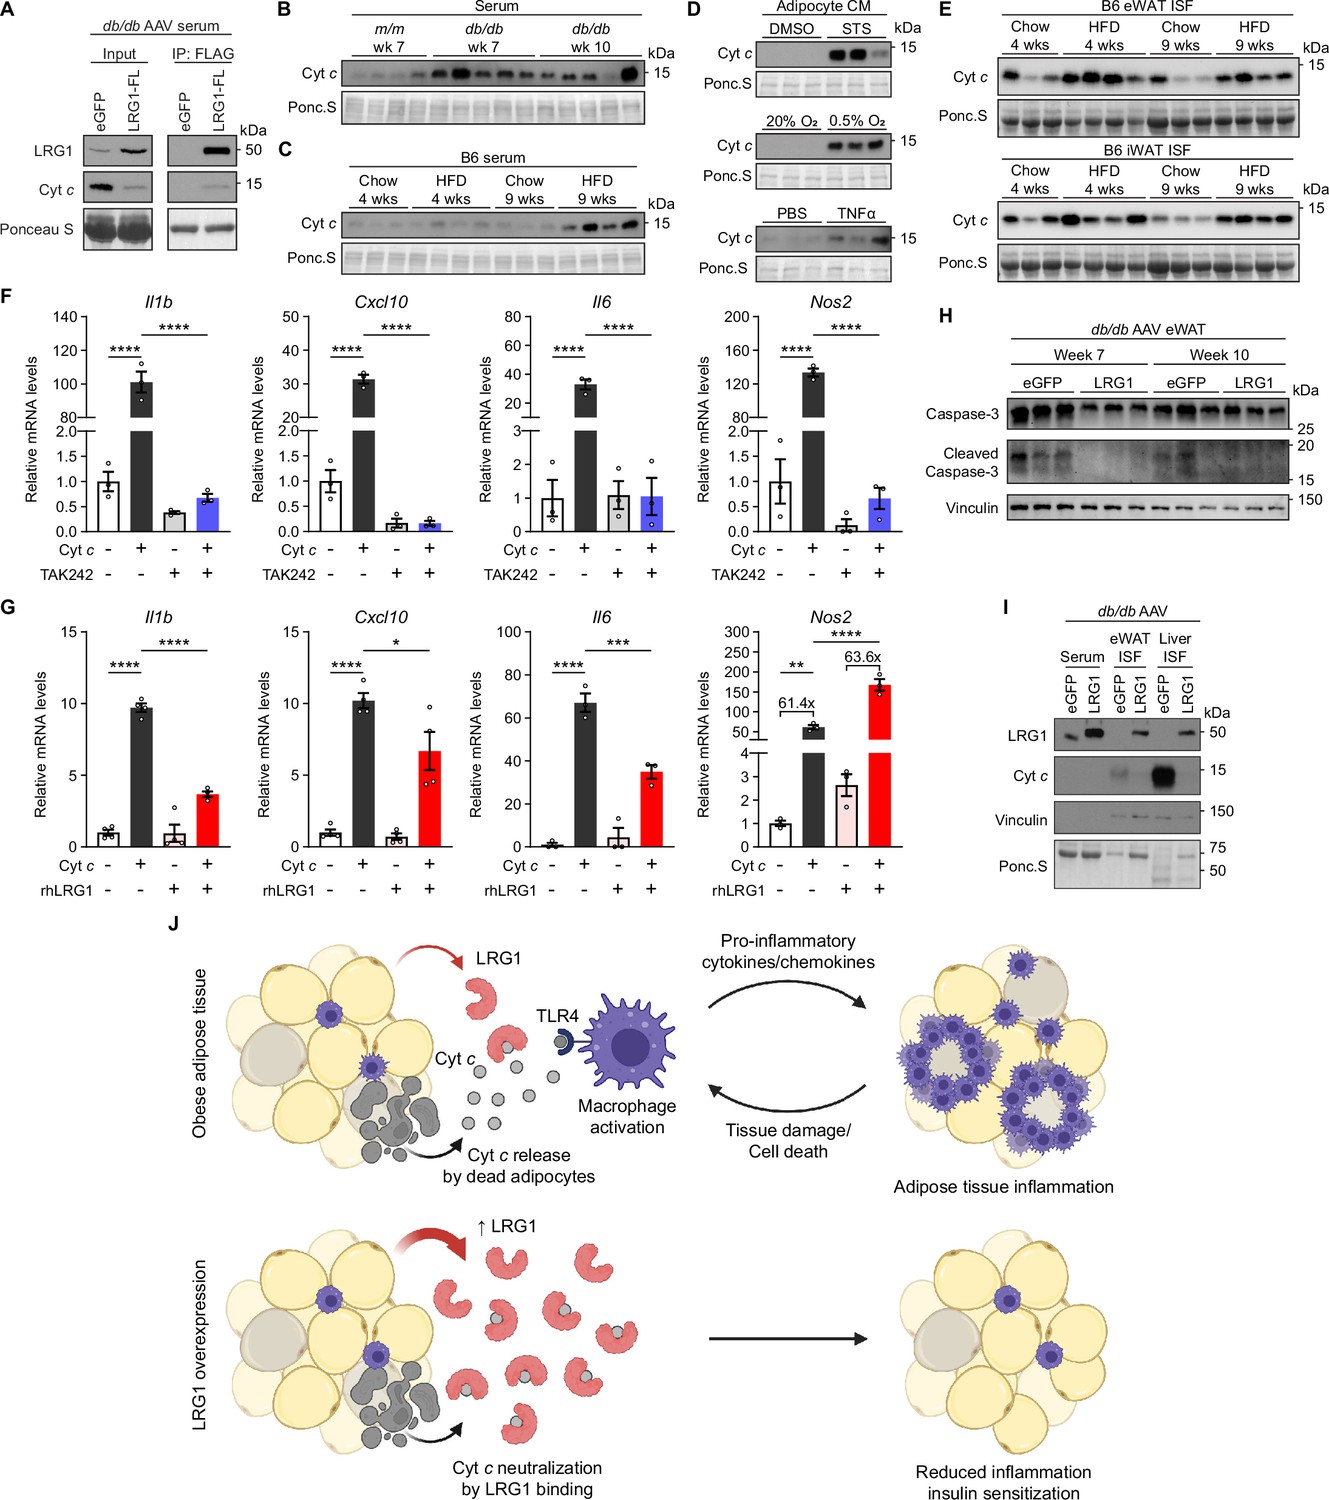
(A) α-FLAG co-IP of C-terminally FLAG-tagged LRG1 and Cyt c from the serum of AAV-transduced db/db mice at 7 weeks of age. (B) Western blot of Cyt c in the serum of db/db or littermate m/m mice at 7 or 10 weeks of age. (C) Western blot of Cyt c in the serum of B6 mice on standard chow or HFD for indicated weeks. HFD was started at 6 weeks of age. Developed from the same membrane in Figure 3F. (D) Western blot of Cyt c in the CM of primary SubQ adipocytes under conditions promoting cell death. SubQ cells were treated with 1 µM staurosporine (STS) or DMSO for 24 hr (top); placed in normoxic or hypoxic chambers for 24 hr (middle); or treated with 100 ng/mL recombinant TNFα or PBS without insulin for 24 hr. Developed from the same membrane in Figure 3I (bottom). (E) Western blot of Cyt c in the insterstitial fluid (ISF) of eWAT and iWAT from B6 mice on standard chow or HFD for indicated weeks. (F) Relative mRNA levels of a panel of pro-inflammatory genes in BMDMs in response to 30 µg/mL equine Cyt c or 10 µM TAK-242, a TLR4 inhibitor. BMDMs were treated with Cyt c or PBS for 6 hr following 1 hr pre-incubation with TAK-242 or DMSO. ****p<0.0001 from Tukey post hoc test results following two-way ANOVA. n=3 technical replicates per group. (G) Relative mRNA levels of a panel of pro-inflammatory genes in BMDMs in response to 20 µg/mL equine Cyt c and 50 µg/mL recombinant human LRG1. Indicated reagents or PBS were rotated for 1 hr at RT prior to BMDM treatment for 6 hr. *p<0.05, **p<0.01, ***p<0.001, ****p<0.0001 from Tukey post hoc test results following two-way ANOVA. n=3–4 technical replicates per group. (H) Western blot of intact and cleaved Caspase-3 in eWAT of AAV-transduced db/db mice. (I) Western blot of LRG1 and Cyt c in the serum and ISF of db/db mice at 10 weeks of age. Vinculin was used to assess tissue leakage during sample preparation. (J) Schematic depicting proposed mechanism. Data are presented as mean ± SEM.
-
Figure 7—source data 1
Labeled uncropped western blot images in Figure 7 and Figure 7—figure supplement 1.
- https://cdn.elifesciences.org/articles/81559/elife-81559-fig7-data1-v2.pdf
-
Figure 7—source data 2
Raw western blot images in Figure 7 and Figure 7—figure supplement 1.
- https://cdn.elifesciences.org/articles/81559/elife-81559-fig7-data2-v2.zip
Figure 7—figure supplement 1
Analysis of LRG1-Cyt c interaction.
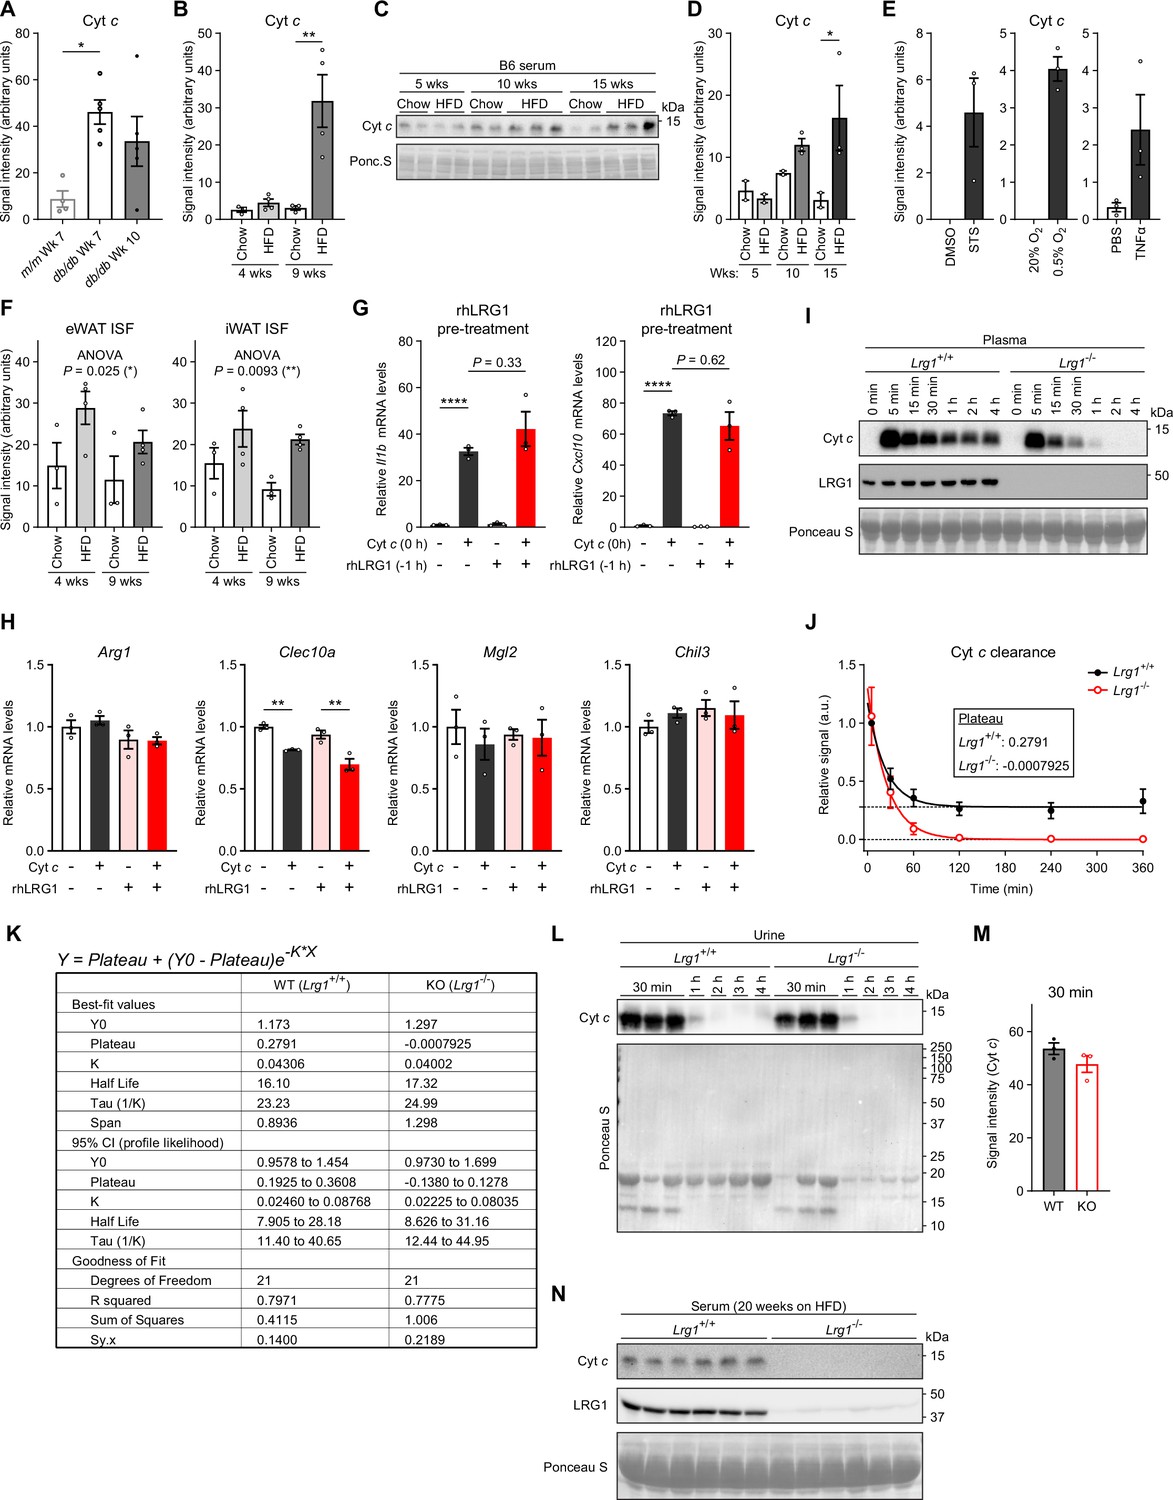
(A) Quantification of Figure 7B. *p<0.05 from Tukey post hoc test following one-way ANOVA. n=4–5 biological replicates per group. (B) Quantification of Figure 7C. **p<0.01 from Šídák post hoc test following two-way ANOVA. n=3–4 biological replicates per group. (C) Western blot of Cyt c in serum of B6 mice on HFD. (D) Quantification of (C). *p<0.05 from Šídák post hoc test following two-way ANOVA. n=2–3 biological replicates per group. (E) Quantification of Figure 7D. n=3 technical replicates per group. (F) Quantification of Figure 7E. *p<0.05 indicates group factor p-value from two-way ANOVA. n=3–4 biological replicates per group. (G) Relative Il1b and Cxcl10 mRNA levels in BMDMs in response to 20 µg/mL equine Cyt c with or without 1 hr pre-treatment of 50 µg/mL recombinant human LRG1. Tukey post hoc test results from two-way ANOVA are indicated. ****p<0.0001. n=3 technical replicates per group. (H) Relative mRNA levels of a panel of alternatively activated (M2) macrophage markers in BMDMs in response to 20 µg/mL equine Cyt c and 50 µg/mL recombinant human LRG1. **p<0.01 from Tukey post hoc test following two-way ANOVA. n=3 technical replicates per group. (I) Representative western blot of Cyt c in plasma of LRG1-KO and WT littermate male mice following retroorbital injection of 40 mg/kg equine Cyt c. (J) Relative quantification of Cyt c intensities from (I). Fitted one-phase decay curves and estimated values for the plateau are shown. n=4 biological replicates per group. (K) Table summarizing results from least squares regression fit of relative Cyt c intensities with one-phase decay functions. (L) Urine Cyt c western blot and Ponceau S stain of urinary proteins from animals in (J). (M) Quantification of (L). (N) Western blot of Cyt c in serum of LRG1-KO and WT littermate male mice on HFD for 20 weeks. Data are presented as mean ± SEM.
Author response image 1
Tables
Appendix 1—key resources table
| Reagent type (species) or resource | Designation | Source or reference | Identifiers | Additional information |
|---|---|---|---|---|
| Gene (Mus musculus) | Lrg1 | NCBI | NM_029796.2 | |
| Strain, strain background (Mus musculus) | C57BL/6 J | The Jackson Laboratory | Cat #000664, RRID:IMSR_JAX:000664 | |
| Strain, strain background (Mus musculus) | BKS.Cg-Dock7m +/+Leprdb/J | The Jackson Laboratory | Cat# 000642, RRID:IMSR_JAX:000642 | |
| Strain, strain background (Mus musculus) | LRG1-KO in C57BL/6 J background | This Study | Produced by the CRISPR and Genome Editing Center (Rockefeller University) | |
| Strain, strain background (Escherichia coli) | NEB Stable | NEB | Cat# C3040 | Competent cells |
| Strain, strain background (Escherichia coli) | BJ5183-AD-1 cells | Agilent | Cat# 200157 | Electroporation competent, recombination proficient cells carrying the pAdEasy-1 plasmid |
| Strain, strain background (Escherichia coli) | XL-10 Gold ultracompetent cells | Agilent | Cat# 200314 | Competent cells |
| Strain, strain background (Adenovirus) | Ad-eGFP | This study; protocol adapted from Luo et al., 2007 | Produced in Paul Cohen lab (Rockefeller University) | |
| Strain, strain background (Adenovirus) | Ad-LRG1-FL | This study; protocol adapted from Luo et al., 2007 | Produced in Paul Cohen lab (Rockefeller University) | |
| Strain, strain background (AAV8) | AAV8-eGFP | This study | Produced by Penn Vector Core (University of Pennsylvania). | |
| Strain, strain background (AAV8) | AAV8-LRG1-FL | This study | Produced by Penn Vector Core (University of Pennsylvania). | |
| Cell line (Homo-sapiens) | HEK293A | Invitrogen | Cat# R70507 | |
| Antibody | Anti-LRG1 (rabbit polyclonal) | Sigma-Aldrich | Cat# HPA001888, RRID:AB_1079276 | Western blot (1:5000) |
| Antibody | Anti-CFD/Adipsin (sheep polyclonal) | R and D Systems | Cat# AF5430, RRID:AB_1655868 | Western blot (1:1000) |
| Antibody | Anti-Cytochrome c (rabbit monoclonal) | Cell Signaling Technology | Cat# 11940, RRID:AB_2637071 | Western blot (1:1000) |
| Antibody | Anti-FLAG M2 Magnetic Beads (mouse monoclonal) | Sigma-Aldrich | Cat# M8823, RRID:AB_2637089 | Immunoprecipitation |
| Antibody | Anti-Cleaved Caspase-3 (Asp175) (rabbit polyclonal) | Cell Signaling Technology | Cat# 9661, RRID:AB_2341188 | WB (1:1000) |
| Antibody | Anti-Caspase-3 (rabbit polyclonal) | Cell Signaling Technology | Cat# 9662, RRID:AB_331439 | WB (1:1000) |
| Antibody | Anti-IRS-1 (rabbit polyclonal) | Cell Signaling Technology | Cat# 2382, RRID:AB_330333 | WB (1:500) |
| Antibody | Anti-β-actin (rabbit polyclonal) | GeneTex | Cat# GTX109639, RRID:AB_1949572 | WB (1:20000) |
| Antibody | Anti-vinculin (rabbit polyclonal) | Cell Signaling Technology | Cat# 4650, RRID:AB_10559207 | WB (1:1000) |
| Peptide, recombinant protein | Recombinant Mouse M-CSF | Biolegend | Cat# 576406 | |
| Peptide, recombinant protein | Recombinant human LRG1 | R and D Systems | Cat# 7890-LR | |
| Peptide, recombinant protein | Recombinant human TNFα | R and D Systems | Cat# 210-TA-020/CF | |
| Peptide, recombinant protein | Cytochrome c from equine heart | Sigma-Aldrich | Cat# C2506 | |
| Commercial assay or kit | Click-iT Protein Enrichment Kit | Invitrogen | Cat# C10416 | |
| Sequence-based reagent | qPCR primers | This paper | Supplementary file 3 | |
| Sequence-based reagent | pAdTrack-CMV | Addgene | RRID:Addgene_16405 | |
| Sequence-based reagent | pENN.AAV.CB7.CI.eGFP.WPRE.rBG | Addgene | RRID:Addgene_105542 |
Additional files
-
Supplementary file 1
Proteins detected in adipocyte CM with enrichment score above 80%.
- https://cdn.elifesciences.org/articles/81559/elife-81559-supp1-v2.docx
-
Supplementary file 2
Comparison of MS-based adipose secretome studies.
- https://cdn.elifesciences.org/articles/81559/elife-81559-supp2-v2.docx
-
Supplementary file 3
Primer sequences used for RT-qPCR analysis.
- https://cdn.elifesciences.org/articles/81559/elife-81559-supp3-v2.docx
-
MDAR checklist
- https://cdn.elifesciences.org/articles/81559/elife-81559-mdarchecklist1-v2.pdf
Download links
A two-part list of links to download the article, or parts of the article, in various formats.
Downloads (link to download the article as PDF)
Open citations (links to open the citations from this article in various online reference manager services)
Cite this article (links to download the citations from this article in formats compatible with various reference manager tools)
LRG1 is an adipokine that promotes insulin sensitivity and suppresses inflammation
eLife 11:e81559.
https://doi.org/10.7554/eLife.81559


