Transcription factors underlying photoreceptor diversity
- Unit of Retinal Neurophysiology, National Eye Institute, National Institutes of Health, United States
- Section on Sensory Cell Development and Function, National Institute on Deafness and Other Communication Disorders, National Institutes of Health, United States
Figures
Figure 1 with 3 supplements
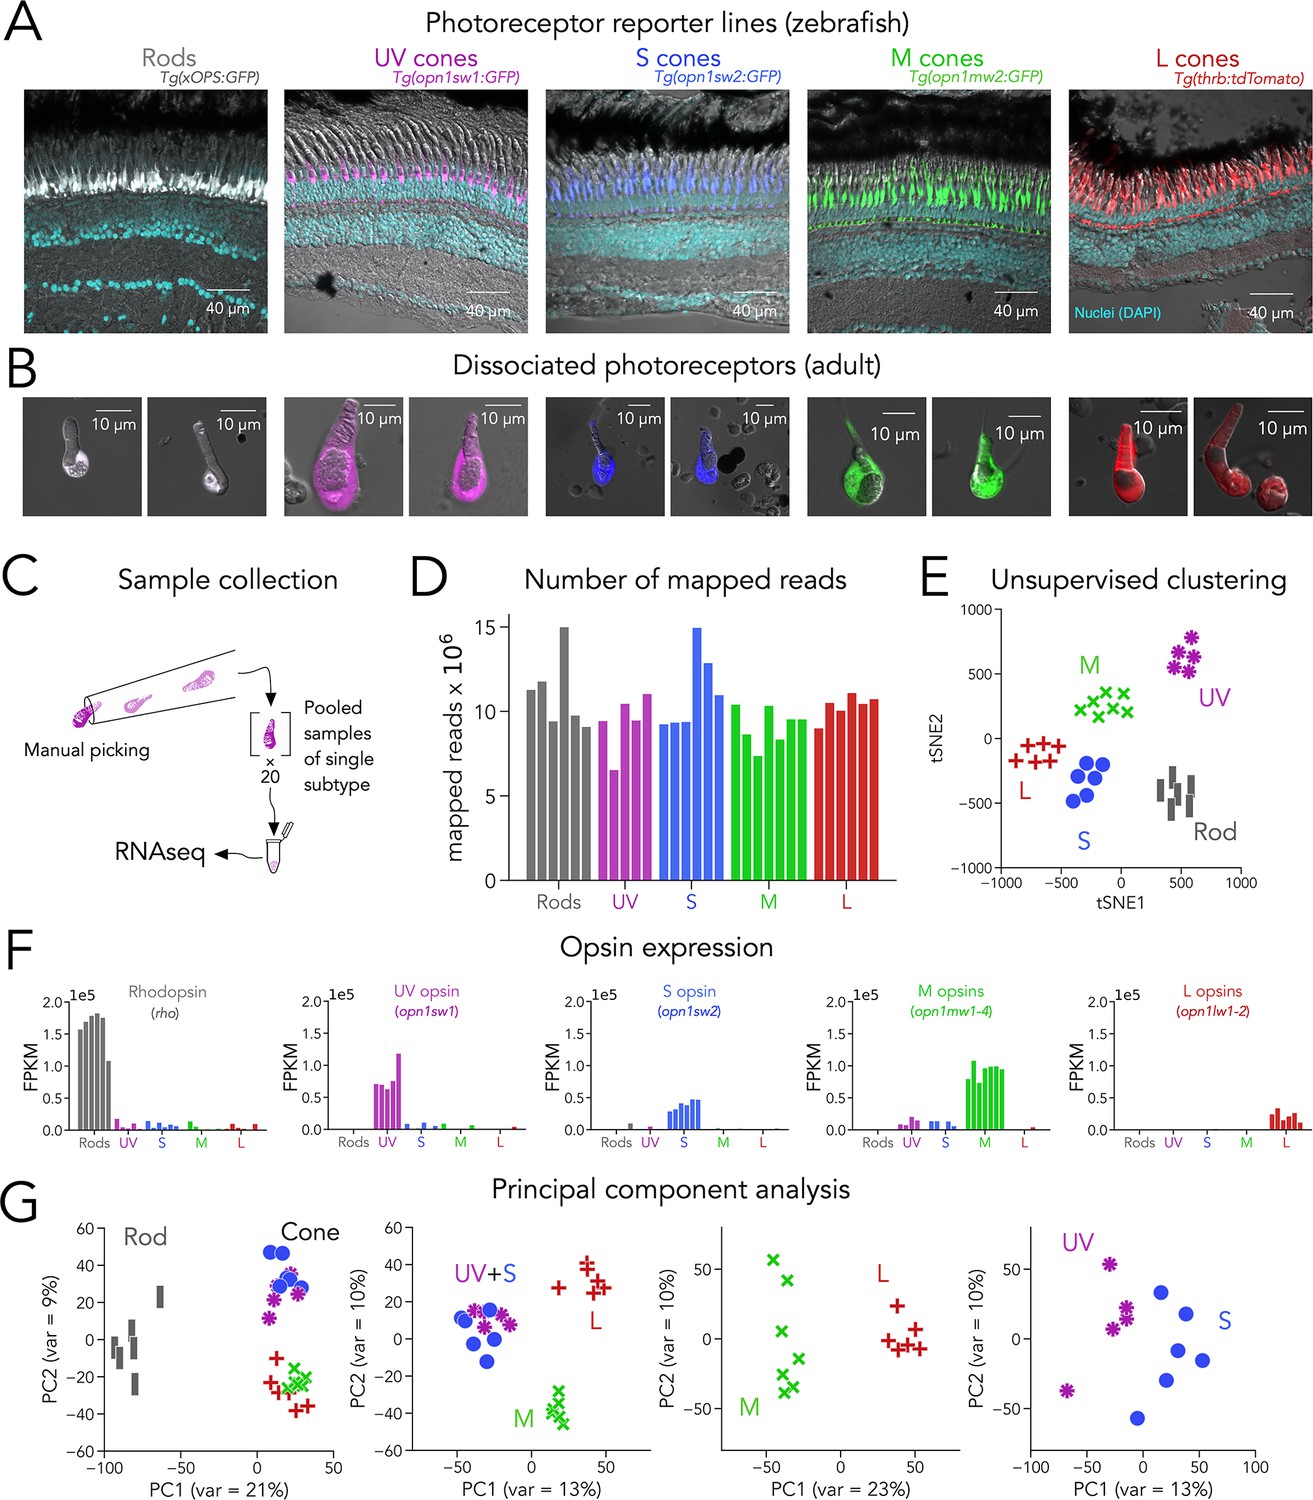
Transcriptomic profiling (RNA-seq) of zebrafish photoreceptors.
(A) Confocal images of fixed adult zebrafish retinal cross-sections, from transgenic reporter lines used to identify photoreceptor subtypes. Reporter expression is exclusive to the outer retina, and each line labels a single photoreceptor subtype with unique morphology, including rods (grey), UV cones (magenta), S cones (blue), M cones (green), and L cones (red). The inner retinal layers can be distinguished in the overlayed nuclear stain (DAPI, cyan) and transmitted DIC image (grey). (B) Confocal images of dissociated and live photoreceptors of each subtype, identified by fluorescent reporter expression. Photoreceptors have preserved outer segments and identifiable mitochondrial bundles. (C) Sample collection method. After dissociation, 20 healthy photoreceptors of a single subtype were identified by fluorescence and manually picked with a glass micropipette and pooled as a single RNA-seq sample. (D) High transcriptome depth shown by the number of reads successfully mapped to the zebrafish genome (GRCz11); bars represent individual RNA-seq samples. (E) Clustering using t-distributed stochastic neighbor embedding (tSNE) correctly separates samples by their original subtype; symbols represent individual RNA-seq samples. (F) Plots of opsin expression show high counts for the appropriate opsin in each sample (in fragments per kilobase per million reds or FPKM) and low-to-negligible counts of other opsins. For M-opsin quantification, we calculated the sum of counts for opn1mw1, opn1mw2, opn1mw3 and opn1mw4 and for L-opsin quantification, we summed counts for opn1lw1 and opn1lw2. (G) Iterative principal component analysis (PCA) shows that differences in gene expression separate rods and cones (first panel), and UV/S cones from M/L cones (second panel). M and L cones can also be distinguished by a single principal component (third panel), while separation of UV and S cones is more difficult (fourth panel).
Figure 1—figure supplement 1

Expression of phototransduction genes.
Heatmaps showing expression of phototransduction genes for each RNA-seq sample. Genes have been arranged by functional family. Grey values indicate expression level normalized in by the maximal value in each family and coded according to adjacent colorbars.
Figure 1—figure supplement 2

Differentially expressed genes between photoreceptor subtypes.
Heatmaps showing the top 50 differentially expressed genes, identified using pairwise comparisons that follow the direction of principal components shown in Figure 1G, and indicated in the titles of each panel. Grey values indicate expression level normalized in each row by the maximal value. Genes have been arranged by degree of enrichment.
Figure 1—figure supplement 3
Comparison of RNA-seq datasets across studies.
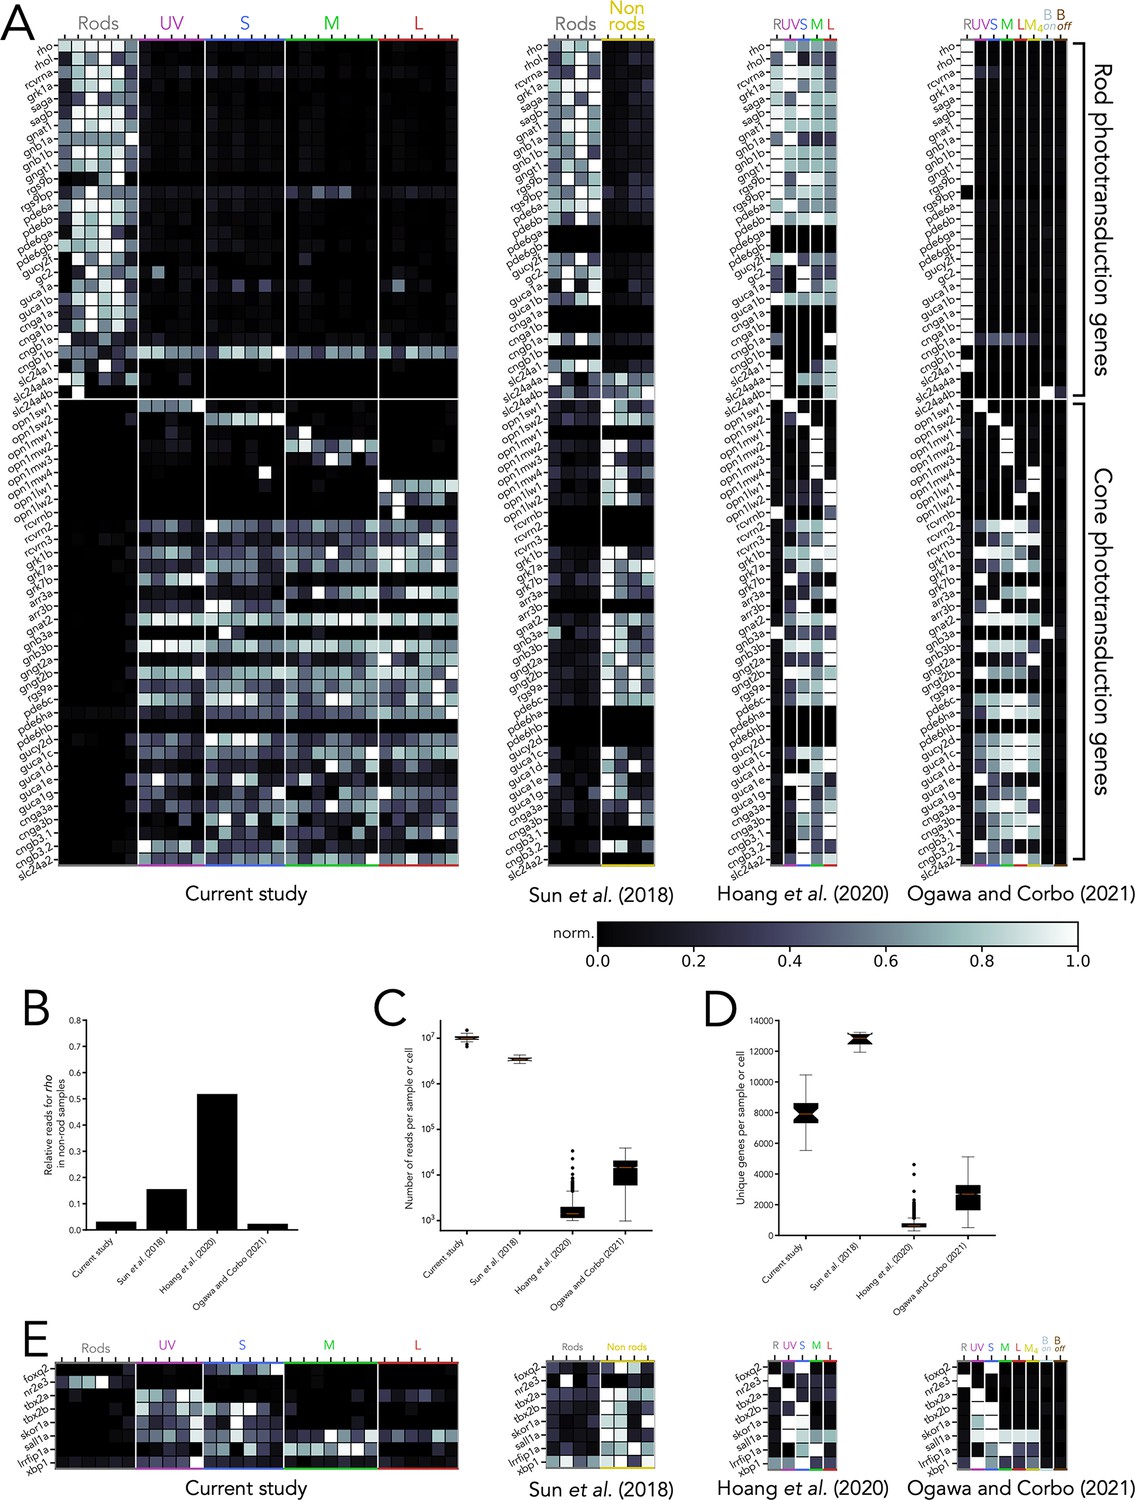
(A) Heatmaps showing expression of phototransduction genes across four RNA-seq studies containing transcriptomes of adult zebrafish photoreceptors. Grey values indicate expression level normalized in each row by the maximal value, and genes have been first arranged by their known expression in rods or cones and subsequently by functional family. (B) Degree of contamination in each study, measured as expression of rhodopsin (rho) in non-rod samples or cells, normalized to expression in rod samples or cells. (C) Transcriptome depth in each study, measured as the number of reads per sample (current study, Sun et al., 2018), or number of reads per cell (Hoang et al., 2020, Ogawa et al., 2021b), shown as a box and whiskers plot in log scale (red line corresponds to mean, boxes correspond to inter-quartile ranges, whiskers correspond to extremes and symbols correspond to outliers). (D) Number of unique genes per sample or per cell identified in each study. Of note, for Sun et al., 2018, four samples included all retinal cells (non-rods), while for Hoang et al., 2020 and Ogawa et al., 2021b, only cells clustered as photoreceptors were included. (E) Heatmaps showing expression of the eight transcription factors explored in this study, normalized by row. In heatmaps, R=rods, Bon = on bipolar cells, Boff = off bipolar cells.
Figure 2 with 2 supplements
Transcription factor expression in zebrafish adult photoreceptors.
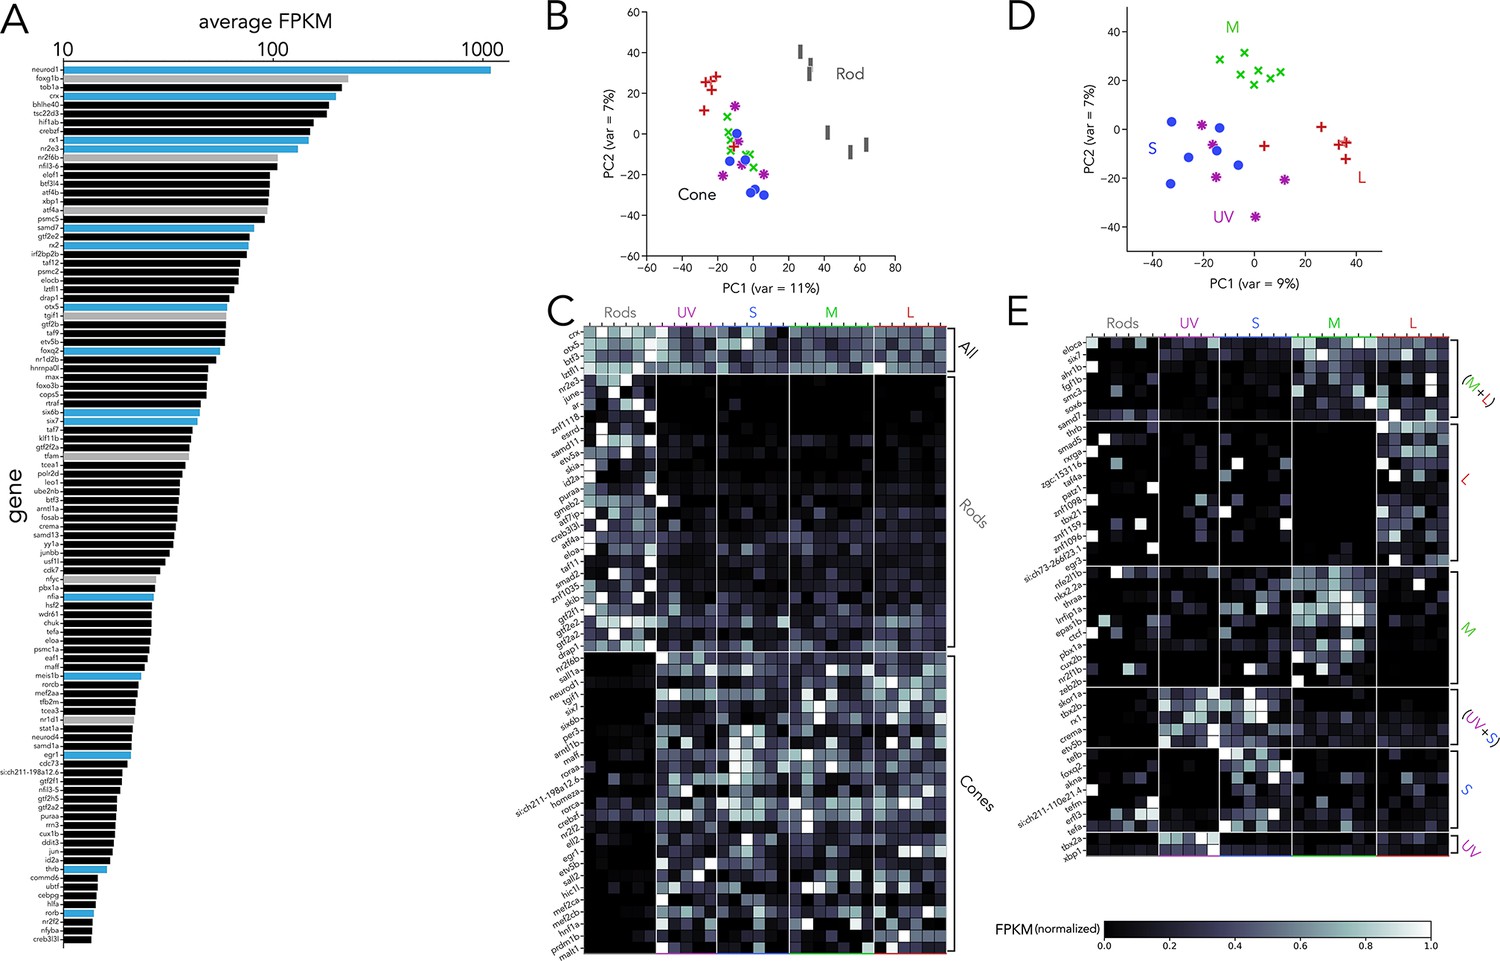
(A) Top 100 transcription factors ranked by average expression across all samples, displayed on a logarithmic scale. Genes highlighted in blue are known to be critical in photoreceptor progenitors or during photoreceptor development. Some limited information about function in photoreceptors exists for genes highlighted in grey. (B) Principal component analysis (PCA) of transcription factor expression shows that differences between rods and cones are the main source of variance. (C) Heatmap showing differential expression of transcription factors between rods and cones and divided into three groups: consistently expressed by all photoreceptors, enriched in rod samples, and enriched in cones samples. Grey values indicate expression level normalized by the maximal value in each row. Rod- and cone-enriched genes have been arranged by degree of enrichment. (D) PCA of cone samples shows that the largest differences in expression separate L cones (PC1) and M cones (PC2), while separation of UV and S cones is more difficult. (E) Heatmap of transcription factors differentially expressed in cone subtypes, divided into six relevant groups. Full list of differentially expressed transcription factors available in Supplementary file 2, Supplementary file 3.
Figure 2—figure supplement 1
Transcripts from candidate transcription factors are detected in photoreceptors.
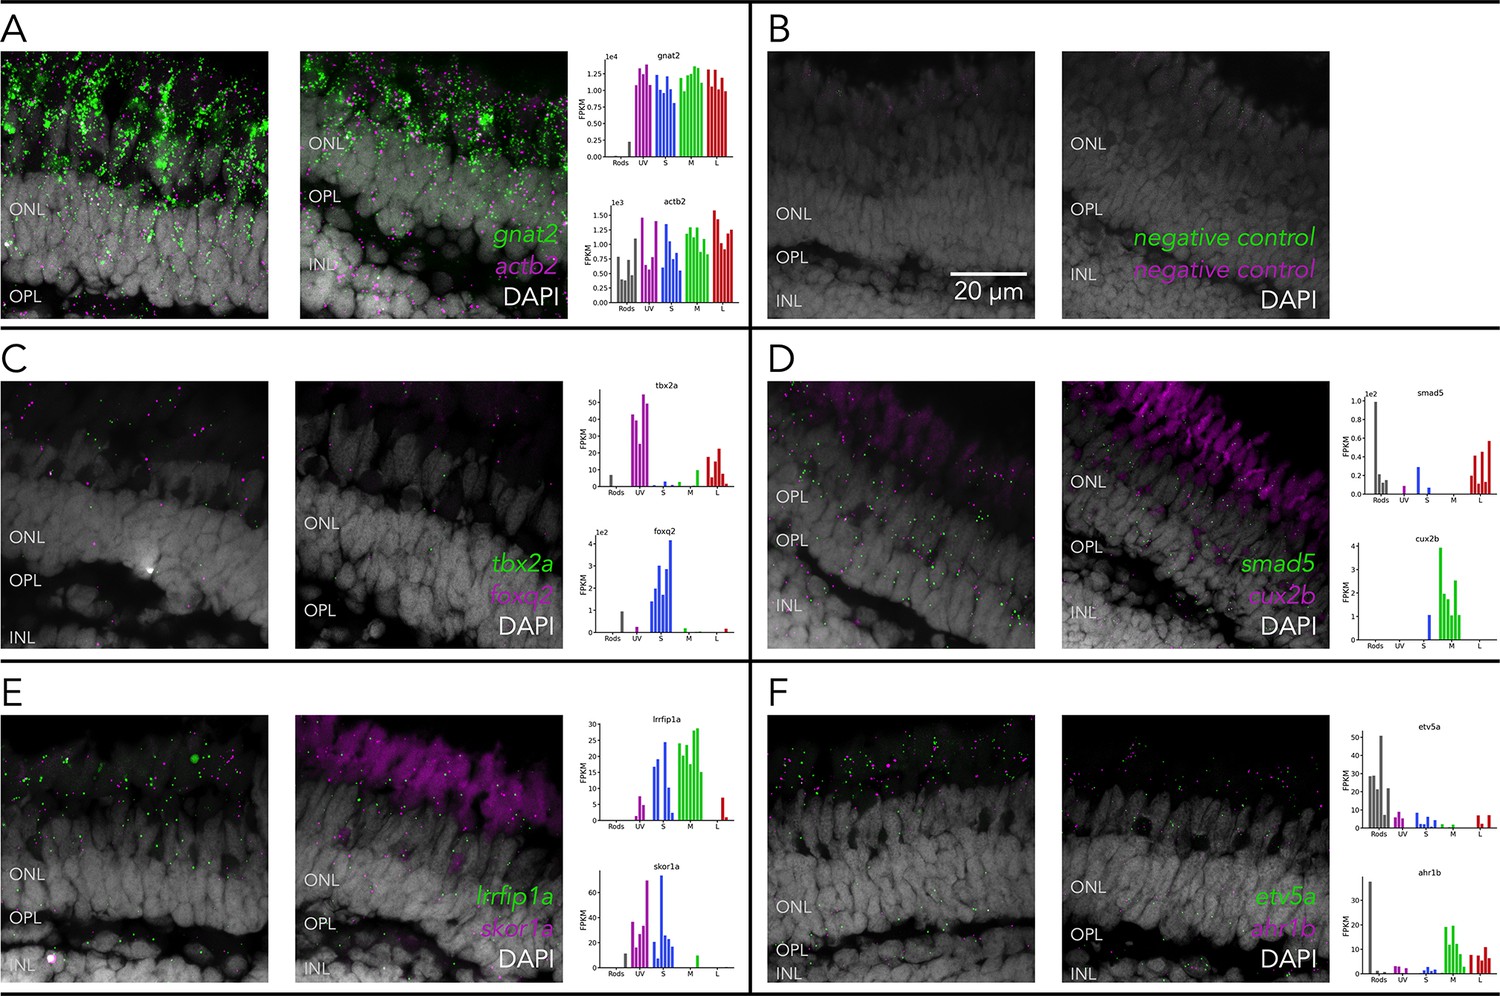
Representative confocal images of fluorescent in-situ hybridizations (RNAscope) performed in fresh-frozen cryosections of adult zebrafish retina, counterstained with a nuclear label (DAPI, gray), to detect transcripts of (A) gnat2 (green) and actb2 (magenta), as positive controls, (B) of negative controls and (C–F) of transcription factors, identified by RNA-seq as differentially expressed (plot insets), including (C) tbx2a (green) and foxq2 (magenta), (D) smad5 (green) and cux2b (magenta), (E) lrrfip1a (green) and skor1a (magenta), (F) etv5a (green) and ahr1b (magenta). For all probes, excluding negative controls, bright fluorescent puncta corresponding to RNA molecules for the target gene, could be detected in the photoreceptor layer. Dimmer and diffuse autofluorescence in the red channel, derived from photoreceptor outer segments, can also be seen in several of the example images. ONL = outer nuclear layer, OPL = outer plexiform layer, INL = inner nuclear layer.
Figure 2—figure supplement 2
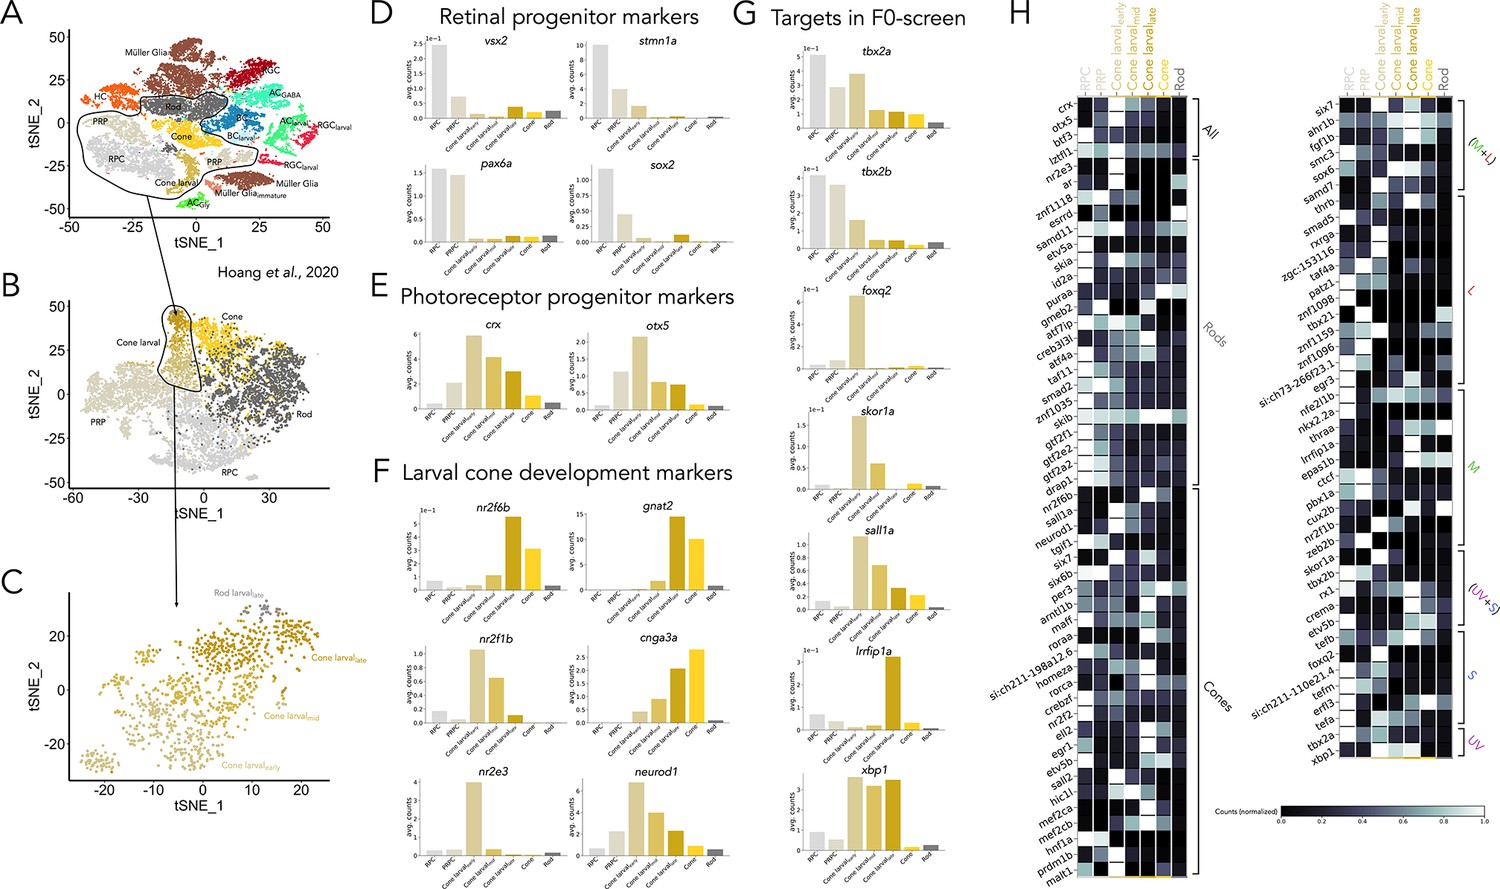
Expression of candidate transcription factors is active during photoreceptor development.
(A) Reproduction of clustering of RNA-seq dataset of wildtype retinal cells including larval and adult cells from Hoang et al., 2020 using tSNE (HC = horizontal cell; BC = bipolar cell; AC = amacrine cell; RGC = retinal ganglion cell). (B) We isolated clusters identified as retinal progenitor cells (RPC), photoreceptor progenitors (PRP), larval photoreceptors and adult photoreceptors for further analysis (black line in A). (C) Larval cones could be further classified into subclusters with distinct gene-expression signatures and that correlated well with developmental age (and not with subtype identity), identified as early, mid and late-stage larval cones. Very few cells could be identified as larval rods. (D–E) Expression of known markers that identify (D) retinal progenitors, including high expression of vsx2 and pax6a, and (E) the transition to photoreceptor progenitors, identified by an increase in the expression of crx and otx5. (F) Stages of larval cone development can be identified by markers that include transcription factors and phototransduction proteins. Early-stage larval cones have low expression of phototransduction genes (like gnat2 or cnga3a) and high expression of neurod1, nr2e3, and nr2f1b. In mid-stage larval cones, expression of phototransduction genes start to increase, and that of neurod1 and nr2e3 decreases, while nr2f1b is maintained. Late-stage larval cones resemble adult photoreceptors, with high expression of phototransduction genes and high expression of nr2f6b. (G) Expression of tbx2a and tbx2b is high in progenitors and present throughout all stages of photoreceptor development. Expression of other targets in the F0 screen, including foxq2, skor1a, sall1a, lrrfip1a, and xbp1 is active during photoreceptor development (H) Developmental expression of transcription factors identified in Figure 2C and E, showing that expression is present during photoreceptor development and not restricted to adult ages. Grey values indicate expression level normalized in each row by the maximal value.
Figure 3 with 6 supplements
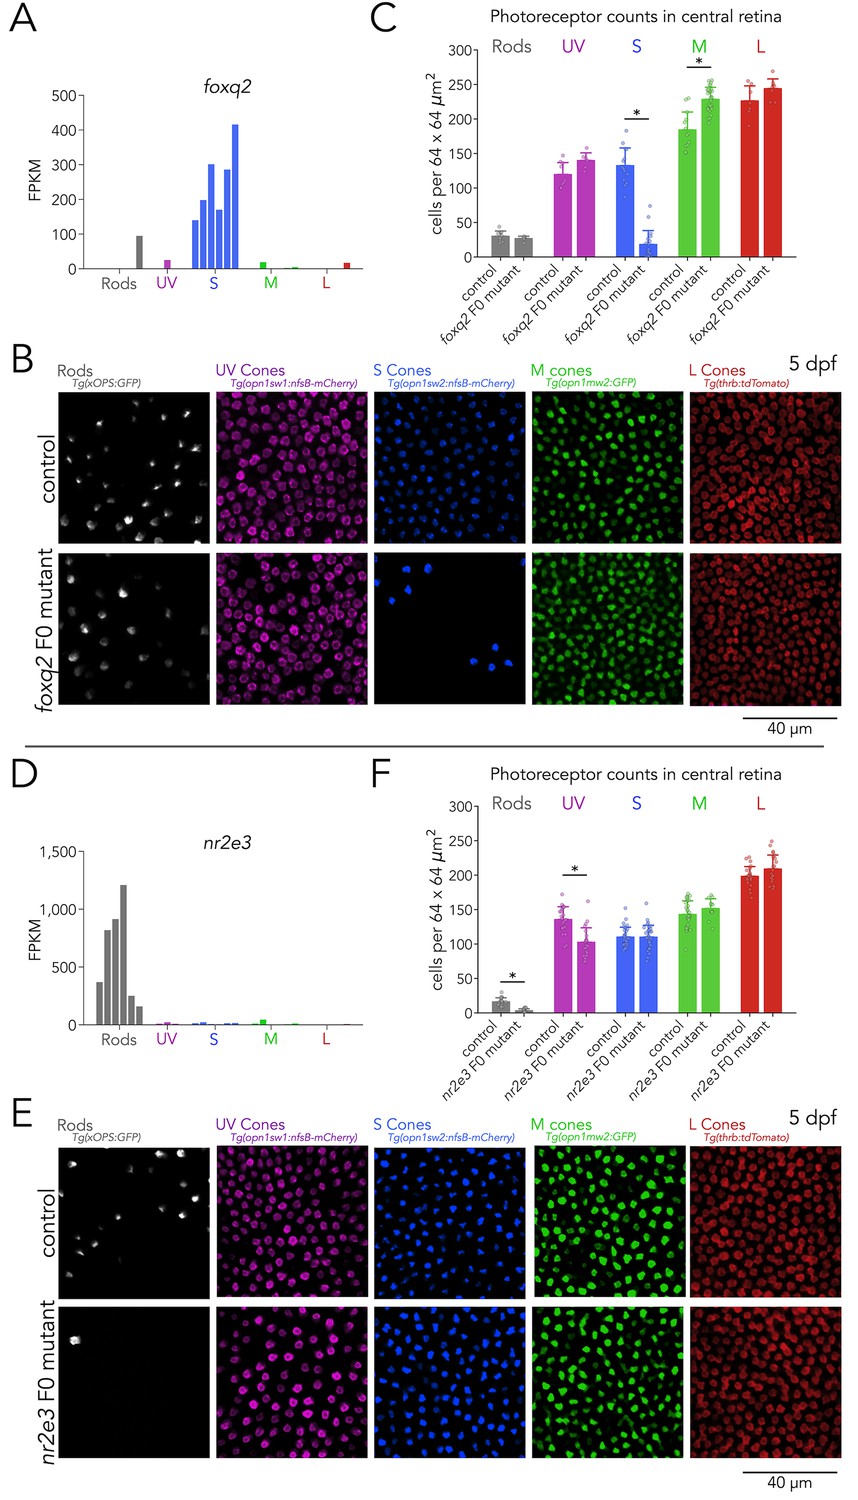
Foxq2 is required for generation of S cones and Nr2e3 for generation of rods.
(A) Expression of foxq2 shows clear S-cone specificity. (B) Mutations in foxq2 cause a loss of S cones. Representative confocal images of the central retina of control (top row) and foxq2 F0 mutant (bottom row) larvae at 5 dpf. Each column corresponds to a transgenic line that labels a unique photoreceptor subtype, pseudo-colored according to photoreceptor subtype. (C) Quantification of photoreceptors in control and foxq2 F0 mutant larvae. Bars represent averages, error bars correspond to standard deviations, and markers correspond to individual retinas. There is a significant ~86% reduction in S cones in foxq2 F0 mutants compared to wildtype (wt) controls (Kruskal-Wallis H=22.93, p=1.6.×10–6,, nwt = 14, nfoxq2=18) and a smaller but significant ~24% increase in the density of M cones (Kruskal-Wallis H=17.55, p=2.8.×10–5, nwt = 13, nfoxq2=28). We found no significant differences in the densities of rods (Kruskal-Wallis H=0.784, p=0.376, nwt = 9, nfoxq2=6), UV cones (Kruskal-Wallis H=3.562, p=0.059, nwt = 9, nfoxq2=6), or L cones (Kruskal-Wallis H=2.267, p=0.132, nwt = 7, nfoxq2=8). (D) Expression of nr2e3 shows enrichment in rods. (E) Mutations in nr2e3 cause a loss of rods. Representative confocal images of the central retina of control (top row) and nr2e3 F0 mutant (bottom row) larvae at 5 dpf. (F) Quantification of photoreceptors in control and nr2e3 F0 mutant larvae. Bars represent averages, error bars correspond to standard deviations, and markers correspond to individual retinas. There is a significant ~80% reduction in rods in nr2e3 F0 mutants compared to controls (Kruskal-Wallis H=26.987, p=2.0 × 10⁻⁷, nwt = 19, nnr2e3=19), a smaller but significant ~25% reduction in UV cones (Kruskal-Wallis H=18.77, p=1.5 × 10⁻⁵, nwt = 24, nnr2e3=24). We found no significant differences in the densities of S cones (Kruskal-Wallis H=0.024, p=0.87, nwt = 30, nnr2e3=32), M cones (Kruskal-Wallis H=1.61, p=0.205, nwt = 30, nnr2e3=12), or L cones (Kruskal-Wallis H=2.407, p=0.12, nwt = 24, nnr2e3=22).
Figure 3—figure supplement 1

Mutations in foxq2 cause a decrease in S opsin positive photoreceptors.
Confocal images of the central retina of 2 control and 2 foxq2 F0 mutant larvae at 5 dpf, labeled with an S opsin antibody (magenta), in an S-cone reporter line (green). In the control images, all GFP-positive cells are also positive for S opsin antibody labeling (the curvature of the larval eye causes some apparent uneven labeling). In foxq2 F0 mutant larvae there is a significant loss of both GFP and S opsin antibody labeling, and remaining GFP-positive cells are also positive for S opsin.
Figure 3—figure supplement 2

Assessment of cone density in foxq2 and nr2e3 F0 mutants.
(A) Representative confocal images of the central retina of control (left top) and foxq2 F0 mutants (right top) showing cone nuclei labeled with DAPI (grey). UV-cone nuclei are displaced towards the inner retina so that, at this depth, UV cones appear as dark spaces (purple dots, bottom panels), allowing separate manual counting from nuclei of S, M and L cones (orange dots, bottom panels). (B) Quantification of UV-cone (purple) and total cone densities (black) in control and foxq2 F0 mutants. Bars represent averages, error bars correspond to standard deviations, and markers correspond to individual retinas. There is no significant change in the density of UV cones (Kruskal-Wallis H=1.228, p=0.248, nwt = 8, nfoxq2=11). or total cones in foxq2 F0 mutants compared to control (Kruskal-Wallis H=3.303, p=0.069, nwt = 8, nfoxq2=11). (C–D) Same as in A and B but for nr2e3 F0 mutants. There is a significant decrease in UV-cone density in nr2e3 F0 mutants compared to control (absolute average loss of 47.5 UV-cones; Kruskal-Wallis H=12.778, p=3.5 x 10⁻⁴, nwt = 9, nnr2e3=13) that is reflected in the total cone density (absolute average loss of 52 cones; Kruskal-Wallis H=5.944, p=0.014, nwt = 9, nnr2e3=13).
Figure 3—figure supplement 3

Skor1a is not required for UV-cone or S-cone specification.
(A) Expression of skor1a across photoreceptors shows enrichment in UV and S cones. (B) Mutations in skor1a do not change UV or S cone densties or disruption of the cone mosaic. Representative confocal images of the central retina of control (top row) and skor1a F0 mutant (bottom row) larvae at 5 dpf. Columns correspond to transgenic line that label UV cones (magenta) or S cones (blue) or to nuclei labeled with DAPI (grey) to reveal the cone mosaic. (C) Quantification of photoreceptor densities in control and skor1a F0 mutant larvae. Bars represent averages, error bars correspond to standard deviations, and markers correspond to individual retinas. There is no significant change in the density of UV cones in skor1a F0 mutants compared to controls (Kruskal-Wallis H=1.885, p=0.169, nwt = 9, nskor1a=9) or of S cones in skor1a F0 mutant compared to controls (Kruskal-Wallis H=3.778, p=0.052, nwt = 9, nskor1a=9) or in total cone densities (Kruskal-Wallis H=4.592, p=0.03, nwt = 6, nskor1a=7).
Figure 3—figure supplement 4

Sall1a is not required for photoreceptor specification.
(A) Expression of sall1a across photoreceptors shows enrichment in all cone subtypes but not rods. (B) Mutations in sall1a do not change rod densities and the cone mosaic is not disrupted. Representative confocal images of the central retina of control (top row) and sall1a F0 mutant (bottom row) larvae at 5 dpf. Columns correspond to a transgenic line that rods or to nuclei labeled with DAPI to reveal the cone mosaic. (C) Quantification of photoreceptor densities in control and sall1a F0 mutant larvae. Bars represent averages, error bars correspond to standard deviations, and markers correspond to individual retinas. There is no significant change in the density of rods in sall1a F0 mutants compared to controls (Kruskal-Wallis H=0.095, p=0.758, nwt = 36, nsall1a=39). Total cone densities are also normal (Kruskal-Wallis H=0.858, p=0.35, nwt = 12, nsall1a=14).
Figure 3—figure supplement 5

Lrrfip1a is not required for M-cone specification.
(A) Expression of lrrfip1a across photoreceptors shows enrichment in M cones. (B) Mutations in lrrfip1a do not change S-cone or M-cone densities and the cone mosaic is not disrupted. Representative confocal images of the central retina of control (top row) and lrrfip1a F0 mutant (bottom row) larvae at 5 dpf. Columns correspond to a transgenic line that S cones (blue) or M cones (green) or to nuclei labeled with DAPI to reveal the cone mosaic. (C) Quantification of photoreceptor densities in control and lrrfip1a F0 mutant larvae. Bars represent averages, error bars correspond to standard deviations, and markers correspond to individual retinas. There is no significant change in the density of S cones in lrrfip1a F0 mutants compared to controls (Kruskal-Wallis H=5.264, p=0.02, nwt = 16, nlrrfip1a=15), or in the density of M cones (Kruskal-Wallis H=1.756, p=0.185, nwt = 16, nsall1a=15). Total cone densities are also normal (Kruskal-Wallis H=1.387, p=0.24, nwt = 9, nlrrfip1a=11).
Figure 3—figure supplement 6

Xbp1 is not required for photoreceptor specification.
(A)xbp1 is expressed in all photoreceptor subtypes but with enrichment in UV cones. (B) Mutations in xbp1 do not change photoreceptor densities and cone mosaic is not disrupted. Representative confocal images of the central retina of control (top row) and xbp1 F0 mutant (bottom row) larvae at 5 dpf. Columns correspond to a transgenic line that labels a photoreceptor subtypes or to nuclei labeled with DAPI to reveal the cone mosaic. (C) Quantification of photoreceptor densities in control and xbp1 F0 mutant larvae. Bars represent averages, error bars correspond to standard deviations, and markers correspond to individual retinas. There is no significant change in the density of rods in xbp1 F0 mutants (Kruskal-Wallis H=0.093, p=0.76, nwt = 11, nxbp1=9), UV cones (Kruskal-Wallis H=0.468, p=0.49, nwt = 11, nxbp1=9), S cones (Kruskal-Wallis H=0.008, p=0.93, nwt = 9, nxbp1=9), or of M cones (Kruskal-Wallis H=0.008, p=0.93, nwt = 9, nxbp1=9) compared to controls. Total cone densities are also normal (Kruskal-Wallis H=0.335, p=0.56, nwt = 8, nxbp1=7).
Figure 4 with 2 supplements
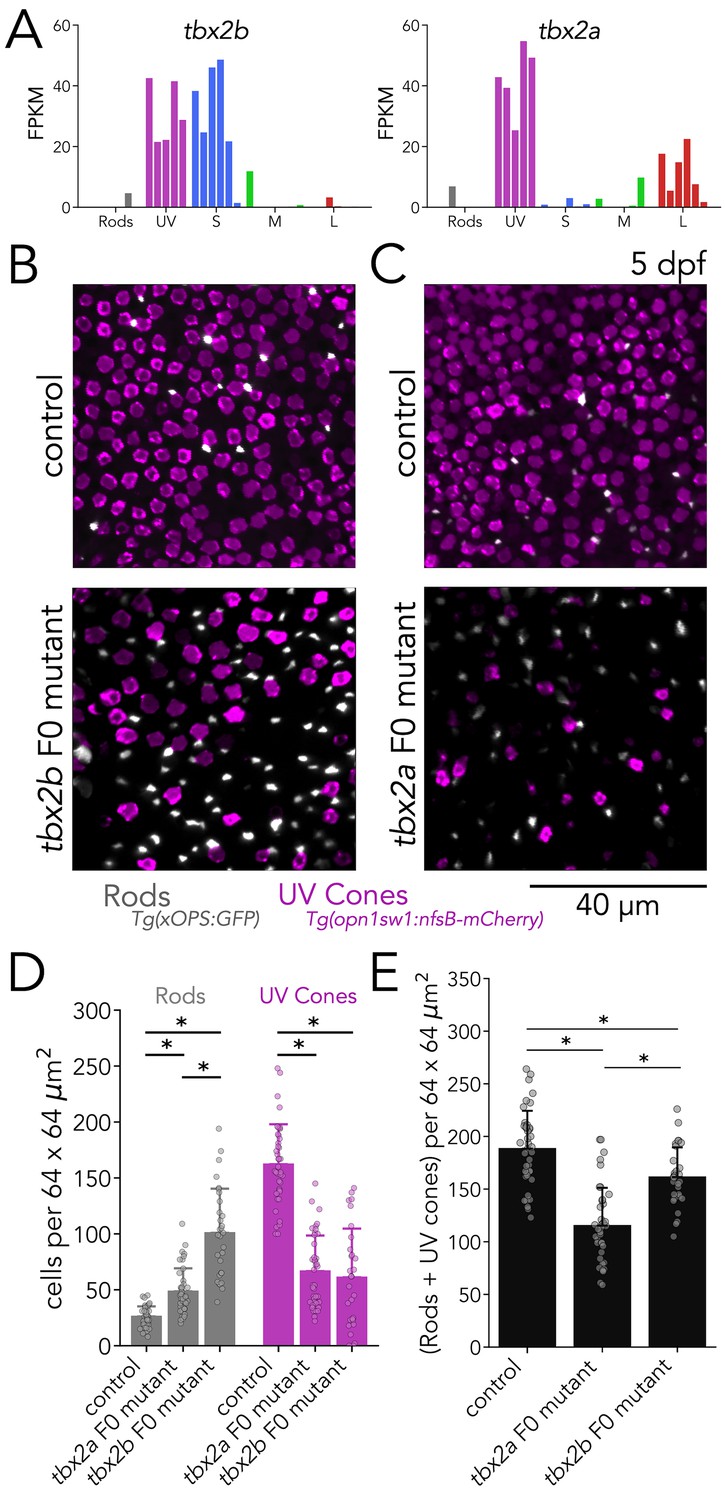
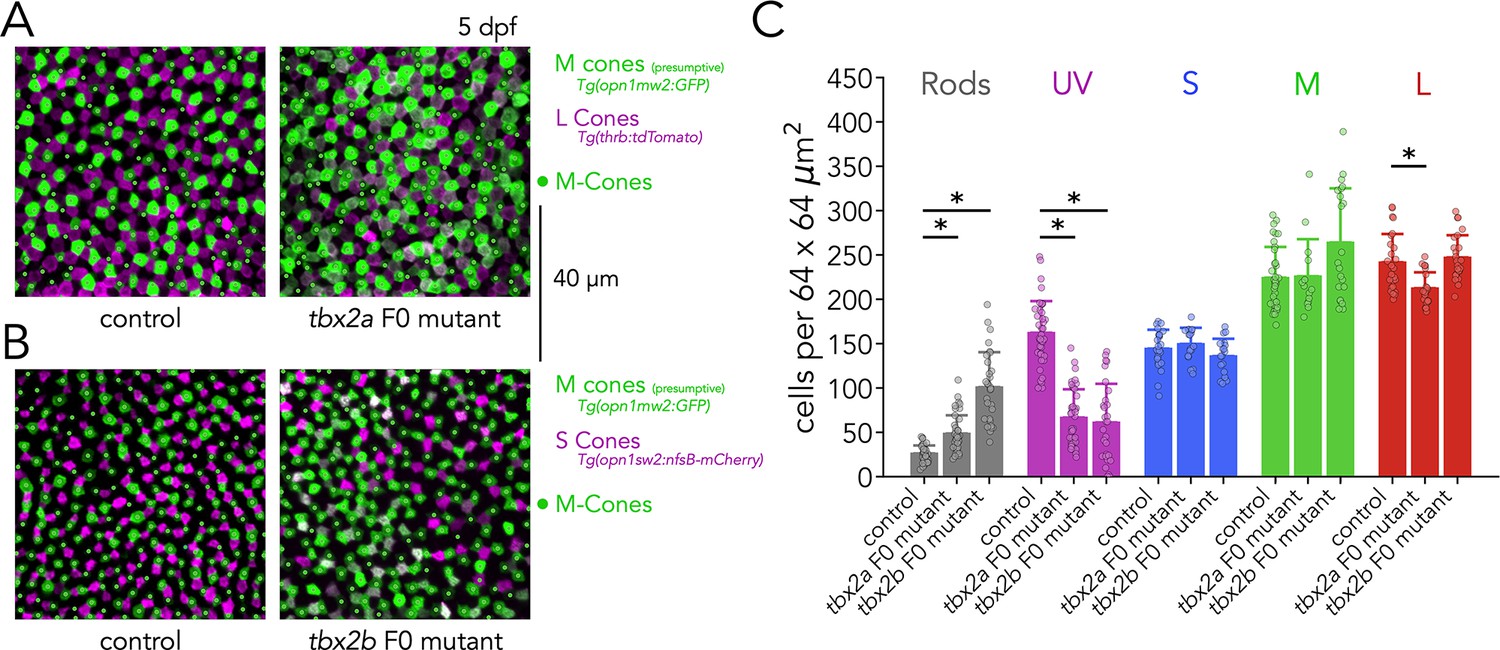
Tbx2a and Tbx2b are independently required for generation of UV cones.
(A) tbx2b is expressed by UV and S cones (left), while tbx2a is expressed by UV and L cones (right). (B) Mutations in tbx2b cause a loss of UV cones and an increase in rods. Representative confocal images of the central retina of control and tbx2b F0 mutants at 5 dpf, in double transgenic larvae with labeled UV cones (magenta) and rods (grey). (C) Mutations in tbx2a also cause a loss of UV cones and an increase in rods. Representative confocal images of the central retina of control and tbx2a F0 mutants at 5 dpf, in the same double transgenic lines. (D) Quantification of rods and UV cones in control, tbx2a and tbx2b F0 mutant larvae. Bars represent averages, error bars correspond to standard deviations, and markers correspond to individual retinas. Compared to controls, both tbx2 F0 mutants have a significant increase in rods (1.86-fold for tbx2a and 3.86-fold for tbx2b, Kruskal-Wallis H=71.725, p=2.67 × 10⁻¹⁶, nwt = 40, ntbx2a=40, ntbx2b=30; Conover-Iman posthoc corrected p-values: control vs. tbx2a p=2.96 × 10⁻¹¹, control vs. tbx2b p=4.16 × 10⁻²⁶) but this increase significantly smaller in tbx2a F0 mutants (tbx2a vs. tbx2b p=2.25 × 10⁻¹⁰); both tbx2 F0 mutants have a marked decrease in UV cones (58.91% for tbx2a and 62.32% for tbx2b, Kruskal-Wallis H=66.907, p=2.96 × 10⁻¹⁵, nwt = 40, ntbx2a=40, ntbx2b=29; Conover-Iman posthoc corrected p-values: control vs. tbx2a p=1.71 × 10⁻¹⁹, control vs. tbx2b p=5.41 × 10⁻¹⁹); this increase was not significantly different between tbx2a and tbx2b F0 mutants (tbx2a vs. tbx2b p=1.0). (E) Quantification of the sum of rods and UV cones in control, tbx2a and tbx2b F0 mutants. Bars represent averages, error bars correspond to standard deviations, and markers correspond to individual retinas. Compared to control both tbx2a and tbx2b mutants have a significant decrease in the sum of rods and UV cones, but this decrease is significantly more pronounced in tbx2a F0 mutants (38.81% for tbx2a and 14.34% for tbx2b, Kruskal-Wallis H=50.156, p=1.29 × 10⁻¹¹, nwt = 40, ntbx2a=40, ntbx2b=29; Conover-Iman posthoc corrected p-values: control vs. tbx2a p=2.38 × 10⁻¹⁵, control vs. tbx2b p=6.72 × 10⁻³, tbx2a vs. tbx2b p=5.92 × 10⁻⁷).
Figure 4—figure supplement 1

Assessment of total cone density in tbx2a and tbx2b F0 mutants.
(A) Representative confocal images of the central retina of control (left), tbx2a (center), and tbx2b F0 mutants (right) in double transgenic larvae that label rods with GFP (green) and UV cones with mCherry (magenta), and overlayed with manual counts of UV cones (purple dots, corresponding to dark spaces in the nuclear staining) and of S, M and L cone nuclei (orange dots). Of note, we find that in control larvae ~12% of UV-cones are not mCherry positive (purple dots in top panels). (B) Quantification of UV-cone (purple) and total cone densities (black) in control, tbx2a, and tbx2b F0 mutants. Bars represent averages, error bars correspond to standard deviations, and markers correspond to individual retinas. In both mutants there is marked decrease in the density of UV cones (Kruskal-Wallis H=46.811, p=6.8 × 10⁻¹¹, nwt = 25, ntbx2a=24, ntbx2b=23; Conover-Iman posthoc corrected p-values: control vs. tbx2a p=5.30 × 10⁻¹⁴, control vs. tbx2b p=5.85 × 10⁻¹⁵, tbx2a vs. tbx2b p=1.0) and a significant yet smaller decrease in the total cone density (Kruskal-Wallis H=17.132, p=1.9 × 10⁻⁴; Conover-Iman posthoc corrected p-values: control vs. tbx2a p=0.0039, control vs. tbx2b p=8.43 × 10⁻⁵, tbx2a vs. tbx2b p=0.75).
Figure 4—figure supplement 2

Mutations in tbx2a and tbx2b cause multiple changes in opsin expression.
Quantification of opsin expression using real-time quantitative PCR, using the standard curve method and relative to expression of actin (actb2). We ran all measurements in triplicate and considered a value significant if p<0.05. We were not able to detect expression of opn1mw3 or opn1mw4. Comparisons between controls (nwt = 5), tbx2a (n=5) and tbx2b F0 mutants (ntbx2a=5) showed a significant increase in the expression of rhodopsin in tbx2b F0 mutants (rho, Kruskal-Wallis H=10.063, p=0.006; Conover-Iman posthoc corrected p-values: control vs. tbx2a p=0.053, control vs. tbx2b p=0.014, tbx2a vs. tbx2b p=2.2 × 10⁻⁴), a significant decrease of UV-opsin expression in both mutants (opn1sw1, Kruskal-Wallis H=11.571, p=0.003; Conover-Iman posthoc corrected p-values: control vs. tbx2a p=3.9 × 10⁻⁶, control vs. tbx2b p=0.003, tbx2a vs. tbx2b p=0.003), a significant increase in S-opsin expression in tbx2b F0 mutants (opn1sw2, Kruskal-Wallis H=6.486, p=0.039; Conover-Iman posthoc corrected p-values: control vs. tbx2a p=1.00, control vs. tbx2b p=0.0456, tbx2a vs. tbx2b p=0.0386), a significant increase in M-opsin expression in both mutants (opn1mw1, Kruskal-Wallis H=8.340, p=0.015; Conover-Iman posthoc corrected p-values: control vs. tbx2a p=0.396, control vs. tbx2b p=0.045, tbx2a vs. tbx2b p=0.003; opn1mw2, Kruskal-Wallis H=10.520, p=0.005; Conover-Iman posthoc corrected p-values: control vs. tbx2a p=0.019, control vs. tbx2b p=8.5 × 10⁻⁵, tbx2a vs. tbx2b p=0.011).
Figure 5
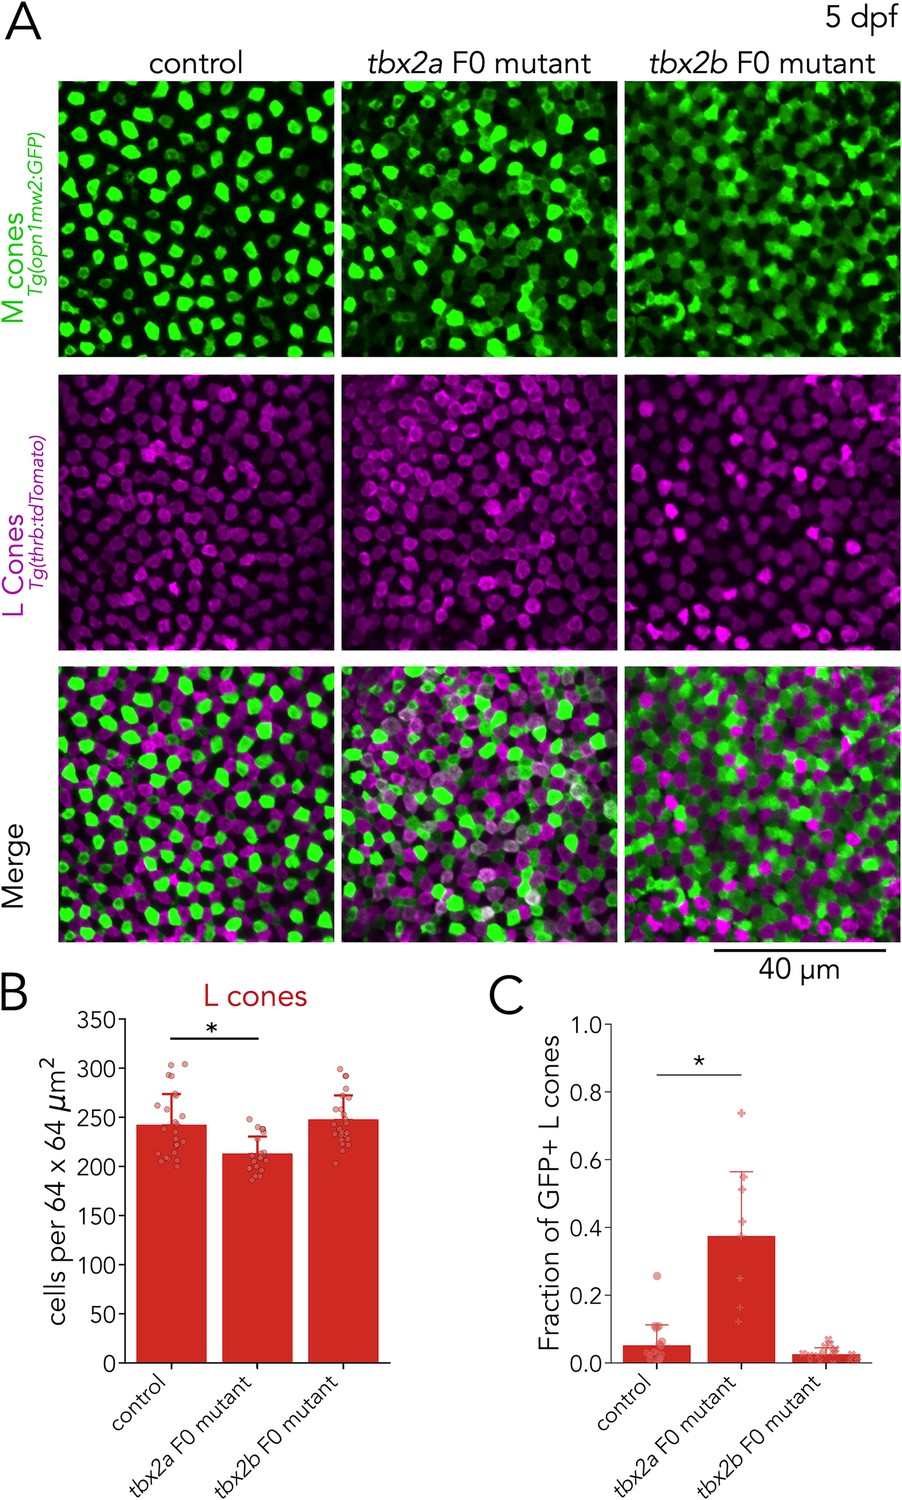
Tbx2a inhibits M-opsin expression in L cones.
(A) Representative confocal images of the central retina of control, tbx2a and tbx2b F0 mutants at 5 dpf, in double transgenic larvae that label M cones — or M-opsin expressing cells — with GFP (green) and L cones with tdTomato (magenta). Both tbx2a and tbx2b F0 mutants display an increase in GFP-positive cells. In tbx2a F0 mutants, increase in GFP signal is restricted to tdTomato-positive cells which appear as double-positive (white) in merged images, while in tbx2b F0 mutants, increase in GFP signal is excluded from tdTomato-positive cells, producing a decrease in the space without fluorescence. (B) Compared to controls, tbx2a F0 mutants have a significant decrease in L cones (12.12% for tbx2a, Kruskal-Wallis H=18.264, p=1.08 × 10⁻⁴, nwt = 25, ntbx2a=21, ntbx2b=24; Conover-Iman posthoc corrected p-values: control vs. tbx2a P=1.21 × 10⁻³, control vs. tbx2b p=0.88, tbx2a vs. tbx2b p=3.98 × 10⁻⁵) (C) Quantification of the fraction of GFP-positive L cones (double positive cells in A) reveals a significant increase only in tbx2a F0 mutants (Kruskal-Wallis H=20.821, p=3.01 × 10⁻⁵, nwt = 18, ntbx2a=9, ntbx2b=17; Conover-Iman posthoc corrected p-values: control vs. tbx2a p=2.87 × 10⁻⁵, control vs. tbx2b p=0.63, tbx2a vs. tbx2b p=1.13 × 10⁻⁶).
Figure 6 with 1 supplement
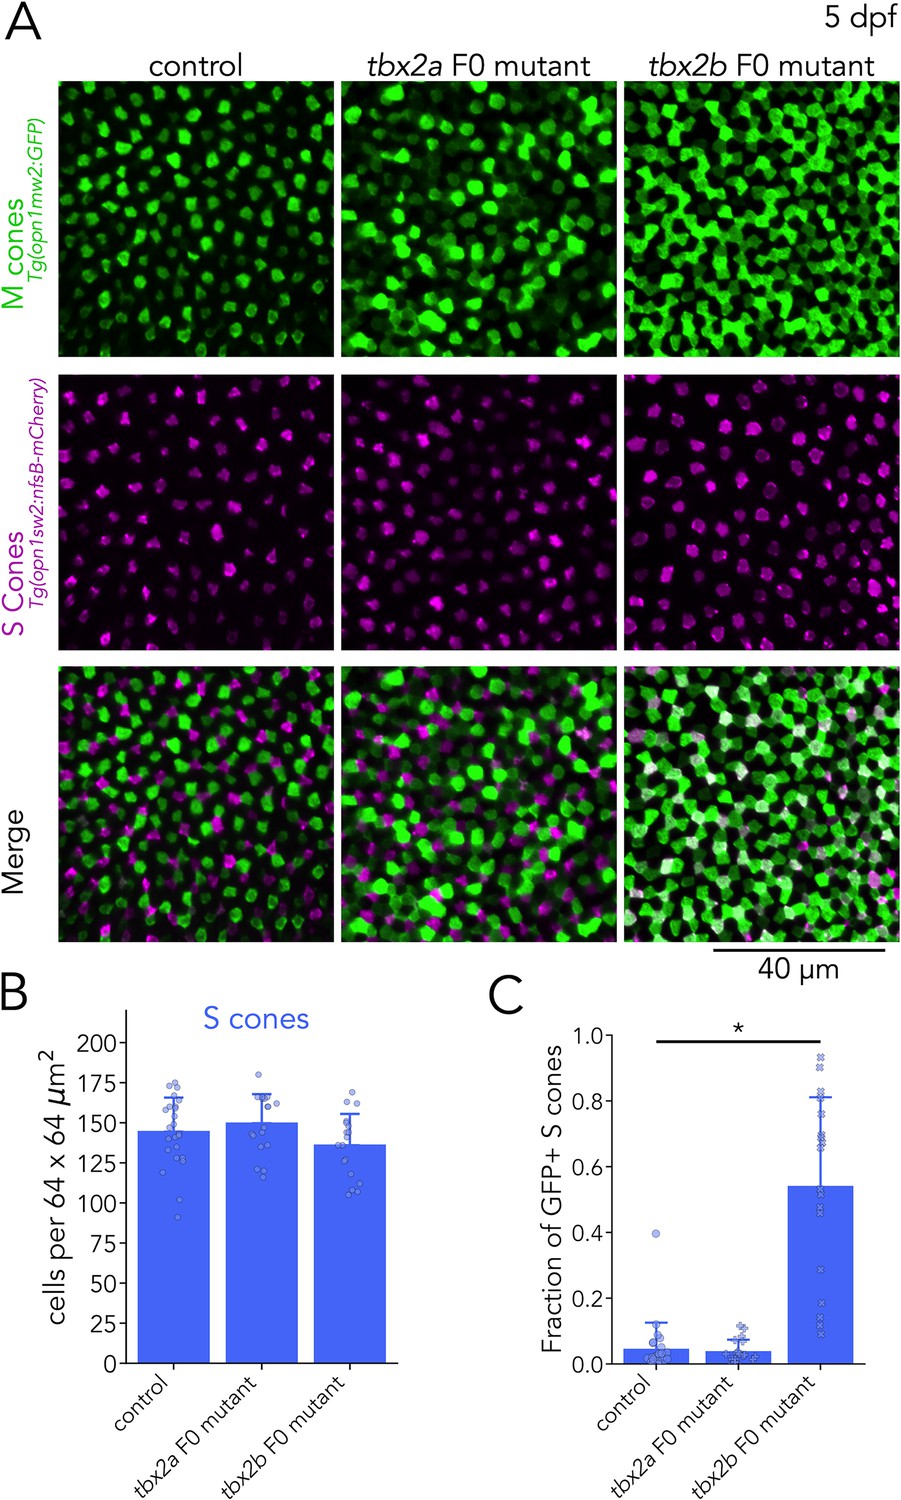
Tbx2b inhibits M-opsin expression in S cones.
(A) Representative confocal images of the central retina of control, tbx2a and tbx2b F0 mutants at 5 dpf, in double transgenic larvae that label M cones — or M-opsin expressing cells — with GFP (green) and S cones with mCherry (magenta). Both tbx2a and tbx2b F0 mutants display an increase in GFP-positive cells. In tbx2a F0 mutants, increase in GFP signal is excluded from mCherry-positive cells, producing a decrease in the space without fluorescence, while in tbx2b F0 mutants, increase in GFP signal is restricted to mCherry-positive cells, which appear as double positive (white) in the merged images. (B) Quantification of S cones in the central retina shows no significant changes in either tbx2a or tbx2b F0 mutants compared to control (Kruskal-Wallis H=3.668, p=0.16, nwt = 24, ntbx2a=18, ntbx2b=18). (C) Quantification of the fraction of GFP-positive S cones (double positive cells in A) reveals a significant increase only in tbx2b F0 mutants (Kruskal-Wallis H=35.584, p=1.87 × 10⁻⁸, nwt = 24, ntbx2a=18, ntbx2b=18; Conover-Iman posthoc corrected p-values: control vs. tbx2a p=2.87 × 10⁻⁵, control vs. tbx2b p=0.63, tbx2a vs. tbx2b p=1.13 × 10⁻⁶).
Figure 6—figure supplement 1
Assessment of M-cone density in tbx2a and tbx2b F0 mutants.
(A) Representative confocal images of the central retina of control (left) and tbx2a F0 mutants (right) in double transgenic larvae that label M-opsin expressing cells with GFP (green) and L cones with tdTomato (magenta), overlayed with manual counts of M cones (green dots), obtained by avoiding double positive cells. (B) Representative confocal images of the central retina of control (left) and tbx2b F0 mutant (right) in double transgenic larvae that label M-opsin expressing cells with GFP (green) and S cones with tdTomato (magenta), overlayed with manual counts of M cones (green dots), obtained by avoiding double positive cells. (C) Summary quantification of photoreceptor subtypes in control, tbx2a and tbx2b F0 mutants, replicating counts in Figure 4D, Figure 5B, and Figure 6B, and now including M-cone counts. There are no significant changes in the density of M cones (Kruskal-Wallis H=5.778, p=0.055, nwt = 35, ntbx2a=14, ntbx2b=21).
Tables
Table 1
Zebrafish transgenic lines.
| Label | Transgenic line | Reference |
|---|---|---|
| Rods | Tg(xOPS:GFP)fl1Tg | Fadool, 2003 |
| UV cones | Tg(–5.5opn1sw1:GFP)kj9Tg | Takechi et al., 2003 |
| UV cones | Tg(opn1sw1:nfsB-mCherry)q28Tg | Yoshimatsu et al., 2014 |
| S cones | Tg(–3.5opn1sw2:GFP)kj11Tg | Takechi et al., 2008 |
| S cones | Tg(opn1sw2:nfsB-mCherry)q30Tg | Yoshimatsu et al., 2014 |
| M cones | Tg(opn1mw2:GFP)kj4Tg | Tsujimura et al., 2007 |
| L cones | Tg(thrb:tdTomato)q22Tg | Suzuki et al., 2013 |
Table 2
crRNA sequences.
| Gene | gRNA | Efficiency |
|---|---|---|
| foxq2 | TCATTTCTGGGCAATTCACCCGG CCCATCCGTTATTGTGCTTCCCG | 95% (21/22) |
| nr2e3 | CCTGGAAAGGTCCTGAACACGGG TATGGAATATACGCTTGCAACGG | 100% (16/16) |
| tbx2a | TAACGATATGAAACCTGGGTTGG GACAGCTATAAAATCGGTCTCGG GGCTCTAACGATATGAAACCTGG | 91% (30/33) |
| tbx2b | TATCGTTGGCTCTCACAATATGG CAAGGTATGTACCCATATTTTGG CGGAAGCTTCAGAATATCGTTGG | 83% (19/23) |
| skor1a | CCTCTGCAAATCCTTTCTCGGGG CGCCAGGTACAATAGCTCCAGGG GTTTCACACGAGTGCGCCTGGGG | 94% (17/18) |
| xbp1 | AAATGGTCGTAGTTACAGCAGGG GCTTCGACCGGCGCGACACAGGG CCGGCGCGACACAGGGCGGGTAC | 93% (13/14) |
| sall1a | CCCACTCAGTGGTGTTGGAACTG GGAACTGGCCATGGAACGCTGGG ATGGAACGCTGGGAAGCACTGGG | 96% (23/24) |
| lrrfip1a | CCGTTTGGCAGCGAAGAGAGCGG CCCTGCAGGCTGAAGCCCGTTTG TGAGATCAGAATGAAAGAACTGG | 100% (16/16) |
Key resources table
| Reagent type (species) or resource | Designation | Source or reference | Identifiers | Additional information |
|---|---|---|---|---|
| Gene (Danio rerio) | GRCz11 | GenBank | RefSeq: GCF_000002035.6 GenBank: GCA_000002035.4 | |
| Strain, strain background (Danio rerio) | Tg(xOPS:GFP)fl1Tg | Fadool, 2003 | ZFIN:ZDB-ALT-080517–1 | |
| Strain, strain background (Danio rerio) | Tg(–5.5opn1sw1:GFP)kj9Tg | Takechi et al., 2003 | ZFIN: ZDB-ALT-080227–1 | |
| Strain, strain background (Danio rerio) | Tg(opn1sw1:nfsB-mCherry)q28Tg | Yoshimatsu et al., 2014 | ZFIN:ZDB-ALT-160425–1 | |
| Strain, strain background (Danio rerio) | Tg(–3.5opn1sw2:GFP)kj11Tg | Takechi et al., 2008 | ZFIN: ZDB-ALT-090622–2 | |
| Strain, strain background (Danio rerio) | Tg(opn1sw2:nfsB-mCherry)q30Tg | Yoshimatsu et al., 2014 | ZFIN: ZDB-ALT-160425–3 | |
| Strain, strain background (Danio rerio) | Tg(opn1mw2:GFP)kj4Tg | Tsujimura et al., 2007 | ZFIN: ZDB-ALT-071206–2 | |
| Strain, strain background (Danio rerio) | Tg(thrb:tdTomato)q22Tg | Suzuki et al., 2013 | ZFIN: ZDB-ALT-131118–3 | |
| Antibody | Anti-zebrafish S opsin (Rabbit polyclonal) | Kerafast | Cat# EJH012 | Immunolabelign (1:200) |
| Antibody | anti-rhodopsin [1D4] (Mouse monoclonal) | Abcam | Cat# ab5417 [1D4] | Labels L opsin in zebrafish Immunolabeling (1:200) |
| Software, algorithm | HiSat2 | Kim et al., 2019 | ||
| Software, algorithm | Stringtie | Pertea et al., 2016 | ||
| Software, algorithm | DeSeq2 | Love et al., 2014 | ||
| Software, algorithm | Seurat | Satija et al., 2015 | Seurat v4.0 | https://satijalab.org/seurat/ |
| Software, algorithm | R/Rstudio | R Development Core Team, 2021; RStudio, 2020 | R version 4.2.0 | https://www.r-project.org/ https://posit.co/ |
| Software, algorithm | Python | https://www.python.org/ | Python 3.10 | |
| Software, algorithm | JupyterLab | https://jupyter.org/ | JupterLab version 3.2.1 | |
| Software, algorithm | Napari | contributors, 2019 | Napari0.4.17 | https://napari.org/ |
| Software, algorithm | Cellpose | Stringer et al., 2021 | Cellpose2.0 | https://www.cellpose.org/ |
| Software, algorithm | FIJI/ImageJ | Schindelin et al., 2012 | FIJI | https://imagej.net/software/fiji/ |
Table 3
Primer sequences for genotyping.
| Gene | Primer (5’ — 3’) | Product size |
|---|---|---|
| foxq2 F | TGCTCTTCAAACAGGACAAGAA | 406 bp |
| foxq2 R | TTCCAGCACATGCAGAAATAAT | |
| nr2e3 F | TTCAGACAGCATAGGGTGACAT | 253 bp |
| nr2e3 R | CTCACCTGTAGATGAGTCTGCG | |
| tbx2a F | CGTTCATTCGAATTCATTGTGT | 462 bp |
| tbx2a R | TGTTTTGATGTCGCTGATTTTC | |
| tbx2b F | TGACGAGCACTAATGTCTTCCT | 309 bp |
| tbx2b R | GCATCGCAGAACGAAAGTAGAT | |
| skor1a F | CTACAACGAAATTCACAACCGA | 349 bp |
| skor1a R | GCGGTGCGAATGAAATATAAA | |
| xbp1 F | ATTTCCCACCCCTAATCAAAAC | 269 bp |
| xbp1 R | GGCTCAGATGTGTGAGTCTCTG | |
| sall1a F | ATACTTGACAAAGAGGAGGCCA | 179 bp |
| sall1a R | TGAGGTAGTGAGGCAGAGATGA | |
| lrrfip1a F | CGATTCCACTTCCTCAATTGTT | 281 bp |
| lrrfip1a R | AGCACACTGCCTGAATAAAACAT |
Table 4
qPCR primers.
| Gene | Primer (5’ to 3’) |
|---|---|
| rho F | TCCGAGACCACACAGCG |
| rho R | CTGCTTGTTCATGCAGATG |
| opn1sw1 F | ATGGTCCTTGGCTGTTCTGG |
| opn1sw1 R | CCTCGGGAATGTATCTGCTCC |
| opn1sw2 F | GGAGGAATGGTGAGTTTGTG |
| opn1sw2 R | GGTCTTGAAGGTAAAGTTCC |
| opn1mw1 F | CAGCCCAGCACAAGAAACTC |
| opn1mw1 R | AGAGCAACCTGACCTCCAAGT |
| opn1mw2 F | TTTTTGGCTGGTCCCGATACA |
| opn1mw2 R | CAGGAACGCAGAAATGACAGC |
| opn1mw3 F | TGCTTTCGCTGGGATTGGATT |
| opn1mw3 R | CCCTCTGGAATATACCTTGACCA |
| opn1mw4 F | CACGCTTTCGCAGGATGC |
| opn1mw4 R | CGGAATATACCTGGACCAAC |
| opn1lw1 F | CCCACACTGCATCTCGACAA |
| opn1lw1 R | AAGGTATTCCCCATCACTCCAA |
| opn1lw2 F | AGAGGGAAGAACTGGACTTTCAGA |
| opn1lw2 R | TTCAGAGGAGTTTTGCCTACATATGT |
| actb2 F | GTACCACCAGACAATACAGT |
| actb2 R | CTTCTTGGGTATGGAATCTTGC |
Additional files
-
Transparent reporting form
- https://cdn.elifesciences.org/articles/81579/elife-81579-transrepform1-v1.pdf
-
Supplementary file 1
Differential gene expression in zebrafish photoreceptors.
Collection of CSV files containing output of differential gene expression analysis using DeSEQ2, along relevant directions (rods vs. cones; (UV+S) vs. (M+L); M vs. L; UV vs. S) and including counts (in FPKM) for all detected genes.
- https://cdn.elifesciences.org/articles/81579/elife-81579-supp1-v1.zip
-
Supplementary file 2
Differential transcription factor expression in zebrafish photoreceptors: rods vs. cones.
CSV file containing transcription factors with significant differential expression between rod and cone samples.
- https://cdn.elifesciences.org/articles/81579/elife-81579-supp2-v1.zip
-
Supplementary file 3
Differential transcription factor expression in zebrafish photoreceptors: cone subtypes.
Collection of CSV files containing transcription factors with significant differential expression between cone subtypes.
- https://cdn.elifesciences.org/articles/81579/elife-81579-supp3-v1.zip
-
Supplementary file 4
Transcriptomic dataset of adult zebrafish photoreceptors for Seurat.
Transcriptomic data from zebrafish adult photoreceptors, converted to .rds object, for direct use in Seurat v3.0.
- https://cdn.elifesciences.org/articles/81579/elife-81579-supp4-v1.zip
Download links
A two-part list of links to download the article, or parts of the article, in various formats.
Downloads (link to download the article as PDF)
Open citations (links to open the citations from this article in various online reference manager services)
Cite this article (links to download the citations from this article in formats compatible with various reference manager tools)
Transcription factors underlying photoreceptor diversity
eLife 12:e81579.
https://doi.org/10.7554/eLife.81579


