Community composition shapes microbial-specific phenotypes in a cystic fibrosis polymicrobial model system
- Department of Microbiology and Immunology, Geisel School of Medicine at Dartmouth, United States
- Centre Armand-Frappier Santé Biotechnologie, Institut National de la Recherche Scientifique, Canada
Figures
Figure 1 with 6 supplements
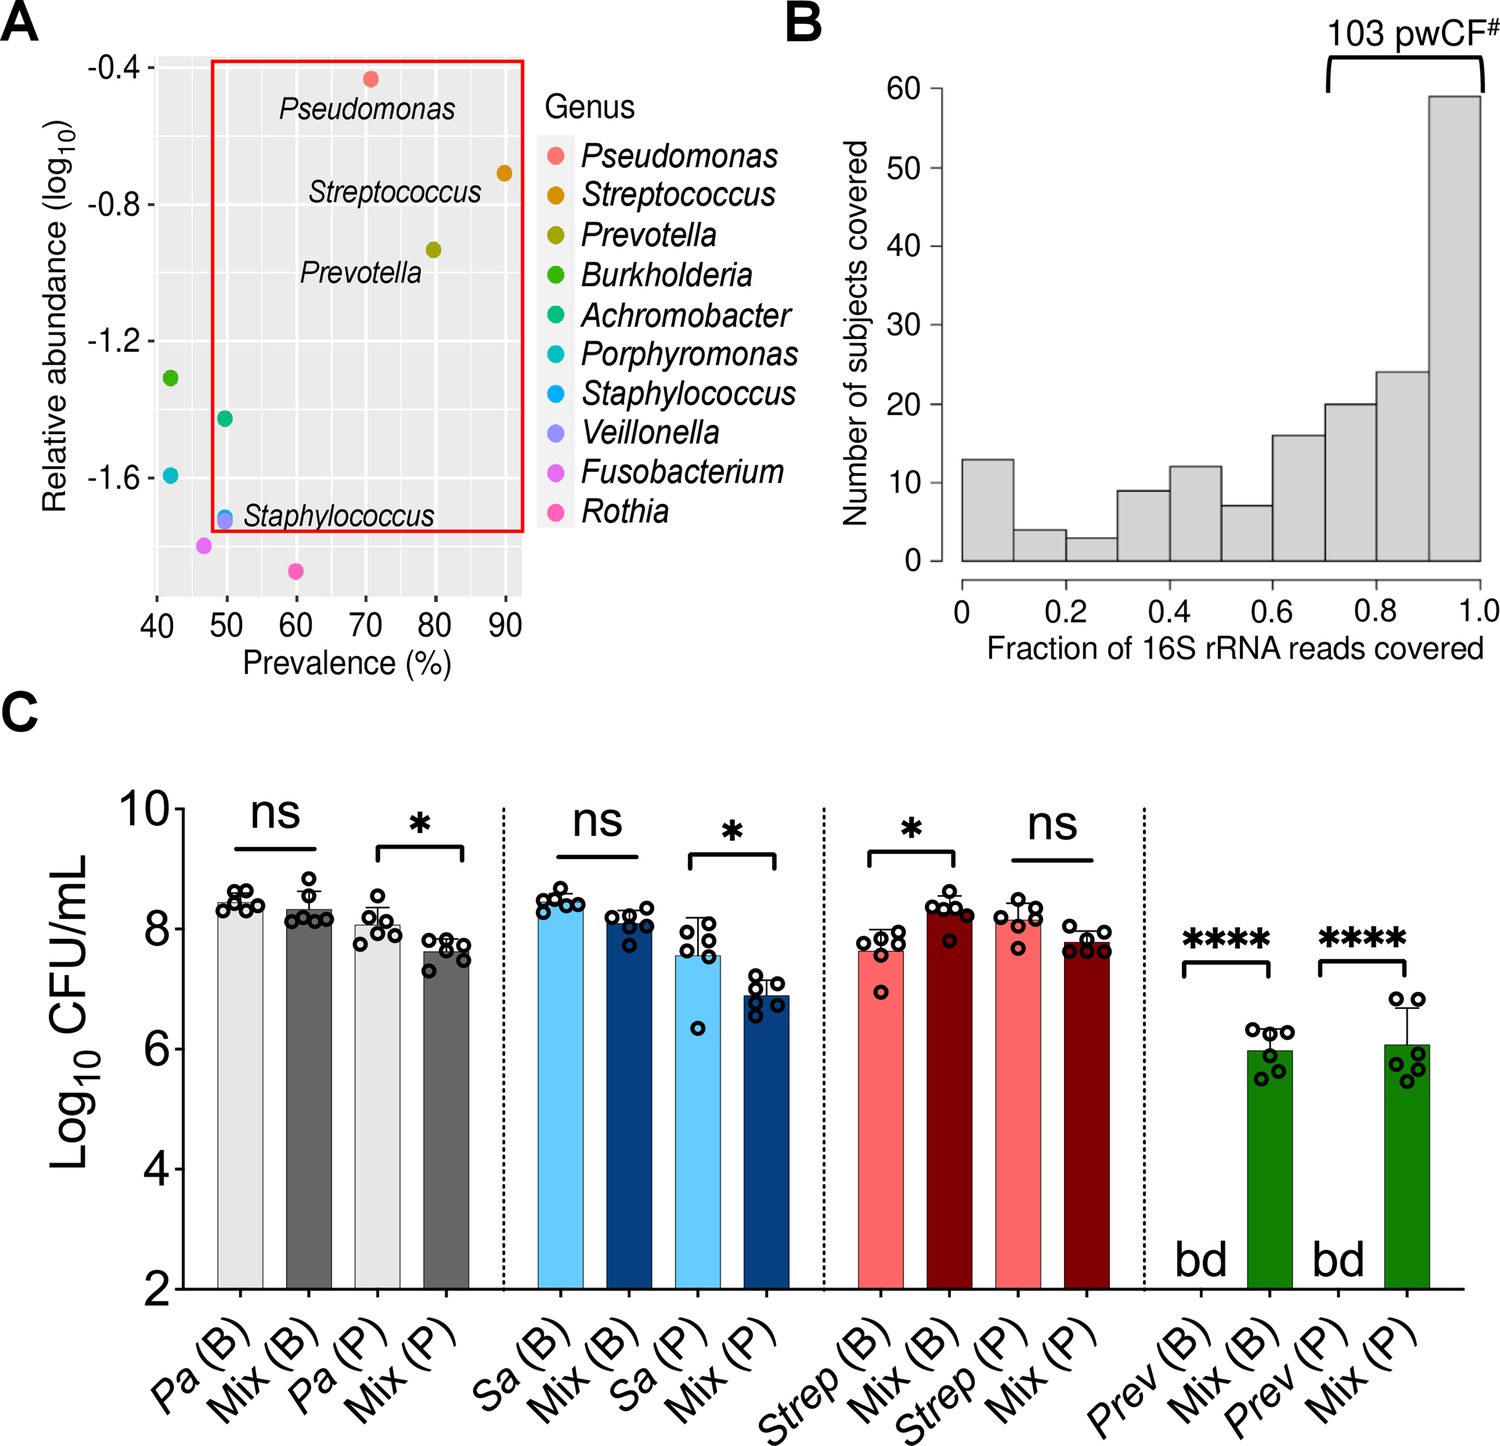
Leveraging clinical microbiome data sets with computational analyses to identify communities and community members to model in vitro.
(A) Relative 16S rRNA gene abundance and prevalence of the top 10 cystic fibrosis (CF) lung pathogens in the 167 persons with CF (pwCF) data set used as the basis for developing the in vitro mixed community, as reported by Hampton et al., 2021. (B) Number of unique samples for which >70% of 16S rRNA reads are associated with the combined presence of Pseudomonas, Staphylococcus, Streptococcus, and Prevotella. #Indicates the number of samples (103) that meet this criterion from the total sample size of 167 pwCF. (C) Colony forming units (CFUs) counts of each microbial member grown as a monoculture and in a mixed community (Mix) for biofilm (B) and planktonic (P) fractions. CFUs were performed by plating on medium selective for the growth of each microorganism. Each data point presented in a column represents the average from at least three technical replicates performed at least on three different days (n=6). Statistical analysis was performed using ordinary one-way ANOVA and Tukey’s multiple comparisons posttest with *, p<0.05; ****, p<0.0001, ns = non-significant. Error bars represent SD. Pa = Pseudomonas aeruginosa, Sa = Staphylococcus aureus, Strep = Streptococcus sanguinis, Prev = Prevotella melaninogenica, and bd = below detection.
Figure 1—figure supplement 1
Leveraging clinical microbiome data sets with computational analyses to identify communities and community members to model in vitro.
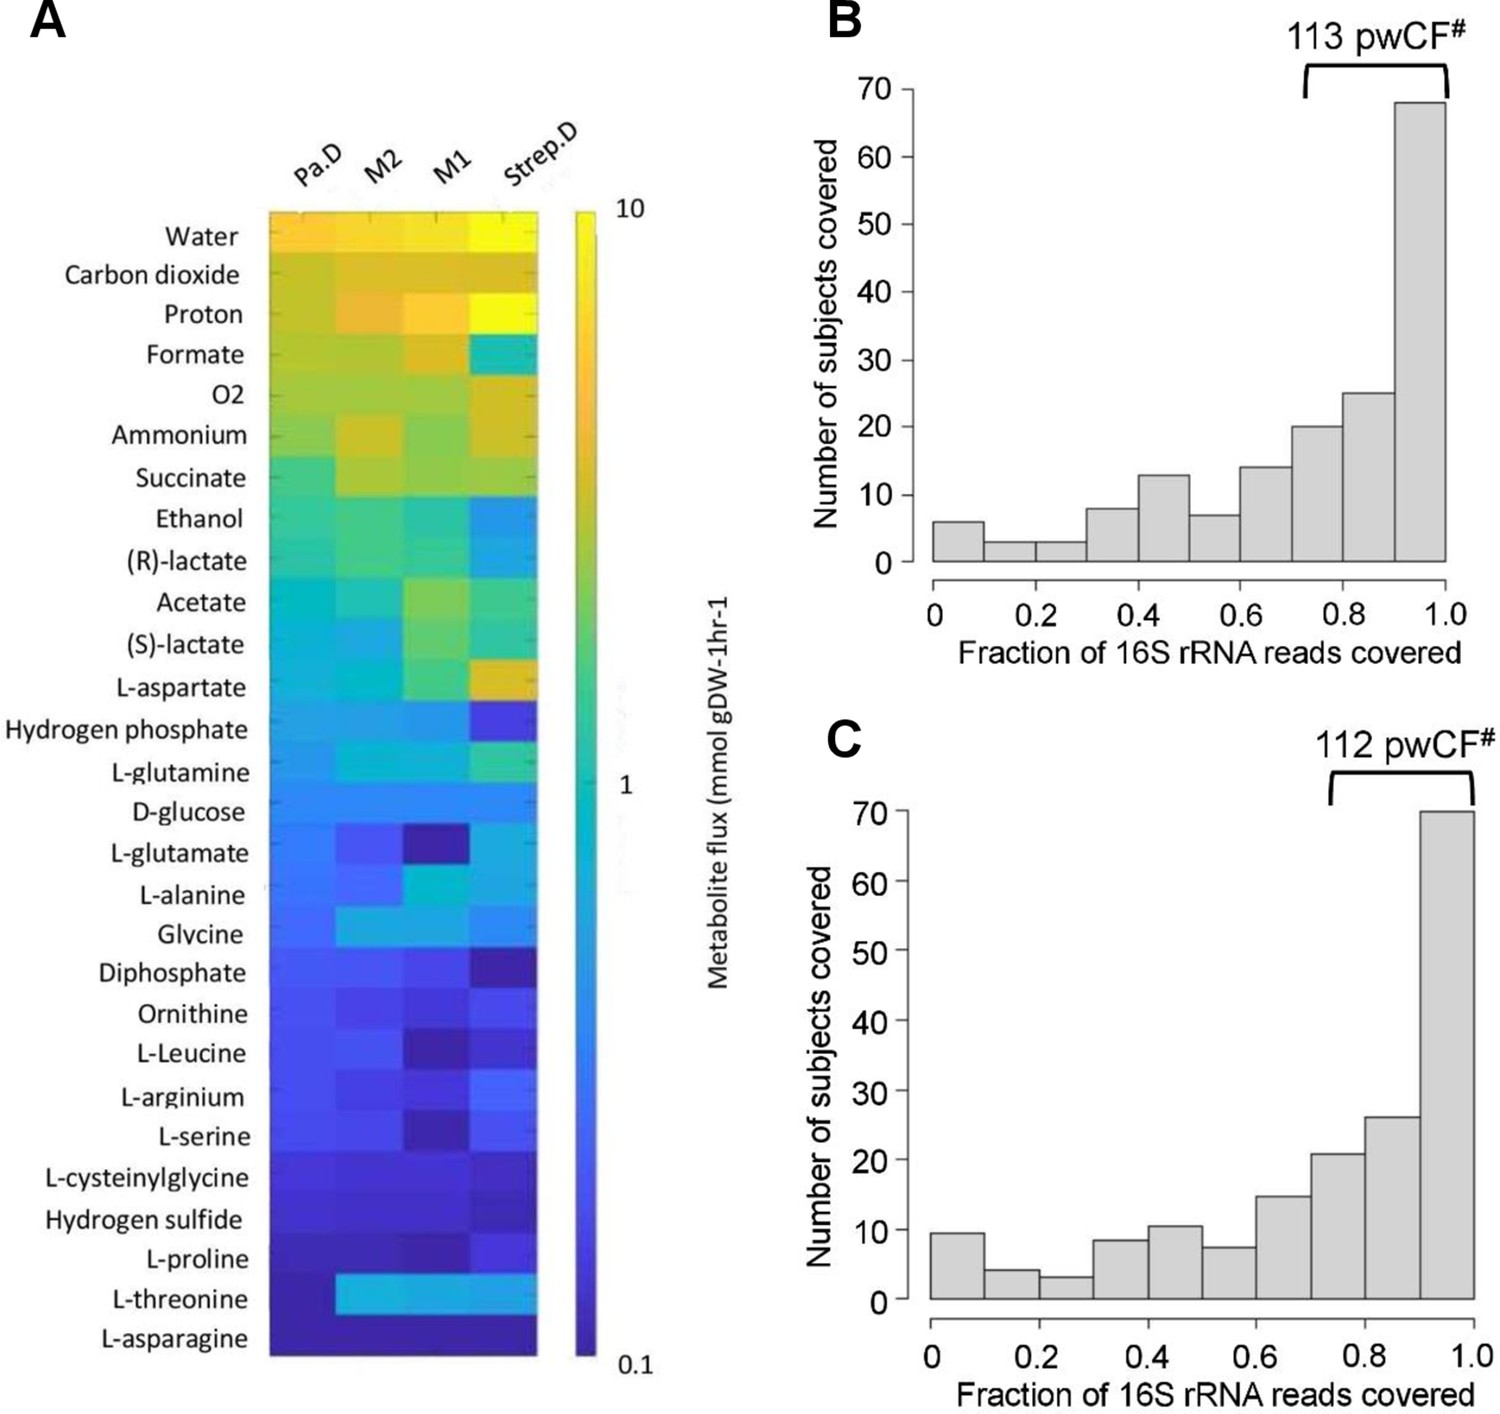
(A) In silico prediction of metabolic flux between P. aeruginosa-dominated (Pa.D), Streptococcus-dominated (Strep.D) and the “mixed” Pa.M1 and Pa.M2 communities based on the abundance of P. aeruginosa, S. aureus, S. sanguinis, and P. melaninogenica analyzed by Hampton, O’Toole, and colleagues (Hampton et al., 2021). (B and C) Number of unique samples for which >70% of 16S rRNA reads are associated with the combined presence of Pseudomonas, Staphylococcus, Streptococcus, Prevotella with either Burkholderia (B), or Achromobacter (C). #Indicates the number of samples that meet these criteria from the total sample size is 167 persons with cystic fibrosis (pwCF). Compare the values in panels B,C with the 103 samples with >70% Pseudomonas, Staphylococcus, Streptococcus, and Prevotella shown in Figure 1B.
Figure 1—figure supplement 2
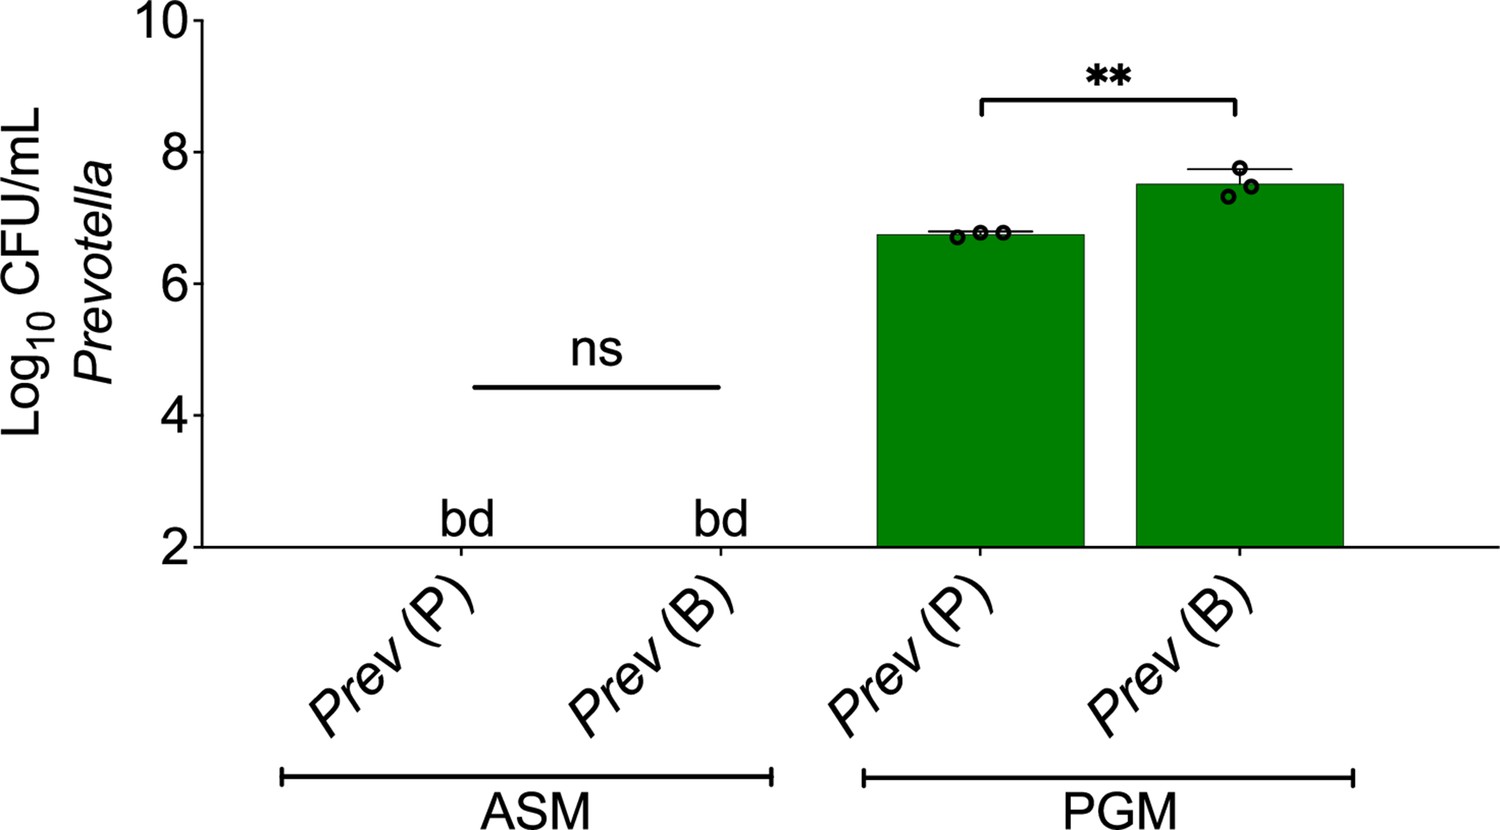
Prevotella melaninogenica does not grow as monoculture biofilms in artificial sputum medium (ASM) in anoxic conditions.
Colony forming units (CFUs) of P. melaninogenica grown in ASM or Prevotella growth medium (PGM) as planktonic or biofilm monospecies communities using an anoxic environmental chamber. Each data point presented in a column represents the average of three biological replicates each with three technical replicates (n=3). Prev = P. melaninogenica. Error bars represent SD. Statistical analyses were done using t-test.with **, p<0.01. ns = non-significant, bd = below detection.
Figure 1—figure supplement 3
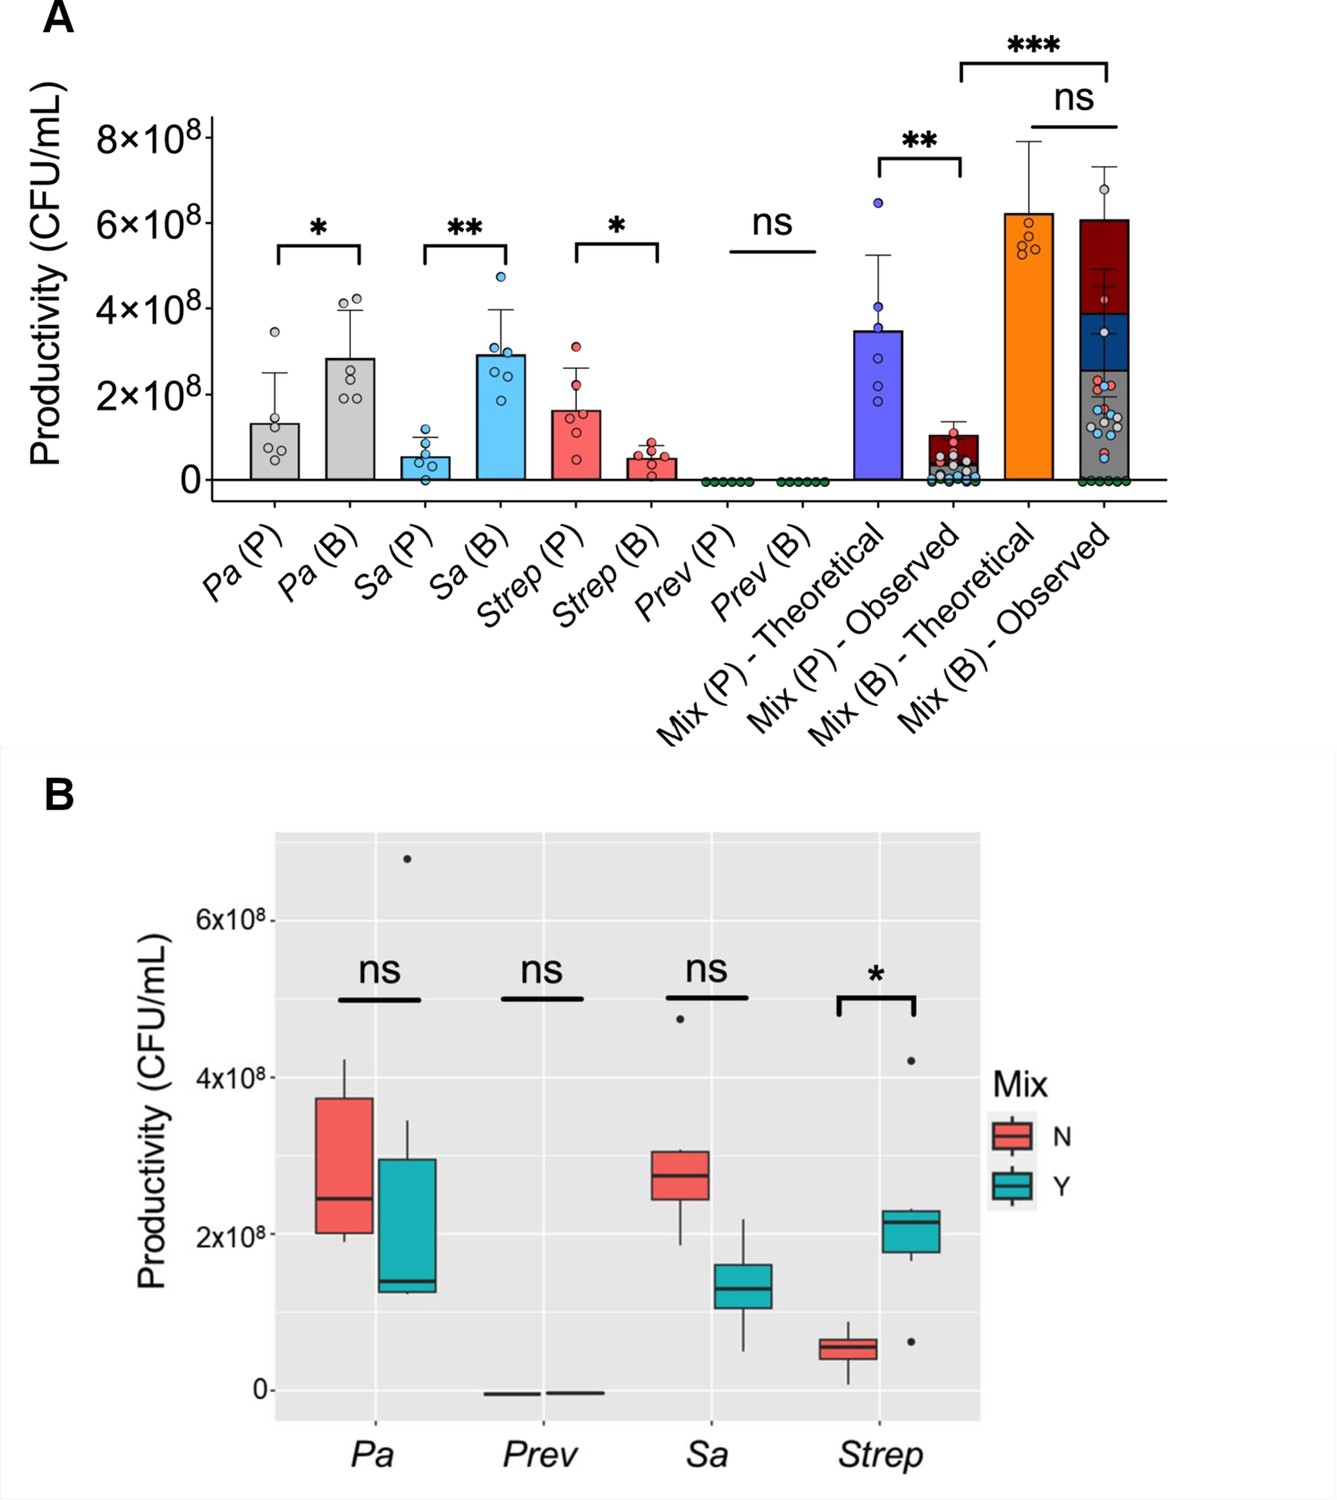
Productivity of P. aeruginosa, S. aureus, S. sanguinis, and P. melaninogenica grown as monospecies or mixed planktonic/biofilm communities.
(A) Measures of productivity (or yield) represented as colony forming unit (CFU)/mL counts of P. aeruginosa, S. aureus, S. sanguinis, and P. melaninogenica grown in planktonic or biofilm and as pure or mixed communities. For theoretical productivity of planktonic and biofilm mixed communities, we assumed additivity of the four community members (denoted as ‘Mix (P/B) – Theoretical’). Observed yield of the mixed communities is based on actual CFU/mL yield counts of each of the four species shown as ‘Mix (P/B) – Observed’. (B) Productivity comparisons of P. aeruginosa, S. aureus, P. melaninogenica, and S. sanguinis grown as monospecies biofilms to their counterparts grown in a mixed biofilm community. Data points presented in (A) and (B) are tabulated from data shown in Figure 1C, each with three technical replicates performed on six different days (n=6). Raw data for the figure is presented in Source code 1. Pa = P. aeruginosa, Sa = S. aureus, Strep = S. sanguinis, and Prev = P. melaninogenica. Mix = mixed biofilm community. Y=yes, N=no. ns = non-significant. *, p<0.05; **, p<0.01; ***, p<0.001. Error bars represent SD. Statistical analyses were done using t-tests.
-
Figure 1—figure supplement 3—source data 1
Raw data for productivity calculation of P. aeruginosa, S. aureus, S. sanguinis, and P. melaninogenica grown in various conditions.
Data presented in Figure 1—figure supplement 3 represents the average of six biological replicates, each with three technical replicates performed at least on three different days. For each microorganism grown in the mixed communities, the log10 geometric mean value of the three biological replicates was transformed to colony forming unit (CFU)/mL counts and divided by the total CFU/mL of the community (total community). Data visualization was done using GraphPad Prism 9 (version 9.2.0).
- https://cdn.elifesciences.org/articles/81604/elife-81604-fig1-figsupp3-data1-v3.xlsx
Figure 1—figure supplement 4
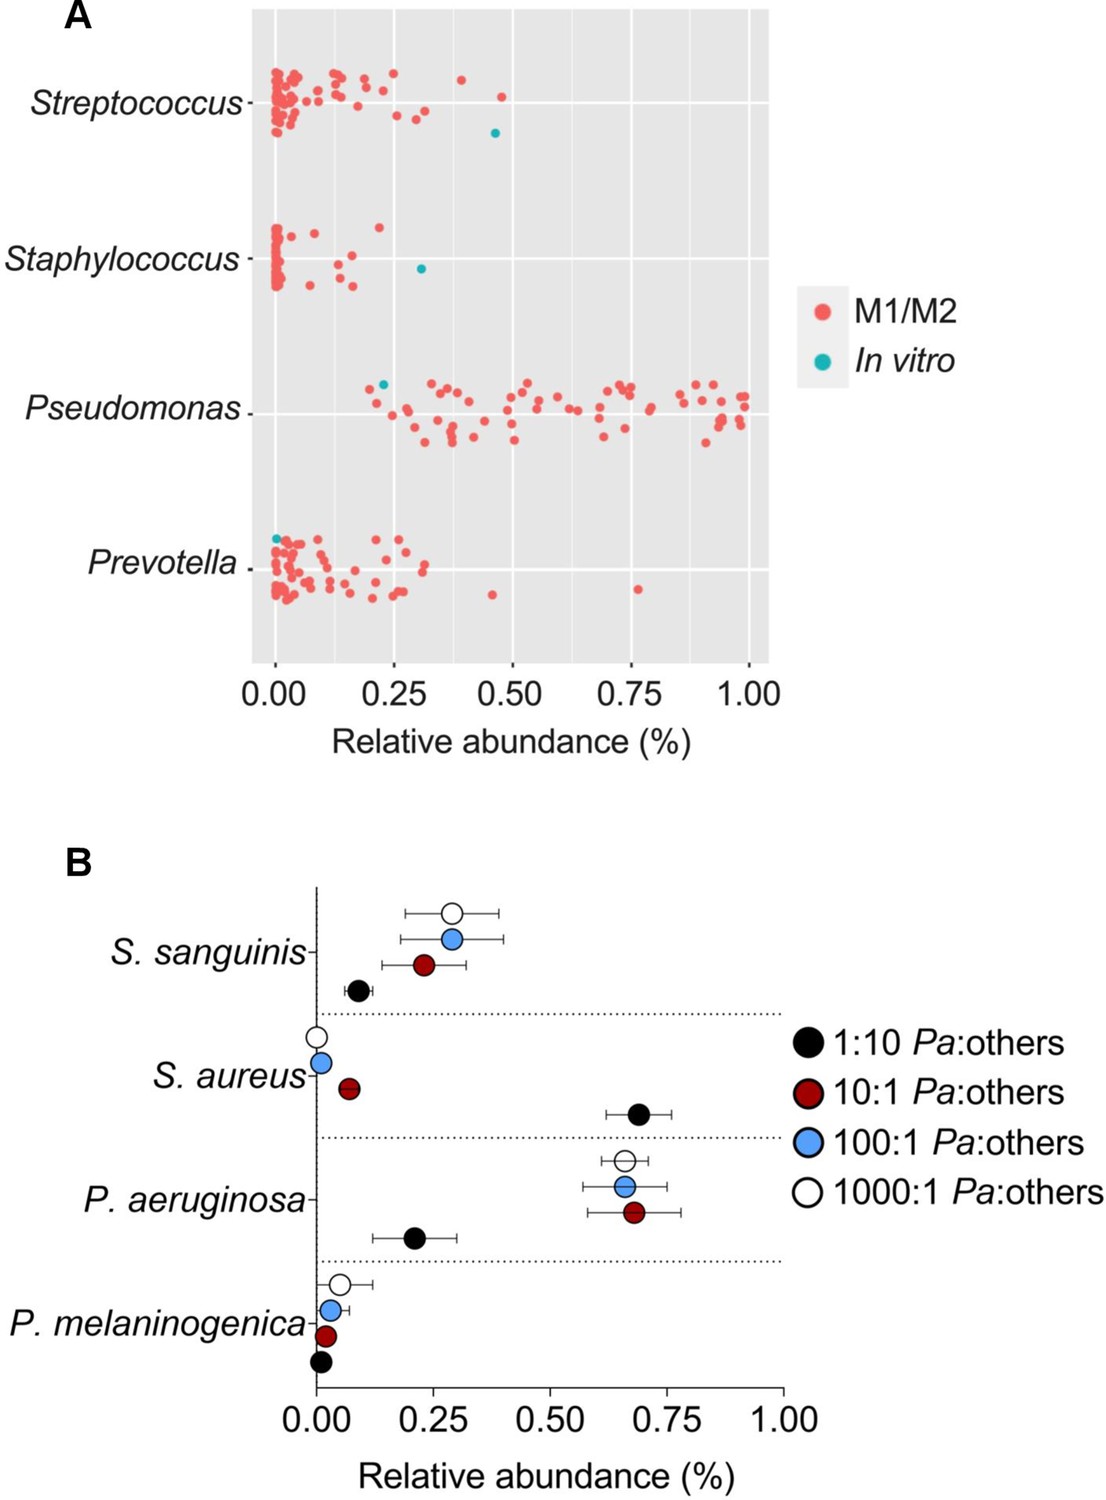
Microbial composition range of in vivo CF mixed communities compared with the in vitro model.
(A) Relative abundance ranges of 16S rRNA reads assigned to Pseudomonas, Staphylococcus, Streptococcus, and Prevotella detected in the M1/M2 community types identified previously (Hampton et al., 2021). These data were plotted against the relative abundance of P. aeruginosa, S. aureus, S. sanguinis, and P. melaninogenica grown in the in vitro mixed community shown in Figure 1C. (B) In vitro relative abundance of P. aeruginosa, S. aureus, S. sanguinis, and P. melaninogenica in mixed communities where P. aeruginosa was maintained at the same starting inoculum and other microbes grown 10× in excess or diluted from 1:10 to 1:1000 relative to P. aeruginosa. Data points presented in (B) represents the average from three biological replicates, each with three technical replicates performed on three different days (n=3). Raw data for (B) is presented in Source code 2. Pa = P. aeruginosa, others = S. aureus, S. sanguinis, and P. melaninogenica.
-
Figure 1—figure supplement 4—source data 1
Raw data for in vitro relative abundance of P. aeruginosa, S. aureus, S. sanguinis, and P. melaninogenica grown in various ratios in mixed communities.
Data presented in Figure 1—figure supplement 4 represents the average of three biological replicates, each with three technical replicates performed on three different days. For each microorganism grown in the mixed communities, the log10 geometric mean value of the three biological replicates was transformed to colony forming unit (CFU)/mL counts and divided by the total CFU/mL of the community (total community). Data visualization was done using GraphPad Prism 9 (version 9.2.0).
- https://cdn.elifesciences.org/articles/81604/elife-81604-fig1-figsupp4-data1-v3.xlsx
Figure 1—figure supplement 5
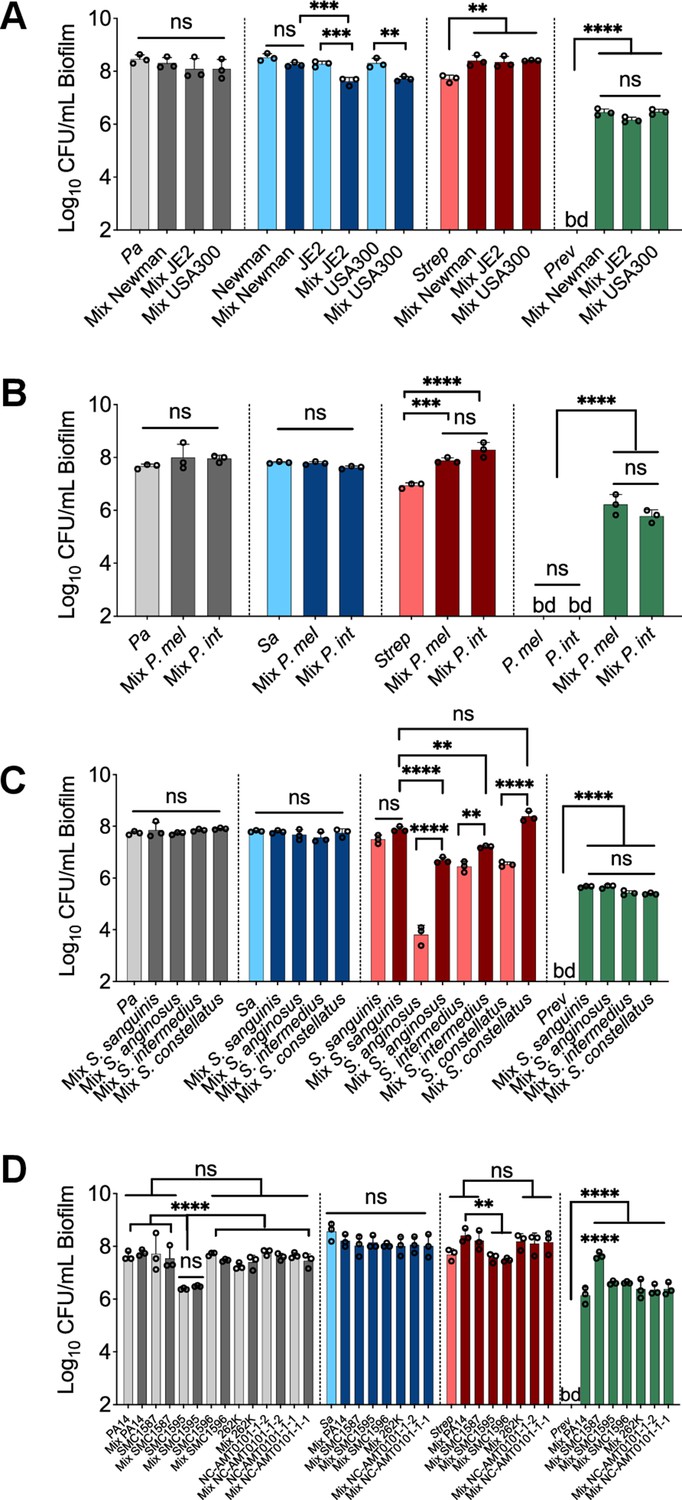
Testing additional laboratory and clinical strains in the in vitro polymicrobial community model.
Colony forming units (CFUs) of communities including different (A) S. aureus strains, (B) P. melaninogenica (P. mel), Prevotella intermedia (P. int), (C) Streptococcus spp., and (D) P. aeruginosa strains. Various clinical isolates/strains pairs shown in panels A–D were tested in the in vitro polymicrobial system to determine if the observations reported in Figure 1C were also applicable to these strains. Each data point presented in a column represents the average from at least three technical replicates performed at least on three different days (n=3). Statistical analysis was performed using ordinary one-way ANOVA and Tukey’s multiple comparisons posttest with *, p<0.05; **, p<0.01; ***, p<0.001, and ****, p<0.0001, ns = non-significant. Error bars represent SD. Pa = P. aeruginosa PA14, Sa = S. aureus Newman, Strep = S. sanguinis, Prev = P. melaninogenica, and bd = below detection.
Figure 1—figure supplement 6
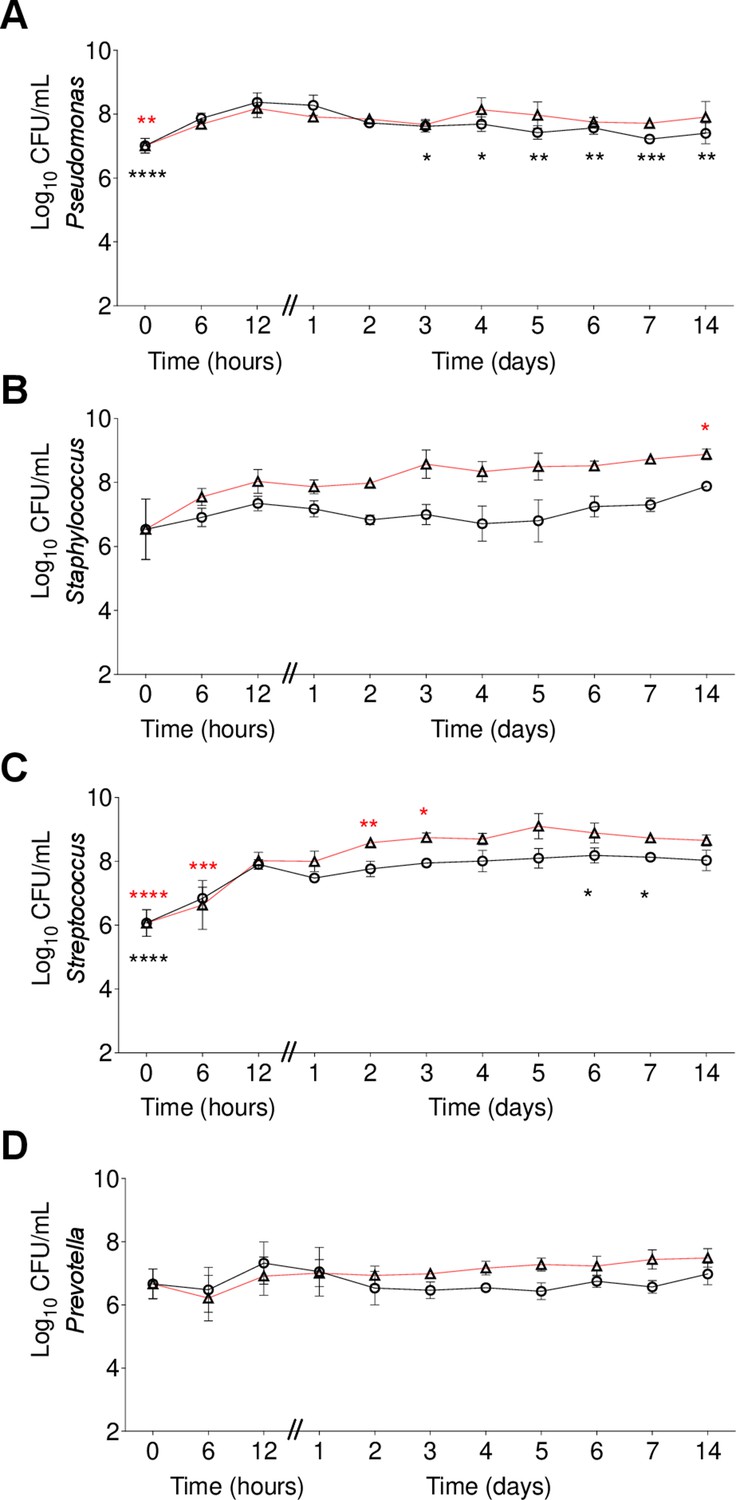
Fourteen days co-culture experiment of community members grown in a planktonic and biofilm mixed communities.
Colony forming units (CFUs) of (A) P. aeruginosa, (B) S. aureus, (C) S. sanguinis, and (D) P. melaninogenica. Red lines represent biofilm cells and black lines the planktonic cells. Each data point presented in the curves represents the average from at least three technical replicates performed at least on three different days (n=3). Every 24 hr the medium was removed, and then fresh medium added. Statistical analysis was performed using ordinary one-way ANOVA and Dunnett’s multiple comparisons posttest with the 24 hr timepoint as control. *, p<0.05; **, p<0.01; ***, p<0.001; ****, p<0.0001. Error bars represent SD.
Figure 2 with 7 supplements

Polymicrobial context shifts tobramycin sensitivity of CF pathogens.
Colony forming units of planktonic (P) and biofilm (B) populations of (A) P. aeruginosa (Pa), (B) S. aureus (Sa), (C) S. sanguinis (Strep), and (D) P. melaninogenica (Prev) grown as monocultures or mixed communities (Mix) and challenged or not with 100 µg/mL of tobramycin (+Tb). Each data point presented in a column represents the average from at least three technical replicates performed at least on three different days (n=3). Statistical analysis was performed using ordinary one-way ANOVA and Tukey’s multiple comparisons posttest with *, p<0.05; **, p<0.01; ****, p<0.0001, ns = non-significant, and bd = below detection. Error bars represent SD.
Figure 2—figure supplement 1
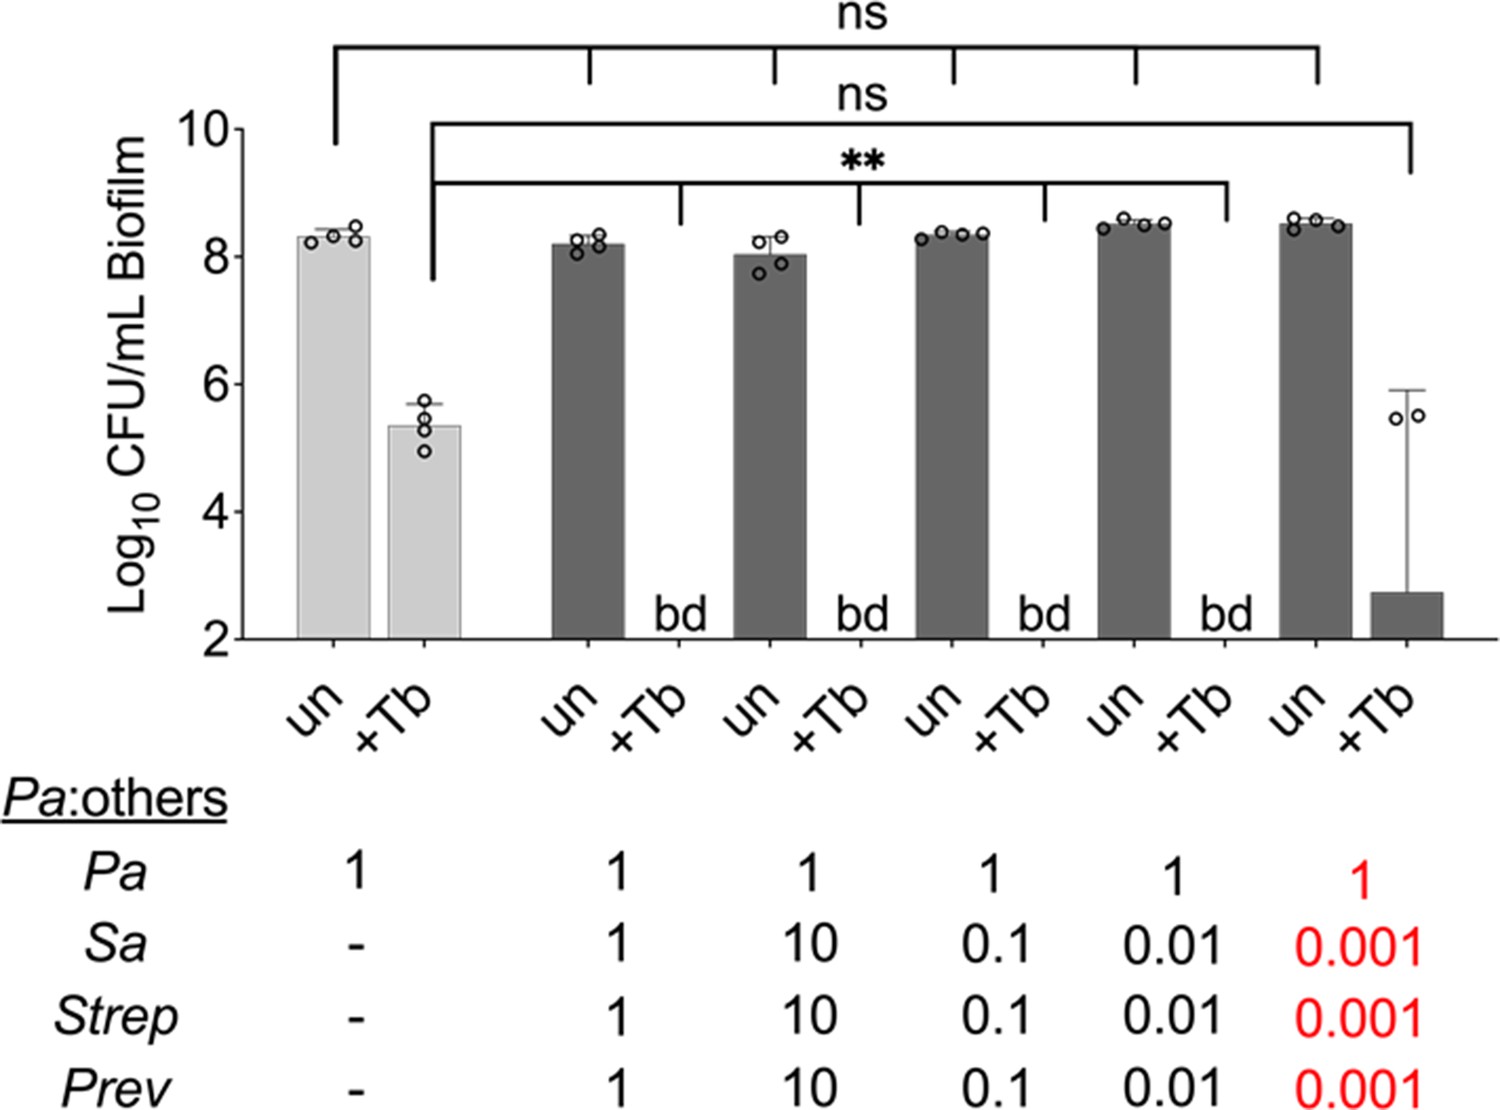
Microbial partners increase the killing of P. aeruginosa exposed to tobramycin in a mixed community over a wide range of population sizes.
Colony forming units (CFUs) of P. aeruginosa grown in the presence of varying concentrations of S. aureus, S. sanguinis, and P. melaninogenica ranging from 10× the initial abundance of P. aeruginosa to 1000× less (0.001) for all three of the other organisms, and then treated with tobramycin. P. aeruginosa was inoculated at the same starting OD600 in all conditions. Each data point presented in a column represents the average from at least three technical replicates performed at least on three different days (n=4). Statistical analysis was performed using ordinary one-way ANOVA and Tukey’s multiple comparisons posttest with **, p<0.01. Error bars represent SD. ns = non-significant, bd = below detection, +Tb = +100 µg/mL tobramycin, un = untreated. Pa = P. aeruginosa, Sa = S. aureus, Strep = S. sanguinis, and Prev = P. melaninogenica. Monoculture biofilm = light gray and mixed biofilm = dark gray.
Figure 2—figure supplement 2
Drug sensitivity of P. aeruginosa clinical strains grown in a mixed community challenged with tobramycin.
Colony forming units (CFUs) of various P. aeruginosa strains grown as monocultures (light gray) or mixed biofilm communities (dark gray) treated with tobramycin. Each data point presented in a column represents the average from at least three technical replicates performed at least on three different days (n=3). Statistical analysis was performed using ordinary one-way ANOVA and Tukey’s multiple comparisons posttest with *, p<0.05; **, p<0.01; ***, p<0.001, and ****, p<0.0001; ns = non-significant, bd = below detection, +Tb = +100 µg/mL tobramycin, and un = untreated. Error bars represent SD.
Figure 2—figure supplement 3
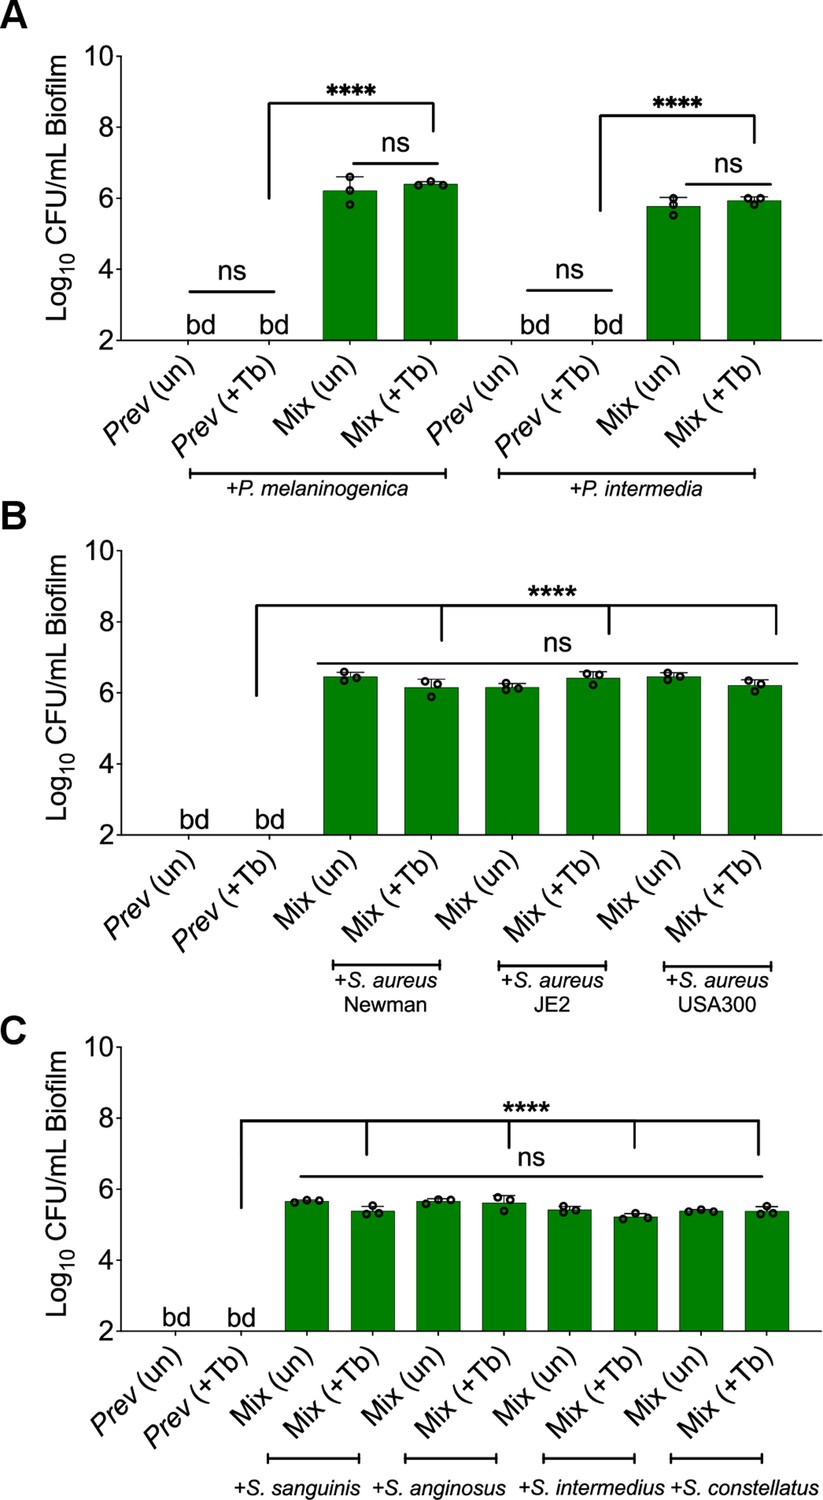
Shifted sensitivity of P. aeruginosa PA14 grown in a mixed community using various laboratory strains and clinical isolates treated with tobramycin.
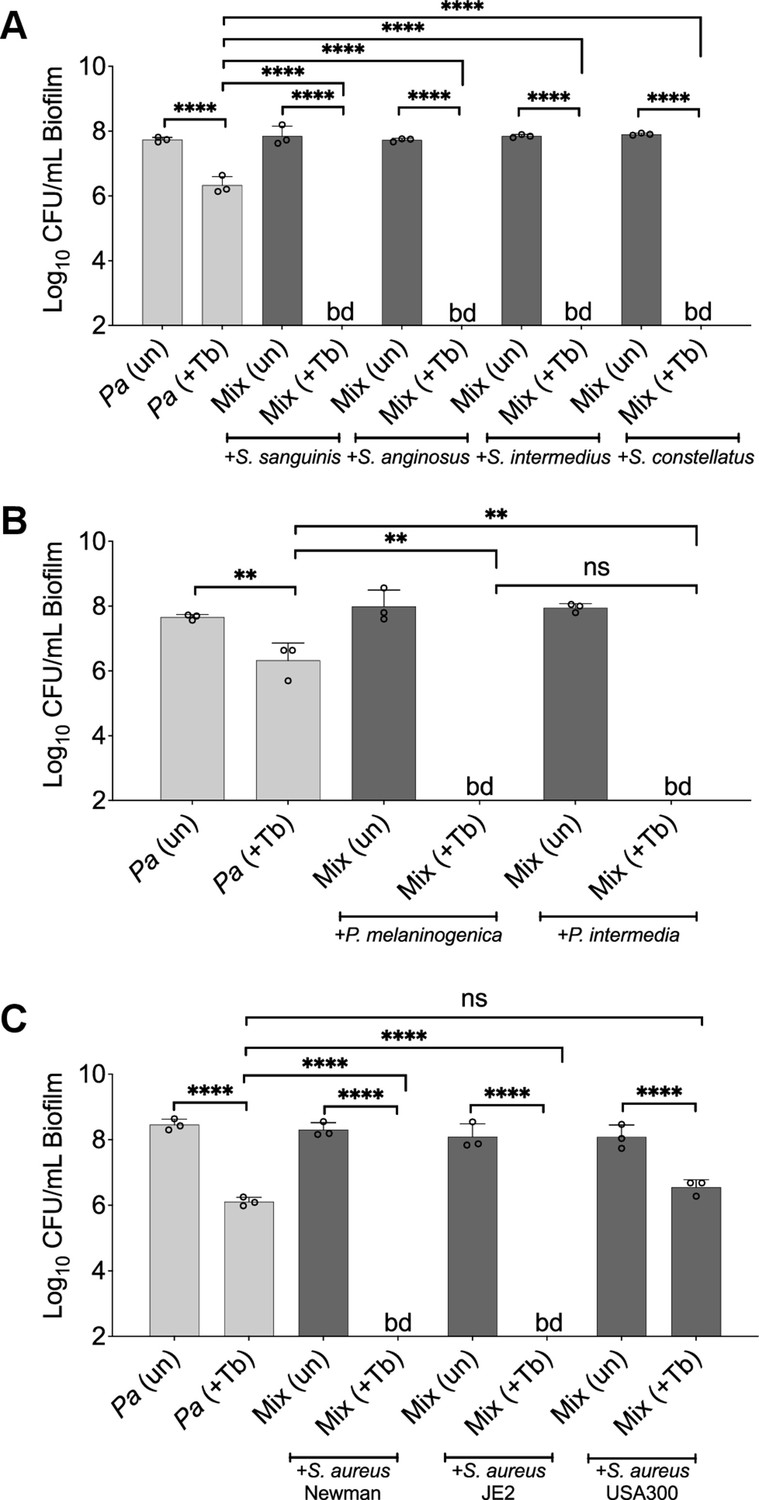
Colony forming units (CFUs) of P. aeruginosa PA14 biofilms grown as monocultures (light gray) or mixed communities (dark gray) in the presence of (A) S. sanguinis, Streptococcus anginosus, Streptococcus intermedius, and Streptococcus constellatus, (B) P. melaninogenica and Prevotella intermedia, or (C) S. aureus strains treated with tobramycin. Each data point presented in a column represents the average from at least three technical replicates performed at least on three different days (n=3). Statistical analysis was performed using ordinary one-way ANOVA and Tukey’s multiple comparisons posttest with **, p<0.01 and ****, p<0.0001, ns = non-significant. bd = below detection, Pa = P. aeruginosa, P. mel = P. melaninogenica, P. int = Prevotella intermedia, +Tb = +100 µg/mL tobramycin, and un = untreated. Error bars represent SD.
Figure 2—figure supplement 4
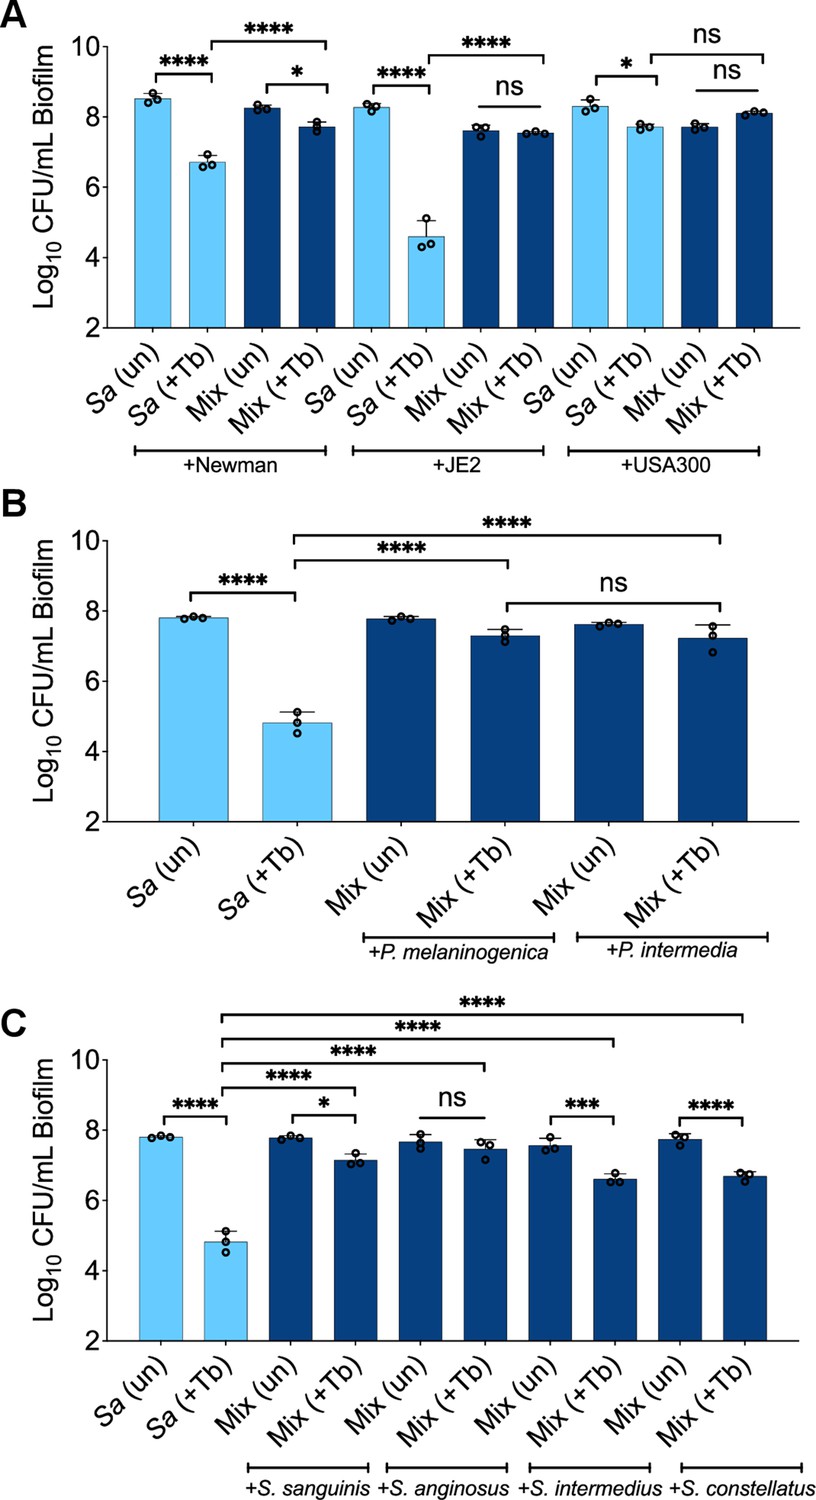
Recalcitrance of S. aureus biofilms grown in a mixed community composed of various strains and treated with tobramycin.
S. aureus colony forming units (CFUs) when grown as monocultures (light blue) or mixed communities (dark blue) treated with tobramycin for (A) S. aureus strains spp., (B) Prevotella spp., and (C) Streptococcus spp. Each data point presented in a column represents the average from at least three technical replicates performed at least on three different days (n=3). Statistical analysis was performed using ordinary one-way ANOVA and Tukey’s multiple comparisons posttest with *, p<0.05; ***, p<0.001, and ****, p<0.0001; ns = non-significant, bd = below detection, +Tb = +100 µg/mL tobramycin, un = untreated, Sa = S. aureus Newman, P. inter = P. intermedia, and P. mel = P. melaninogenica. Error bars represent SD.
Figure 2—figure supplement 5
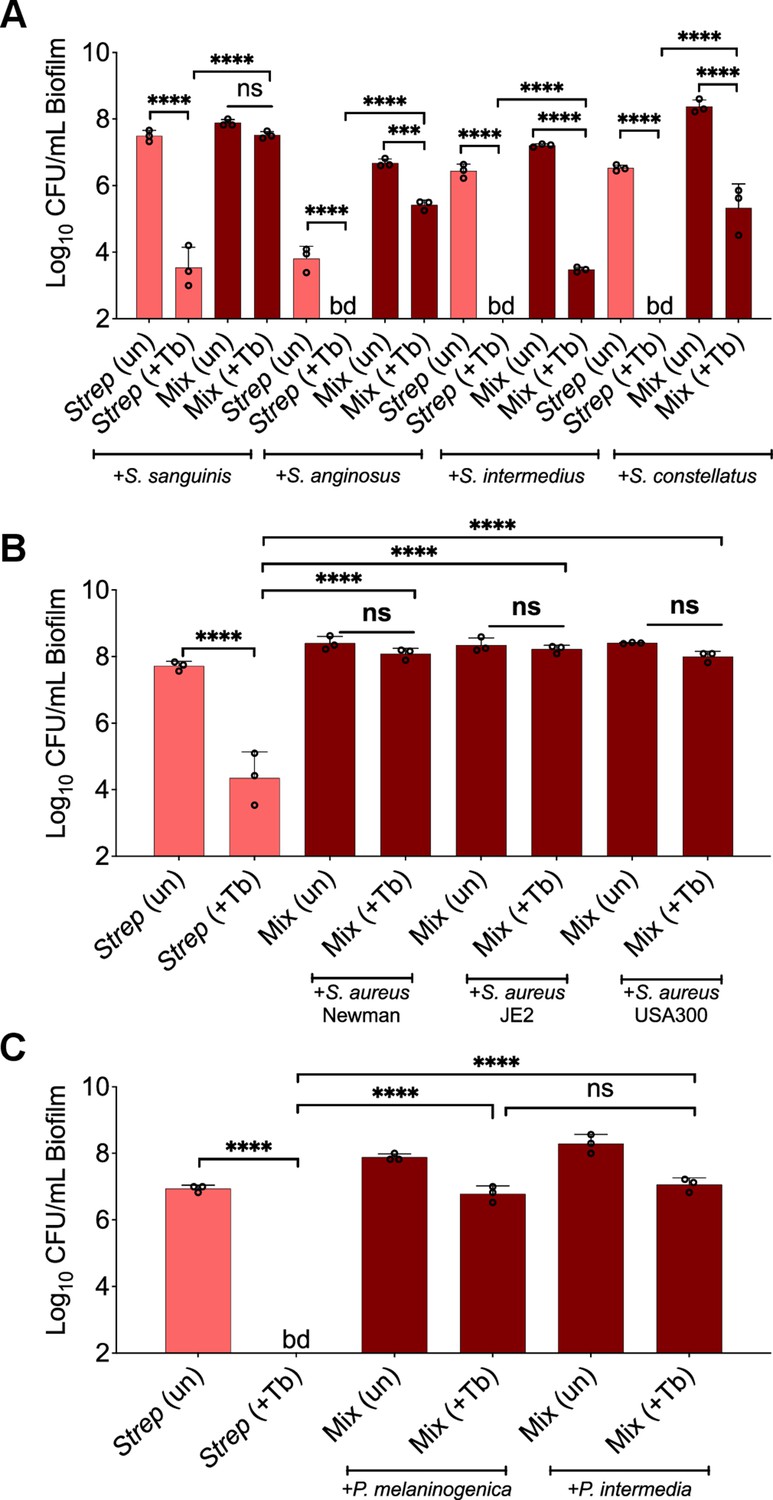
Recalcitrance of Streptococcus spp. biofilms grown in a mixed community composed of various strains and treated with tobramycin.
Streptococcus spp. colony forming units (CFUs) when grown as monocultures (light red) or mixed communities (dark red) treated with tobramycin for (A) Streptococcus spp., (B) S. aureus strains, or (C) Prevotella spp. Each data point presented in a column represents the average from at least three technical replicates performed at least on three different days (n=3). Statistical analysis was performed using ordinary one-way ANOVA and Tukey’s multiple comparisons posttest with ***, p<0.001 and ****, p<0.0001, ns = non-significant, bd = below detection, +Tb = +100 µg/mL tobramycin, un = untreated, Strep = S. sanguinis, P. inter = P. intermedia, and P. mel = P. melaninogenica. Error bars represent SD.
Figure 2—figure supplement 6
Recalcitrance of Prevotella spp. biofilms grown in a mixed community composed of various strains and treated with tobramycin.
Prevotella spp. colony forming units (CFUs) when grown as monocultures (light green) or mixed communities (dark green) treated with tobramycin for (A) Prevotella spp., (B) S. aureus strains, or (C) Streptococcus spp. Each data point presented in a column represents the average from at least three technical replicates performed at least on three different days (n=3). Statistical analysis was performed using ordinary one-way ANOVA and Tukey’s multiple comparisons posttest with ****, p<0.0001, ns = non-significant, bd = below detection, +Tb = +100 µg/mL tobramycin, un = untreated. For Panel (A), Prev = P. intermedia, or P. melaninogenica. For Panels (B) and (C), Prev = P. melaninogenica. Error bars represent SD.
Figure 2—figure supplement 7

Polymicrobial context shifts tobramycin sensitivity of CF pathogens in fully anoxic conditions.
Colony forming units of biofilm (B) populations of (A) P. aeruginosa (Pa), (B) S. aureus (Sa), (C) S. sanguinis (Strep), and (D) P. melaninogenica (Prev) grown as monocultures or mixed communities (Mix) and challenged or not with 100 µg/mL of tobramycin (+Tb) grown in an anoxic environmental chamber. Each data point presented in a column represents the average from three biological replicates each with three technical replicates (n=3). Statistical analysis was performed using ordinary one-way ANOVA and Tukey’s multiple comparisons posttest with *, p<0.05, ****, p<0.0001, ns = non-significant, and bd = below detection. Error bars represent SD.
Figure 3 with 3 supplements
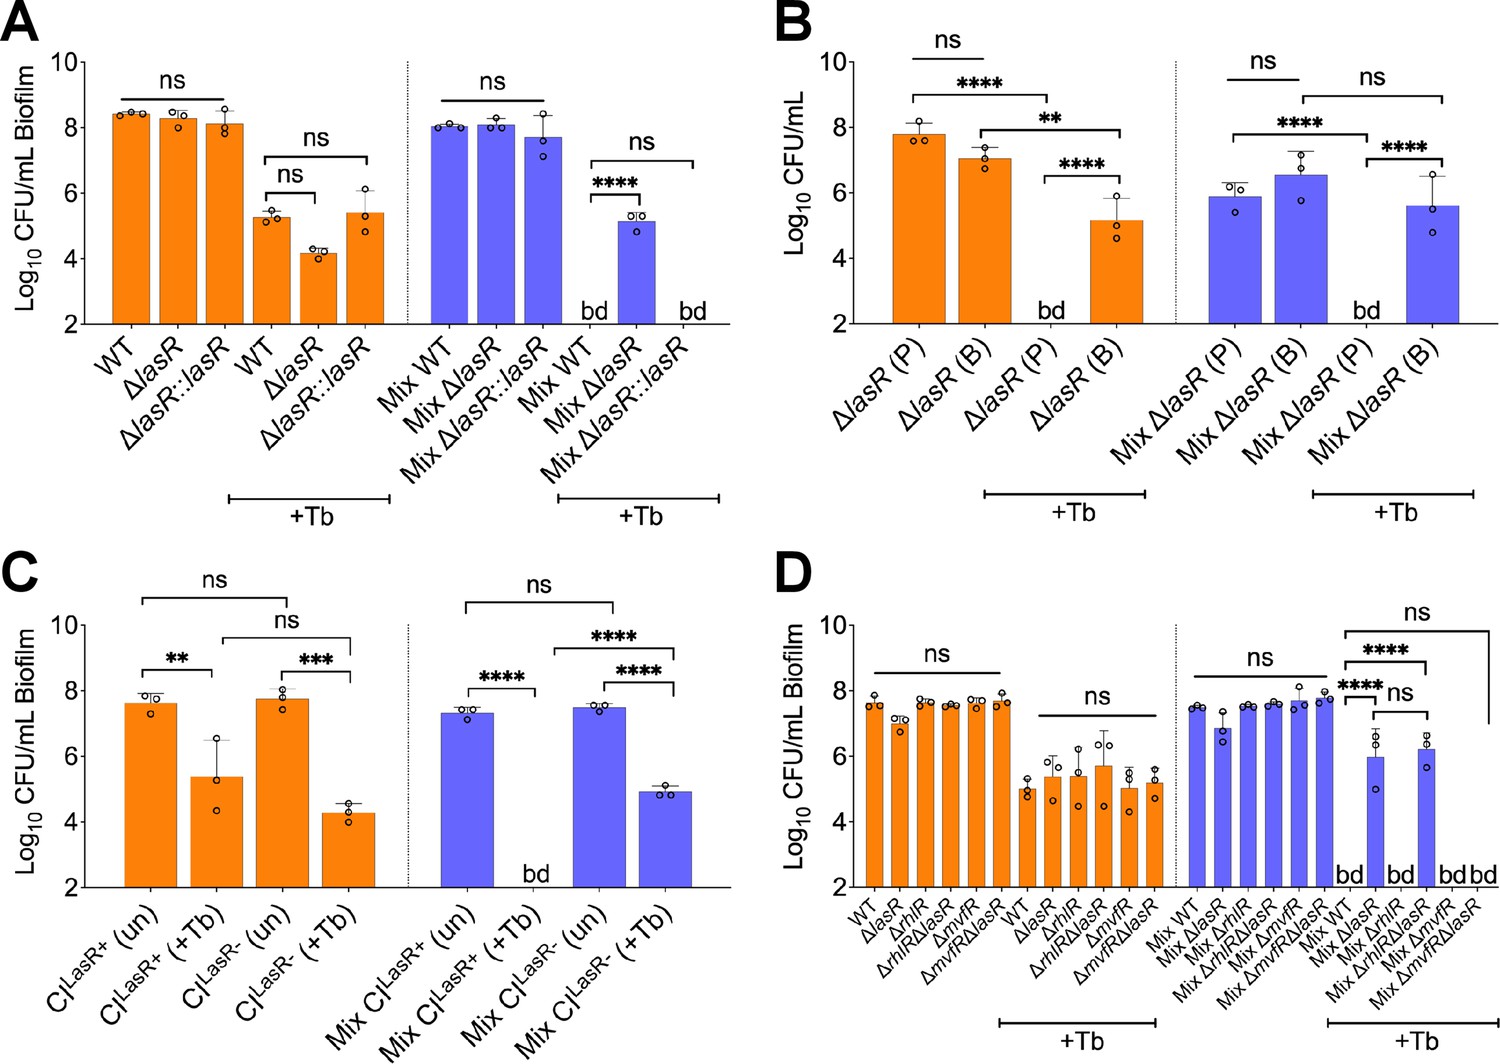
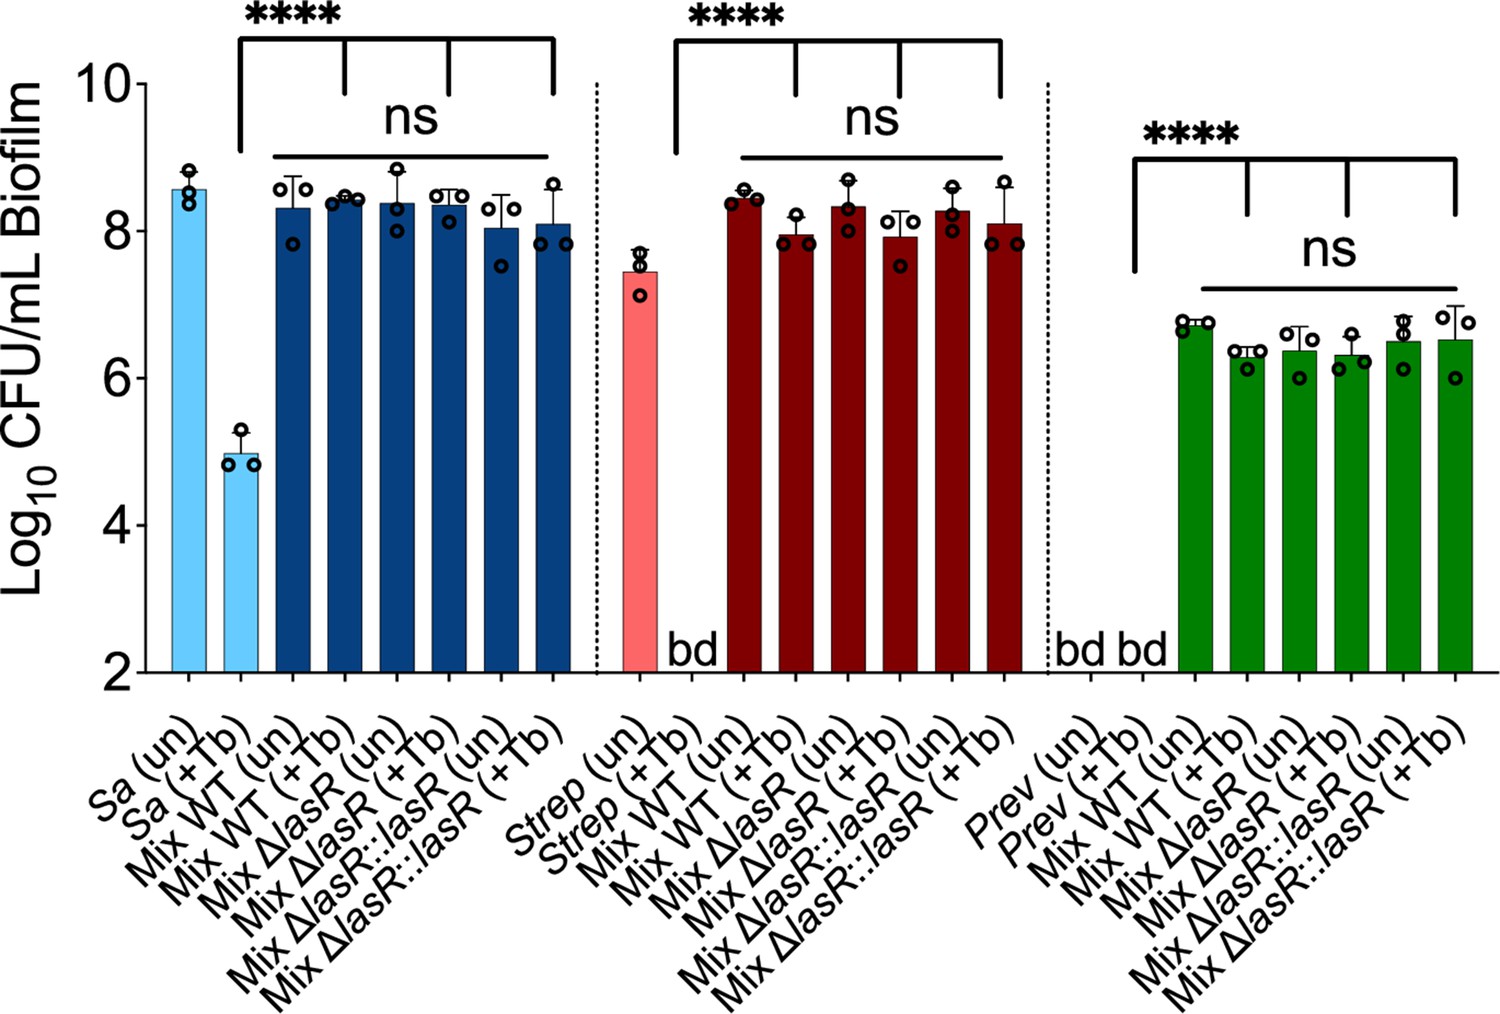
LasR loss-of-function drives biofilm-specific tobramycin tolerance in a mixed community.
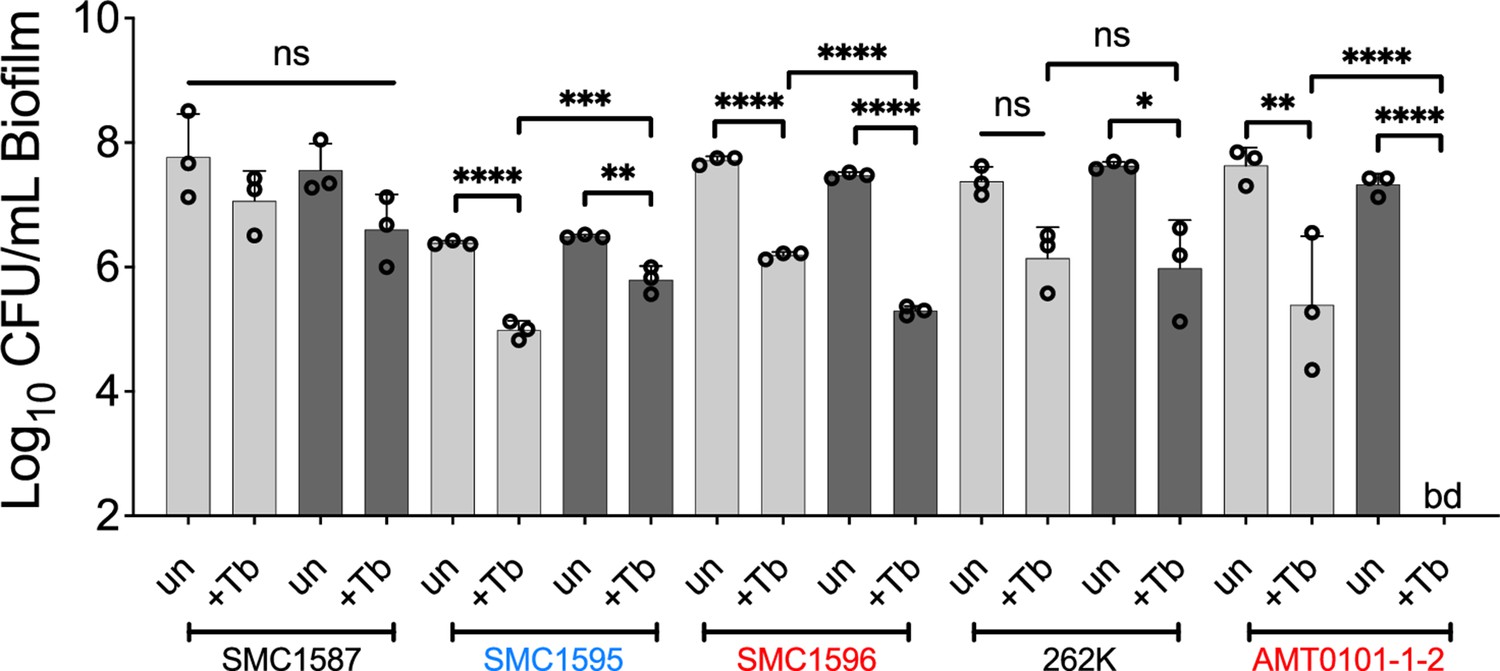
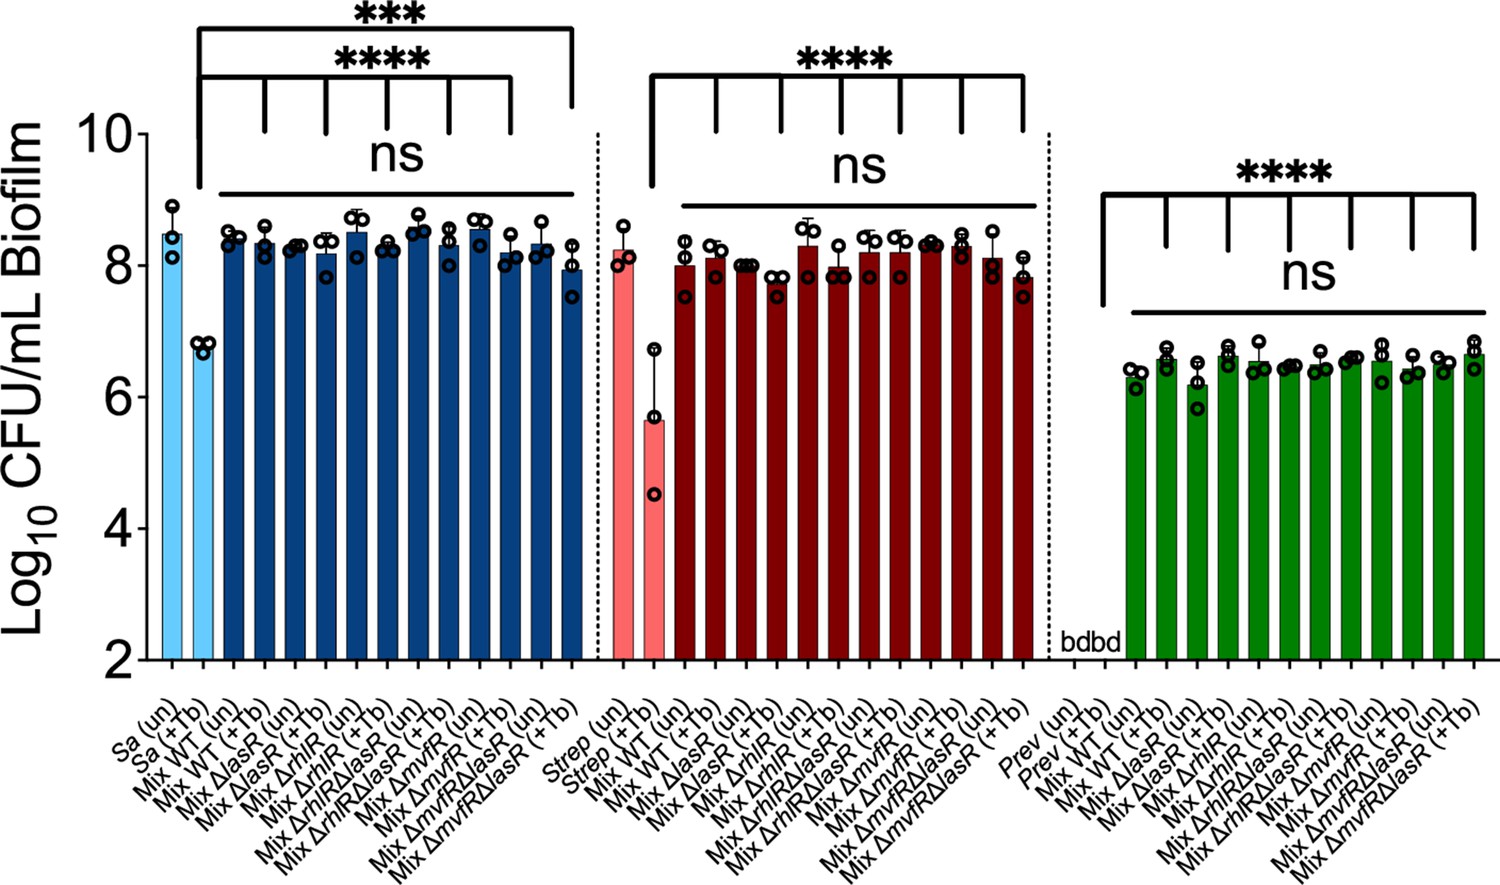
Colony forming units of (A) P. aeruginosa strain PA14 (wild-type [WT]), isogenic ΔlasR mutant, and the complemented strain (ΔlasR::lasR), (B) planktonic and biofilm ΔlasR mutant cells, (C) LasR-defective (NC-AMT0101-1-1; LasR−) and LasR+ (NC-AMT0101-1-2) clinical isolates (CIs) and (D) P. aeruginosa quorum sensing regulator mutants grown as monocultures and mixed communities (Mix) and challenged or not with 100 µg/mL of tobramycin (+Tb). Each data point presented in a column represents the average from at least three technical replicates performed at least on three different days (n=3). Statistical analysis was done using ordinary one-way ANOVA and Tukey’s multiple comparisons posttest with **, p<0.01; ***, p<0.001; ****, p<0.0001. Error bars represent SD. bd = below detection and un = untreated.
Figure 3—figure supplement 1
Loss of P. aeruginosa LasR function does not alter the viability of the other microbes in the mixed community compared to growth with wild-type (WT) P. aeruginosa.
Colony forming units (CFUs) counts of S. aureus (Sa), S. sanguinis (Strep), and P. melaninogenica (Prev) grown as monoculture (light color) or mixed biofilm communities (dark color) with WT P. aeruginosa (WT) and associated mutants treated with tobramycin. Each data point presented in a column represents the average from at least three technical replicates performed at least on three different days (n=3). Statistical analysis was performed using ordinary one-way ANOVA and Tukey’s multiple comparisons posttest with ****, p<0.0001, ns = non-significant, bd = below detection, un = untreated, and +Tb = +100 µg/mL tobramycin. Error bars represent SD.
Figure 3—figure supplement 2
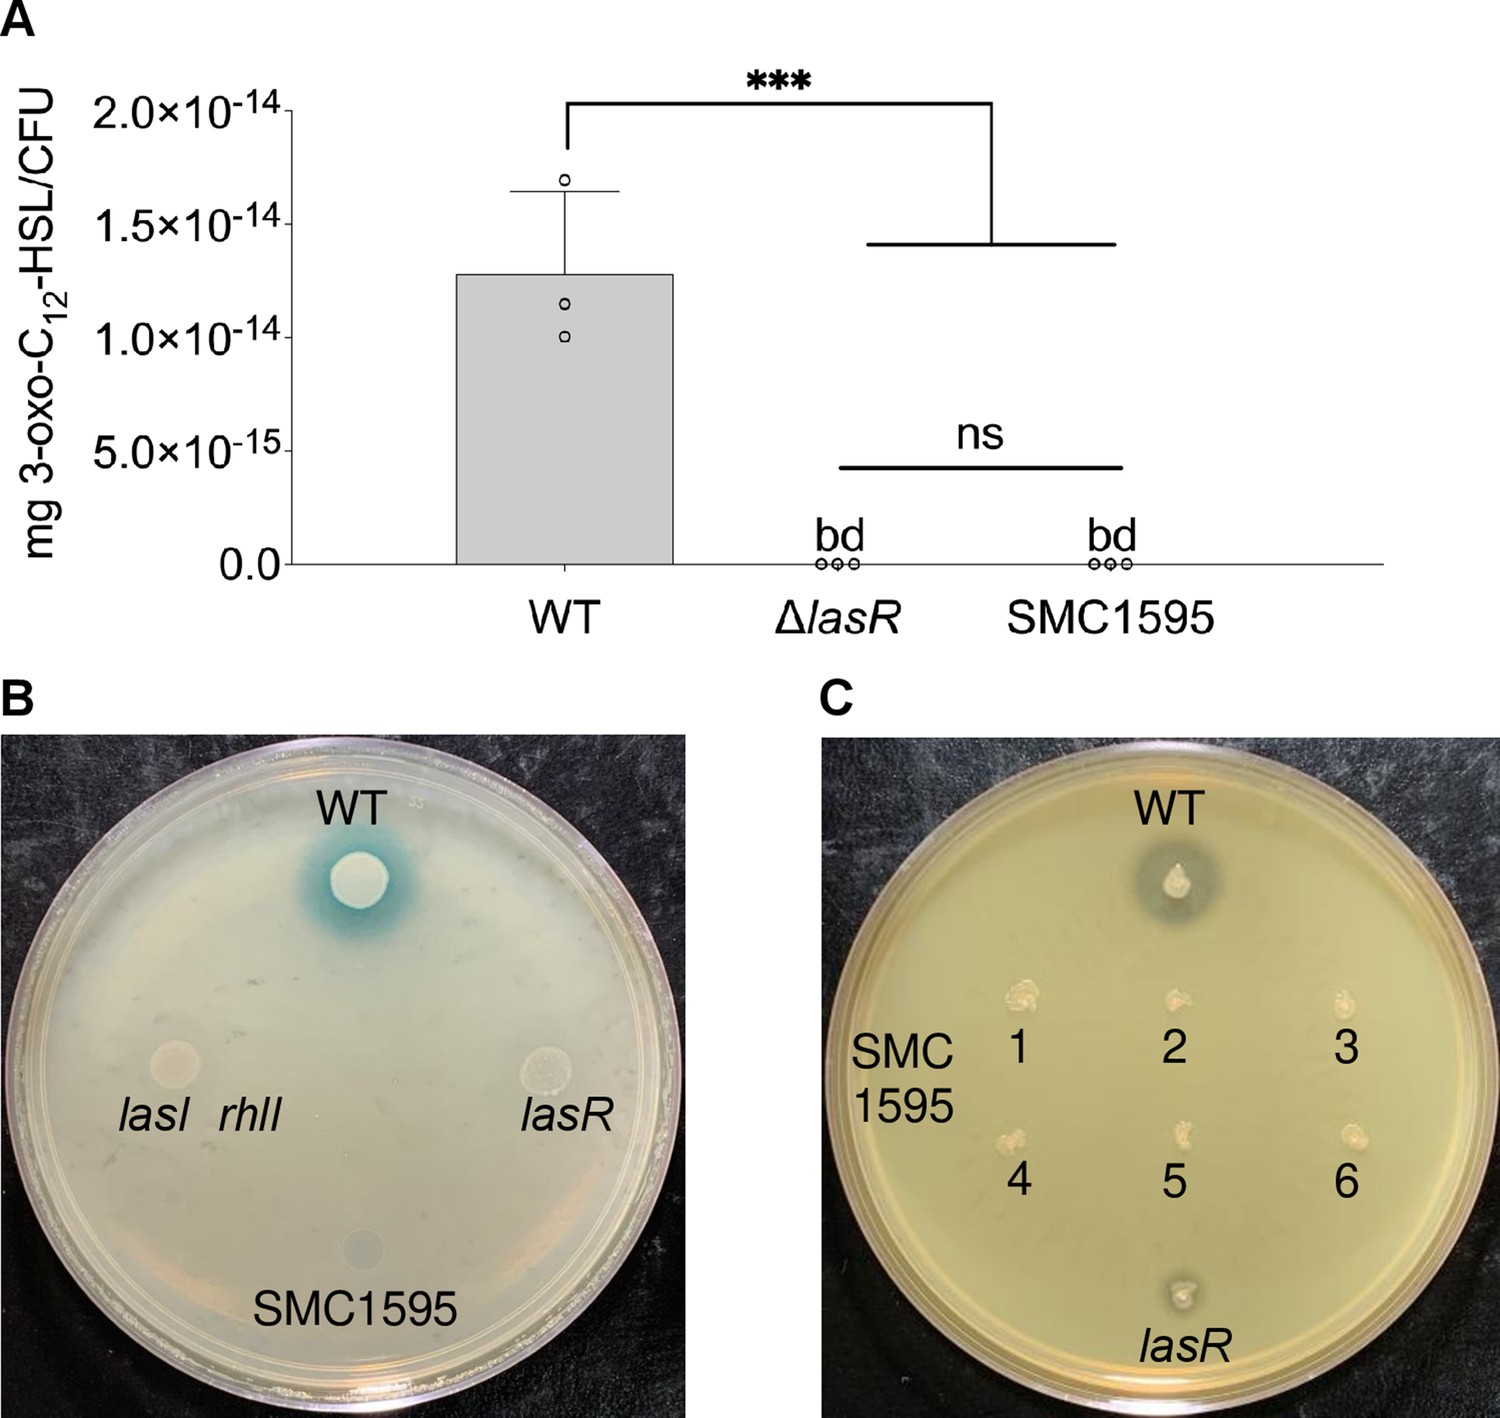
LasR-specific phenotypic tests of P. aeruginosa CF clinical isolate SMC1595.
(A) Liquid chromatography tandem mass spectrometry (LC-MS/MS) quantification of the 3-oxo-C12-HSL signaling molecule. Each data point presented in a column represents the average from at least three technical replicates performed at least on three different days (n=3). Statistical analysis was performed using ordinary one-way ANOVA and Tukey’s multiple comparisons posttest with ***, p<0.001, ns = non-significant, and bd = below detection. (B) 3-oxo-C12-HSL-specific lacZ bioreporter assay. (C) Protease activity on milk plates. For the bioreporter assays, four SMC1595 clones were tested at least on four different days (n=4). For protease assays, six clones of SMC1595 were tested at least on three different days (n=3). Wild-type (WT) = P. aeruginosa PA14, ns = non-significant, and bd = below detection. Error bars represent SD.
Figure 3—figure supplement 3
Tolerance of ΔlasR mutant in a mixed community: a role for the MvfR/PQS regulatory system.
Colony forming unit (CFU) counts of S. aureus (Sa), S. sanguinis (Strep), and P. melaninogenica (Prev) grown as monoculture (light color) or mixed biofilm communities (dark color) with wild-type (WT) P. aeruginosa (WT) or the indicated mutants treated with tobramycin. Each data point presented in a column represents the average from at least three technical replicates performed at least on three different days (n=3). Statistical analysis was performed using ordinary one-way ANOVA and Tukey’s multiple comparisons posttest with **, p<0.001 and ****, p<0.0001; ns = non-significant, bd = below detection, un = untreated, and +Tb = +100 µg/mL tobramycin. Error bars represent SD.
Figure 4 with 2 supplements

Phenazines drive tolerance of P. aeruginosa in mixed communities.
(A) High performance liquid chromatography tandem mass spectrometry (HPLC-MS/MS) quantification of phenazines in monoculture and mixed communities (Mix) containing the indicated P. aeruginosa wild-type (WT) and mutant strains (n=3). (B) Colony forming units (CFUs) counts of P. aeruginosa (WT) and indicated mutants grown as monoculture or mixed communities (Mix; n=5). (C) Exogenous addition of phenazine to monoculture and mixed communities with WT P. aeruginosa treated with 100 µg/mL tobramycin (+Tb). Two physiologically relevant phenazine concentrations were tested; 50 µM (+PYO50) and 300 µM (+PYO300). Data for S. aureus, S. sanguinis, and P. melaninogenica counts are shown in Figure 4—figure supplement 2. Each data point presented in a column represents the average from at least three technical replicates performed at least on three different days (n=3). Statistical analysis was performed using ordinary one-way ANOVA and Tukey’s multiple comparisons posttest with *=p<0.05; ***=p<0.001; ****=p<0.0001, ns = non-significant, and bd = below detection. Error bars represent SD.
Figure 4—figure supplement 1
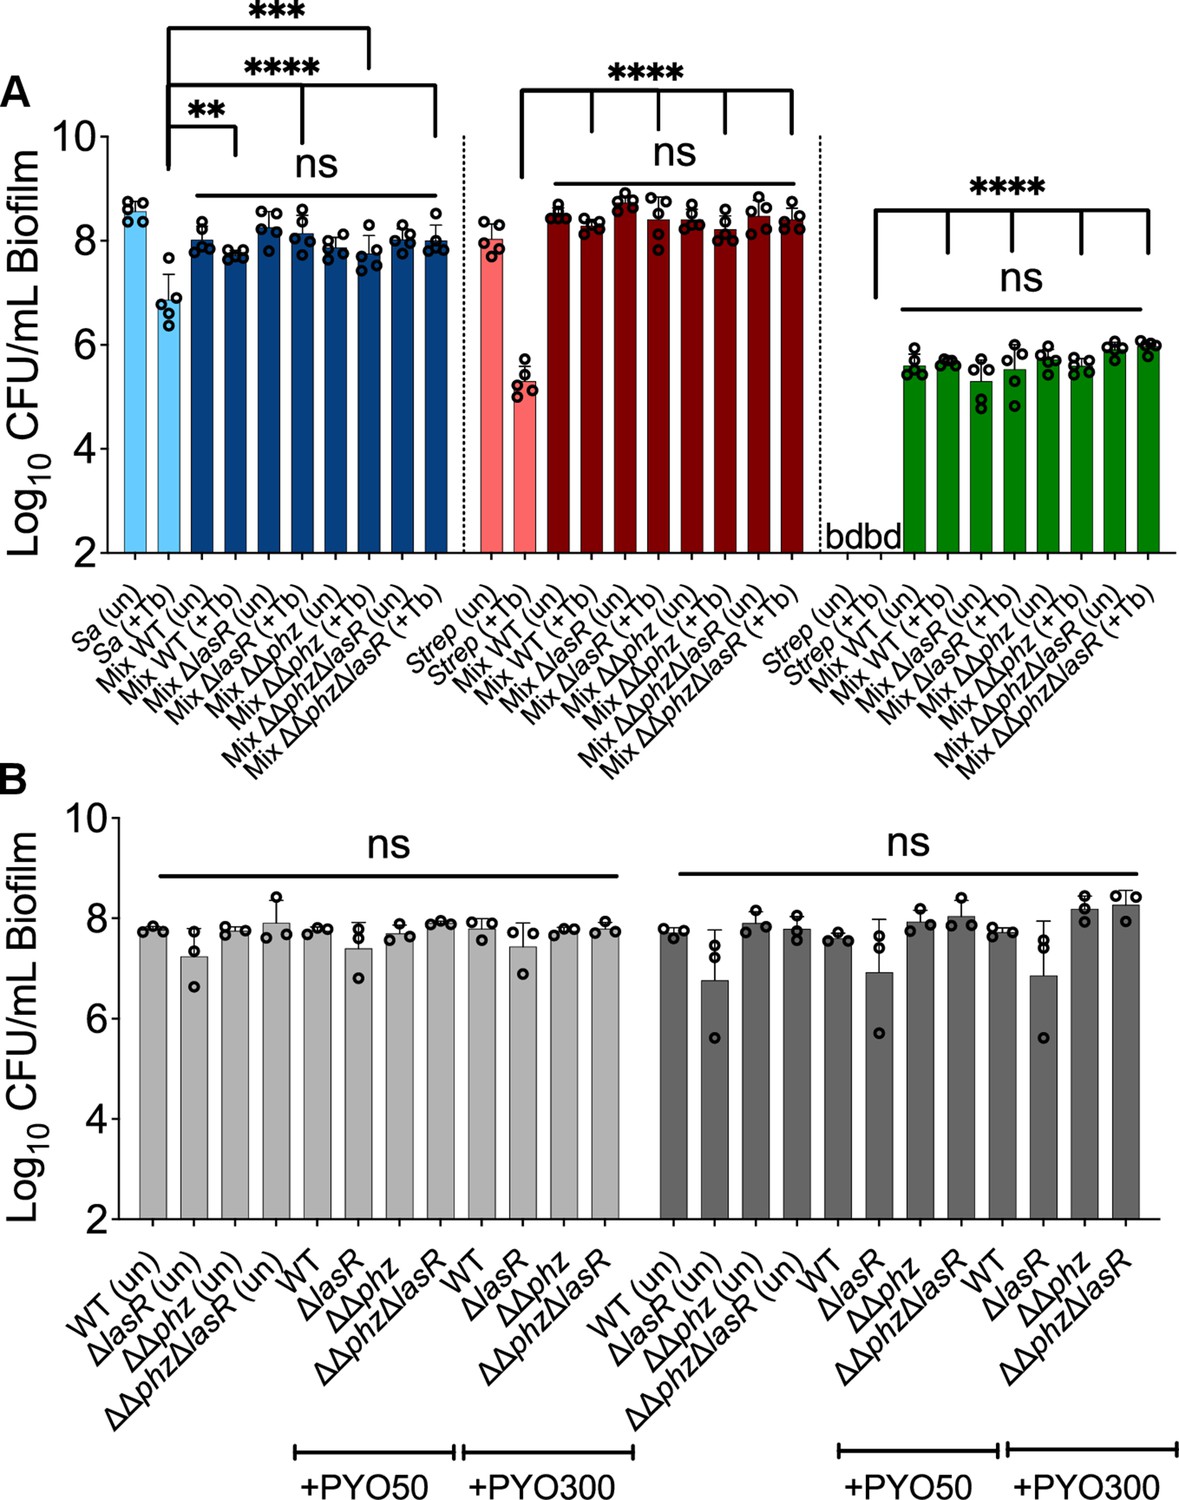
Phenazine drive tolerance of P. aeruginosa in mixed communities: lack of impact on other community members.
Colony forming units (CFUs) counts of (A) S. aureus (Sa), S. sanguinis (Strep), and P. melaninogenica (Prev) grown as monoculture (light color) or mixed biofilm communities (dark color) with wild-type (WT) P. aeruginosa (WT) and associated mutants treated with tobramycin. (B) CFU counts of monoculture (light gray), or mixed (dark gray) P. aeruginosa (WT) and associated mutants biofilm communities treated or not with 50 µM (+PYO50) and 300 µM (+PYO300) of phenazine. Each data point presented in a column represents the average from at least three technical replicates performed at least on three different days (n=3). Statistical analysis was performed using ordinary one-way ANOVA and Tukey’s multiple comparisons posttest with **, p<0.01, ***, p<0.001, and ****, p<0.0001, ns = non-significant, bd = below detection, un = untreated, and +Tb = +100 µg/mL tobramycin. Error bars represent SD.
Figure 4—figure supplement 2
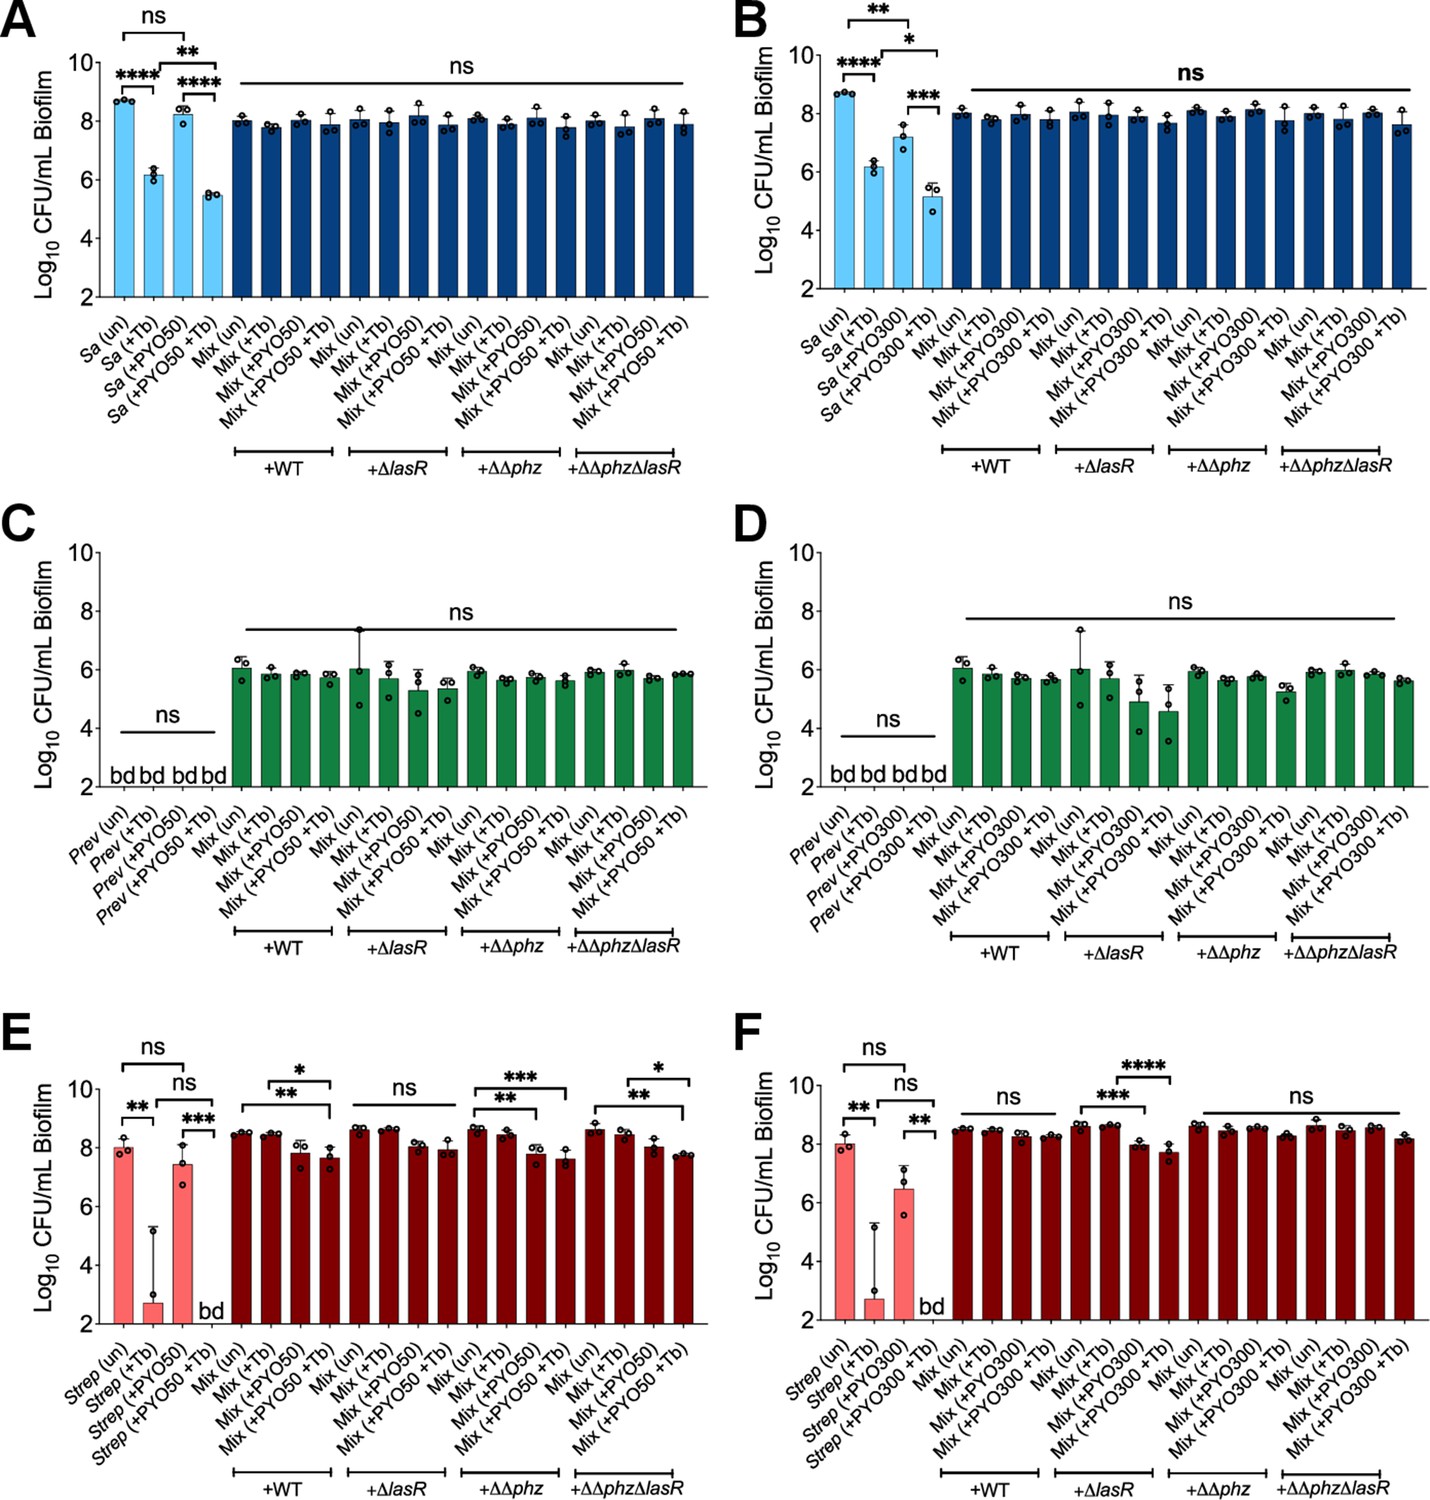
Impact of phenazine on community members treated with tobramycin: added phenazines and P. aeruginosa mutants do not impact other community members.
Colony forming units (CFUs) counts of S. aureus (Sa), S. sanguinis (Strep), and P. melaninogenica (Prev) grown as monoculture (light color) or mixed biofilm communities (dark color) co-cultivated with P. aeruginosa (wild-type [WT]) and associated mutants treated with tobramycin and (A, C, and E) 50 µM (+PYO50) or (B, D, and F) 300 µM (+PYO300) of phenazine. Each data point presented in a column represents the average from at least three technical replicates performed at least on three different days (n=3). Statistical analysis was performed using ordinary one-way ANOVA and Tukey’s multiple comparisons posttest with *, p<0.05, **, p<0.01, ***, p<0.001, and ****, p<0.0001; ns = non-significant, bd = below detection, un = untreated, and + Tb = +100 µg/mL tobramycin. Error bars represent SD.
Additional files
-
Supplementary file 1
Minimal bactericidal concentration (MBC) of P. aeruginosa PA14 planktonic and biofilm cells treated with tobramycin exposed to the following conditions for 24 hr.
- https://cdn.elifesciences.org/articles/81604/elife-81604-supp1-v3.docx
-
Supplementary file 2
Strains and plasmids used in the study.
- https://cdn.elifesciences.org/articles/81604/elife-81604-supp2-v3.docx
-
Supplementary file 3
Species abundances in community types used for in silico modeling of metabolic flux.
- https://cdn.elifesciences.org/articles/81604/elife-81604-supp3-v3.docx
-
MDAR checklist
- https://cdn.elifesciences.org/articles/81604/elife-81604-mdarchecklist1-v3.pdf
-
Source code 1
‘R’ script code used (i) to determine the abundance and prevalence data presented in Figure 1A, (ii) to determine the number of persons with cystic fibrosis (pwCF) for which >70% of 16S rRNA gene reads were assigned to Pseudomonas, Staphylococcus, Streptococcus, and Prevotella (Figure 1B) and Pseudomonas, Staphylococcus, Streptococcus, and Prevotella with Burkholderia or Achromobacter (Figure 1—figure supplement 1B, C), and (iii) to determine the microbial composition range of in vivo cystic fibrosis (CF) mixed communities compared with the in vitro model (Figure 1—figure supplement 4A).
The 16S rRNA raw data published in Hampton et al., 2021 was used with Source Code 1.
- https://cdn.elifesciences.org/articles/81604/elife-81604-code1-v3.zip
-
Source code 2
SteadyCom (Chan et al., 2017) script used to determine predicted metabolic fluxes between P. aeruginosa, S. sanguinis, S. aureus, and P. melaninogenica for the P. aeruginosa-dominated (Pa.D), Streptococcus-dominated (Strep.D), and the Pa.M1/M2 mixed communities using the 16S rRNA relative abundances available in Hampton et al., 2021. Code used to generate Figure 1—figure supplement 1A.
- https://cdn.elifesciences.org/articles/81604/elife-81604-code2-v3.zip
Download links
A two-part list of links to download the article, or parts of the article, in various formats.
Downloads (link to download the article as PDF)
Open citations (links to open the citations from this article in various online reference manager services)
Cite this article (links to download the citations from this article in formats compatible with various reference manager tools)
Community composition shapes microbial-specific phenotypes in a cystic fibrosis polymicrobial model system
eLife 12:e81604.
https://doi.org/10.7554/eLife.81604


